Article

Sustainability Assessment for the Protected Area Tourism System from the Perspective of Ecological-Economic-Social Coordinated Development

1
Institute of Geographic Sciences and Natural Resources Research, Chinese Academy of Sciences, Beijing 100101, China
2
University of Chinese Academy of Sciences, Beijing 101408, China
*
Author to whom correspondence should be addressed.
Forests 2023, 14(5), 890; https://doi.org/10.3390/f14050890
Submission received: 30 March 2023 / Revised: 14 April 2023 / Accepted: 21 April 2023 / Published: 26 April 2023
(This article belongs to the Special Issue Forest Ecosystem Services and Landscape Design)

Abstract

:
Tourism is a significant way for the public to enjoy the cultural ecosystem services provided by protected areas (PAs). However, with PAs being expected to make much wider ecological, social and economic contributions to sustainability and human well-being, PA managers face challenges in coordinating tourism with other goals, such as ecological conservation and local community development. To address this challenge, we developed a sustainability assessment framework that considers the PA, local community, and tourism as a complex system comprising social, economic, and ecological subsystems from the perspective of subsystem relationships. The coupling coordination degree model and the obstacle degree model were applied to assess sustainability of the tourism system in Qinghai Lake Nature Reserve of China. The assessment results indicate that the sustainability index fluctuated between 2010 and 2019, but generally exhibited an upward trend, undergoing three stages and reaching the stage in 2019 where ecological sustainability took the lead. At this stage, the coupling coordination degree between the economy and society subsystems was at its lowest, and the economic subsystem faced the highest obstacle degree. The study demonstrates that involving scholars and administrators in the index selection process and considering both index information and management concerns when determining index weight makes the coupling coordination degree model more suitable for PA tourism systems. The assessment method developed in this study effectively reflects the temporal evolution of PA tourism system sustainability and provides valuable implications for coordinated ecological-economic-social management by analyzing obstacle factors.

1. Introduction

Protected areas (PAs) provide a most important and effective way to protect global biodiversity and ecological environments and contribute to human health and well-being [1,2,3]. Declining financial support for PAs in developing countries and even in some developed ones, such as Australia, the US and Canada, suggests that developing PAs by solely relying on government inputs is unsustainable [4]. Nature-based tourism is a popular type of cultural ecosystem service that can enhance the emotional connection between human beings and nature and contribute to the financial sustainability of PAs [5,6,7,8]. It is estimated that the annual tourist arrivals at the world’s PAs reach 8 billion [9], and that the economic value of PAs derived from the improved mental health of visitors is US$6 trillion a year [10]. The wider benefits of park visits have not been quantified [11]. However, with PAs being expected to make much wider ecological, social and economic contributions to sustainability and human well-being, PA managers face challenges in coordinating tourism with other goals, such as nature conservation and local community development [4,12,13]. Therefore, both the International Union for Conservation of Nature (IUCN) and World Tourism Organization (WTO) emphasize the importance of sustainability assessment and adaptive management of tourism in PAs, so as to bring into full play the role of tourism in poverty reduction, community development and biodiversity conservation [14,15].
PAs, as important nature-based tourism destinations, are complex adaptive systems that involve multiple stakeholders and are affected by social, economic and environmental factors [16,17,18,19,20]. Increasingly, the PA, the local community and the tourism within the PA are being recognized a complex system [21,22]. The significant impact of COVID-19 on PA tourism highlights the complex interdependencies among tourism, local communities and PAs, and such interdependencies should not be overlooked when seeking to improve PA sustainability [23,24]. A systematic way of thinking is therefore proposed to understand the interaction of key elements, the evolution of systems, and the assessment and management of PAs and local tourism [18,25]. Furthermore, Zhang et al. (2022) indicate that the interrelationships between subsystems provide an important and effective perspective for sustainability assessment of the PA tourism system [26].
Plummer and Fennell (2009) argued that sustainable tourism management in PAs should anticipate system dynamics and transformative changes [27]. However, traditional assessment methods tend to use sustainability indicators targeting current conditions and poor selection of the indicators often leads to the misidentification and misinterpretation of the changes over time. Research on systematic thinking suggested that future conditions may include more extreme and rapid changes than previously [21]. In addition, although previous studies have proposed many indicators on the sustainability of tourism in PAs, they have paid less attention to the coordination among subsystems [26]. Therefore, new methods acknowledging uncertainties, changes and frequent interactions of the subsystems are required.
The coupling coordination degree model (CCDD) is an effective method used to evaluate the consistency and positive interaction among systems, and can reflect the trend of complex systems transforming from disorder to order [28]. In recent years, it has been extensively used in studies on the relationship between tourism and other systems and among components of the tourism system, such as tourism and environment [29,30,31], and the social-ecological status of island tourism destinations [32]. These studies reveal the importance and applicability of a coupled coordination perspective in measuring complex tourism systems. But they mostly focus on city (prefectural), provincial and national scales, and smaller scale studies represented by PAs are limited. In addition, since the current indicators for the CCDD are generally selected by authors [29,30,33], with other experts or stakeholders seldom engaged, the availability of comparable data and information and the objectivity of the assessment results are inevitably undermined. As the WTO (2004) noted, a participatory process can be productive, especially when key stakeholders and potential data providers are involved [14].
The Tibetan Plateau is widely recognized for its abundant biodiversity and diverse ecosystems, which are intricately linked to the livelihoods of over one billion people [34]. To safeguard the rich flora and fauna in this region, numerous PAs have been established, many of which are renowned tourist destinations [35,36]. The Qinghai Lake Nature Reserve (QLNR) is a typical example of these PAs. Given the vulnerable ecology and underdeveloped economy of the Tibetan Plateau, tourism in these PAs is expected to play a greater role in poverty reduction, community prosperity and biodiversity conservation. Thus, coordinated ecological-economic-social development is not only essential for the sustainability of each PA but also of paramount importance for realizing the United Nations Sustainable Development Goals and, specifically, for promoting green development on the Tibetan Plateau [37].
Due to the gaps identified in both practical management and theoretical assessment methods in PA tourism, this study aims to enhance the sustainability of PA tourism by focusing on subsystem relationships using the CCDD. To achieve this goal, three sub-aims have been identified: (1) improving the applicability of CCDD to the PA tourism system and enhancing the objectivity of indicator selection, (2) evaluating subsystem relationships and their changes in the PA tourism system, and (3) identifying obstacles to the sustainable development of PA tourism.

2. Materials and Methods

2.1. The Assessment Framework
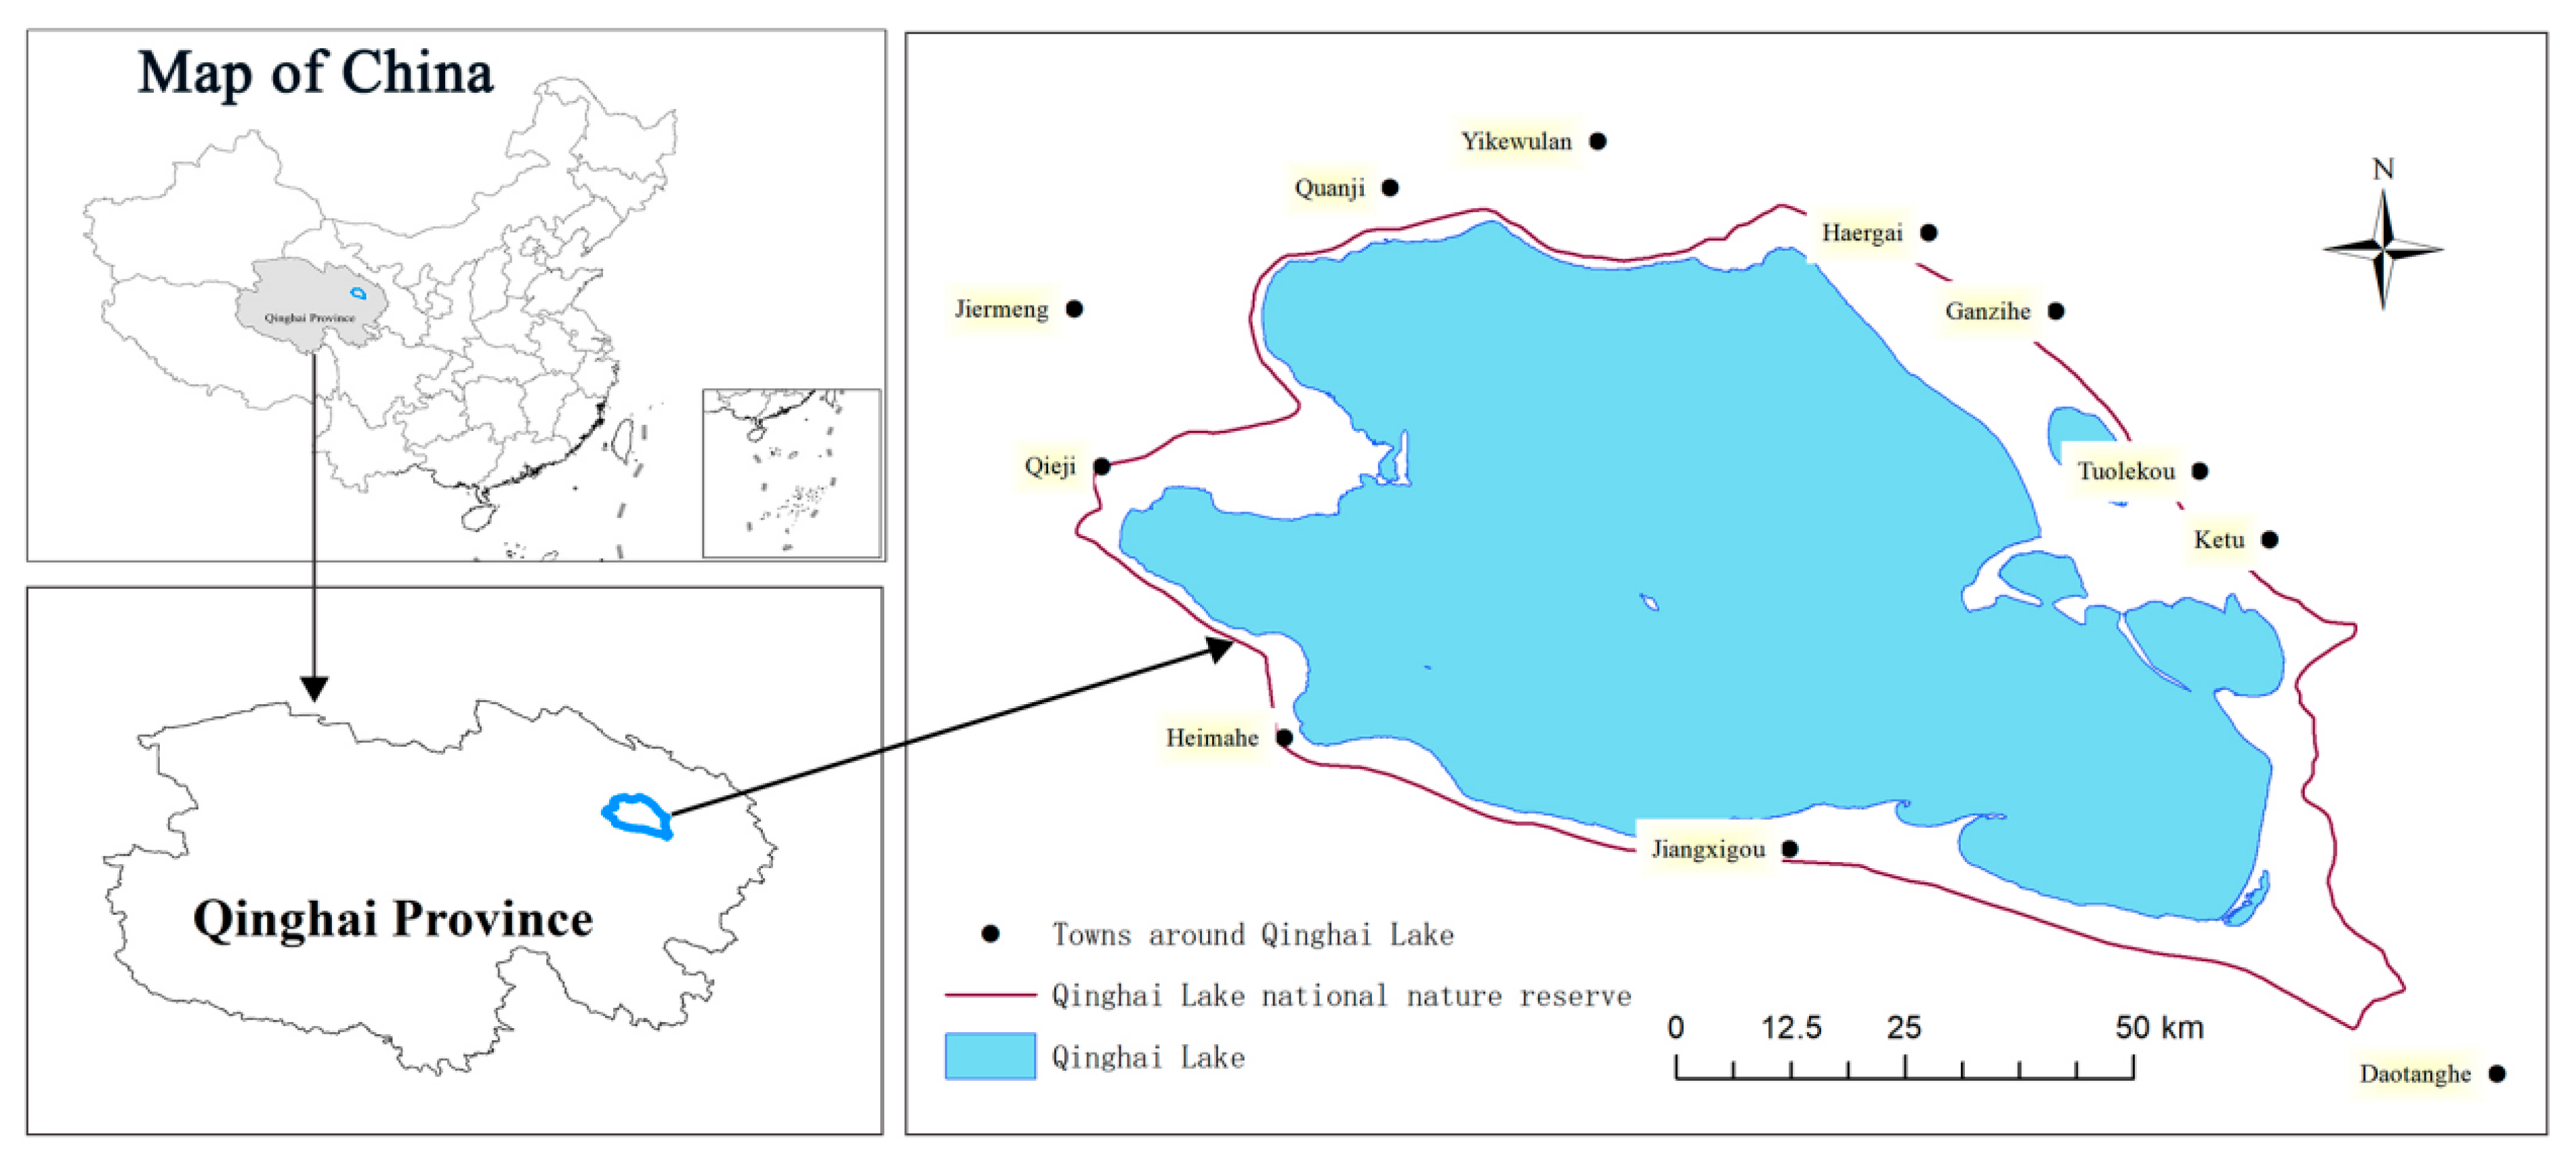
A growing body of research conceptualizes tourism as a complex adaptive system [21,38,39] or calls for systematic thinking in the conceptualization of the relationships among tourism, PAs, and the local communities [40,41]. Stone et al. (2021) believed that without clear identification of interacting variables, any study on PAs and tourism will reveal an incomplete and potentially confusing picture, as the complex interactions between system components will not be apparent [42]. Schianetz and Kavanagh (2008) also pointed out that systematic thinking is critical for assessing the sustainability of natural tourist destinations located in eco-environmentally fragile areas [25].
Sustainability indicators can provide managers with required information and are essential for improving tourism planning and management and promoting sustainable development [14,43]. Scholars have developed a series of indicators from one or more dimensions of ecology, economy and society to evaluate the sustainability of different scales and different types of tourism destinations [44,45,46,47]. However, more attention is paid to the sustainability of the ecological, social and economic dimensions themselves, and less to the relationship among the three [26]. In practical terms, the three dimensions are “pillars” of sustainable development with frequent interaction, and a balance must be struck between them [43]. For Bramwell and Lane (2011), the “balance” of economic, social and environmental sustainability is the cornerstone of sustainable tourism policies [48]. Systematic thinking makes it possible to analyze the relationship among the three dimensions.
We define the PA, local community and tourism within the PA as a complex adaptive system composed of the three subsystems of society, economy and ecology. The economic subsystem mainly includes tourism-related economic factors within and around the PA, such as tourism revenue and tourist arrivals. The social subsystem mainly encompasses social and cultural factors within the PA and the adjacent communities, such as community participation, cultural preservation, and environmental education. The ecological subsystem mainly consists of natural elements within and around the PA, such as environmental quality and biodiversity conservation. The three subsystems frequently interact with one another through the flow of capital, information, and tourists, among other factors, and this encourages the system to evolve. In order to assess the PA tourism from the perspective of ecological–economic–social coordinated development, this study calculates the coupling coordination degree among the subsystems based on sustainability evaluation (Figure 1). The evaluation covers two parts. The first is the sustainability of the subsystems, which includes the sustainability of the social, economic, and ecological subsystems. The social sustainability index, economic sustainability index, and ecological sustainability index are the three names given to the evaluation outcomes, accordingly. The second part of the evaluation concerns the coupling coordination degree among the subsystems, including the comprehensive coupling coordination degree of the three subsystems, and the coupling coordination degree between each pair of subsystems.

2.2. Study Area

QLNR is located in the Qinghai Province, northwest of China (Figure 2). Qinghai Lake, the most important tourist attraction of the PA, is the largest saline lake of China and a well-known tourist destination on the Tibetan Plateau. Furthermore, many people have lived by the lake for generations. Nature conservation, community prosperity, and sustainable tourism are three inseparable management objectives for QLNR [49]. The following are the reasons why we chose this reserve as a case study to assess the relationship between economic, social, and ecological subsystems of the PA tourism system.
First, Qinghai Lake is an important node of two international bird migration channels in East Asia and Central Asia and also the only habitat of the Przewalski’s gazelle [50]. It was recognized as a “Wetland of International Importance” by the Ramsar Convention in 1992. However, the monitoring results of 25 largest lakes in the world from 2008 to 2010 by United Nations Environment Programme (UNEP) showed that the load of human activities in Qinghai Lake had reached 90% [51].
Second, Qinghai Lake has been a popular nature-based tourist destination since the 1980s. In 2019, it received 4.43 million tourists. According to estimates by Zhao (2018) [52], the per capita ecological deficit relating to tourists in Qinghai Lake showed an overall rising trend, and tourist overload was common from 2001 to 2015. In 2017, in response to the central government of China’s environmental inspection, which aimed to supervise and enforce local-level environmental protection policies, several scenic spots were closed, and numerous tourist facilities, including tents and bed and breakfasts, were demolished within and around the QLNR for non-compliance with PA management regulations. As a result, the duration of visitor stays within or around the reserve decreased, and the number of overnight stays also declined.
Third, similar to most Chinese PAs, QLNR is home to many local people whose livelihoods and lives are closely linked to the reserve and its tourism development. There are 11 towns around the reserve with 5870 residents and 76.55 km2 farmlands in the reserve. The establishment of the PA restricted local residents’ activities such as grazing and planting and others that depend on natural resources. In order to supplement their income, many local residents have resorted to selling tourist souvenirs and taking on part-time jobs in nearby hotels and restaurants. Some individuals have even illegally opened access routes to the reserve and established small tourist attractions, offering paid services such as canola flower sightseeing, horse riding, and photography. However, managing these community residents poses significant challenges, and sometimes conflicts arise between the community and the authorities. The potential impacts of these changes in livelihoods on community resilience remain unclear.

2.3. Index System

Establishing the index system proceeded via the two key steps of selecting indicators and determining their weights. The process can be seen in the flow chart for index system establishment (Figure 3).

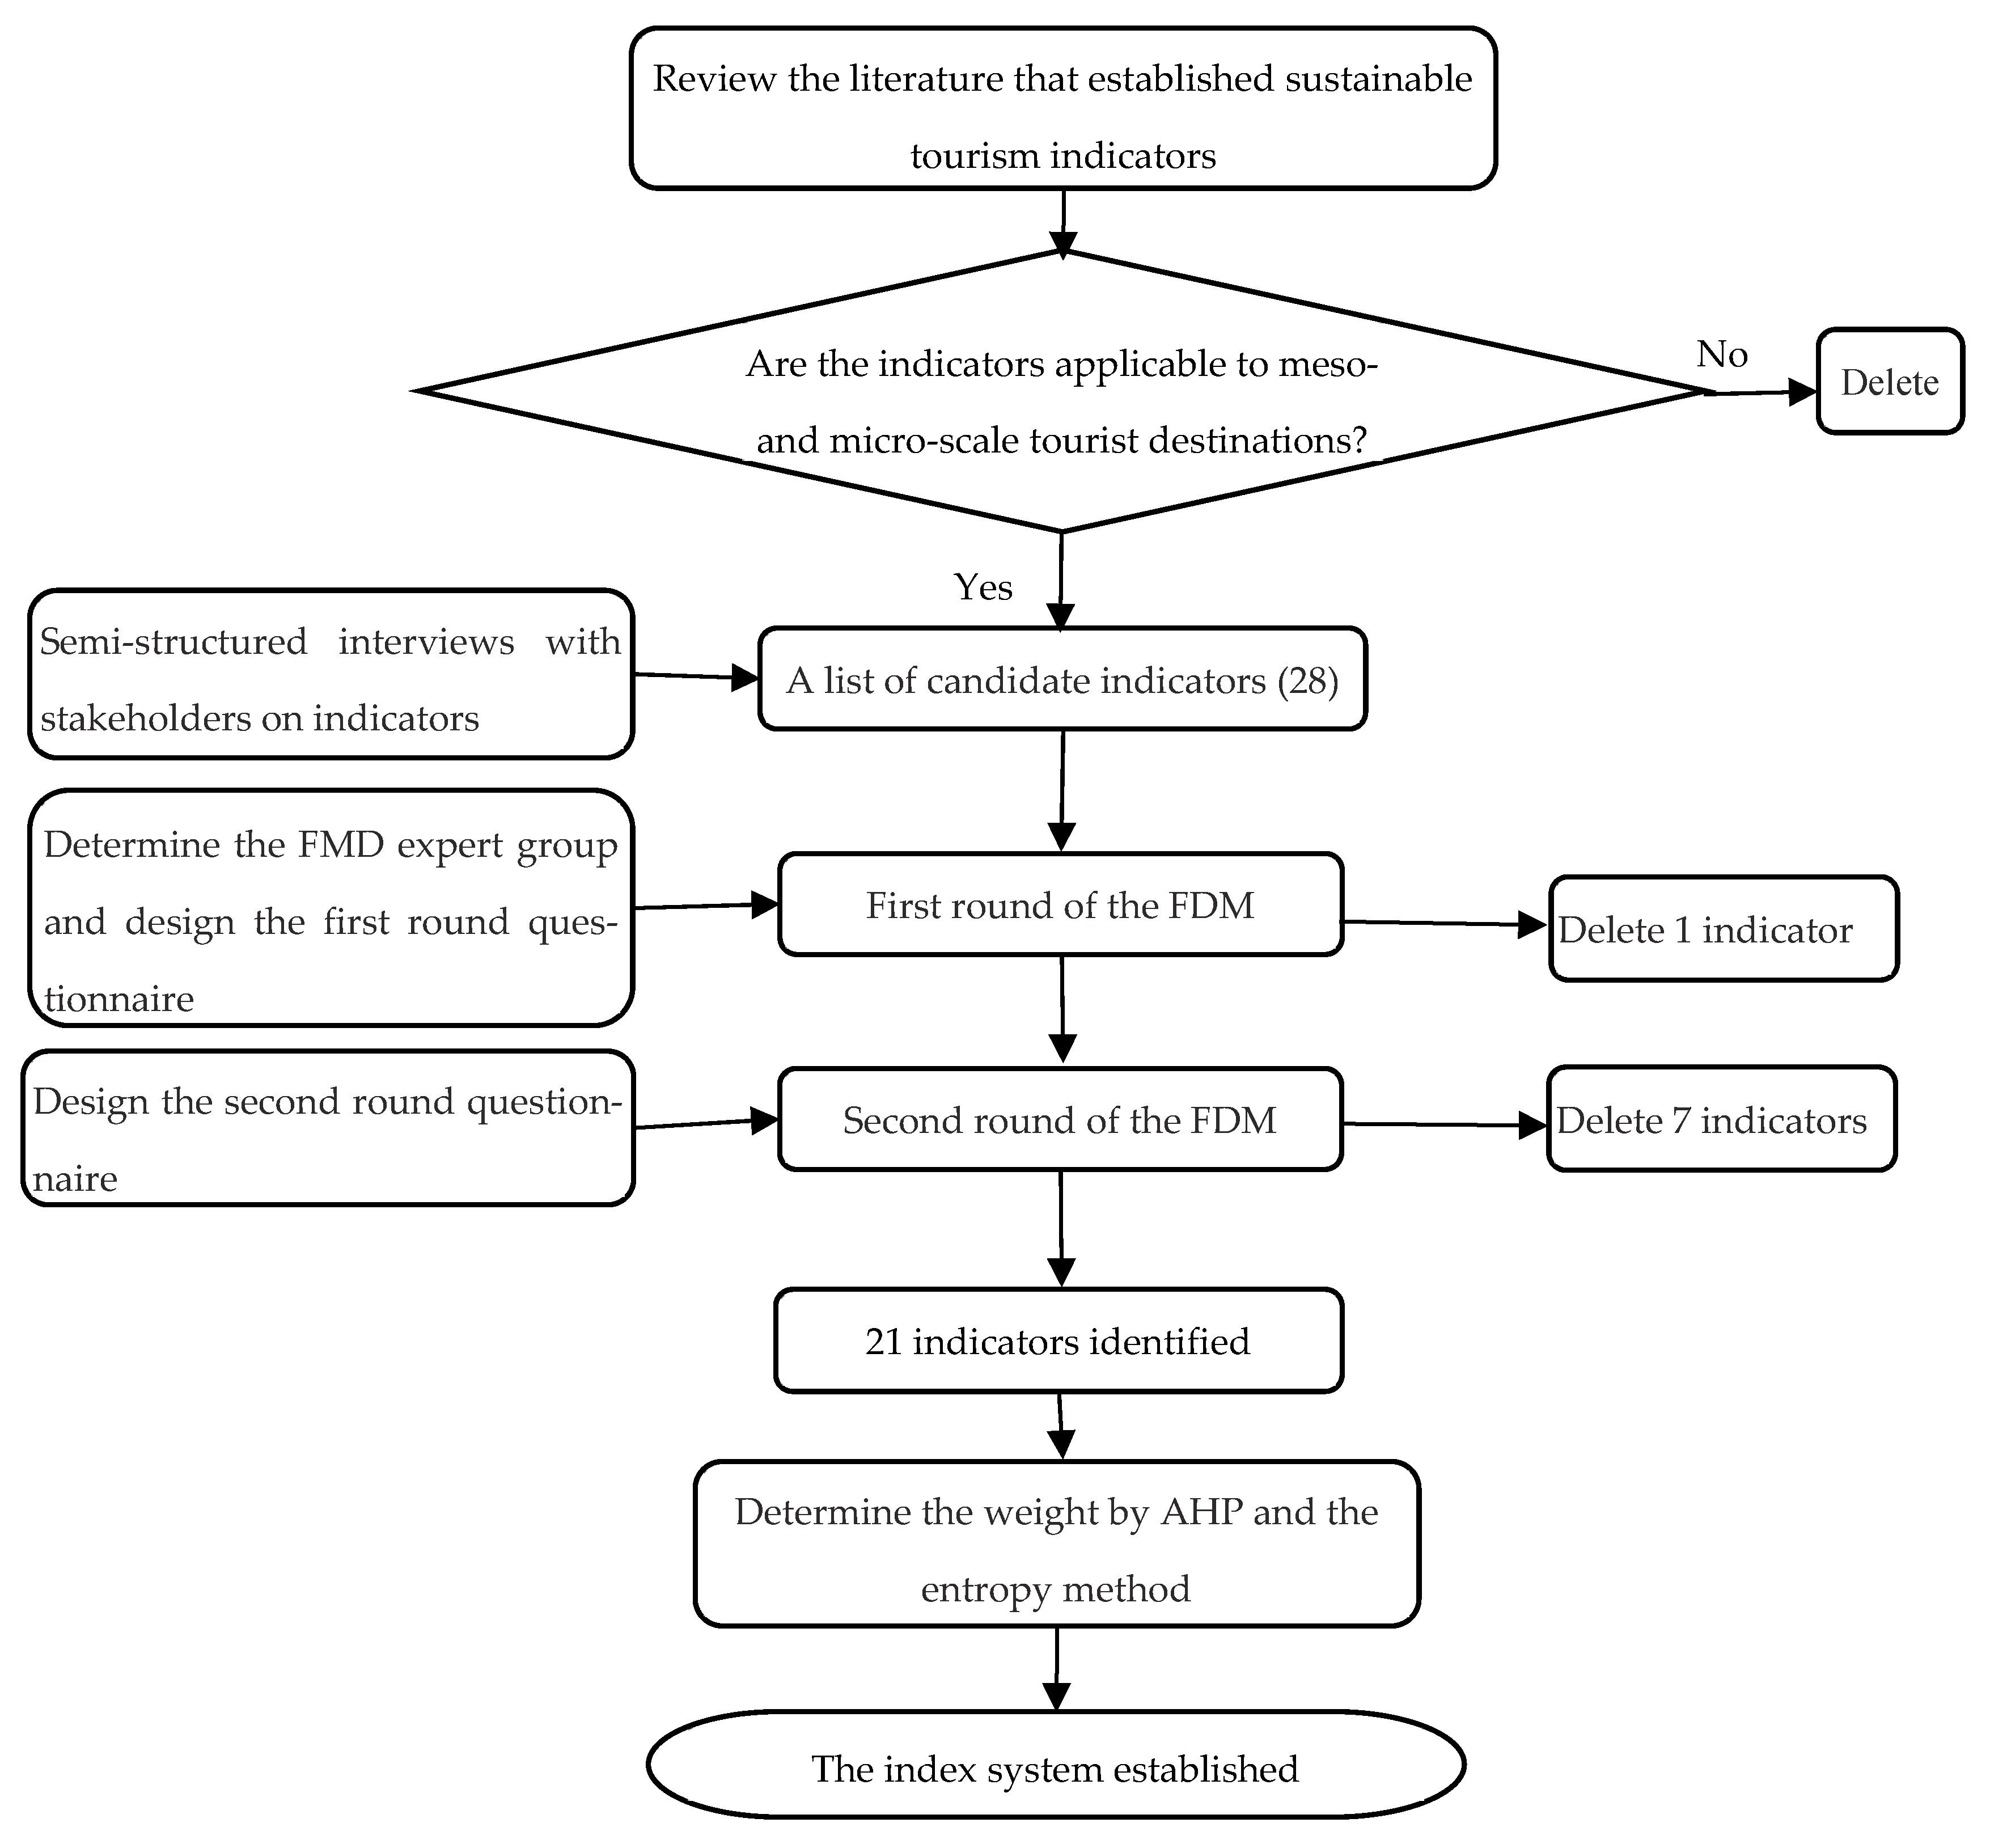
2.3.1. Selection of Indicators

This paper adopted the fuzzy Delphi method (FDM) to select indicators. The Delphi method is commonly used to select sustainability indicators, but its uncertainty, vagueness and subjectivity need be addressed [53]. The FDM applies fuzzy set theory to the Delphi method, which overcomes the shortcomings by reducing the number of questionnaire surveys, avoiding the distortion of individual expert opinions, and considering the fuzziness of the interview process [54]. The FDM with a dual-trigonometric fuzzy function especially uses a trigonometric fuzzy function and the grey zone testing method to integrate expert opinions, which is more objective than the calculation of geometric means [55]. Hence, this paper adopted the FDM with a dual-trigonometric fuzzy function to select sustainability indicators, and the process was as follows.
  • Step 1: Making a list of candidate indicators
Following the principles of practicality, comparability, objectivity and data availability, 28 candidate indicators were generated by referring to the current literature [14,54,56,57,58,59,60,61] and conducting semi-structured interviews with tourism stakeholders in QLNR (administrators, community residents and tourists).
2.
Step 2: Establishment of the fuzzy Delphi expert group and questionnaire survey
The key to the Delphi method lies in the expertise of experts assigned and their familiarity with the subject matter, rather than the number of experts [53]. Saaty and Özdemir (2014) held that adding more experts who are less experienced may disturb the judgments of other experts and even lead to false conclusions [62]. Accordingly, 15 administrators and researchers familiar with tourism in PAs and having at least five years’ professional experience in the related sectors were invited to fill in the expert questionnaire from June to July, 2020. Eliminating invalid questionnaires with obvious missing answers or no discrimination of scores (e.g., 10 for all the maximum values and 0 for all the minimum values), eight valid responses were considered. As revealed in Table 1, the experts were equally distributed among researchers on PA tourism (3), administrators of tourism in QLNR (2) and administrators for PA tourism at provincial or national level (3), and were thus representative.
3.
Step 3: Index selection
After two rounds of fuzzy Delphi questionnaire surveys, 21 indicators were generated in total (Table 2). The questionnaire and its data analysis process can be seen in Appendix A and Appendix B. Though no academic consensus on the number of sustainability indicators has been reached, the WTO (2004) pointed out after the summarization of global practice that 12–24 indicators are optimal, as an excessively large number of indicators may drive up the cost of data acquisition and be difficult to use, while use of only a few indicators tends to overlook economic, ecological or social issues. By this standard, the number of indicators in this paper is suitable [14].

2.3.2. Calculation of Weights

Index data need to be standardized before weights are calculated. Formulas (1) and (2) were used to standardize the original data for a positive index
x i j = x i j min 1 j n x i j max 1 j n x i j min 1 j n x i j  
and for a negative index
x i j = max 1 j n x i j x i j max 1 j n x i j min 1 j n x i j    
where,  x i j  and  x i j , respectively, refer to the original value and the standardized value of indicator j in year i;  max 1 j n x i j  and  min 1 j n x i j  are the maximum and minimum value of indicator j among all years (2010–2019). An  x i j  whose standardized result is 0 is replaced by 0.0001 to avoid null value in the subsequent calculation with the entropy method (EM).
The analytic hierarchy process (AHP) is a common method to obtain the weight of sustainability indicators in the form of hierarchical data combined with experts’ opinions [53,54]. It provides a way to systematize the complex issues of PA tourism with the advantage of being easy to operate and accommodating the views of different stakeholders [63]. This study used AHP to divide the indicator system into three hierarchical levels (Table 3), established the pairwise comparison matrix for each level, and invited the experts to compare each level of indicators pairwise on a scale of 1 to 9. Saaty and Özdemir (2014) found that in the use of AHP, engagement of no more than 7 or 8 experts is more likely to make for effective and consistent judgments [62]. The eight experts in Table 1 were therefore invited to participate, and seven of them eventually completed the expert questionnaire. Yaahp was used to process the AHP questionnaire data, using calculation and consistency checks to obtain the indicator weight  w j .
The EM is commonly used to objectively calculate weights. Entropy is a measure of the uncertainty of indicator information. If the amount of information is higher, the uncertainty is lower and the entropy is smaller; if the amount of information is lower, the uncertainty is higher and the entropy is larger. Tang (2015) stated that the EM can avoid bias caused by subjective influence to a certain extent when determining the index weights by analyzing correlation degree and information among indexes [29]. The formulas are shown from (3) to (5).
y i j = x i j / i = 1 m x i j
d j = 1 + 1 l n m i = 1 m y i j l n y i j
w j = d j i = 1 m d j
In order to reduce the subjectivity of the AHP weight and make the assessment results more reliable, Formula (6) was used in combination of the EM and AHP weight to get the general weight  w j . The results are shown in Table 3.
w j = W j + W j 2

2.4. Data and Analysis Methods

2.4.1. Data

The indicator data on the ecology subsystem and the economy subsystem for the sustainability assessment were sourced from the Qinghai Lake Protection and Utilization Administration of Qinghai Province, mainly including the Monitoring Report on the National Nature Reserve of Qinghai Lake (2010–2019) and statistics on number of tourists and tourism income over the years. Data on social subsystem indicators and some of the local economic development indicators were obtained from China Statistical Yearbook (County-level) and China Statistical Yearbook (Township) from 2010–2019.

2.4.2. Coupling Coordination degree Model

Suppose  x 1 , x 2 , x 3 x n  are the indicators of the economy subsystem and x is the corresponding standardized value of  x , then the economic sustainability index is  f 1 x  =  i = 1 n w i x i . wi represents the weight of indicator i in the economy subsystem. Similarly, the social sustainability index and the ecological sustainability index are  f 2 x  and  f 3 x , respectively.
The coupling coordination degree among the subsystems was calculated using formulas (7) to (9).
C = f 1 x × f 2 x f n x / f 1 x + f 2 x f n x n n
T = γ 1 f 1 x + γ 2 f 2 x γ n f n x  
D = C × T
where C represents the coupling degree, D represents the coupling coordination degree,  γ  is the weight coefficient of the corresponding subsystem, n is the number of subsystems. In the case of n = 3, T stands for the comprehensive sustainability index of the PA tourism system. By referring to the existing body of research [33,64,65], this paper defines the gradation criteria of the coupling degree and the coupling coordination degree, as shown in Table 4.

2.4.3. Obstacle Degree Model

We used the obstacle degree model to identify obstacle factors of the tourism system in QLNR. The formulas are as follows [66]:
I ij = 1 x ij
O j = F j I ij   / j = 1 n F j I ij  
Q j = O j
where x’ij is the standardized value of indicator j in year i, Iij represents the deviation degree of indicator j, Fj is the contribution degree of indicator j, which can be expressed by index weight, Oj represents the obstacle degree of indicator j, Qj represents the obstacle degree of a subsystem.

3. Results and Discussion

3.1. Indicators and Weights

As shown in Table 3, the indicator system aligns with the sustainable tourism management principles for PAs put forward by IUCN, including indicators on nature conservation, communities’ right to development and cultural authenticity, continuous and fair development of the tourism economy and provision of valuable recreational experience [15]. These principles also echo the functional orientation of China’s PA system, which aims to protect nature, provide high-quality ecological products, and maintain harmonious coexistence between humans and nature for sustainable development [67]. Specifically, in the economy subsystem, A1 and A2 have the same weight, indicating that both economic growth and economic efficiency are critical for economic development. In the society subsystem, nature education is the most important, with the sum of the weights of the three indicators, namely environmental interpretation facility (B31), environmental interpreters (B32) and capital input on nature education (B33), accounting for 65.50% of the whole subsystem. This reflects the importance of nature education for tourism in PAs in serving social functions. In the ecology subsystem, C2 exerts the greatest influence, accounting for 66.35% of the entire subsystem. More specifically, protection of key species (C22) was given the highest weight with AHP, occupying 59.10% of the ecology subsystem. Thus, the biodiversity conservation represented by key species is the most important factor for the ecology subsystem.
There is little difference in the weights of the three subsystems. The result that the ecology subsystem has the highest weight is consistent with the study by Yu (2006) in Tianmu Mountain Nature Reserve, which observed the principle of ecological conservation coming first [57]. What is different is that in the present study, the society subsystem carries more weight than the economy subsystem. Given the management objectives of promoting local development and ecological and cultural protection for PAs, we believe it rational to pay greater attention to social and cultural factors of Chinese PAs for two reasons. First, as many communities live in and around PAs in China, it is critical for sustainable tourism management in PAs to reduce conflicts between PAs and communities and win over the community support [68,69]. Second, unlike the western world’s immersion in wilderness aesthetics, Chinese tourists uphold the traditional culture that the human is an integral part of nature and prefer landscapes with man and nature coexisting in harmony [70]. Cultural factors constitute one of the great appeals of tourism in PAs.
According to the analysis methods and their computational formulas in this study, it is evident that the weighting of indicators not only directly affects the sustainability index, but also influences the results of coupling coordination degree and obstacle degree calculations. Therefore, the method chosen for determining indicator weights is of great importance. As indicated in Table 3, it is observed that the weights of certain indicators differ significantly when obtained using the AHP compared to the EM. Some indicators are regarded as important by experts and thus heavily weighted, but offer limited information, such as A21, C21 and C22. For these indicators, weighting with the EM alone will not be able to reflect the importance of the indicators in practice. In contrast, some other indicators, such as B31, B32 and B33, which showed rapid changes in the study period, will be neglected if only weighted with the AHP. Therefore, it is appropriate and necessary to combine both methods in an indicator system reflecting the temporal changes.

3.2. Coupling Coordination Degree and the System Evolution

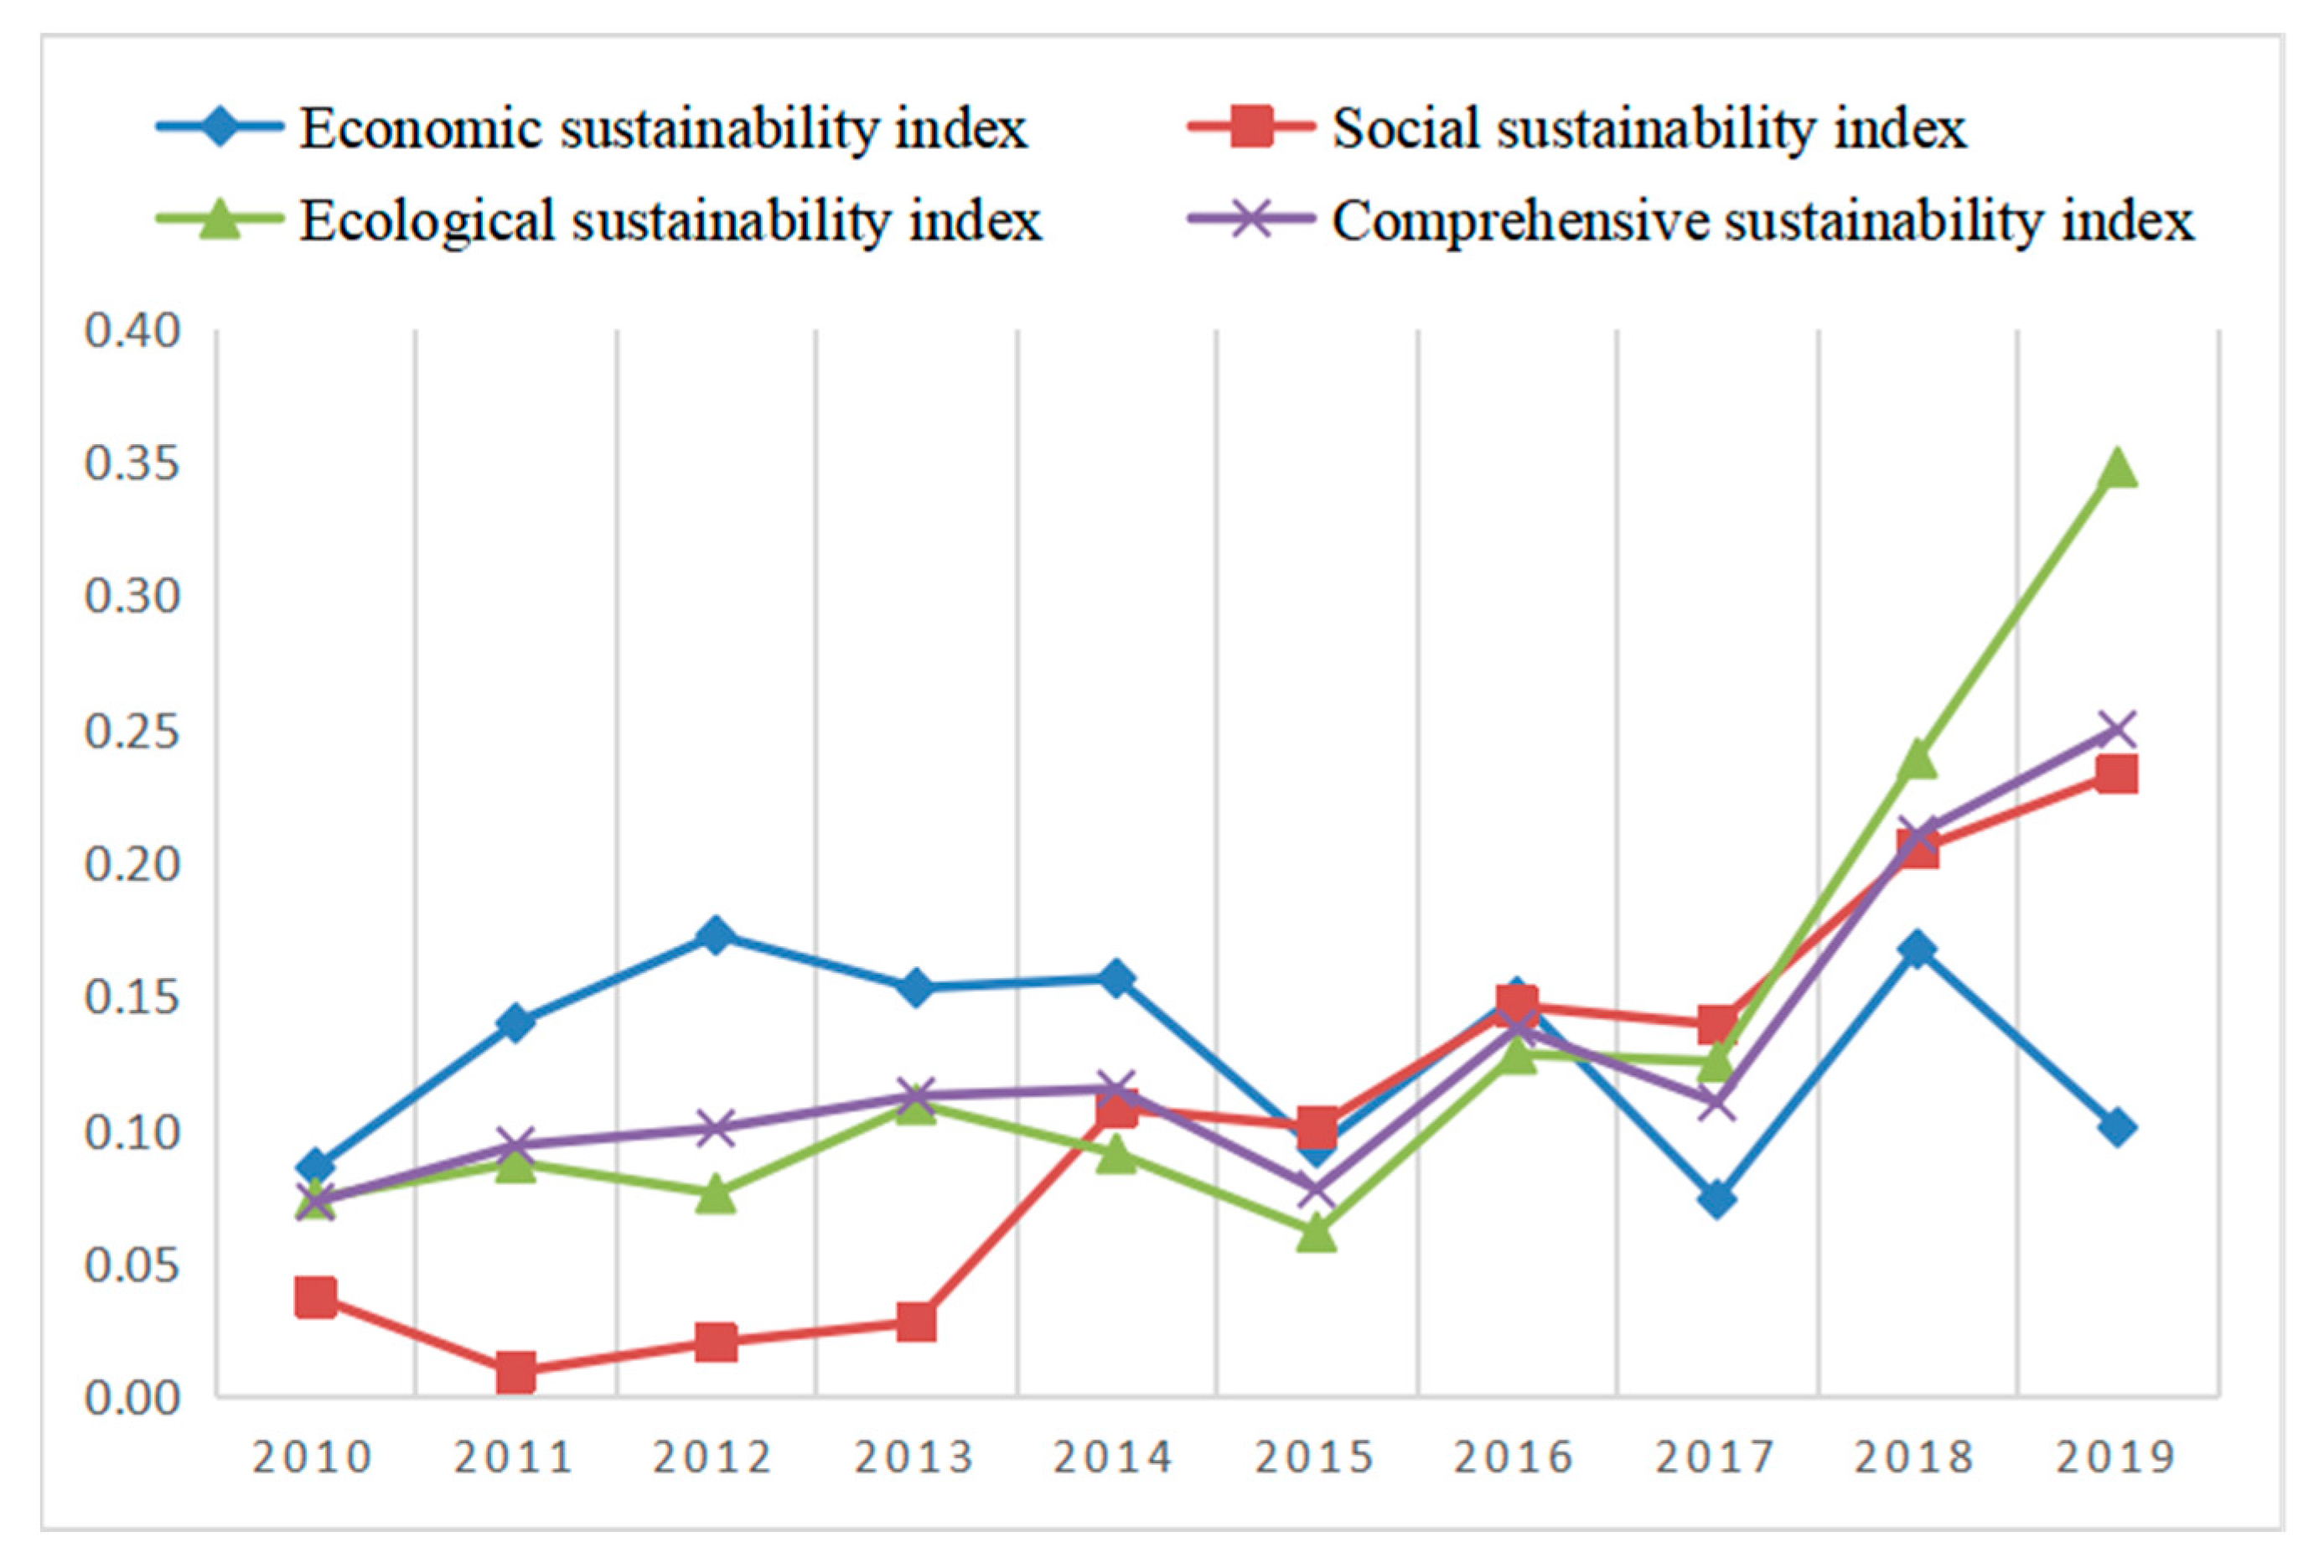
3.2.1. Sustainability Index

As shown in Figure 4, the sustainability index of QLNR tourism system and its subsystems fluctuated in 2010–2019, but generally trended upwards. The social sustainability index was at its lowest level in the three subsystems between 2010 and 2013, but has since maintained a steady upward trend overall since 2014. After 2017, it began to surpass the economic sustainability index. The ecological sustainability index exhibited fluctuations during the period between 2010 and 2016, but experienced a rapid increase after 2017, reaching a 10-year peak in 2019. The economic sustainability index continued to fluctuate over the decade and approached its lowest level in 2017. The gap in the sustainability index between the economic subsystem and the ecological subsystem widened further and further after 2017.

3.2.2. Coupling Degree

As revealed in Table 5, from 2010 to 2019, the comprehensive coupling degree among the three subsystems and the coupling degree between each pair of subsystems was averaged at 0.8 to 1.0, a “superiorly high” coupling level. It means the three subsystems were closely connected and frequently interacted with each other.

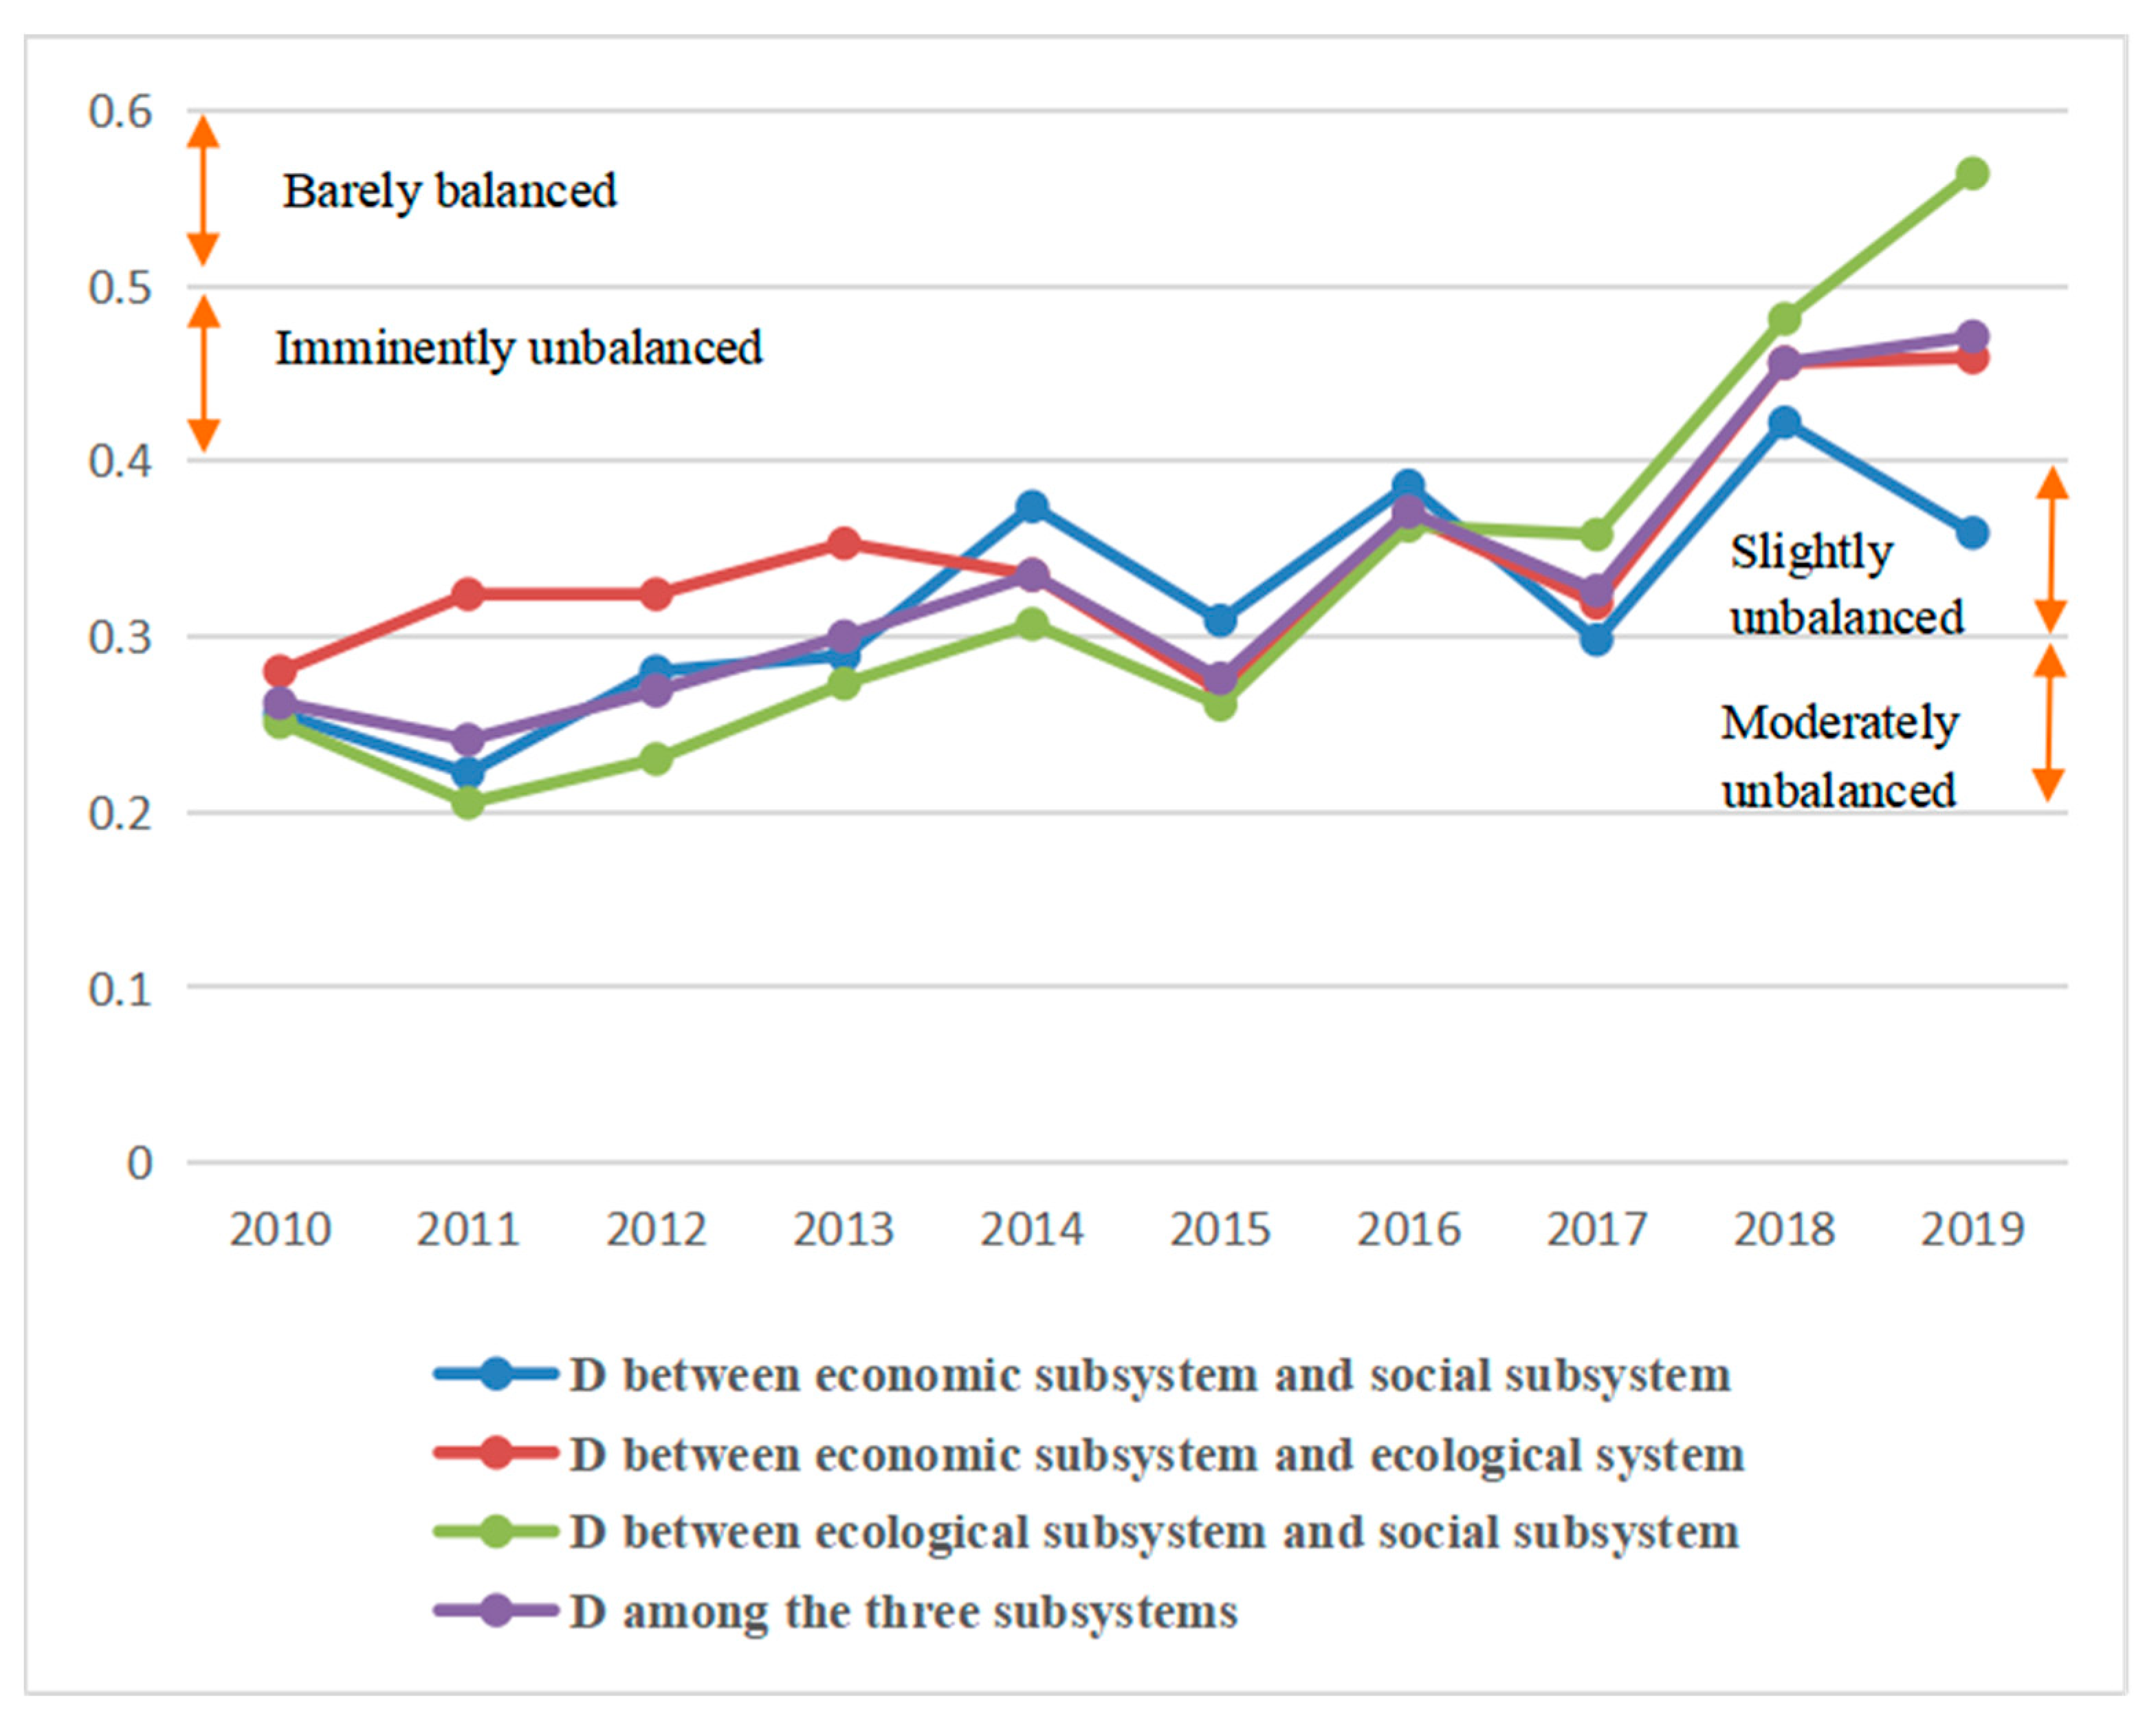
3.2.3. Coupling Coordination Degree

According to Figure 5, from 2010 to 2019, the comprehensive coupling coordination degree among the three subsystems and the coupling coordination degree between each pair of subsystems showed an overall upward trend, but the coordination level remained unbalanced until 2019. Only the coupling coordination degree between the society subsystem and ecology subsystem reached the “barely balanced” level in 2019, the highest score in a decade. Specifically, the coupling coordination degree between the ecological subsystem and the social subsystem remained at the lowest level before 2016. However, it rapidly increased thereafter and reached the best-coordinated level among the four groups. On the other hand, the coupling coordination degree between the economic and social subsystems significantly decreased after 2016, becoming the worst-coordinated level among them.

3.2.4. Stages of the System Evolution

Combination of the evaluation results of the subsystem sustainability index and the coupling coordination degree shows that the tourism system in QLNR evolved across three stages (Table 6). During the first stage (2010–2014), the economy subsystem was leading in development, whereas the society subsystem lagged behind. The relationships between the three subsystems were “moderately unbalanced” in general, with the coupling coordination degree between the society and ecology subsystems being the lowest. During the second stage (2015–2017), the society subsystem took the lead in development, while the ecology subsystem lagged behind. The coupling coordination degree among three subsystems was at the “slightly unbalanced” level, and the coupling coordination degree between the economy and the society subsystems was relatively higher. During the third stage (2018–2019), the ecological sustainability index rose rapidly, while the economic sustainability index declined. The coupling coordination degree between the society and the ecology subsystems was relatively higher, while that between the economy and the society subsystems was the poorest at this stage. Consequently, it is now urgent to improve the development level and efficiency of the economy subsystem and enhance the coupling coordination degree between the economy and the society and ecology subsystems.

3.3. Obstacle Factors for Sustainable Development and Management Implications

The obstacle model can help us identify the obstacle factors for the sustainable development of the system [71]. In order to promote coordinated development among subsystems, we conducted an analysis of the obstacle degree for each subsystem and identified the factors that caused them. Table 7 lists the obstacle degree values and the top three obstacle factors for each subsystem from 2010 to 2019. The social subsystem had the highest obstacle degree during 2010–2013, followed by the ecological subsystem during 2014–2018, and the economic subsystem in 2019. This is roughly consistent in time with the three stages that QLNR tourism system has gone through and explains the main obstacle factors to the system development in each stage. Specifically, over the decade, the most common obstacle factors in the social and ecological subsystems were the three natural education-related indicators (B33, B32, B31), and the wetland area (C11), vegetation coverage area (C12) and key species protection (C22), respectively. In contrast, obstacle factors in the economic subsystem were more dispersed, with the most common indicators being tourism revenue structure (A11) and growth in tourist numbers (A23). In 2019, the economic subsystem posed the greatest obstacle to the sustainable development of the QLNR tourism system. The top three obstacle indicators for achieving sustainable economic development were identified as the per capita tourist consumption level (A12), local economic growth (A21), and the spatial distribution of tourism income (A14).
As revealed by the assessment results, the tourism development in QLNR was in the leading stage of ecological sustainability. However, the coupling coordination degree between the economy and the society subsystems was the lowest, and the economic subsystem had the highest obstacle degree in 2019. Therefore, it is critical to improve the economy development efficiency and enhance the coupling coordination degree between economy and the other two subsystems for sustainability of the whole system.
Upon investigation, the decline in sustainability of the economic subsystem has been attributed to two significant events: the environmental inspection by central government in 2017 and the COVID-19 pandemic since 2019. The former led to a reduction in tourist attractions and reception facilities in and around the QLNR, resulting a change from a tourist destination to a transit point. The latter has caused a sharp decrease in tourists from outside Qinghai Province and a low motivation for tourism consumption within the province. With the aim of promoting the coordinated development of the economy, society, and ecology in Qinghai Lake Nature Reserve as a tourist destination, and based on the assessment of subsystem relationships and identification of obstacle factors, the following management insights can be derived.
Socially, community participation in tourism needs to be strengthened. On the one hand, local communities can engage in farming or herding on a flexible schedule when the PA tourism is suspended, which can alleviate the tourism operation pressure on hiring full-time staff under unexpected situations such as epidemics. On the other hand, local communities can gain knowledge, ability and income through participation that contributes to the goal of PA to promote community prosperity. Meanwhile, as livelihoods become less dependent on natural resource extraction and income increases, conflicts between communities and PA managers are expected to decrease. In addition, as one of the important functions of PAs, nature education, especially in terms of facilities (B31), personnel (B32) and input (B33), requires more attention to enhance ecological awareness among the population and foster emotional connections between people and nature, in order to gain public support for PA efforts.
Ecologically, close attention should be paid to changes in some ecological indicators to reveal the influencing mechanisms of tourism. Restrictions on travel during the pandemic have created an opportunity for natural environmental restoration and less artificial interference with biodiversity [72]. Administrators and researchers can make use of the period to identify the ecological indicators that are most responsive to the weakened disturbance from tourism, such as animals, plants, and water (C12, C13, C13). It is recommended to optimize tourism project planning by considering both the time of opening and spatial layout in light of the tourism-influenced mechanisms. This aims to identify the most favorable time and location for visits in order to mitigate the negative environmental impacts to key protection objects, such as waterbirds, Przewalski’s gazelle, and plants.
Diversified environmentally-friendly tourism projects are suggested to improve the tourism economy efficiency on the premise of ecological conservation. For instance, long-distance birdwatching and sightseeing by bicycle as well as nature education and the Tibetan cultural experience can be designed to prolong the stay of tourists, increase per capita spending (A12), and drive up tourism income from diversified sources. Furthermore, providing information about accommodations in nearby towns or partnering with local lodging services can also increase the overnight stay rate of tourists, thus contributing to the economic benefits of tourism. For the PA tourism development, it is crucial to rely on peripheral areas of the PA to provide accommodation, dining, and other services as much as possible, in order to minimize the impact of tourism on the PA’s environment and biodiversity, while also promoting the development of local communities.

4. Conclusions

The sustainable tourism development in PAs is a complex process, in which economic, social and ecological factors interact with each other and in which resource administrators, tourists and local communities, among other stakeholders, participate. Systematic thinking has offered us a holistic perspective of analysis. From the case of the QLNR tourism system, it is evident that changes in external factors such as policies can significantly improve the sustainability of one subsystem while potentially reducing the sustainability of another subsystem. Hence, the assessment of relationships among subsystems should not be overlooked, as the sustainability of a PA tourism system depends not only on the sustainability level of its individual subsystems, but also on their balance.
In order to propose an integrated evaluation approach that reflects the temporal evolution of the relationship among subsystems from the perspective of ecological-economic-social coordinated development, we established a sustainability evaluation framework for the PA tourism system, which includes social, economic, and ecological subsystems, and identified a set of indicators in line with the development goals of sustainable tourism in the context of PAs by FDM. Subsequently, the CCDD and the obstacle degree model were used to reflect the temporal evolution of the sustainability of the reserve and identify the obstacle factors.
Our paper makes a significant contribution to the literature on three aspects. Firstly, the CCDD was introduced to assess the relationships among subsystems of a PA tourism system. While more studies have focused on large-scale tourist destinations such as cities (prefectures) and provinces or national-level destinations, our study specifically focuses on the PA tourism system. Secondly, we adopted the FDM to include scholars and administrators in the index selection process, which makes the CCDD more applicable to the PA tourism systems. This is a departure from the norm, as the indicators of CCDD are usually selected solely by authors, without engaging other stakeholders. Lastly, to improve the applicability and objectivity of the evaluation, we combined the analytic hierarchy process and the entropy method to determine the index weight, taking into account both index information and management concerns. The results show that this is necessary for diachronic evaluation and sustainability management of the PA tourism system.

5. Limitations and Future Research

Given the variety of PAs and their wide differences across countries and regions in natural ecological, social and cultural conditions, and tourist preference, the indicator system should be tailored to actual situations when applied in other PAs. In addition, a case study is not sufficient to draw general conclusions. Therefore, it is important to undertake more studies on tourism systems in different categories of PAs or PAs in different regions in the future to identify characteristics of subsystem relationships and obstacle factors.
For PA tourism systems, the coupling coordination degree assessment indicators should be adapted to the specific situations, such as conservation objectives and community conditions. Stakeholder participation is therefore crucial in selecting indicators. This paper involved administrators and related academics in the selection through the FDM. However, local residents in QLNR who generally speak the Tibetan language and have low literacy skills were not included due to difficulties in communicating and understanding of this method. Research in the future can include non-governmental organizations, tourists, local community residents and other stakeholders of tourism in PAs in selecting indicators and determining weights to better cater to local realities.

Author Contributions

Conceptualization, X.Z. and L.Z.; methodology, X.Z.; software, X.Z.; formal analysis, X.Z.; investigation, X.Z. and L.Z.; data curation, H.Y.; writing—original draft preparation, X.Z.; writing—review and editing, H.Y.; visualization, L.-E.W.; supervision, L.Z.; funding acquisition, L.Z. All authors have read and agreed to the published version of the manuscript.

Funding

This research was funded by the Strategic Priority Research Program of Chinese Academy of Sciences [XDA20020302], the Second Tibetan Plateau Scientific Expedition and Research of Ministry of Science and Technology of China [2019QZKK0401], and Sanjiangyuan National Park Joint Research Project of Chinese Academy of Sciences and Qinghai Province Government [LHZX-2020-05].

Data Availability Statement

The data presented in this study are available on request from the corresponding author.

Conflicts of Interest

The authors declare no conflict of interest.

Appendix A. The Questionnaire for Fuzzy Delphi Method

The questionnaire for experts on sustainability indicators of tourism in Qinghai Lake Nature Reserve.
Dear experts:
We are researchers from ***. Due to the research needs, we are conducting a questionnaire survey on the sustainable development of tourism in Qinghai Lake Nature Reserve (QLNR). Please feel free to fill in the questionnaire anonymously and for scientific research purposes only. Your true opinions are very important for us to get objective and meaningful research conclusions. Thank you for your support and cooperation!
Wish you good health, smooth work and a happy family!
Instructions:
This questionnaire uses the assignment method (the score is divided from 0 to 10). The higher the number, the more you approve of using the indicator for evaluation. The smaller the number, the less suitable the index is for the sustainability evaluation of tourism in QLNR. Each indicator needs three numbers. Maximum value and Minimum Value indicate the applicability range of the indicator, and Confirmed value indicates a single value of the applicability degree of the indicator.
The indicator assignment follows the following principles.
Relevance: This index is related to the development of tourism in protected areas.
Availability: The data required for indicators are relatively easy to obtain.
Comparability: The indicators are comparable in different years and protected areas.
Table A1. Index assignment table.
NumberIndicatorsMaximum ValueMinimum ValueConfirmed Value
1Growth in local economy
2Growth in tourism revenue
3Growth in tourist numbers
4Rate of repeat visitors
5Distribution of tourism income
6Spatial structure of tourism income
7Tourist seasonality
8Tourism revenue structure
9Tourist per capita consumption
10The per capita income of the local community
11Local prices
12Tourism transportation
13Cultural places for tourists
14Conflicts between community, PA, and tourists
15Local cultural preservation
16Community participation in tourism
17Environmental interpretation facility
18Environmental interpreters
19Capital input on environmental interpretation
20Key species protection
21Vegetation coverage area
22The water quality
23Tourism environment monitoring
24Wildlife conservation
25The wetland area
26Alien species
27Vegetation protection
28Land use type change

Appendix B. Statistical Analysis of Questionnaire Results

In the expert consultation questionnaire, each expert is required to give a possible interval value [Ci, Oi] and a definite value Pi between Ci and Oi for each indicator to be evaluated, where i is an indicator to be evaluated, the minimum value Ci is the “most conservative cognitive value” of i, and the maximum value Oi is the “most optimistic cognitive value” of i.
The steps of questionnaire analysis are as follows.
Step 1: Conducting statistical analysis for each index i
The extreme values other than “2 times standard deviation” were excluded, and then the minimum value (CiL, OiL), geometric mean value (CiM, OiM) and maximum value (CiU, OiU) were calculated. The conservative trigonometric fuzzy function Ci = (CiL, CiM, CiU) and the optimistic trigonometric fuzzy function Oi = (OiL, OiM, OiU) were established (Figure A1).
Figure A1. Dual-trigonometric fuzzy function map.
Forests 14 00890 g0a1
Step 2: Calculating the consistency degree of experts on indicators
The grey zone was used to judge whether the expert opinions reached convergence, and Gi (representing the consensus degree of experts) was determined according to different situations.
If CiU ≤ OiL G i = C M i + O M i 2 . It represents the non-overlapping interval of two trigonometric fuzzy functions, indicating that experts have reached a consensus on the index.
If CiU > OiL, it means that the two trigonometric fuzzy functions have overlapping intervals. When Zi (Zi = CiU − OiL) < Mi (Mi = CiM − OiM), it indicates that there are different opinions among experts, but the difference is very small, and then    G i = O M i C U i C M i O L i Z i + M i . When Zi > Mi, it tells that the opinions of experts differ greatly, and the above steps need to be repeated until the opinions of experts on all indicators converge.
Step 3: Calculating the threshold
There are three commonly used methods for determining the threshold value (S): (I) According to established experience, set the threshold value at 5–7; (II) Determine S of indicator i by calculating the geometric mean of Ci, Oi, and Pi, and then the geometric mean of the three geometric means; (III) Calculate the arithmetic mean value of Pi as the threshold value. This paper chooses the second method, which is relatively objective.
Step 4: Index selection
According to Table 2, after the first round of consultation, a total of nine indicators had Mi – Zi < 0, indicating the expert opinions did not reach convergence. As a result of the second-round expert consultation, all the nine reached convergence, but seven with G value smaller than the threshold value S were deleted. After two rounds of fuzzy Delphi questionnaire surveys, 21 indicators were generated in total (Table 2).

References

  1. Eagles, P.F.J.; McCool, S.F.; Haynes, C.D. Sustainable Tourism in Protected Areas: Guidelines for Planning and Management; IUCN: Gland, Switzerland, 2002. [Google Scholar]
  2. Rahman, M.M.; Al Mahmud, A.; Shahidullah, M. Socioeconomics of biodiversity conservation in the protected areas: A case study in Bangladesh. Int. J. Sustain. Dev. World Ecol. 2017, 24, 65–72. [Google Scholar] [CrossRef]
  3. Kabil, M.; Alayan, R.; Lakner, Z.; Dávid, L.D. Enhancing Regional Tourism Development in the Protected Areas Using the Total Economic Value Approach. Forests 2022, 13, 727. [Google Scholar] [CrossRef]
  4. Ardoin, N.M.; Wheaton, M.; Bowers, A.W.; Hunt, C.A.; Durham, W.H. Nature-based tourism’s impact on environmental knowledge, attitudes, and behavior: A review and analysis of the literature and potential future research. J. Sustain. Tour. 2015, 23, 838–858. [Google Scholar] [CrossRef]
  5. Watson, J.E.M.; Dudley, N.; Segan, D.B.; Hockings, M. The performance and potential of protected areas. Nature 2014, 515, 67–73. [Google Scholar] [CrossRef] [PubMed]
  6. Snyman, S.; Bricker, K.S. Living on the edge: Benefit-sharing from protected area tourism. J. Sustain. Tour. 2019, 27, 705–719. [Google Scholar] [CrossRef]
  7. Zhang, H.; Huang, R.; Zhang, Y.; Buhalis, D. Cultural ecosystem services evaluation using geolocated social media data: A review. Tour. Geogr. 2020, 24, 646–668. [Google Scholar] [CrossRef]
  8. Thapa, K.; King, D.; Banhalmi-Zakar, Z.; Diedrich, A. Nature-based tourism in protected areas: A systematic review of socio-economic benefits and costs to local people. Int. J. Sustain. Dev. World Ecol. 2022, 29, 625–640. [Google Scholar] [CrossRef]
  9. Balmford, A.; Green, J.; Anderson, M.; Beresford, J.; Huang, C.; Naidoo, R.; Walpole, M.; Manica, A. Walk on the Wild Side: Estimating the Global Magnitude of Visits to Protected Areas. PLoS Biol. 2015, 13, e1002074. [Google Scholar] [CrossRef]
  10. Buckley, R.; Brough, P.; Hague, L.; Chauvenet, A.; Fleming, C.; Roche, E.; Sofija, E.; Harris, N. Author Correction: Economic value of protected areas via visitor mental health. Nat. Commun. 2019, 10, 5005. [Google Scholar] [CrossRef]
  11. Buckley, R.; Zhong, L.; Cooper, M.-A. Mental health and nature: More implementation research needed. Nature 2022, 612, 33. [Google Scholar] [CrossRef]
  12. Soliku, O.; Schraml, U. Making sense of protected area conflicts and management approaches: A review of causes, contexts and conflict management strategies. Biol. Conserv. 2018, 222, 136–145. [Google Scholar] [CrossRef]
  13. Karst, H.E.; Nepal, S.K. Conservation, development and stakeholder relations in Bhutanese protected area management. Int. J. Sustain. Dev. World Ecol. 2019, 26, 290–301. [Google Scholar] [CrossRef]
  14. WTO (World Tourism Organization). Indicators of Sustainable Development for Tourism Destinations: A Guidebook; World Tourism Organization: Madrid, Spain, 2004.
  15. Leung, Y.-F.; Spenceley, A.; Hvenegaard, G.; Buckley, R. Tourism and Visitor Management in Protected Areas: Guidelines for Sustainability; Best Practice Protected Area Guidelines Series No. 27; IUCN: Gland, Switzerland, 2018. [Google Scholar] [CrossRef]
  16. Becken, S.; Job, H. Protected Areas in an era of global–local change. J. Sustain. Tour. 2014, 22, 507–527. [Google Scholar] [CrossRef]
  17. Fisichelli, N.A.; Schuurman, G.W.; Monahan, W.B.; Ziesler, P.S. Protected Area Tourism in a Changing Climate: Will Visitation at US National Parks Warm Up or Overheat? PLoS ONE 2015, 10, e0128226. [Google Scholar] [CrossRef]
  18. Cumming, G.S.; Allen, C.R. Protected areas as social-ecological systems: Perspectives from resilience and social-ecological systems theory. Ecol. Appl. 2017, 27, 1709–1717. [Google Scholar] [CrossRef]
  19. Pásková, M.; Wall, G.; Zejda, D.; Zelenka, J. Tourism carrying capacity reconceptualization: Modelling and management of destinations. J. Destin. Mark. Manag. 2021, 21, 100638. [Google Scholar] [CrossRef]
  20. Weng, L.; Wu, Y.; Han, G.; Liu, H.; Cui, F. Emotional State, Psychological Resilience, and Travel Intention to National Forest Park during COVID-19. Forests 2022, 13, 750. [Google Scholar] [CrossRef]
  21. Strickland-Munro, J.K.; Allison, H.E.; Moore, S.A. Using resilience concepts to investigate the impacts of protected area tourism on communities. Ann. Tour. Res. 2010, 37, 499–519. [Google Scholar] [CrossRef]
  22. Strickland-Munro, J.; Moore, S. Exploring the impacts of protected area tourism on local communities using a resilience approach. Koedoe 2014, 56, 1–10. [Google Scholar] [CrossRef]
  23. McGinlay, J.; Gkoumas, V.; Holtvoeth, J.; Fuertes, R.F.A.; Bazhenova, E.; Benzoni, A.; Botsch, K.; Martel, C.C.; Sánchez, C.C.; Cervera, I.; et al. The Impact of COVID-19 on the Management of European Protected Areas and Policy Implications. Forests 2020, 11, 1214. [Google Scholar] [CrossRef]
  24. Smith, M.K.S.; Smit, I.P.; Swemmer, L.K.; Mokhatla, M.M.; Freitag, S.; Roux, D.J.; Dziba, L. Sustainability of protected areas: Vulnerabilities and opportunities as revealed by COVID-19 in a national park management agency. Biol. Conserv. 2021, 255, 108985. [Google Scholar] [CrossRef]
  25. Schianetz, K.; Kavanagh, L. Sustainability Indicators for Tourism Destinations: A Complex Adaptive Systems Approach Using Systemic Indicator Systems. J. Sustain. Tour. 2008, 16, 601–628. [Google Scholar] [CrossRef]
  26. Zhang, X.; Zhong, L.; Yu, H. Sustainability assessment of tourism in protected areas: A relational perspective. Glob. Ecol. Conserv. 2022, 35, e02074. [Google Scholar] [CrossRef]
  27. Plummer, R.; Fennell, D.A. Managing protected areas for sustainable tourism: Prospects for adaptive co-management. J. Sustain. Tour. 2009, 17, 149–168. [Google Scholar] [CrossRef]
  28. Li, Y.; Li, Y.; Zhou, Y.; Shi, Y.; Zhu, X. Investigation of a coupling model of coordination between urbanization and the environment. J. Environ. Manag. 2012, 98, 127–133. [Google Scholar] [CrossRef]
  29. Tang, Z. An integrated approach to evaluating the coupling coordination between tourism and the environment. Tour. Manag. 2015, 46, 11–19. [Google Scholar] [CrossRef]
  30. Cong, X.L.; Huang, Y.; Liu, J.S. Spatial and temporal evolution of coupled coordination degree of ecotourism and tourism environment of Jilin Province. Sci. Geogr. Sin. 2019, 39, 496–505. [Google Scholar] [CrossRef]
  31. Weng, G.M.; Tang, Y.B.; Pan, Y.; Mao, Y.Q. Spatiotemporal evolution and spatial difference of tourism-ecology-urbanization coupling coordination in Beijing-Tianjin-Hebei Urban Agglomeration. Econ. Geogr. 2021, 41, 196–204. [Google Scholar]
  32. Kurniawan, F.; Adrianto, L.; Bengen, D.G.; Prasetyo, L.B. The social-ecological status of small islands: An evaluation of island tourism destination management in Indonesia. Tour. Manag. Perspect. 2019, 31, 136–144. [Google Scholar] [CrossRef]
  33. Fei, J.; Lin, Y.; Jiang, Q.; Jiang, K.; Li, P.; Ye, G. Spatiotemporal coupling coordination measurement on islands’ economy-environment-tourism system. Ocean Coast. Manag. 2021, 212, 105793. [Google Scholar] [CrossRef]
  34. Pandit, M.K.; Manish, K.; Koh, L.P. Dancing on the Roof of the World: Ecological Transformation of the Himalayan Landscape. Bioscience 2014, 64, 980–992. [Google Scholar] [CrossRef]
  35. Nepal, S.K. Tourism in protected areas. Ann. Tour. Res. 2000, 27, 661–681. [Google Scholar] [CrossRef]
  36. Gao, J.; Li, J.; Fu, J.; Bao, Y.N.; Ma, S.T.; Li, W.Y.; Guo, X. Spatial patterns of ecoregions and protected areas in the Karakoram-Himalayan region. Acta Ecol. Sin. 2021, 41, 912–923. [Google Scholar] [CrossRef]
  37. Zhong, L.S.; Zeng, Y.X.; Yu, H. The natural foundation and realization path of the recreation function of the Qinghai-Tibet Plateau National Park Group. Acta Ecol. Sin. 2021, 41, 861–873. [Google Scholar]
  38. Farrell, B.H.; Twining-Ward, L. Reconceptualizing Tourism. Ann. Tour. Res. 2004, 31, 274–295. [Google Scholar] [CrossRef]
  39. Lacitignola, D.; Petrosillo, I.; Cataldi, M.; Zurlini, G. Modelling socio-ecological tourism-based systems for sustainability. Ecol. Model. 2007, 206, 191–204. [Google Scholar] [CrossRef]
  40. Nyaupane, G.P.; Poudel, S. Linkages among biodiversity, livelihood, and tourism. Ann. Tour. Res. 2011, 38, 1344–1366. [Google Scholar] [CrossRef]
  41. Stone, M.T.; Nyaupane, G. Protected areas, tourism and community livelihoods linkages: A comprehensive analysis approach. J. Sustain. Tour. 2016, 24, 673–693. [Google Scholar] [CrossRef]
  42. Stone, M.T.; Stone, L.S.; Nyaupane, G.P. Theorizing and contextualizing protected areas, tourism and community livelihoods linkages. J. Sustain. Tour. 2021, 30, 2495–2509. [Google Scholar] [CrossRef]
  43. WTO; UNEP (United Nations Environment Programme and World Tourism Organisation). Making Tourism More Sustainable: A Guide for Policy Makers; United Nations Environment Programme and World Tourism Organisation: Paris, France; Madrid, Spain, 2005.
  44. Torres-Delgado, A.; Saarinen, J. Using indicators to assess sustainable tourism development: A review. Tour. Geogr. 2014, 16, 31–47. [Google Scholar] [CrossRef]
  45. Agyeiwaah, E.; McKercher, B.; Suntikul, W. Identifying core indicators of sustainable tourism: A path forward? Tour. Manag. Perspect. 2017, 24, 26–33. [Google Scholar] [CrossRef]
  46. Qiu, H.; Fan, D.X.F.; Lyu, J.; Lin, P.M.C.; Jenkins, C.L. Analyzing the Economic Sustainability of Tourism Development: Evidence from Hong Kong. J. Hosp. Tour. Res. 2019, 43, 226–248. [Google Scholar] [CrossRef]
  47. Leposa, N. Problematic blue growth: A thematic synthesis of social sustainability problems related to growth in the marine and coastal tourism. Sustain. Sci. 2020, 15, 1233–1244. [Google Scholar] [CrossRef]
  48. Bramwell, B.; Lane, B. Critical research on the governance of tourism and sustainability. J. Sustain. Tour. 2011, 19, 411–421. [Google Scholar] [CrossRef]
  49. Chen, D.; Zhong, L.; Fan, J.; Yu, H.; Yang, D.; Zeng, Y. Evaluation and structural analysis of the functions of the Tibetan Plateau National Park Cluster. J. Geogr. Sci. 2022, 32, 957–980. [Google Scholar] [CrossRef]
  50. Li, X.Y.; Li, F.X.; Ma, Y.J.; Wu, X.M.; Sha, Z.J.; Wang, X.Q.; Wang, J.H. Wetland Restoration and Biodiversity Conservation in Qinghai Lake Basin; Science Press: Beijing, China, 2016. [Google Scholar]
  51. UNEP (United Nations Environment Programme). A Snapshot of the World’s Water Quality: Towards a Global Assessment; UNEP: Nairobi, Kenya, 2016.
  52. Zhao, Y.Y. Measurement and Dynamic Change of Tourism Ecological Footprint in Qinghai Lake Nature Reserve; China Social Sciences Press: Beijing, China, 2018. [Google Scholar]
  53. Ocampo, L.; Ebisa, J.A.; Ombe, J.; Escoto, M.G. Sustainable ecotourism indicators with fuzzy Delphi method—A Philippine perspective. Ecol. Indic. 2018, 93, 874–888. [Google Scholar] [CrossRef]
  54. Lee, T.H.; Hsieh, H.-P. Indicators of sustainable tourism: A case study from a Taiwan’s wetland. Ecol. Indic. 2016, 67, 779–787. [Google Scholar] [CrossRef]
  55. Chen, M.G. A Study on the Competitiveness of Chinese Insurance Brokerage Companies; Zhongnan University of Economics and Law: Wuhan, China, 2017. [Google Scholar]
  56. Ko, T.G. Development of a tourism sustainability assessment procedure: A conceptual approach. Tour. Manag. 2005, 26, 431–445. [Google Scholar] [CrossRef]
  57. Yu, L. Study on Evaluation Index System of Ecotourism Sustainability in Nature Reserves; Beijing Forestry University: Beijing, China, 2006. [Google Scholar]
  58. Blancas, F.J.; González, M.; Lozano, M.G.; Perez, F. The assessment of sustainable tourism: Application to Spanish coastal destinations. Ecol. Indic. 2010, 10, 484–492. [Google Scholar] [CrossRef]
  59. Jitpakdee, R.; Thapa, G.B. Sustainability Analysis of Ecotourism on Yao Noi Island, Thailand. Asia Pac. J. Tour. Res. 2012, 17, 301–325. [Google Scholar] [CrossRef]
  60. Pérez, V.; Guerrero, F.; González, M.; Pérez, F.; Caballero, R. Composite indicator for the assessment of sustainability: The case of Cuban nature-based tourism destinations. Ecol. Indic. 2013, 29, 316–324. [Google Scholar] [CrossRef]
  61. Ashok, S.; Tewari, H.; Behera, M.; Majumdar, A. Development of ecotourism sustainability assessment framework employing Delphi, C&I and participatory methods: A case study of KBR, West Sikkim, India. Tour. Manag. Perspect. 2017, 21, 24–41. [Google Scholar] [CrossRef]
  62. Saaty, T.L.; Özdemir, M.S. How many judges should there be in a group? Ann. Data Sci. 2014, 1, 359–368. [Google Scholar] [CrossRef]
  63. Deng, J.; King, B.; Bauer, T. Evaluating natural attractions for tourism. Ann. Tour. Res. 2002, 29, 422–438. [Google Scholar] [CrossRef]
  64. Zhou, C.; Feng, X.G.; Tang, R. Analysis and Forecast of Coupling Coordination Development among the Regional Economy-Ecological Environment-Tourism Industry—A Case Study of Provinces Along the Yangtze Economic Zone. Econ. Geogr. 2016, 36, 186–193. [Google Scholar] [CrossRef]
  65. Zhao, J.; Liu, Y.; Zhu, Y.; Qin, S.; Wang, Y.; Miao, C. Spatiotemporal differentiation and influencing factors of the coupling and coordinated development of new urbanization and ecological environment in the Yellow River Basin. Resour. Sci. 2020, 42, 159–171. [Google Scholar] [CrossRef]
  66. Yang, X.M.; Geng, J.; Xu, Y.; Zhuang, H.Y.; Chen, W.S. Spatio-temporal change and obstacle degree diagnosis of comprehensive land carrying capacity in Hainan Island based on TOPSIS model. Acta Ecol. Sin. 2022, 42, 9324–9334. [Google Scholar]
  67. General Office of the Communist Party of China Central Committee; General Office of the State Council. A Guideline on Establishing a Protected Area System with National Parks as the Main Body. 2019. Available online: http://www.gov.cn/xinwen/2019-06/26/content_5403497.htm (accessed on 23 March 2022).
  68. Wang, W.; Liu, J.; Innes, J.L. Conservation equity for local communities in the process of tourism development in protected areas: A study of Jiuzhaigou Biosphere Reserve, China. World Dev. 2019, 124, 104637. [Google Scholar] [CrossRef]
  69. Zhang, Y.; Hu, Y.; Zhang, B.; Li, Y.; Zhang, X.; Xie, Y. Conflict between nature reserves and surrounding communities in China: An empirical study based on a social and ecological system framework. Glob. Ecol. Conserv. 2020, 21, e00804. [Google Scholar] [CrossRef]
  70. Xu, H.; Cui, Q.; Sofield, T.; Li, F.M.S. Attaining harmony: Understanding the relationship between ecotourism and protected areas in China. J. Sustain. Tour. 2014, 22, 1131–1150. [Google Scholar] [CrossRef]
  71. Cui, X.; Wang, Y.S.; Shi, L.N. Spatio-temporal characteristics and obstacle factors of human-land system coupling coordination in farming-pastoral ecotones of northern China. J. Agric. Resour. Environ. 2022, 40, 1–13. [Google Scholar]
  72. Hentati-Sundberg, J.; Berglund, P.-A.; Hejdström, A.; Olsson, O. COVID-19 lockdown reveals tourists as seabird guardians. Biol. Conserv. 2021, 254, 108950. [Google Scholar] [CrossRef] [PubMed]
Figure 1. The assessment framework. (D represents the degree of coupling coordination).
Forests 14 00890 g001
Figure 2. Location of the Qinghai Lake Nature Reserve.
Forests 14 00890 g002
Figure 3. The flow chart for index system establishment. (FDM indicates the fuzzy Delphi method).
Forests 14 00890 g003
Figure 4. Sustainability index of QLNR tourism system and its subsystems from 2010 to 2019.
Forests 14 00890 g004
Figure 5. The coupling coordination degree of QLNR tourism system from 2010 to 2019. (D represents the degree of coupling coordination).
Forests 14 00890 g005
Table 1. Qualifications of the experts.
Organization/Institution Number
Institute of Geographic Sciences and Natural Resources Research, Chinese Academy of Sciences 1
Northwest Plateau Institute of Biology, Chinese Academy of Sciences2
Qinghai Lake Protection and Utilization Administration of Qinghai Province 2
Department of PAs Management, National Forestry and Grassland Administration in China 2
National Parks and PAs Management Division, Qinghai Forestry and Grassland Bureau 1
Note: The same group of experts was consulted in the analytic hierarchy process (AHP).
Table 2. Results of two rounds of fuzzy Delphi questionnaires.
SubsystemsIndicatorsOLOUCLCUM − ZGS
The first round
Economy Growth in local economy 610173.366.305.05
Growth in tourism revenue810175.566.566.41
Growth in tourist numbers610182.236.565.23
Rate of repeat visitors21017−1.994.694.40
Distribution of tourism income21016−1.134.324.26
Spatial structure of tourism income310160.774.544.44
Tourist seasonality79166.185.374.71
Tourism revenue structure610173.246.325.33
Tourist per capita consumption510181.455.995.04
Society The per capita income of the local community59262.715.475.26
Local prices38142.133.553.54
Tourism transportation31018−1.445.295.12
Cultural places for tourists 41018−0.205.705.52
Conflicts between community, PA, and tourists 21017−2.154.644.70
Local cultural preservation21016−1.244.354.22
Community participation in tourism38150.654.124.17
Environmental interpretation facility59171.925.765.14
Environmental interpreters510162.765.334.61
Capital input on environmental interpretation510180.916.125.65
Ecology Key species protection58163.345.444.67
Vegetation coverage area510190.716.555.47
Water quality910294.119.007.27
Tourism environment monitoring51039−1.277.057.02
Wildlife conservation7102100.807.736.72
The wetland area31029−2.685.425.40
Alien species41029−1.655.675.67
Vegetation protection8102102.118.316.80
Land use type change610174.036.345.06
The second-round
Rate of repeat visitors510163.885.545.70
Distribution of tourism income410152.874.574.64
Tourism transportation410152.694.544.79
Cultural places for tourists610164.595.565.64
Conflicts between community, PA, and tourists510163.345.535.72
Local cultural preservation510181.376.004.83
Tourism environment monitoring710175.365.896.00
The wetland area410180.525.674.88
Alien species810384.047.457.70
Note: Mi − Zi < 0 requires a second round of expert consultation (values in bold), and Gi < Si means the indicator should be deleted.
Table 3. Indicators and the weights.
SubsystemWeights by AHPWeights by EMGeneral WeightDimensionWeights by AHPWeights by EMGeneral WeightIndicatorsSignWeights by AHPWeights by EMGeneral WeightsVerifiers
Economy (A)0.32640.21860.2725Economic structure (A1)0.1632 0.1254 0.1443 Tourism revenue structure (A11)0.0360 0.0418 0.0389The proportion of ticket revenue in total tourism revenue (%)
Tourist per capita consumption (A12)+0.0640 0.0258 0.0449Tourist per capita consumption (¥)
Tourist seasonality (A13)0.0138 0.0461 0.0300Tourism seasonal intensity index
Spatial structure of tourism income (A14)0.0494 0.0117 0.0306The income of Erlangjian scenic spot / the total income of QLNR (%)
Economic growth (A2)0.1632 0.0932 0.1282 Growth in local economy (A21)+0.0898 0.0255 0.0577Average annual GDP growth rate of the three counties involved in the reserve (%)
Growth in tourism revenue (A22)+0.0342 0.0352 0.0347Annual growth rate of tourism revenue<break/> (%)
Growth in tourist numbers (A23)+0.0392 0.0325 0.0359Annual growth rate of tourist numbers (%)
Society (B)0.13960.49780.3187Community development (B1)0.0718 0.0601 0.0660 Local economic development capacity (B11)+0.0340 0.0225 0.0283Balance of household savings deposits (¥)
Local prices (B12)0.0108 0.0132 0.0120Local consumer price index
Community participation in tourism (B13)+0.0270 0.0244 0.0257Proportion of working-age people participating in tourism
Cultural protection (B2)0.0300 0.0580 0.0440 Local cultural preservation (B21)+0.0300 0.0580 0.0440Number of state-level cultural relic protection units and intangible culture
Nature education (B3)0.0378 0.3797 0.2088 Environmental interpretation facility (B31)+0.0126 0.0919 0.0523Number of interpretive signs related to nature education
Environmental interpreters (B32)+0.0126 0.1613 0.0870Number of trained interpreters for nature education
Capital input on on nature education (B33)+0.0126 0.1265 0.0696Capital input on on nature education (¥)
Ecology (C)0.52760.28360.4056Ecological environment (C1)0.0878 0.1852 0.1365 The wetland area (C11)+0.0274 0.0621 0.0448The wetland area (km2)
Vegetation coverage area (C12)+0.0274 0.0912 0.0593Vegetation coverage area (km2)
The water quality (C13)+0.0256 0.0319 0.0288Grade of the water quality
Land use type change (C14)0.0074 0.0000 0.0037The proportion of urban land and agricultural land in the total area of QLNR (%)
Biodiversity (C2)0.4398 0.0984 0.2691 Wildlife conservation (C21)+0.0786 0.0141 0.0464The Shannon-Wiener diversity index of waterbirds in autumn
Key species protection (C22)+0.3118 0.0606 0.1862Population of Przewalski’s gazelle
Vegetation protection (C23)+0.0494 0.0237 0.0366Mean total ground biomass
Note: “+” and “−” respectively represent positive indicators and negative indicators; Przewalski’s gazelle serves as the flagship species in the reserve.
Table 4. Criteria for classification of the coupling degree and the coupling coordination degree.
Criteria for Classification of the Coupling DegreeCriteria for Classification of the Coupling Coordination Degree
CCoupling LevelDCoupling Coordination Level
(0.0~0.3)Seriously low coupling development(0.0~0.1)Extreme unbalanced development
[0.1~0.2)Seriously unbalanced development
[0.2~0.3)Moderately unbalanced development
[0.3~0.5)Low coupling development[0.3~0.4)Slightly unbalanced development
[0.4~0.5)Imminently unbalanced development
[0.5~0.8)High coupling development[0.5~0.6)Barely balanced development
[0.6~0.7)Favorably balanced development
[0.7~0.8)Intermediately balanced development
[0.8~1.0)Superiorly high coupling development[0.8~0.9)Good balanced development
[0.8~1.0)Superiorly balanced development
Table 5. The coupling degree of QLNR tourism system from 2010 to 2019.
YearC between the Economic Subsystem and Social SubsystemC between the Economic Subsystem and Ecological SubsystemC between the Social Subsystem and Ecological SubsystemComprehensive C
20100.9190.9970.9430.942
20110.4860.9730.5920.616
20120.6140.9220.8160.718
20130.7220.9860.8040.802
20140.9830.9640.9960.974
20150.9990.9790.9700.978
20161.0000.9970.9980.998
20170.9520.9660.9990.965
20180.9950.9840.9970.990
20190.9180.8350.9800.886
The average0.85880.9603 0.9095 0.8869
Note: C represents the coupling degree.
Table 6. Division of development stages of Qinghai Lake Nature Reserve tourism system.
RankingsThe Stage of Economic Dominance (2010–2014)The Stage of Social Dominance (2014–2018)The Stage of Ecological Dominance (2018–2019)
Rankings of subsystem sustainability indexf1(x) > f3(x) > f2(x)f2(x) > f1(x) > f3(x)f3(x) > f2(x) > f1(x)
Rankings of coupling coordination degree between subsystemsD13 > D12 > D23D12 > D13 > D23D23 > D13 > D12
Note: D12 refers to the coupling coordination degree of economic subsystem and social subsystem. D13 refers to the coupling coordination degree of economic subsystem and ecological subsystem. D23 refers to the coupling coordination degree of social subsystem and ecological subsystem.
Table 7. The obstacle degree and the top three obstacle indicators in each subsystem from 2010 to 2019.
YearSocietyEcologyEconomy
Obstacle Degree Dominant Obstacle FactorsObstacle Degree Dominant Obstacle FactorsObstacle Degree Dominant Obstacle Factors
20100.3767 B32, B31, B210.3610 C22, C11, C230.2623 A11, A23, A22
20110.4739 B32, B33, B310.3777 C22, C11, C120.1484 A11, A12, A21
20120.4612 B32, B33, B310.4150 C22, C11, C230.1238 A11, A23, A12
20130.4336 B32, B33, B310.4056 C22, C11, C210.1608 A11, A13, A23
20140.3237 B32, B31, B210.4719 C22, C12, C110.2044 A13, A23, A22
20150.3174 B32, B33, B310.4547 C22, C12, C230.2279 A21, A11, A13
20160.2943 B32, B33, B110.5011 C22, C12, C110.2046 A11, A22, A23
20170.2858 B32, B33, B130.4384 C22, C12, C110.2758 A21, A12, A23
20180.2254 B33, B13, B120.5009 C22, C12, C210.2737 A22, A21, A13
20190.1568 B33, B13, B120.3422 C12, C23, C130.5009A12, A21, A14
Disclaimer/Publisher’s Note: The statements, opinions and data contained in all publications are solely those of the individual author(s) and contributor(s) and not of MDPI and/or the editor(s). MDPI and/or the editor(s) disclaim responsibility for any injury to people or property resulting from any ideas, methods, instructions or products referred to in the content.

