Article

Structure and Ecosystem Services of Three Common Urban Tree Species in an Arid Climate City

1
Forest Growth and Yield Science, TUM School of Life Sciences, Technical University of Munich, Hans-Carl-von-Carlowitz-Platz 2, D-85354 Freising, Germany
2
AL-Quds Public Health Society (AQPHS), Ibn Batouta Street, Jerusalem P.O. Box 20760, Palestine
3
Soil & Hydrology Research Lab (SHR), Earth and Environmental Sciences Department, Al-Quds University, Jerusalem P.O. Box 20760, Palestine
4
Environment and Climate Change Research Directorate, National Agricultural Research Center (NARC), Al-Balqah 19381, Jordan
5
Strategic Landscape Planning and Management, Technical University of Munich, Emil-Ramann-Straße 6, D-85354 Freising, Germany
6
Department of Natural Resources and Environment, Jordan University of Science and Technology, P.O. Box 3030, Irbid 22110, Jordan
*
Author to whom correspondence should be addressed.
Forests 2023, 14(4), 671; https://doi.org/10.3390/f14040671
Submission received: 10 February 2023 / Revised: 12 March 2023 / Accepted: 15 March 2023 / Published: 24 March 2023
(This article belongs to the Special Issue Urban Forest and Urban Microclimate)

Abstract

:
Urban forests play a critical role in improving the quality of life in cities, but in arid environments, little is known about the potential benefits and growth conditions of different tree species. Our study aimed to fill this gap by investigating the relationships between tree dimensions, above-ground biomass carbon storage, and shading potential in three common urban trees in the arid city of Jericho, Palestine, (i.e., Ficus nitida, Delonix regia, and Phoenix dactylifera). The trees were chosen according to their distribution in urban locations and tree vitality, with ages ranging from 20 to 90 years. Based on the results from tree structure measurements, the carbon storage and shading potential were calculated using the City Tree model. The results indicate a moderate to strong relationship between tree height, crown diameter, and crown volume for F. nitida and D. regia (R2 = 0.28–0.66), but no relationship for P. dactylifera (R2 = 0.03–0.06). The findings suggest that the analyzed tree species can considerably contribute to the potential benefits of trees in improving the climate of an arid city: D. regia shows a higher median of above-ground biomass carbon storage of 155 kg C tree−1, while P. dactylifera 91 kg C and F. nitida 76 Kg C. D. regia and F. nitida have a higher median of shading potential, (31 m2–41 m2), respectively. Information on the ecosystem services from urban trees and their relationships in terms of species, age, and tree planting urban location are very important for city planners, in relation to sustainable urban green spaces in arid cities.

1. Introduction

Urban trees are an essential component of urban green spaces, playing a crucial role in enhancing the well-being of city inhabitants. Urban trees offer myriad benefits, including reducing the urban heat island effect (UHI), mitigating the effects of climate change by removing atmospheric CO2 [1,2], moderating microclimates [3], and providing shade by reducing the temperatures on surfaces under tree canopies, particularly in the summer months in arid cities [4]. Additionally, these urban green spaces covered by trees also offer a variety of social and cultural benefits, including recreational opportunities, aesthetic value, and potential inspiration for the arts and other creative endeavors [5]. Furthermore, urban trees ameliorate the thermal environment of surroundings, and provide cooling effects through evapotranspiration and shading, thereby regulating local and regional climates [6,7,8,9].
Urban streets, particularly in semi-arid regions, can experience a significant increase in temperature, ranging from 3 to 6 °C compared to the surrounding rural environment [10]. Semi-arid regions account for 42% of the total global land area and support approximately 38% of the global population, and are often located in developing countries [11]. The provision of tree benefits largely depends on tree growth, which can vary with a range of microenvironmental and other site-specific factors [12], for instance, anthropogenic disturbances such as mechanical injury [13,14], low soil quality [15], sealed surfaces reducing water availability for tree roots [16], and limited rooting space [17], soil compaction [18], and reduced nutrient resources and soil aeration [19,20].
These disturbances are often location-dependent, and the risks they pose to tree vitality can vary substantially over small areas—depending, for instance, on planting locations in parking lots, gardens, squares, or streets. Rötzer et al. [21] have found that streets, paved squares, rooftops, and car parks limit the growth of trees, while larger gardens and public green spaces, such as parks and cemeteries, can provide ideal habitats for trees. Sanders et al. [22] demonstrate that planting space has a significant impact on tree growth, with trees planted in reduced space exhibiting reduced maximum size.
In semi-arid regions specifically, irregular rainfall, poor tree management practices, and drought stress can also negatively impact urban tree growth [23,24,25], and could influence the benefits trees are able to provide. Because the effective management of urban trees depends on a detailed understanding of the effects of growing environment, a substantial and growing literature seeks to evaluate the effects of climate change on urban tree growth rates in various climate zones [23,24,26]. Several factors can reduce tree growth in arid and warm areas where water resources are limited [27,28]. In contrast, a few studies observed that some factors may increase the urban tree growth rate compared to rural trees, e.g., [29,30,31,32], including, for instance lower ozone concentration, larger annual atmospheric N deposition, and higher CO2 concentration [31,33].
Considering the various factors influencing urban tree growth and their ecosystem services, recent research on tree growth and structure in urban green spaces has focused on monitoring and understanding these changes. By studying the relationships between structural variables such as leaf area index, crown dimension, tree height, and stem diameter, it is possible to model growth patterns and predict ecosystem services provisioning. This information can aid in the improvement of planning and management practices for urban landscapes [34]. However, urban tree growth in arid cities is poorly understood, which impedes modelling and limits the available evidence base for planners and managers.
City planners, for instance, must take into account the ability of urban trees to acclimate to their surroundings and the structural variables that affect their future growth in order to optimize their benefits and ensure their long-term survival in an urban environment [3]. As such, the structural development of urban trees, including size and shape, is closely linked to the benefits they provide [35]. For instance, the area and density of shading from solar radiation is largely a function of the shape and volume of tree crowns [36], while carbon sequestration and storage are driven by biomass and growth increment [37,38].
Moser et al. [39] developed a regression equation to predict future structural dimensions through direct field measurements based on tree diameter and age. Issa et al. [40] used crown dimensions to create an allometric equation to calculate total biomass, serving as a basis for remote sensing prediction and biomass assessment.
Understanding the relationship between structural variables of trees such as tree height, diameter at breast height, crown dimensions, and crown volume is essential to predict growth and ecosystem services [41,42]. Typically, diameter at breast height (dbh) is used to estimate tree growth based on the pipe model theory and functional carbon balance theory [43,44,45]. These theories allow for the derivation of tree structure and biomass from basic tree measurements.
Pretzsch et al. [46], and Watt et al. [47] use dbh as an explanatory variable to predict crown dimensions. Although allometric equations for urban tree species have been developed for tropical and temperate regions [48,49], studies about the structural dimensions and ecosystem services of urban trees in arid cities are scarce. Despite limited research on the tree growth patterns of urban trees in arid cities [50], there is a growing need to understand the factors that influence their growth and survival in these challenging environments. This research can provide a basic understanding of the structural dimensions and ecosystem services of urban trees in arid cities. We therefore analyzed the structural variables of urban trees in an arid city and estimated their carbon storage and shading potential (shaded area and shade density) as ecosystem services. We also aimed to examine the influence of site conditions, such as tree planting urban location and total unsealed area (tree pit surface area), on the tree structural variables, to understand the relationship between commonly planted urban tree structural variables and their effect on selected ecosystem services. The following hypotheses were tested:
Hypotheses 1 (H1).
For each of the tree species, Delonix regia, Ficus nitida and Phoenix dactylifera, significant different relationships exist in terms of
(a)
Tree height and crown dimensions with diameter at breast height (dbh, independent parameter).
(b)
dbh, tree height, and crown dimensions with tree age (independent parameter)
(c)
dbh, tree height, and crown dimensions with leaf area index (LAI, independent parameter)
(d)
dbh, tree height, and crown dimensions with tree pit surface area (independent parameter).
Hypotheses 2 (H2).
Tree planting urban location has a significant influence on tree structural variables (tree height, dbh, crown dimension), and ecosystem services.
Hypotheses 3 (H3).
The ecosystem services of carbon storage and shading potential of the three tree species differ significantly from each other.

2. Materials and Methods Tab

2.1. Study Site

Tree structural data was collected in the city of Jericho, located in the eastern part of the West Bank, Palestine (coordinates: 31.8611° N, 35.4618° E). Jericho is one of the oldest cities in the world, dating back to 7000 BC [51], with an elevation of 252 m below sea level. The climate is hot semi-arid with an average annual precipitation of 145 mm, and a mean annual temperature of 22.5 °C for the period 1991–2020 [52]. Trees were sampled by following urban transects (starting from the city center to the edge of the city boundary in all four cardinal directions (north, south, east, and west) (see Figure 1).

2.2. Categorization of Trees Based on Sites

The selected trees were classified based on their urban planting location and divided into four categories (due to their uneven distributions): (a) street trees, located on both sides of roads; (b) public place trees, planted in gardens with semi-vegetation-covering and semi-surrounded by buildings; (c) trees standing in parking lots, located in car parking areas; and (d) square trees, located downtown, where most social activity occurs. Young to old trees, and only healthy and vital trees were selected, as determined through visual inspection, and rated using a scale according to Roloff [53]. Trees that were heavily pruned or damaged, as well as those with low-forking branches, were excluded, followed [39,54]. It is worth noting that the Jericho City Garden Department prunes the trees annually to prevent negative effects on pedestrians. The tree data collection was conducted from June to November 2020, resulting in a total of 212 commonly available trees being measured, of which 69 were D. regia, 73 were F. nitida, and 70 were P. dactylifera (see Table 1).

2.3. Plant Species Description

Three common urban trees were selected in the arid city of Jericho, Palestine: the common fig tree (Ficus nitida), royal poinciana (Delonix regia) and date palm (Phoenix dactylifera). According to the Jericho municipality, by 2020, the city area had planted approximately 1000 F. nitida trees, 3000 D. regia trees and an unknown number of P. dactylifera trees. F. nitida is a common ornamental [55], large evergreen fig tree species [56], native to vast areas worldwide, particularly in warm tropical and subtropical regions [57]. These trees can reach a height of up to 10 m [58] and present a gray and smooth bark [59], are moderately drought tolerant, tolerant to different soil formations, rapid growth and salinity tolerant [60], and need full sunlight to partial shade [61]. Delonix regia (D. regia) is a common species, has been historically grown as an ornamental tree [50,62], and is commonly grown in the tropics and subtropics [63]. The trees are umbrella-shaped [64], with a maximum height of 10–15 m, a girth of up to 2 m, and have large trunks [50,62]. They are grown in public gardens, along roadsides, in parks, between buildings and in residential areas [65]. It is a light-demanding species, develops sluggishly and unevenly in the shadows [64], and is intolerant to heatwaves and high solar radiation. Nevertheless, it can tolerate many types of soil formation, although sandy soils are more functional for growth [66]. Phoenix dactylifera (date palm) is a diploid and monocotyledonous plant [67]. It is one of the oldest fruit crops [68]. It can be described as a tall plant with an average height range of 15–20 m [69] and lives on average for over 100 years [70]. The palm tree’s trunk can reach up to 30 m in length and is enclosed in fiber for protection (e.g., to protect the trunk from herbivorous insects and animals) and reducing water loss [71]. P. dactylifera species tolerate harsh growth conditions, high temperatures, droughts and high levels of salinity [72].

2.4. Measured Tree Variables

A global positioning system (GPS) (eTrex Vista ® CX Garmin) was used to record the tree positions (longitude, latitude, and elevation). Diameter at breast height (dbh) was measured for all species using a measuring tape. For F. nitida trees, where the trunk height was lower than 130 cm, the diameter was measured at 70 cm instead of 130 cm. A Leica Disto D510 Laser Distance Measurer was used to measure the crown radii and the tree pit. The crown radii were measured from the center of the tree trunk to the end of the longest branch, whereas the tree pit surface area was measured starting from the center of the tree trunk and up to the end of the unsealed area. The total unsealed (tree pit surface area) area was calculated based on the City Tree model [12]. Crown radii and tree pit surface area were measured in eight intercardinal directions (N, NE, …, NW) following Moser et al. [39]. True-Pulse 200 Rangefinder laser technology was used to measure tree height (h) and height-to-crown base (hcb) (e.g., the distance between the lowest branch and the ground). Crown length (cl) was derived by measuring the distance between the lowest branch and the top of the tree. Crown diameter (cd), crown projection area (cpa), and crown volume (cv) were calculated using equations used from the literature [54]. A crown reduction shape factor Fc = 0.5 was applied for parabola-shaped crowns of F. nitida and D. regia to calculate the crown volume [21]. P. dactylifera crown volume was calculated based on a spherical crown shape. All tree ages were used based on the agricultural tree records retrieved from Jericho City.

2.4.1. Leaf Area Index (LAI) and Ecosystem Services

The LAI of the trees was derived from hemispheric photographs taken between August and October using a Nikon D7500 camera SIGMA Circular Fisheye EX DC HSM 4.5 mm 1:2.8 fisheye lens. WinSCANOPY (Regent Instruments, INC) was used to analyze the resulting hemispherical photos, i.e., to derive the LAI for D. regia, F. nitida and P. dactylifera, following Moser et al., [39]. Some trees were excluded from the leaf area index (LAI) analysis, including one F. nitida tree and 22 P. dactylifera trees. These exclusions were due to factors such as foliage loss during a long drought period in 2020, which was exacerbated by an inconsistent irrigation system and pruning.

2.4.2. Ecosystem Service Calculation

We estimated the ecosystem services (i.e., above-ground biomass carbon storage (Csa) (Kg C) and shading potential (SP) (shaded area and shade density) for D. regia and F. nitida according to the City Tree model [12]:
The above-ground biomass carbon storage is calculated by
C s a = C s f o l + C s b t + C s s t e m
where Csfol = foliage biomass carbon, Csbt = branches and twigs biomass carbon, Csstem = stem biomass carbon. They can be calculated with the following equations:
C s f o l = L A I × c p a / s l a × 0.5
C s b t =   e x p   a + b × 0.95 × L n   d b h × 0.5
where a = −3.7299, b = 2.33, which is obtained from [12].
C s s t e m = v o l u m e × s p e c i f i c   w o o d   d e n s i t y × 0.5
According to El-Khatib et al. [73] and Agrawal et al. [74], the specific leaf area (sla) for F. nitida is 9.433 m2/kg, and for D. regia it is 8.1 m2/kg. The specific wood density for F. nitida (690 kg dw/m3) [75], and for D. regia (510 kg dw/m3) was obtained from Orwa et al., [64]. Stem volume was calculated from dbh, height and crown length according to [12] by assuming a cylindrical stem form.
To obtain the above-ground biomass carbon storage for P. dactylifera, we followed Issa et al., [40] using an allometric equation and considering that the maturity stages of our samples age exceeded 10 years. The above-ground biomass carbon storage of P. dactylifera can be estimated by:
The above-ground biomass carbon storage (Csa) = trunk biomass carbon storage C s t   + crown biomass carbon storage ( C s c )
C s a = C s t + C s c
Trunk biomass carbon storage   C s t = fresh trunk biomass ( f t   b m )   × 0.37 × 0.9331 × 0.58
C s t = f t   b m × 0.37 × 0.9331 × 0.58
f t   b m = 40.725 × H t   ^   0.9719
Ht: trunk height; 0.37 conversion factor from fresh crown biomass to dry weight (kg. dw); 0.9331 conversion factor to organic matter; and 0.58 as a conversion factor to carbon storage (kg C).
Carbon storage crown (Csc) = fresh crown biomass ( f c   b m ) × 0.41 × 0.9243 × 0.58
C s c = f c   b m × 0.41 × 0.9243 × 0.58
f c   b m = 14.034 × e   0.0554   x   C A
where CA is a crown area [m2] calculated by the following equation
C A = π c d 2 / 4
Conversion factor from fresh crown biomass to dry weight (kg. dw): 0.41, conversion factor to organic matter: 0.9243, and conversion factor to carbon storage (kg C): 0.58.
The shade area and shade density for D. regia, F. nitida, and P. dactylifera were calculated according to the City Tree model [21].
The City Tree model, which took into consideration the crown shape, was followed to calculate a tree’s shade area, shade density, and shade index. To determine the shade area, the average shade area between 8 a.m. and 6 p.m. on the 21st of June, the longest day in the northern hemisphere, was calculated. The shade area was calculated using the crown shade projection area formulas (cspa), with the crown diameter and shade length (instead of crown length) applied. To calculate the shade length, crown length, and cotangent for the hour, the location of the sun’s height was considered.
a v e A   s h a d e = ( i = 8 18 s h a d e   a r e a   i ) / 11
( i ): representing the hour of the day, and 11: representing the total number of hours that are taken into consideration.
The shade density (dshade) was calculated following [21], for each tree by:
d s h a d e = L A I × c p a / c v

2.5. Statistical Analysis

The crown dimension variables were calculated in Microsoft Office Excel 365. All statistical analyses and figures were generated using R software, version 3.6.3 [76]. To test the normality of the data, we used the Shapiro–Wilk test (Shapiro and Wilk, 1965) [77], and log-transformed data were used when necessary. To test H1 (a), tree height and crown dimension are significantly dependent on dbh and H1 (b, c, d); dbh, tree height, and crown dimension are significantly dependent on leaf area index and tree age. Correlation-regression analyses with ordinary least squares (OLS) were performed by using log-transformed data following Pretzsch et al., Stoffberg et al., and Peper et al. [46,78,79]. Equation (13) for H1(a), and Equation (14) for H1(b, c, and d).
l n   y = a + b × l n   x
y = a + b × l n   x
Through OLS regression, the response (y) is calculated from the predictor (x). When applying the models, we selected OLS instead of reduced major axis or moving average regression [80]. The second hypothesis (H2), the influences of different tree planting urban locations on tree structure and selected ecosystem services, was tested using a one-way ANOVA followed by the post hoc Tukey HSD test. In addition, it was used to test the third hypothesis (H3). The ecosystem services related to carbon storage and shade potential varied considerably among the three species. To visualize the structural variables, the impact on ecosystem services was considered. A linear mixed model (LMM) with random effect was used by using the “lme4” package in the R software, i.e., above-ground biomass carbon storage and shade area was used as the outcome variable, and the tree structure was used as the fixed effect, while tree pits and tree planting sites were considered random effects.

3. Results

3.1. Dependency of Tree Structure on dbh and Tree Age

All measured and calculated tree structural mean values and related standard deviation are given in ascending age classes for F. nitida and P. dactylifera, but for D. Regia, the ages of all samples ranged between 20 and 25 years. Table S1 provides valuable information on the characteristics of three tree species, including their age, dbh and crown dimension. The data highlights significant variations in these characteristics, both between species and within age categories, providing useful insights for researchers and practitioners in forestry and related fields. The limited age of trees in the city can be attributed to their recent planting and the fact that they constitute a significant proportion of the urban forest in the city.
The results show tree height and crown dimension are strongly correlated with the diameter at breast height (dbh) for D. regia and F. nitida, (see Table 2 and Figure 2). However, for P. dactylifera, the relationship between h and dbh is not significant, and the correlation between the crown volume and crown diameter and the dbh is weak. The strongest dependency was found between dbh and tree height, crown volume, and crown diameter for F. nitida, and between dbh and crown diameter for D. regia. However, there is no relationship between dbh with tree height or crown dimension for P. dactylifera.
The relationship between dbh, tree height, and crown dimension with the age of the three tree species were studied by the outcomes of linear regression analysis and shown in Table 3. The results show a significant relationship of dbh with age for D. regia, but all other variables are not significant. F. nitida, shows a strong to a moderate relationship with age, particularly to dbh (R2 = 0.61). Finally, the P. dactylifera results revealed a non-significant variance for all tree variables (R2 ≤ 0.05).

3.2. Dependency of LAI on Tree Species and Tree Structure

Linear regression analysis was used to investigate the relationship between leaf area index (LAI) and the variables dbh, h, cv, and cd for three tree species (F. nitida, D. regia, and P. dactylifera). However, we found no significant relationships between LAI and any of the variables (see Supplementary Table S2). The analysis showed that F. nitida and D. regia had significantly higher LAI values than P. dactylifera (p < 001 ***), with mean LAI values of 5.3 ± 0.22 and 5.8 ± 0.20, respectively, compared to the P. dactylifera mean LAI value of 2.9 ± 0.15. The standard errors for the mean LAI values for F. nitida, D. regia, and P. dactylifera were 0.22, 0.20, and 0.15, respectively. LAI may be an important factor to consider when comparing these three species. The sample sizes were 72, 69, and 48 for F. nitida, D. regia, and P. dactylifera, respectively.

3.3. Impact of Tree Urban Location and Tree Pit Surface Area on a Tree Structure

3.3.1. Tree Planting Urban Location

The results revealed that the dbh of D. regia and F. nitida exhibit significant variations across different site categories. Furthermore, the crown volume of F. nitida and P. dactylifera also showed significant variations as detailed in Table 4. The results also indicate that the tree height and age in D. regia differ across different sites (this might be due to different planting times), while the crown projection area and crown diameter of F. nitida is also significantly affected by the site. However, all other tree structural variables for the three tree species were found to not be significantly impacted by the site. We calculated the mean tree pit surface area of three species (F. nitida, D. regia, and P. dactylifera) in three different sites (a street, a parking lot, and a public place) along with the standard error. The statistical analyses show that the mean values of F. nitida and D. regia species are significantly different across different sites, as indicated by the p-values, p ≤ 0.001 and 0.009, respectively. On the other hand, the mean values of P. dactylifera species do not show significant differences across the sites, as indicated by the p-value of 0.36, (See Table S3 in the supplementary section).

3.3.2. Tree Pit Surface Area

Weak and significant differences were found in the variables dbh, h, cd, and cv of F. nitida in relation to the tree pit surface area, as well as in the variables dbh, cd, and cv of P. dactylifera (Refer to Table 5). However, none of the previously mentioned D. regia variables were found to have significant differences in the tree pit surface area.

3.4. Ecosystem Services of F. nitida, D. regia, and P. dactylifera

The relationship between above-ground biomass carbon storage (Csa), and shaded area with tree structure was analyzed using LMM, with Csa and shaded area as outcome variables, and dbh, crown diameter, and tree height as fixed factors for D. regia and F. nitida (Figure 3a,b), and h, cd, and age of P. dactylifera (Figure 3c). The results indicated that dbh, h, and cd were significant predictors of Csa (p < 0.001) with a positive effect on the Csa of D. regia and F. nitida. The model showed high goodness-of-fit with a marginal R2 of 99% and a conditional R2 of 99% (Supplementary Table S4). The random effects of the tree pit surface area and tree planting urban locations were found to have zero additional variation in Csa, suggesting that the variation in above-ground biomass carbon storage can be fully explained by the fixed factors. The D. regia and F. nitida models (15 and 16) fit the data well.
Ln (Csa) = 2.35 − ln(dbh) × 4.44 + ln (h) × 0.48 + ln(cd) × 0.23
Ln (Csa) = 2.81 − ln(dbh) × 4.52 + ln (h) × 0.89 + ln(cd) × 0.27
Model (17) quantifies the relationship between tree height, crown diameter, and age for above-ground biomass carbon storage. We used random effects. Above biomass carbon storage for P. dactylifera can be applied based on the following model:
Ln (Csa) = 1.48 + ln(h) × 1.99 + ln(cd) × 0.31 + ln(Age) × 0.31 + ε
The results of the LMM analysis indicated that h and cd, the fixed factors, positively impacted the shaded area in both D. regia and F. nitida (Figure 4a and Figure 4b, respectively). Conversely, for P. dactylifera, the effect of the fixed factors was statistically insignificant and negative (Table S5) in the Supplementary Materials section. Tree height and crown diameter are statistically significant as predictors of the shaded area. The results are depicted in Figure 4, which displays the fixed effect of the shaded area, with point estimates and 95% confidence intervals, and the significance of each predictor variable (p-value). The results suggest that increasing h and cd values lead to an increase in shaded areas in both D. regia and F. nitida. The LMM regression analysis for D. regia explained 18.9% of the response variable variation. The conditional R2 accounted for 64.4% of the variation in the response variable due to random effects. The regression results of F. nitida showed a high goodness of fit for both marginal R2 and conditional R2, with the model explaining 94.3% and 95.1% of the response variable variation, respectively. The variation in the shaded area can therefore be fully explained by the fixed factors and other random effects, as reflected in the D. regia model (18) and the F. nitida model (19), but not in the case of P. dactylifera.
Ln (aveAshade) = 1.29 + ln (h) × 1.19 + ln(cd) × 1.63 + ε
Ln (aveAshade) = 0.52 − (h) × 2.95 + ln(cd) × 2.25 + ε
The results of the study on above-ground biomass carbon storage and shading in three species (D. regia, F. nitida, and P. dactylifera) are shown in Figure 4. The results reveal a significant difference in Csa among the species, with F. nitida and P. dactylifera being significantly different but not from D. regia (Figure 5L). In terms of shading, a significant difference was also found among the species, with D. regia and F. nitida being similar but different from P. dactylifera (Figure 5R).
The average above-ground biomass carbon storage Csa, for D. regia trees was 179 kg C with an average shaded area of 42 m2. (See Table 6.) Significant differences were found for the Csa of F. nitida amongst the age categories (p < 0.001), with an average ranging from 35 to 420 kg C. The shaded area of F. nitida increased from 20 m2 for young trees (<15 years) to 69 m2 for old trees (>15 years). The difference in shade density for F. nitida was not significant between age categories (p = 0.29). The above-ground biomass carbon storage of P. dactylifera did not show significant differences between age categories (p = 0.11), with an average above-ground biomass carbon storage ranging between 77.7 and 93 kg C. The average shade area for P. dactylifera showed a significant difference between age categories (p < 0.001), but shaded density was not significant (p = 0.33).
The main effects of plant growth site for D. regia on above-ground biomass carbon storage were significant (p = 0.01) but were not significant for shaded area and shade density (p = 0.28 and p = 0.16), respectively (see Table 7). Similarly, the effects of plant growth site on the ecosystem services of P. dactylifera were not significant for above-ground biomass carbon (p = 0.88), shaded area (p = 0.84), and shade density (p = 0.37), respectively, across different plant sites such as street trees, parking lot trees, and public place trees. Nevertheless, the effects of the plant growth site on above-ground biomass carbon storage and shaded area were significant (p = 0.03) for F. nitida, but not on shade density (p = 0.76).

4. Discussion

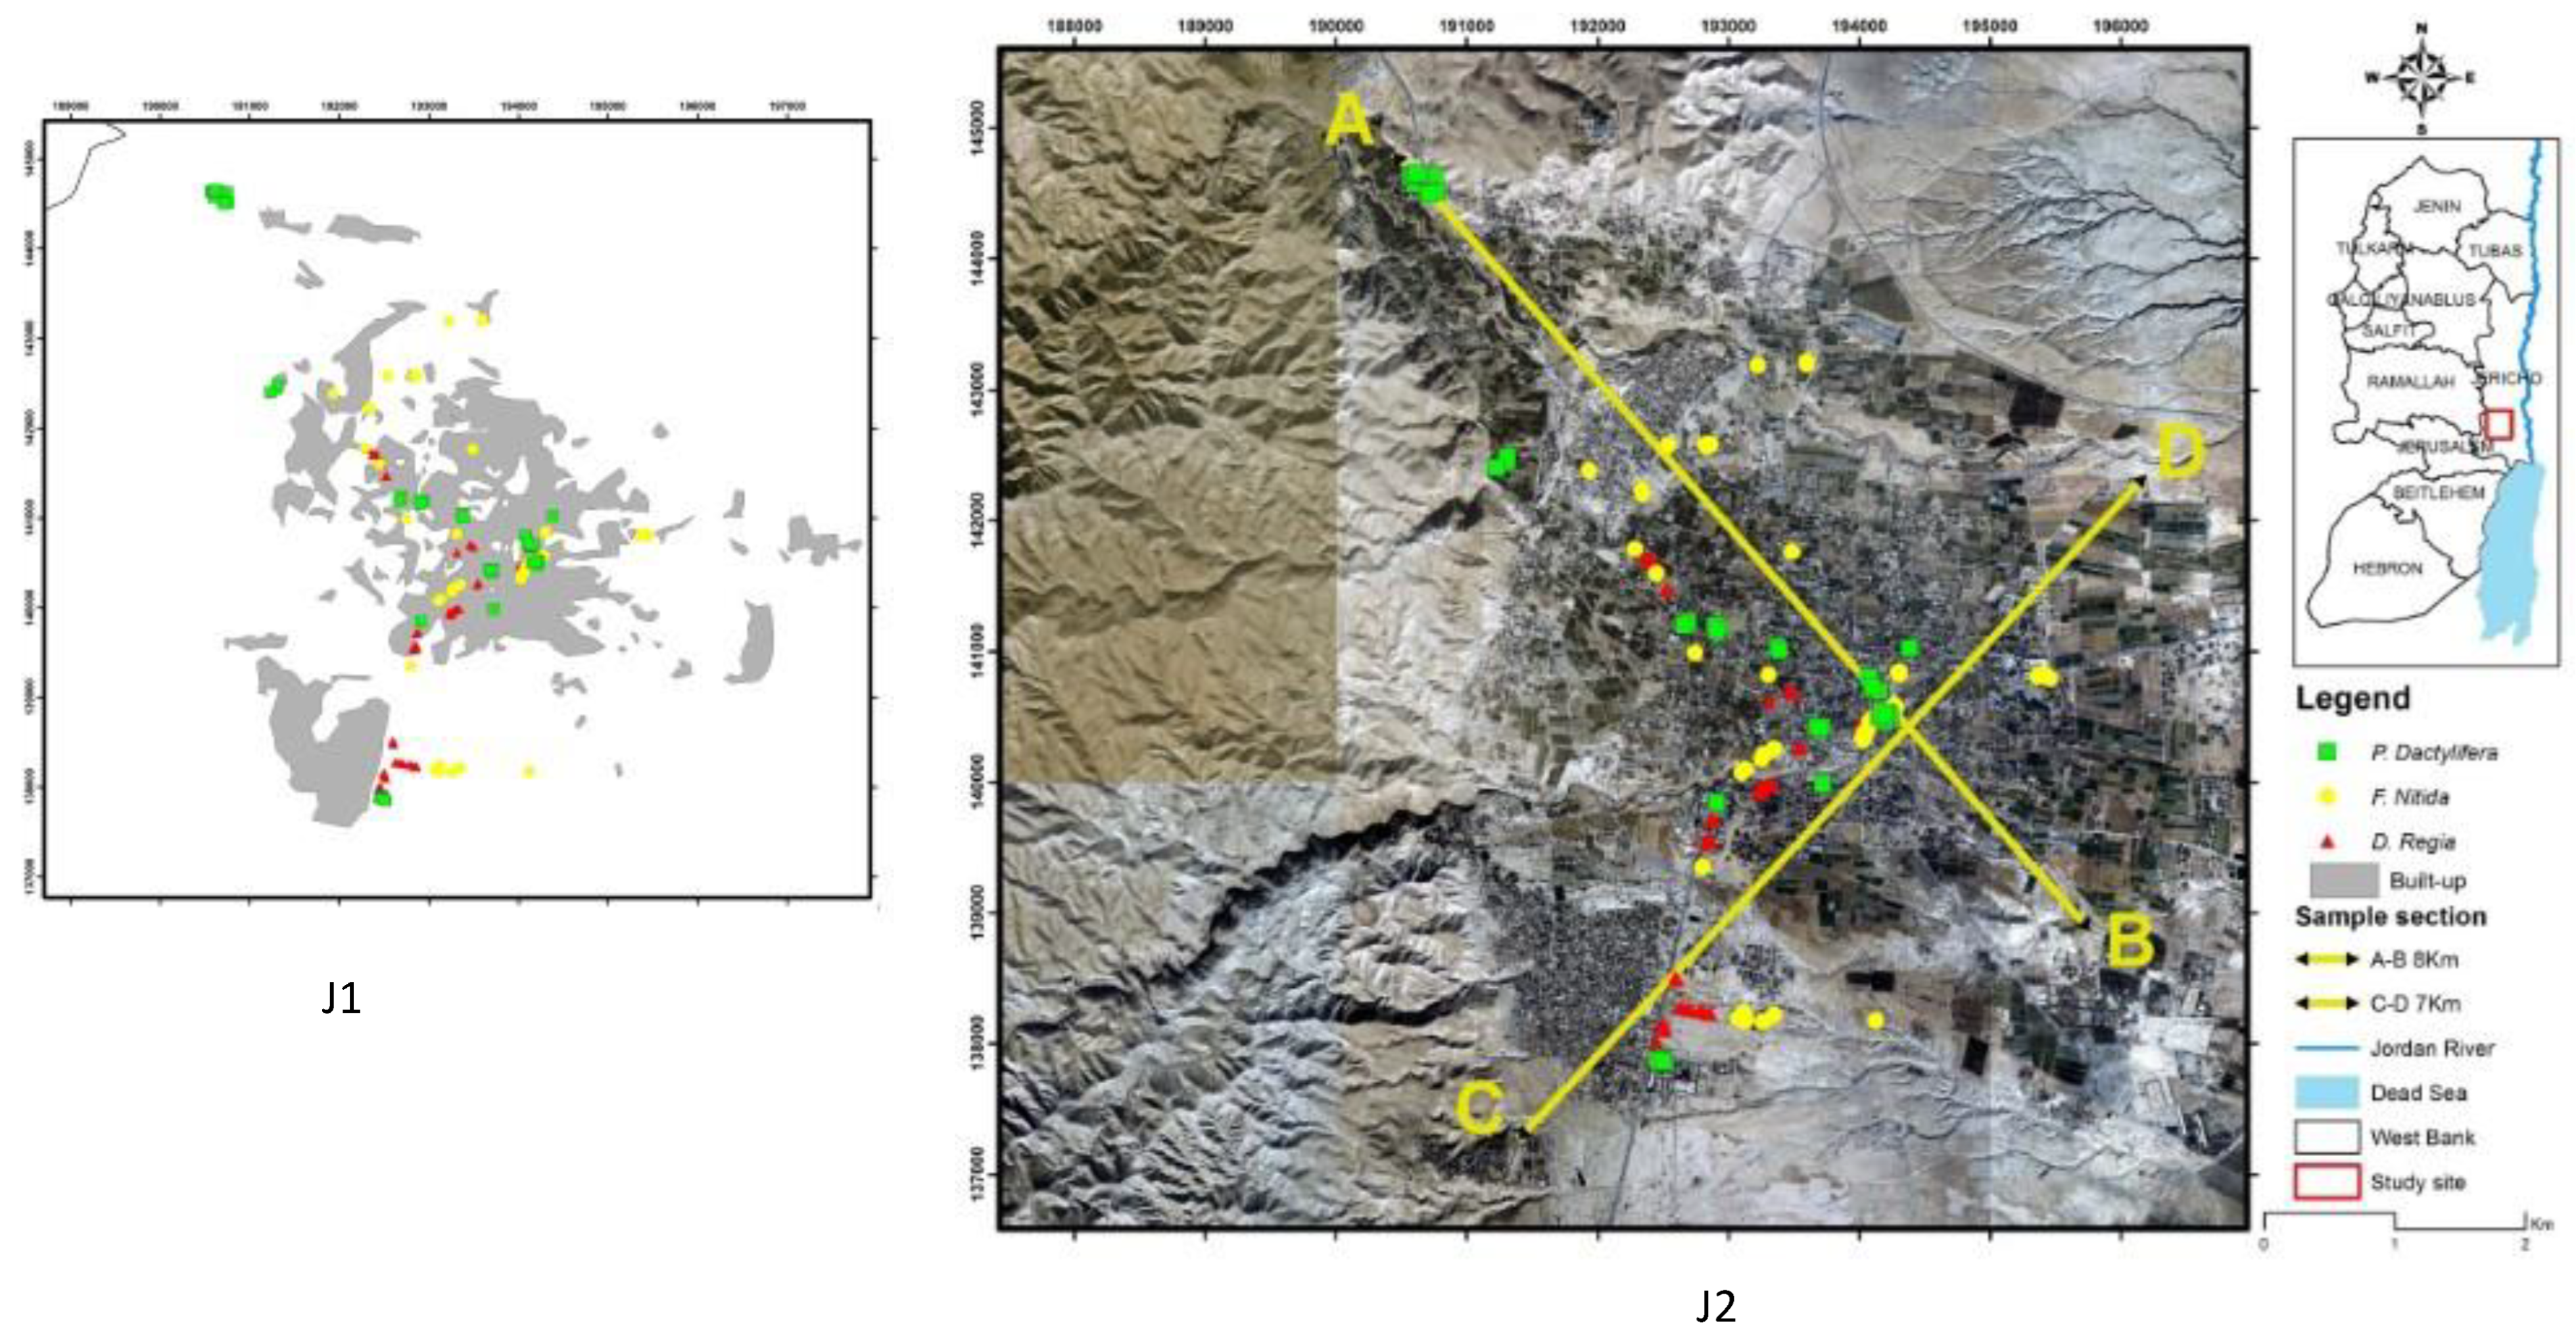
A quantitative understanding of the structure and dimensions of urban trees is critical to better predict tree ecosystem services. However, the relationships between tree structure and ecosystem services in arid regions are poorly understood. Therefore, we applied several possible numerical approaches to calculate the structure and ecosystem services of trees. We analyzed the dependency of tree structure on dbh and age and the dependency of LAI and tree structure on three common urban trees in the arid city of Jericho. We also studied the effect of the different urban planting locations and tree pits on urban trees’ dimensions and on their ecosystem services.
The study outcomes provide a basic understanding for further research on the relationship between urban trees structure and ecosystem services in arid regions. It offers valuable insights into the growth patterns of arid urban trees, (e.g., dbh, crown dimension, and age) and their ability to acclimate (by showing growth efficiency that is not native to this region, for example, F. nitida and D. regia). Additionally, an allometric model was built to visualize the impacts of the tree structural variables on the ecosystem services, such as above-ground biomass carbon storage and the shade potential of urban trees based on the relationship between tree structure and ecosystem services. The study highlights the important role of urban trees in providing ecosystem services in arid regions and offers valuable insights for city planners and urban managers in their efforts to improve urban tree selection and create sustainable and resilient urban ecosystems in arid cities.

4.1. Relationship between Structural Tree Parameters (dbh, Age, Tree Pit Surface Area, and Tree Urban Location)

The results indicated a moderate to strong relationship between age and tree structure for F. nitida (R2 = 0.3–0.61), which is slightly weaker than the relationships obtained by Moser et al. [39] for three different urban tree species in central Europe. Our results for P. dactylifera and D. regia show a weak and nonsignificant proportion of variance between age and tree structural variables in both species (R2 ≤ 0.06).
The availability of resources limited annual precipitation, competition for above- and below-ground space, and poor soil quality, influence the relationship between age and dbh [41,
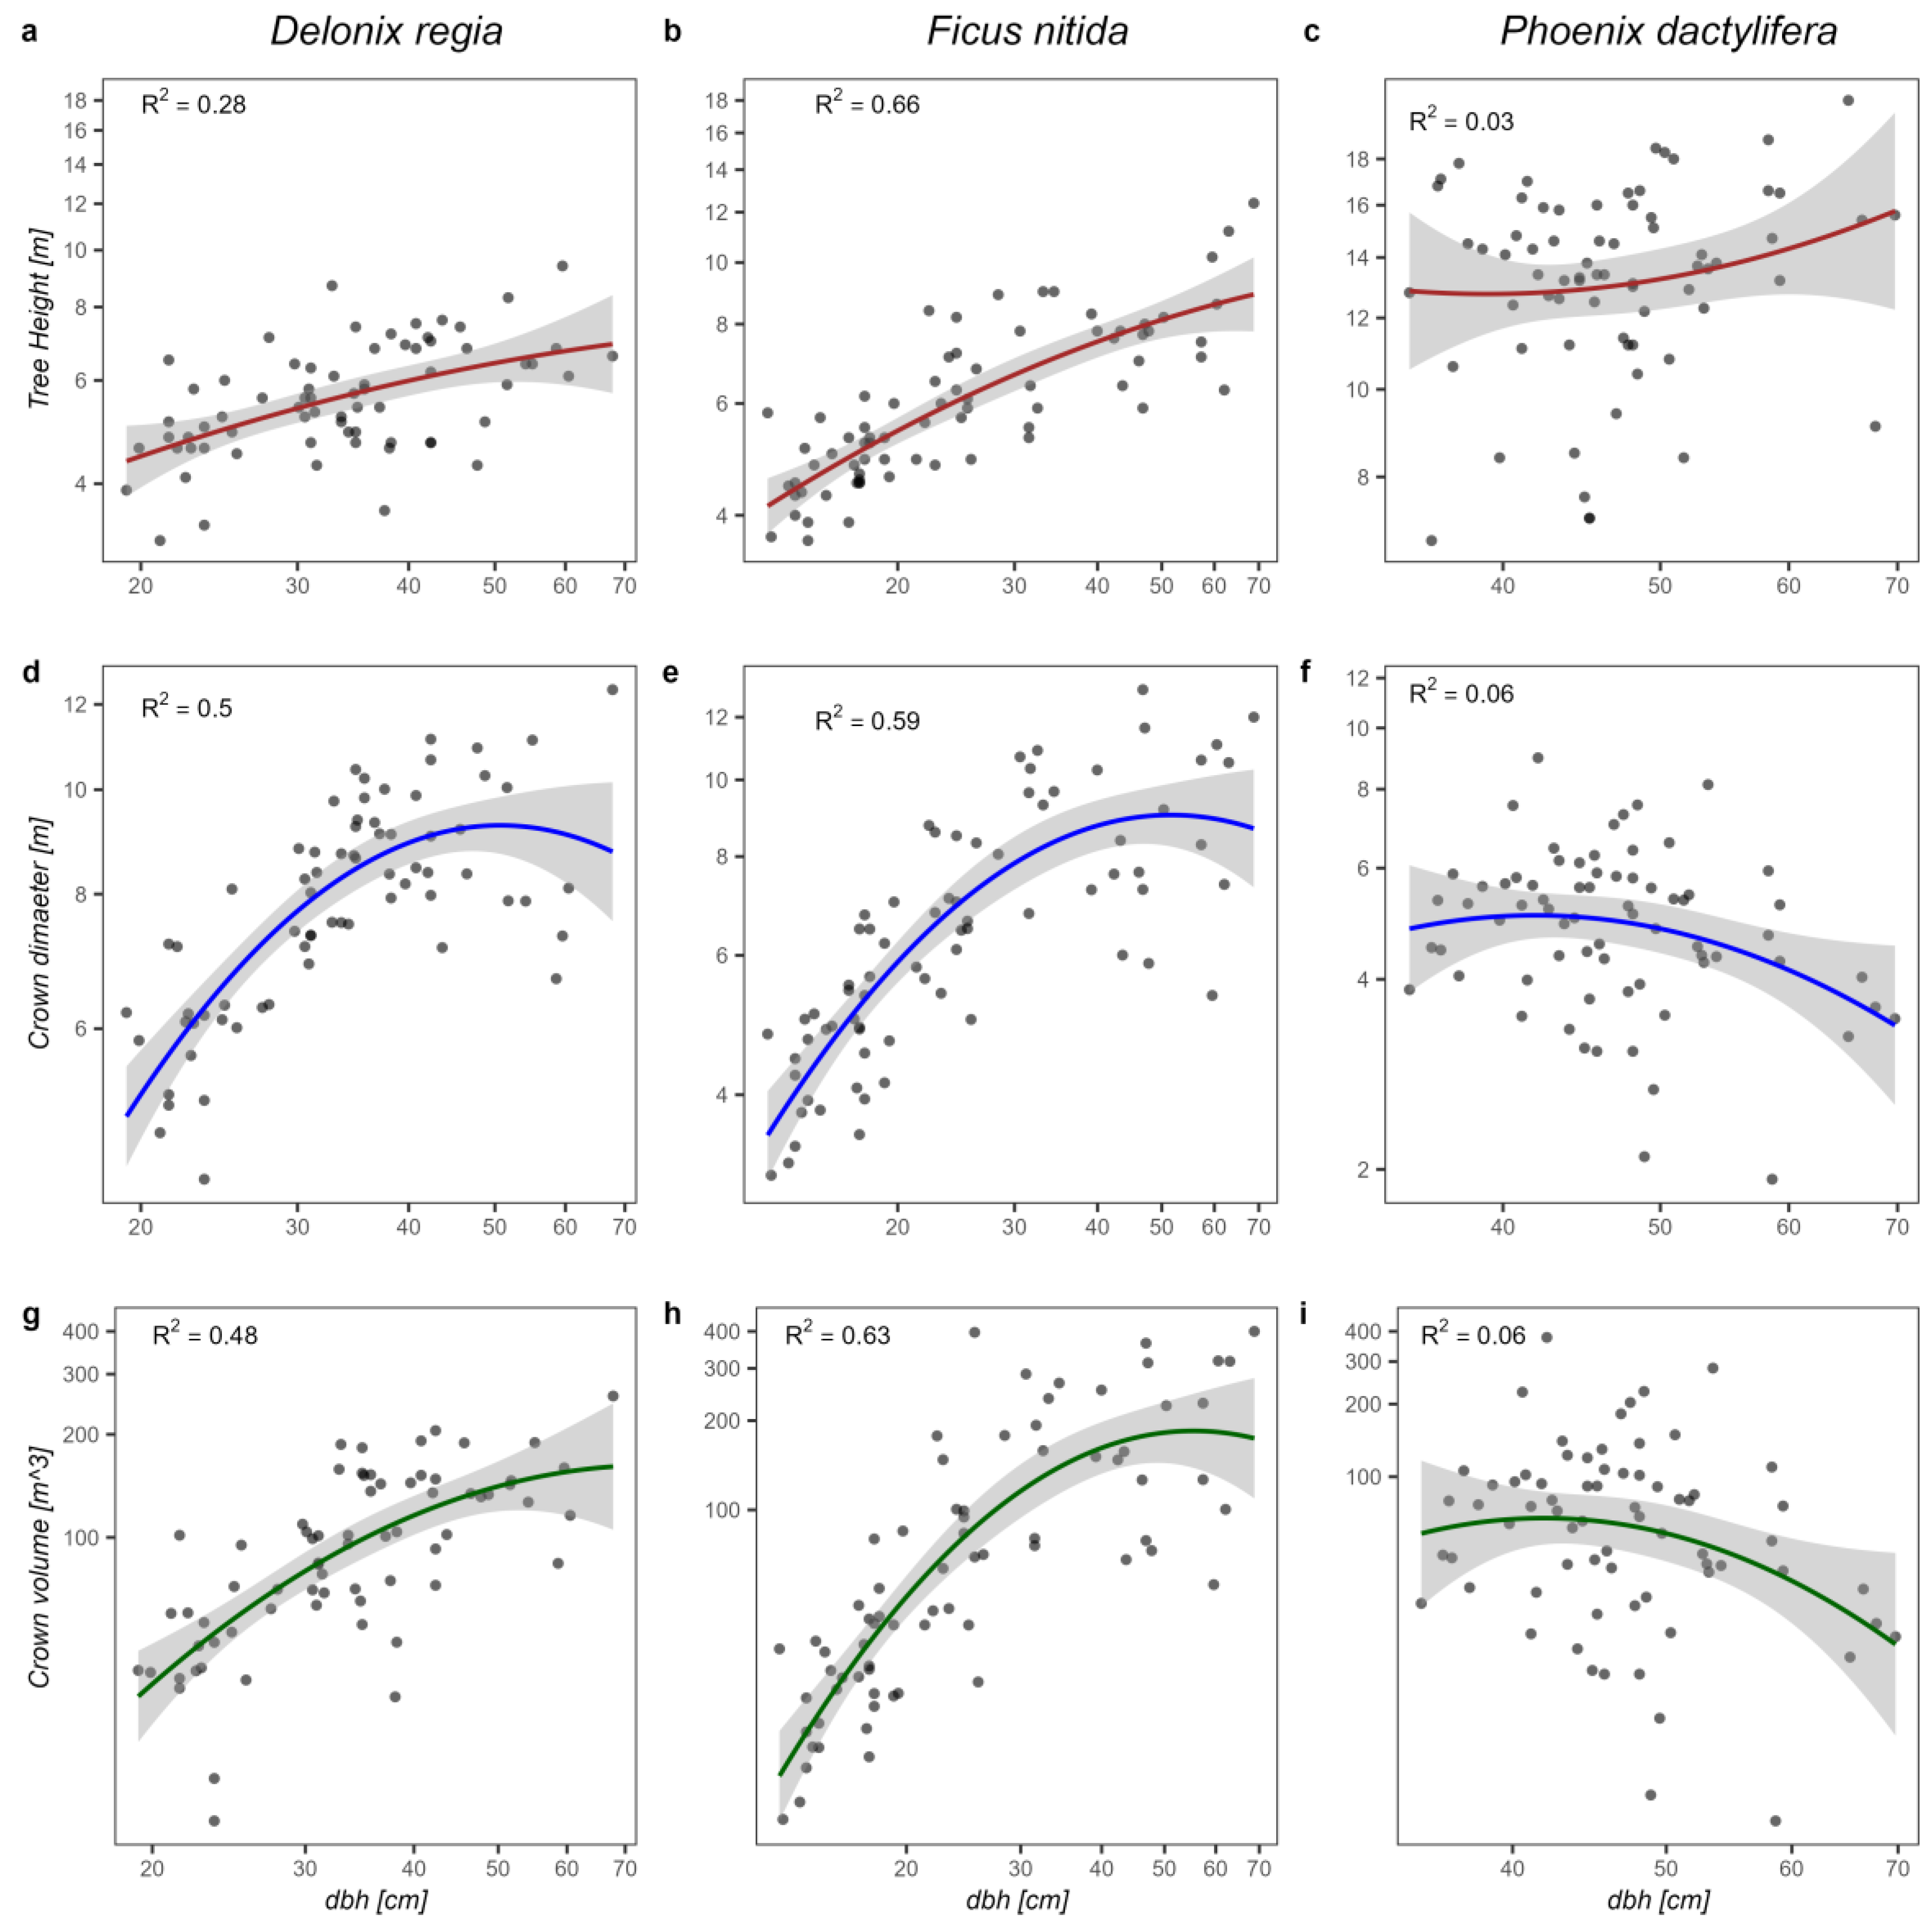
81]. The stem diameter at breast height with tree height and crown dimension shows strong to moderate relationships for F. nitida, but the relationship was slightly weaker in D. regia, as a light-demanding and shade-intolerant tree, whereas F. nitida is light-demanding but partially shade-tolerant [61]. Light-demanding tree species have weaker stem diameter and crown volume relationships [3]. The growth allocation of trees can greatly change in response to light availability [82], which also supports our results. The results indicate that street trees, which are often planted in close proximity to one another, experience increased competition for sunlight, particularly when their crowns come into contact with each other. Light availability is a critical factor that can influence the growth and development of trees. Light-demanding tree species, such as those that typically grow in open habitats, require high levels of sunlight to thrive. Specifically, these trees may allocate more resources to the production of leaves and branches, which can increase their ability to capture sunlight and produce energy. This may result in weaker stem diameter and crown volume relationships [3].
The tree structural relationships of D. regia illustrate a moderate trend that is slightly weaker than those of the studies conducted by Arzai et al. [50], who investigated the connections among canopy width, tree height, and dbh of various urban tree species, finding a strong correlation between tree height and crown diameter with dbh, as an adaptive tree species. This difference is possibly based on the natural climate of the study area, which is tropical [83].
Many other factors, such as annual pruning to shape the tree, especially at an early stage [84], and the removal of damaged, dead, dried, and crossing branches [85], can also affect crown dimension–dbh relationships. Pruning mature trees may be for reasons of shape, tree health, aesthetics, safety, or clearance from infrastructure [86]. The correlation between stem diameter and the crown dimension of P. dactylifera was nonsignificant. As a monocotyledonous plant, P. dactylifera lacks the ability to form a vascular cambium, a meristem tissue that allows for secondary growth in dicotyledonous plants. The vascular cambium is responsible for the formation of new layers of xylem and phloem, which contribute to the increase in diameter of the plant’s stem or trunk over time. Without the formation of a vascular cambium, the date palm does not undergo regular secondary growth and does not exhibit the characteristic increase in diameter [64]. This is in line with the results of Issa et al., [40], whose regression coefficient shows weak but significant relationships between dbh and crown area for P. dactylifera.
Generally, tree samples were selected from different urban locations, that typically suffer from a scarcity of water due to the lack of a regular irrigation system. Our results show a significant difference in dbh in the tree planting site for F. nitida, and a significant difference in dbh and age in the tree planting site for D. regia.
In Jericho City, many irrigation patterns exist (water transportation tanks, manual plastic tubes, normal irrigation systems, and normal water buckets). Additionally, some street trees are situated close to agricultural farms that provide them with resources (water and nutrition).
However, the research of Coombes et al. [87] found that the site factors had very little effect on the allometric relationship between dbh and crown diameter. However, the results presented showed that the difference in irrigation patterns and the distribution of nutrient resources for trees in Jericho may lead to different growth patterns in urban areas; therefore, this may be the reason for the different ratio of tree structural relationships. In addition, the results showed differences in F. nitida, in canopy diameter, and volume between parking lot and street trees due to tree size variations. For D. regia trees in public places, the trees vary in size as well. The trees in the public place (e.g., garden) are older than the trees in the street, but there were no significant differences in P. dactylifera at all, and the reasons behind the fact that the overall mean of P. dactylifera tree ages in different urban locations of the city are not significantly different. Furthermore, the findings revealed that the relation between the tree pit surface area and tree structure for F. nitida and P. dactylifera are weak but statistically significant, but is not significant in D. regia. The possible reason behind that uneven distribution of tree samples selected, e.g., 62 of D. regia, is that most of the street trees had a very small tree pit surface area. Even if they were irrigated by the above irrigation patterns, the amount of water to reach the plant would be very small, especially in summertime with high evaporation rates.

4.2. Leaf Area Index of the Three Urban Tree Species

The results show a nonsignificant and weak proportion of variance between LAI and structural parameters. The R2 values were close to zero for all variables. Özbayram et al. [88], in their research, studied the correlation between LAI values and tree variables in Turkey, and a negative correlation in black pine stands was found (i.e., stand age, mean diameter) and a positive correlation in red pine (i.e., stand age, mean diameter, top height, green tree height, and basal area). Özbayram et al. concluded that the leaf area index (LAI) varies according to species. The LAI results were 5.4 for F. nitida, 5.8 for D. regia, and 2.9 for P. dactylifera. These results can be placed in comparison with those of Liu et al., [89], who found a mean LAI of value 4.73 ± 0.40 for D. regia and 5.00 ± 0.47 for F. nitida, whereas Lin et al. [90] found an LAI of 6.11 for Ficus macrocarpa and 5.05 for Ficus elastica, and Awal et al. found an LAI of 1.7 for P. dactylifera [91]. A higher leaf area index means higher photosynthesis and efficient use of light, which indicates higher carbon capturing ability and stocks [92].

4.3. Ecosystem Services of Trees in Arid Cities

Urban trees provide ecosystem services [93,94], which can significantly improve the climate in cities [
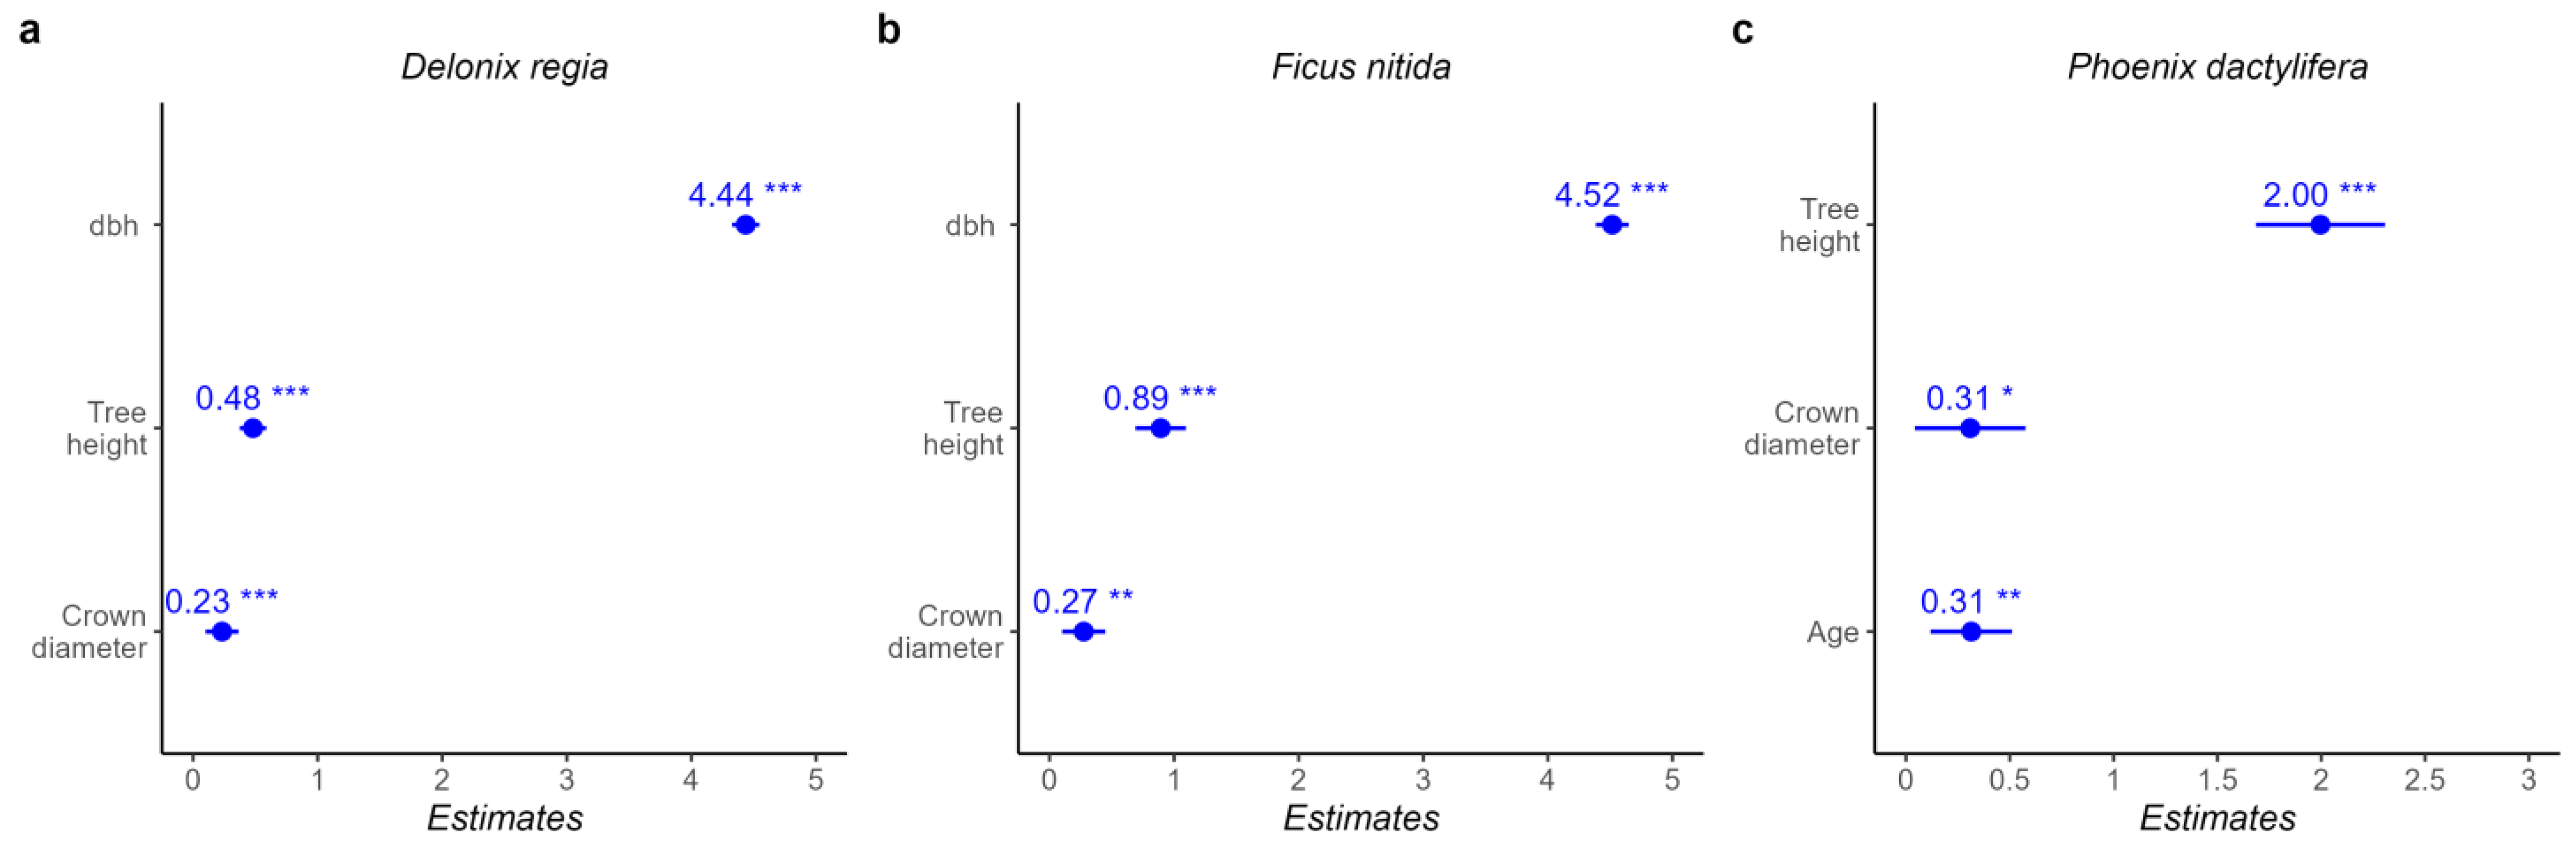
95]. The study estimated above-ground biomass carbon storage and shading potential. Results showed that tree height, dbh, and crown diameter have a strong relationship with above-ground biomass carbon storage in D. regia and F. nitida. Similarly, tree height, crown diameter, and age have a significant relationship with above-ground biomass carbon storage in P. dactylifera, consistent with prior research, (e.g., Yoon et al. [37]). Issa et al. [96] found that the amount of CO2 absorbed is proportional to the tree component, above-ground biomass can be highly estimated by the green plant component (e.g., canopy area) and tree stems as variables measured in the field. Further, Betemariyam et al. [97], found that P. dactylifera trees older than 20 years had a mean above-ground biomass carbon stock of 159.50 kg/plant, in date palm on a farm in north-eastern Ethiopia. Issa et al. [
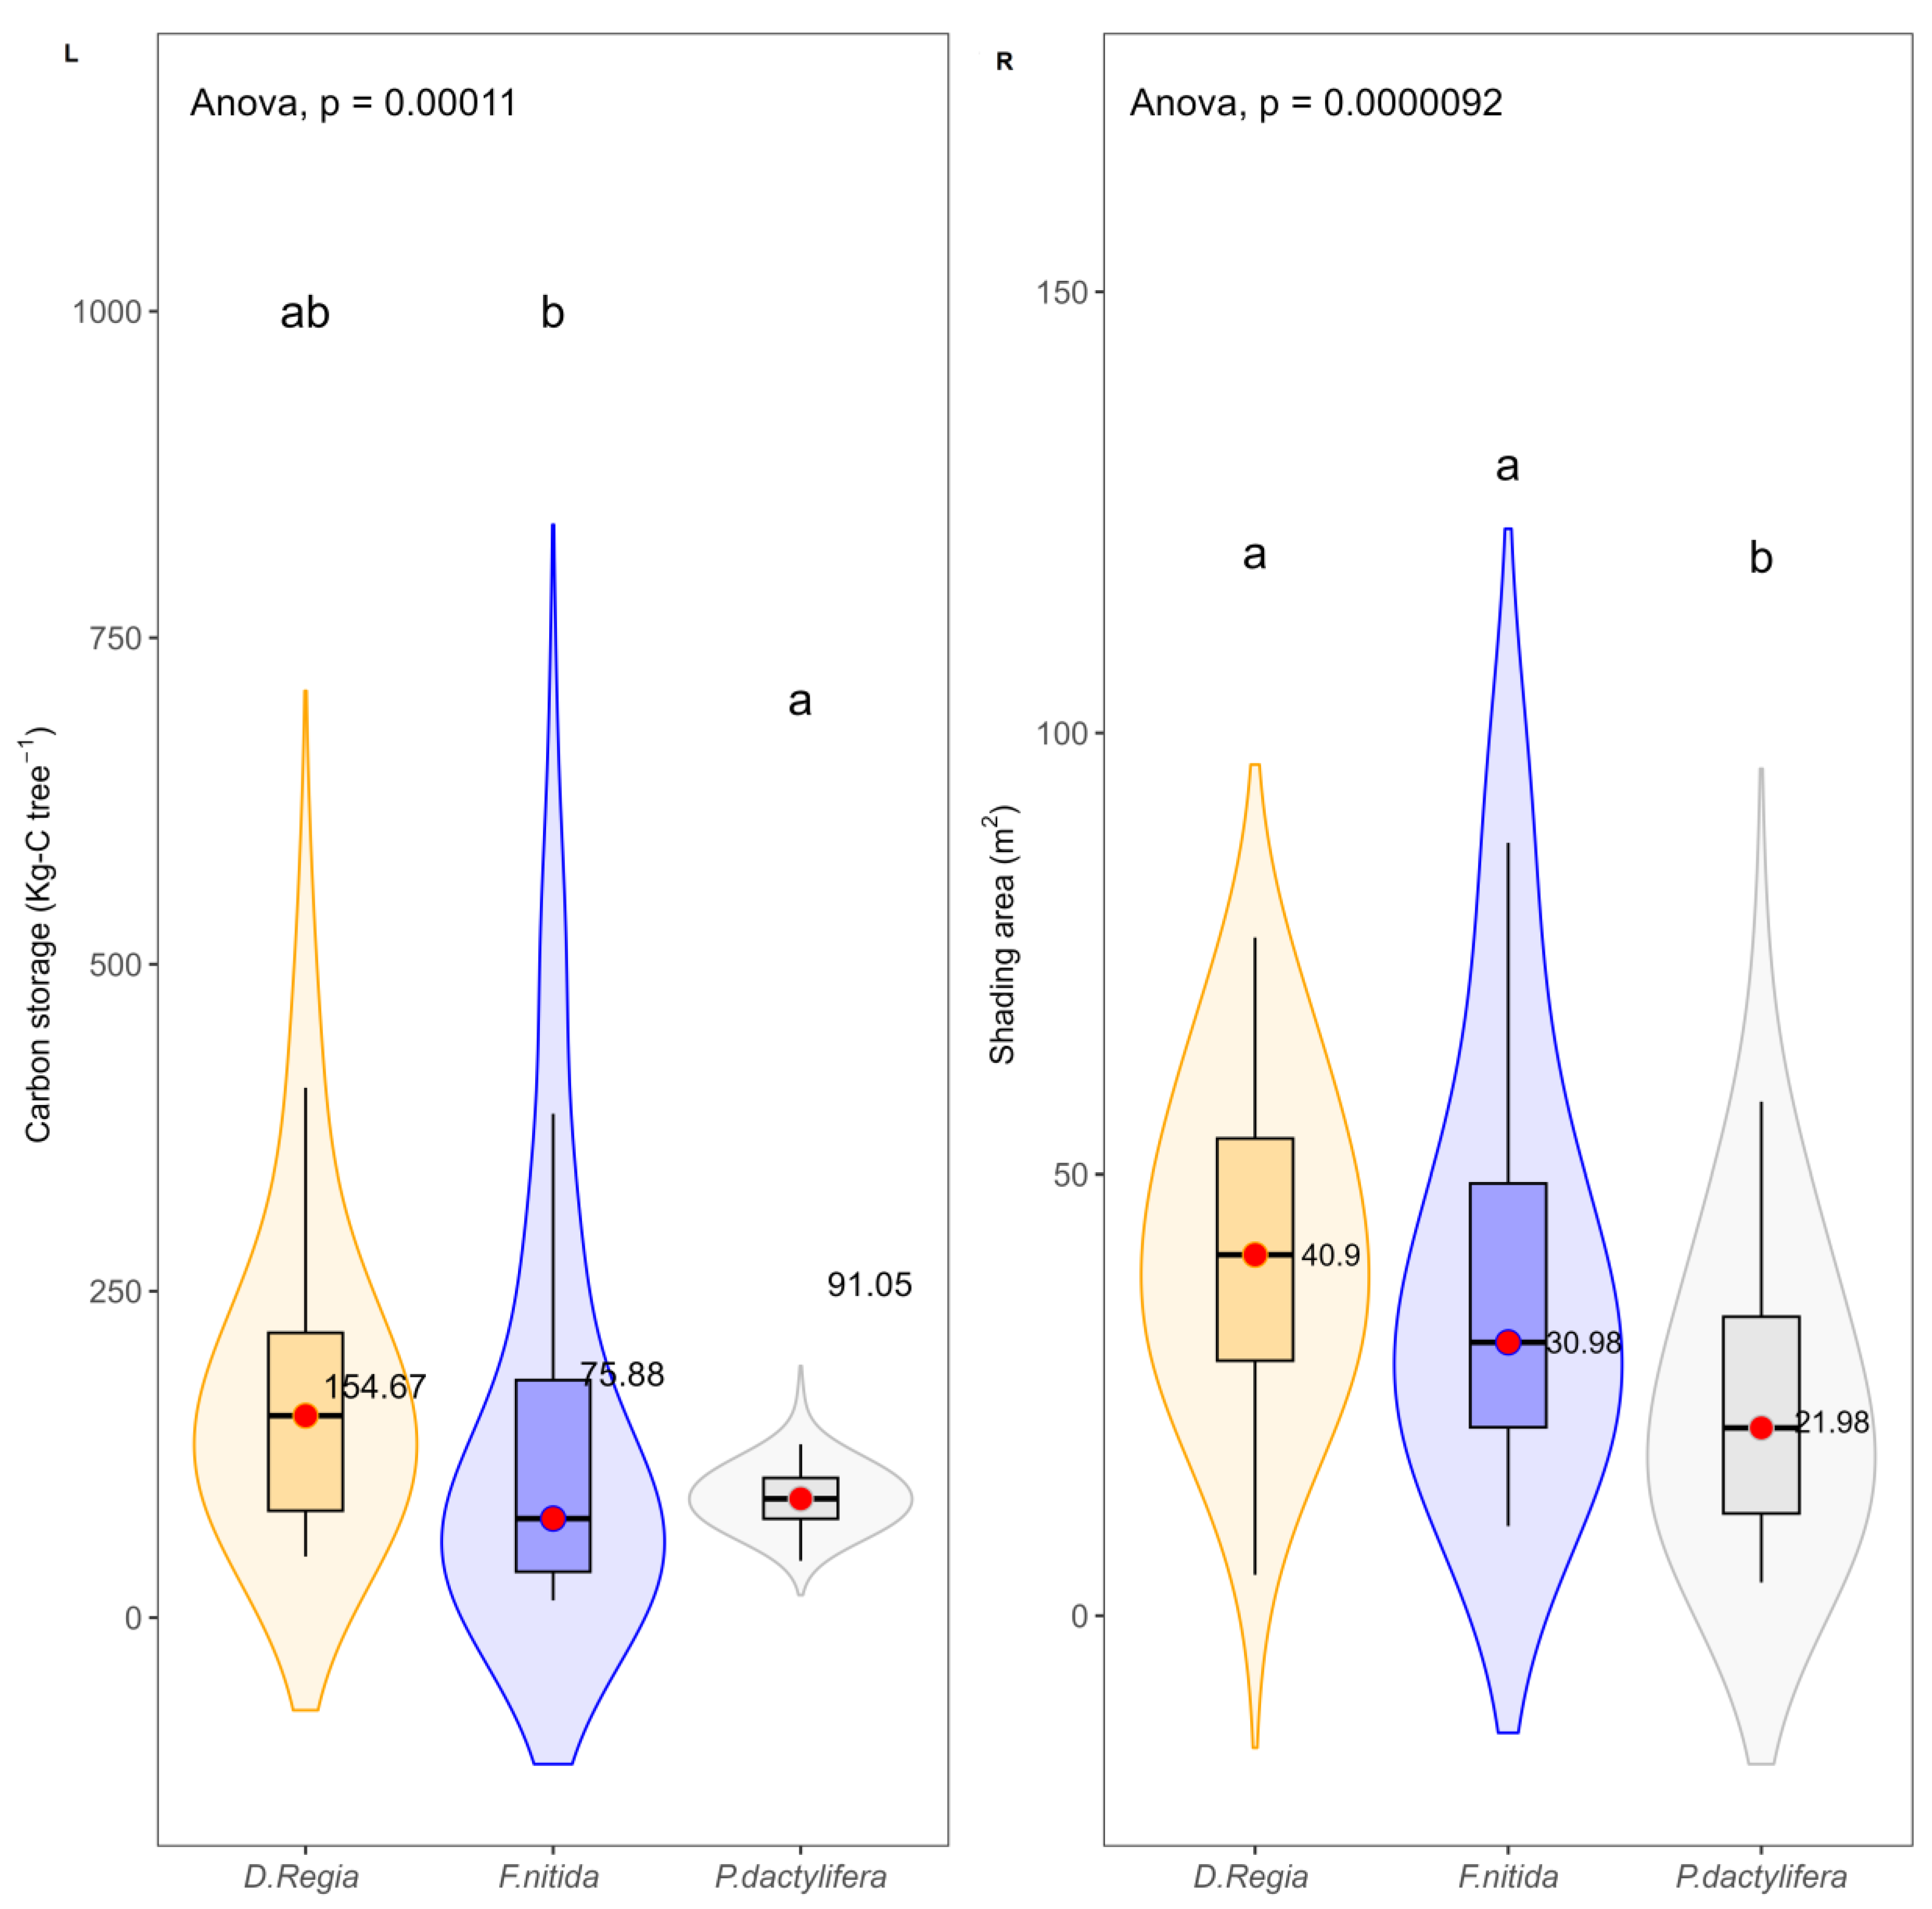
40] found that trunk height and crown diameter are strongly correlated with the age of date palm trees and reported an average carbon storage of 225 kg C of the palm trees in Abu Dhabi, United Arab Emirates, for trees older than 20 years. The results show the average carbon storage of P. dactylifera is higher than the averages of D. regia and F. nitida; these findings support that P. dactylifera trees in this study contribute to emission reduction and carbon sink enhancement.
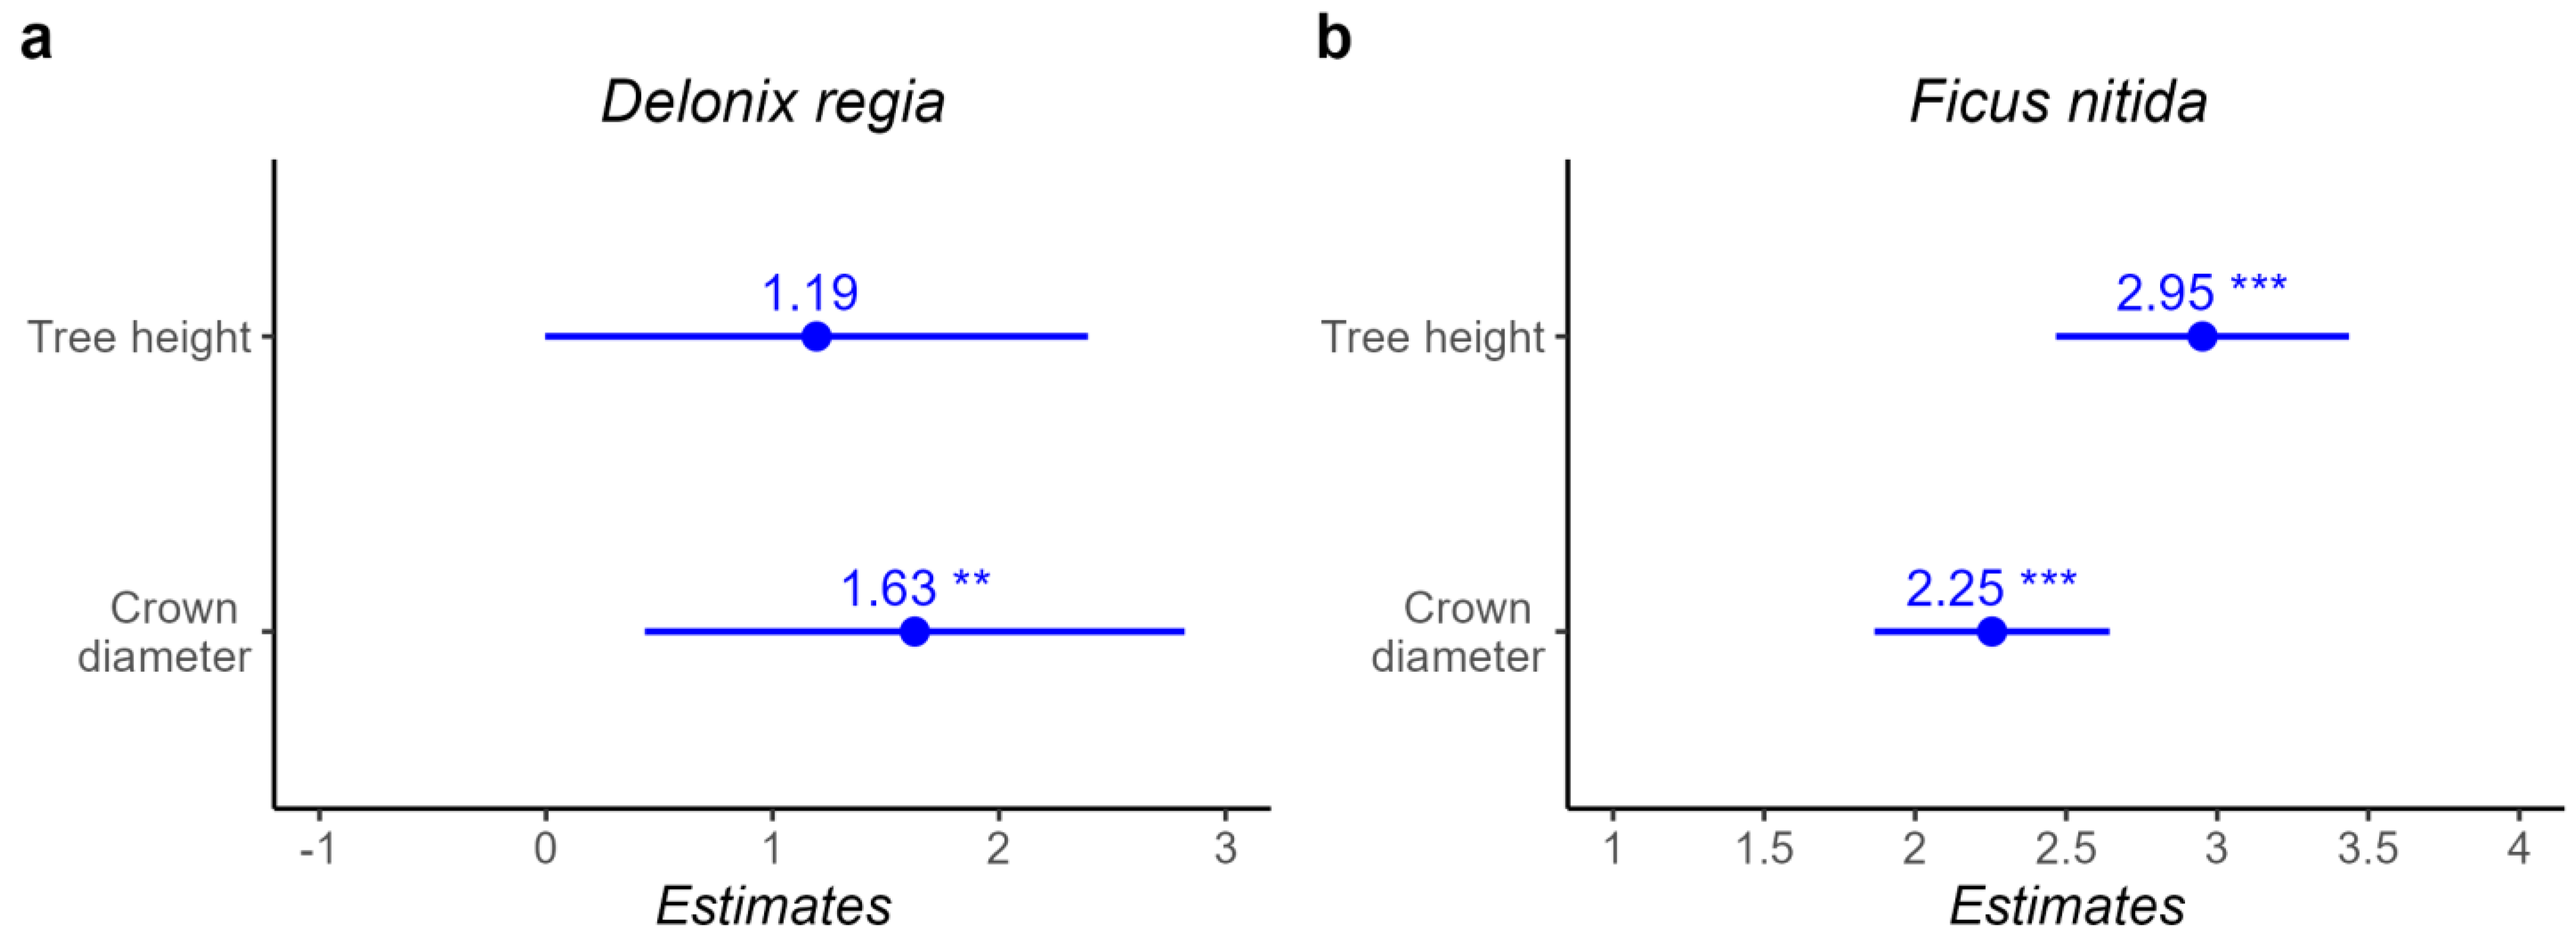
Higher above-ground biomass carbon storage averages for D. regia were found in public places and parking lots compared with street trees, whereas P. dactylifera trees provided similar rates at all sites. The second ecosystem service is shade potential. The results showed a statistically significant and strong relationship between tree height, diameter at breast height and crown diameter with the shaded area of D. regia and F. nitida, and a nonsignificant relationship with the shaded area of the P. dactylifera tree. This could be due to its monocotyledon nature. The results of the P. dactylifera shade area show a smaller value for older trees, where the most likely reason could be leaf senescence due to age. With age, trees may lose some leaf area due to leaf senescence. Another reason could be leaf pruning each year.
Different shaded areas and shading densities exist among urban tree species. F. nitida and D. regia have the highest shading potential compared to P. dactylifera. Shade density is particularly important for lowering surface temperatures and improving thermal comfort [90,98,99]. F. nitida and D. regia have higher shading potential compared to P. dactylifera, as produced by their crown canopies. A possible reason is that the sampled trees are mixed between taller trees with narrow canopies and shorter trees with wider canopies. This result is in line with Armson et al., [6], with the outcome about tree morphology and shade for five different street tree species in Manchester (UK) exhibiting a significant difference between the species’ canopy sizes but nonsignificant differences between tree canopies’ shaded areas. Rahman et al. [100] demonstrated that urban trees can mitigate temperatures underneath canopy surfaces during the day through shading.
The potential cooling effect of tropical trees is higher than that of other species, e.g., Ficus retusa trees can reduce the temperature values during the summer by 4 °C, while the cooling effect for date palm trees (P. dactylifera) is only 1.5 °C, which is characterized by a small canopy [101]. Reflecting the weakness of P. dactylifera as a tree for shading benefits and the higher shading potentials of F. nitida and D. regia, which are characterized as tropical trees in arid cities, shading measures have special importance, where the sun has intense solar radiation, leading to higher air temperatures that can negatively affect most human daily activities [102]. Based on previous studies, the importance of cooling by shading in an arid city is particularly important where solar radiation is intense, leading to higher temperatures that can negatively impact human activities. Overall, this study provides valuable insights into the ecosystem services provided by urban trees, specifically carbon storage and shading potential, and their correlation with structural variables.

5. Conclusions

In conclusion, this study analyzed the growth, ecosystem services, and tree structural characteristics of three common urban trees (i.e., D. regia, F. nitida, and P. dactylifera) in the arid city of Jericho using a numerical approach of a City Tree model. The results showed that tree structural variables (i.e., tree height, crown volume, and crown diameter) have a strong to moderately significant relationship with dbh for D. regia and F. nitida. The results also show no relationships between leaf area index and tree structure for all tree species’ structural variables, while showing a statistically moderate relationship for tree structure with age for F. nitida, and no relationship for all other tree species. The tree pit surface area also showed weak significant relationship with tree structure for F. nitida and P. dactylifera, but not for D. regia. Different urban plant growth location also induced various influences among the three species; the results show a significant influence on tree structure for D. regia and F. nitida, while the influence was not significant on P. dactylifera.
D. regia has higher shading potential and above ground biomass carbon storage, compared to F. nitida and P. dactylifera, respectively, as common urban trees in the city. The results may vary based on species and site conditions. Our results are similar to research from other climates; for example, Moser et al. (2015) carried out similar research in Germany (temperate region) and found strong to moderate relationships between crown dimensions and stem diameter, which is identical to our results except for P. dactylifera. Although results can vary based on species and site conditions, overall patterns are comparable, which indicates that similar results are also applicable to other climate regions. However, species functionality should be considered.
Based on these findings for the selected ecosystem services (above-ground biomass carbon storage and shade potential), it is recommended that D. regia, F. nitida and P. dactylifera be considered for future urban greening in arid cities, with D. regia outperforming the others. However, further research in other non-arid regions and climate-sensitive growth models are needed to better understand the growth and adaptation capacity of these trees in changing climates. We recommend conducting further research on the relationship between tree species’ dimensions and the ecosystem services they provide, with a specific focus on urban areas in Mediterranean and/or arid climates.

Supplementary Materials

The following supporting information can be downloaded at https://www.mdpi.com/article/10.3390/f14040671/s1. Table S1: Means and standard deviation [SD] of all measured and calculated trees’ structural data D. regia, F. nitida, and P. dactylifera. Where n—number of samples, dbh—diameter at breast height, h–tree height, cl—crown length, cd—crown diameter, cpa—crown projection area, and cv—crown volume, respectively. Table S2: Results of the regression analysis of LAI, the predictor variables, and the tree variables (dbh, h, cd, and cv) as a response and the regression equation (y) = a + b × ln(x). The table below lists the determination of R2, standard error, and p-values. Table S3: Mean of the tree pit and related standard error to the growth site for D. regia, F. nitida, and P. dactylifera, as well as the p-values for each ANOVA. Mean values in the same column differ significantly when followed by different letters. Table S4: Results of the summary of the linear mixed model regression analysis of a carbon fixation and the predictor variables, and the tree variables (h, dbh, cd, and age) as a response, and the regression equation ln y = a + b 1 × ln x 1 + b 2 × ln x 2 + b 3 × ln x 3 +   ε . The table below lists the determination of R2, τ00: variance of random intercept, N site refers to the number of distinct groups or sites in the data, where each group may have multiple observations, N T.pit refers to the number of total observations or data points in all the sites, which is equal to the sum of the number of observations in each site, σ2 refers to the residual variance, and p-values. Table S5: Results of the summary of linear mixed model regression analysis of a shaded area and the predictor variables, and the tree variables (h, dbh, cd, and age) as a response and the regression equation n y = a + b 1 × ln x 1 + b 2 × ln x 2 +   ε . The table below lists the determination of R2, τ00: variance of random intercept, N site refers to the number of distinct groups or sites in the data, where each group may have multiple observations, N T.pit refers to the number of total observations or data points in all the sites, which is equal to the sum of the number of observations in each site, σ2 refers to the residual variance, and p-values.

Author Contributions

Conceptualization, A.A. and T.R.; Methodology, A.A., T.R. and M.A.R.; Formal Analysis, A.A.; Writing—Original Draft Preparation, A.A.; Writing—Review and Editing, A.A., T.R., A.M.-R., M.A.R., E.F., J.H.S., A.H., M.T., H.P. and S.P.; Visualization, A.A.; Supervision, T.R.; Project Administration, T.R., H.P. and S.P.; Funding Acquisition, T.R., H.P., M.A.R. and S.P. All authors have read and agreed to the published version of the manuscript.

Funding

This research was funded by the German Science Foundation (Deutsche Forschungsgemeinschaft), grant number PR 292/21−1 and PA 2626/3−1, and by the Bavarian State Ministry of the Environment and Consumer Protection, grant numbers TUF01UF−64971 and TLK01UFuE69397.

Data Availability Statement

The data are available on request from the corresponding author.

Acknowledgments

We thank the German Research Foundation—DFG (grant PR292/21-1.), which funded this research as part of the Middle East Collaboration Program. In addition, the authors wish to thank the Jericho Municipality for further help and for facilitating the measurements in the city.

Conflicts of Interest

The authors declare no conflict of interest.

References

  1. Nowak, D.J.; Greenfield, E.J.; Hoehn, R.E.; Lapoint, E. Carbon Storage and Sequestration by Trees in Urban and Community Areas of the United States. Environ. Pollut. 2013, 178, 229–236. [Google Scholar] [CrossRef] [PubMed] [Green Version]
  2. Amoatey, P.; Sulaiman, H.; Kwarteng, A.; Al-Reasi, H.A. Above-Ground Carbon Dynamics in Different Arid Urban Green Spaces. Environ. Earth Sci. 2018, 77, 431. [Google Scholar] [CrossRef]
  3. Troxel, B.; Piana, M.; Ashton, M.S.; Murphy-Dunning, C. Relationships between Bole and Crown Size for Young Urban Trees in the Northeastern USA. Urban For. Urban Green. 2013, 12, 144–153. [Google Scholar] [CrossRef]
  4. Oke, T.R. The Micrometeorology of the Urban Forest. Philos. Trans. R. Soc. Lond. B 1989, 324, 335–349. [Google Scholar] [CrossRef]
  5. TEEB Manual for Cities: Ecosystem Services in Urban Management. The Economics of Ecosystems and Biodiversity (TEEB): Geneva. 2011. Available online: www.teebweb.org/ (accessed on 10 February 2023).
  6. Armson, D.; Stringer, P.; Ennos, A.R.R. The Effect of Street Trees and Amenity Grass on Urban Surface Water Runoff in Manchester, UK. Urban For. Urban Green. 2013, 12, 282–286. [Google Scholar] [CrossRef]
  7. Bowler, D.E.; Buyung-Ali, L.; Knight, T.M.; Pullin, A.S. Urban Greening to Cool Towns and Cities: A Systematic Review of the Empirical Evidence. Landsc. Urban Plan. 2010, 97, 147–155. [Google Scholar] [CrossRef]
  8. Gillner, S.; Vogt, J.; Tharang, A.; Dettmann, S.; Roloff, A. Role of Street Trees in Mitigating Effects of Heat and Drought at Highly Sealed Urban Sites. Landsc. Urban Plan. 2015, 143, 33–42. [Google Scholar] [CrossRef]
  9. Yu, Z.; Yang, G.; Zuo, S.; Jørgensen, G.; Koga, M.; Vejre, H. Critical Review on the Cooling Effect of Urban Blue-Green Space: A Threshold-Size Perspective. Urban For. Urban Green. 2020, 49, 126630. [Google Scholar] [CrossRef]
  10. Bourbia, F.; Boucheriba, F. Impact of Street Design on Urban Microclimate for Semi Arid Climate (Constantine). Renew. Energy 2010, 35, 343–347. [Google Scholar] [CrossRef]
  11. Huang, J.; Yu, H.; Dai, A.; Wei, Y.; Kang, L. Drylands Face Potential Threat under 2 °C Global Warming Target. Nat. Clim. Chang. 2017, 7, 417–422. [Google Scholar] [CrossRef]
  12. Rötzer, T.; Rahman, M.A.; Moser-Reischl, A.; Pauleit, S.; Pretzsch, H. Process Based Simulation of Tree Growth and Ecosystem Services of Urban Trees under Present and Future Climate Conditions. Sci. Total Environ. 2019, 676, 651–664. [Google Scholar] [CrossRef] [PubMed]
  13. Foster, R.S.; Blaine, J. Urban Tree Survival: Trees in the Sidewalk. J. Arboric. 1978, 4, 14–17. [Google Scholar] [CrossRef]
  14. Beatty, R.A.; Heckman, C.T. Survey of Urban Tree Programs in the United States. Urban Ecol. 1981, 5, 81–102. [Google Scholar] [CrossRef]
  15. Jim, C.Y. Soil Compaction at Tree-Planting Sites in Urban Hong Kong. In Proceedings of an International Workshop on Tree Root Development in Urban Soils; International Society of Arboriculture: Hong Kong, 1998; pp. 166–178. [Google Scholar]
  16. Kjelgren, R.K.; Clark, J.R. Microclimates and Tree Growth in Three Urban Spaces. J. Environ. Hortic. 1992, 10, 139–145. [Google Scholar] [CrossRef]
  17. Day, S.D.; Bassuk, N.L.; Van Es, H. Effects of Four Compaction Remediation Methods for Landscape Trees on Soil Aeration, Mechanical Impedance and Tree Establishment. J. Environ. Hortic. 1995, 13, 64–71. [Google Scholar] [CrossRef]
  18. Sayad, B.; Alkama, D.; Rebhi, R.; Menni, Y.; Ahmad, H.; Inc, M.; Sharifpur, M.; Lorenzini, G.; Azab, E.; Elnaggar, A.Y.; et al. High-Frequency Densitometry—A New Method for the Rapid Evaluation of Wood Density Variations. Urban For. Urban Green. 2018, 7, 1–7. [Google Scholar] [CrossRef]
  19. Morgenroth, J.; Buchan, G.D. Soil Moisture and Aeration beneath Pervious and Impervious Pavements. J. Arboric. 2009, 35, 135. [Google Scholar] [CrossRef]
  20. Rahman, M.A.; Stringer, P.; Ennos, A.R. Effect of Pit Design and Soil Composition on Performance of Pyrus Calleryana Street Trees in the Establishment Period. Arboric. Urban For. 2013, 39, 256–266. [Google Scholar] [CrossRef]
  21. Rötzer, T.; Moser-Reischl, A.; Rahman, M.A.; Grote, R.; Pauleit, S.; Pretzsch, H. Modelling Urban Tree Growth and Ecosystem Services: Review and Perspectives. Prog. Bot. 2021, 82, 405–464. [Google Scholar]
  22. Sanders, J.; Grabosky, J.; Cowie, P. Establishing Maximum Size Expectations for Urban Trees with Regard to Designed Space. Arboric. Urban For. 2013, 39, 68–73. [Google Scholar] [CrossRef]
  23. Clark, J.R.; Kjelgren, R. Water as a Limiting Factor in the Development of Urban Trees. J. Arboric. 1990, 16, 203–208. [Google Scholar] [CrossRef]
  24. Allen, C.D.; Macalady, A.K.; Chenchouni, H.; Bachelet, D.; McDowell, N.; Vennetier, M.; Kitzberger, T.; Rigling, A.; Breshears, D.D.; Hogg, E.H.T. A Global Overview of Drought and Heat-Induced Tree Mortality Reveals Emerging Climate Change Risks for Forests. For. Ecol. Manag. 2010, 259, 660–684. [Google Scholar] [CrossRef] [Green Version]
  25. Chen, Z.; He, X.; Cui, M.; Davi, N.; Zhang, X.; Chen, W.; Sun, Y. The Effect of Anthropogenic Activities on the Reduction of Urban Tree Sensitivity to Climatic Change: Dendrochronological Evidence from Chinese Pine in Shenyang City. Trees 2011, 25, 393–405. [Google Scholar]
  26. Akbari, H.; Pomerantz, M.; Taha, H. Cool Surfaces and Shade Trees to Reduce Energy Use and Improve Air Quality in Urban Areas. Sol. Energy 2001, 70, 295–310. [Google Scholar] [CrossRef]
  27. Brune, M. Urban Trees under Climate Change. Clim. Serv. Cent. Ger. 2016, 123. [Google Scholar]
  28. Farrell, C.; Szota, C.; Arndt, S.K. Urban Plantings: “Living Laboratories” for Climate Change Response. Trends Plant Sci. 2015, 20, 597–599. [Google Scholar] [CrossRef]
  29. Roetzer, T.; Wittenzeller, M.; Haeckel, H.; Nekovar, J. Phenology in Central Europe—Differences and Trends of Spring Phenophases in Urban and Rural Areas. Int. J. Biometeorol. 2000, 44, 60–66. [Google Scholar] [CrossRef] [PubMed]
  30. Gregg, J.W.; Jones, C.G.; Dawson, T.E. Urban Ozone Depletion: Why a Tree Grows Better in New York City. Nature 2003, 424, 183–187. [Google Scholar] [CrossRef]
  31. Kaye, J.P.; Groffman, P.M.; Grimm, N.B.; Baker, L.A.; Pouyat, R.V. A Distinct Urban Biogeochemistry? Trends Ecol. Evol. 2006, 21, 192–199. [Google Scholar] [CrossRef]
  32. Jochner, S.; Alves-Eigenheer, M.; Menzel, A.; Morellato, L.P.C. Using Phenology to Assess Urban Heat Islands in Tropical and Temperate Regions. Int. J. Climatol. 2013, 33, 3141–3151. [Google Scholar] [CrossRef]
  33. George, K.; Ziska, L.H.; Bunce, J.A.; Quebedeaux, B.; Hom, J.L.; Wolf, J.; Teasdale, J.R. Macroclimate Associated with Urbanization Increases the Rate of Secondary Succession from Fallow Soil. Oecologia 2009, 159, 637–647. [Google Scholar] [CrossRef] [PubMed]
  34. McPherson, E.G. Tree Guidelines for Coastal Southern California Communities; Local Government Commission: Sacramento, CA, USA, 2000.
  35. Chreptun, C. Kronenstruktureigenschaften von Linden Und Robinien in München: Anwendungen Des Terrestrischen Laserscannings. Doctoral Dissertation, Technische Universität München, München, Germany, 2015. [Google Scholar]
  36. Franceschi, E.; Moser-Reischl, A.; Rahman, M.A.; Pauleit, S.; Pretzsch, H.; Rötzer, T. Crown Shapes of Urban Trees-Their Dependences on Tree Species, Tree Age and Local Environment, and Effects on Ecosystem Services. Forests 2022, 13, 748. [Google Scholar] [CrossRef]
  37. Yoon, T.K.; Park, C.-W.; Lee, S.J.; Ko, S.; Kim, K.N.; Son, Y.; Lee, K.H.; Oh, S.; Lee, W.-K.; Son, Y. Allometric Equations for Estimating the Aboveground Volume of Five Common Urban Street Tree Species in Daegu, Korea. Urban For. urban Green. 2013, 12, 344–349. [Google Scholar] [CrossRef]
  38. Nowak, D.J.; Crane, D.E. Carbon Storage and Sequestration by Urban Trees in the USA. Environ. Pollut. 2002, 116, 381–389. [Google Scholar] [CrossRef] [PubMed]
  39. Moser, A.; Rötzer, T.; Pauleit, S.; Pretzsch, H. Structure and Ecosystem Services of Small-Leaved Lime (Tilia Cordata Mill.) and Black Locust (Robinia pseudoacacia L.) in Urban Environments. Urban For. Urban Green. 2015, 14, 1110–1121. [Google Scholar] [CrossRef]
  40. Issa, S.; Dahy, B.; Ksiksi, T.; Saleous, N. Allometric Equations Coupled with Remotely Sensed Variables to Estimate Carbon Stocks in Date Palms. J. Arid Environ. 2020, 182, 104264. [Google Scholar] [CrossRef]
  41. Hemery, G.E.; Savill, P.S.; Pryor, S.N. Applications of the Crown Diameter-Stem Diameter Relationship for Different Species of Broadleaved Trees. For. Ecol. Manag. 2005, 215, 285–294. [Google Scholar] [CrossRef]
  42. Temesgen, H.; Gadow, K.V. Generalized Height-Dimater Models—An Application for Major Tree Species in Complex Stands of Interior British Columbia. Eur. J. For. Res. 2004, 123, 45–51. [Google Scholar] [CrossRef]
  43. Shinozaki, K.; Yoda, K.; Hozumi, K.; Kira, T. A Quantitative Analysis of Plant Form—The Pipe Model Theory: I. Basic Analyses. Jpn. J. Ecol. 1964, 14, 97–105. [Google Scholar]
  44. Mäkelä, A. Modeling Structural-Functional Relationships in Whole-Tree Growth: Resource Allocation. Process Model. For. Growth Responses Environ. Stress 1990, 7, 86–95. [Google Scholar]
  45. Chiba, Y. Architectural Analysis of Relationship between Biomass and Basal Area Based on Pipe Model Theory. Ecol. Modell. 1998, 108, 219–225. [Google Scholar] [CrossRef]
  46. Pretzsch, H.; Matthew, C.; Dieler, J. Allometry of Tree Crown Structure. Relevance for Space Occupation at the Individual Plant Level and for Self-Thinning at the Stand Level. In Growth and Defence in Plants; Springer: Berlin/Heidelberg, Germany, 2012; pp. 287–310. [Google Scholar]
  47. Watt, M.S.; Kirschbaum, M.U.F. Moving beyond Simple Linear Allometric Relationships between Tree Height and Diameter. Ecol. Modell. 2011, 222, 3910–3916. [Google Scholar] [CrossRef]
  48. Ngo, K.M.; Lum, S. Aboveground Biomass Estimation of Tropical Street Trees. J. Urban Ecol. 2018, 4, jux020. [Google Scholar] [CrossRef] [Green Version]
  49. Peper, P.J.; Alzate, C.P.; McNeil, J.W.; Hashemi, J. Allometric Equations for Urban Ash Trees (Fraxinus spp.) in Oakville, Southern Ontario, Canada. Urban For. urban Green. 2014, 13, 175–183. [Google Scholar] [CrossRef]
  50. Arzai, A.; Aliyu, B. The Relationship between Canopy Width, Height and Trunk Size in Some Tree Species Growing in the Savana Zone of Nigeria. Bayero J. Pure Appl. Sci. 2010, 3. [Google Scholar] [CrossRef] [Green Version]
  51. Freedman, D.N.; Myers, A.C. Eerdmans Dictionary of the Bible; Amsterdam University Press: Amsterdam, The Netherlands, 2000; ISBN 9053565035. [Google Scholar]
  52. Tuqan, N.; Haie, N.; Ahmad, M.T. Assessment of the Agricultural Water Use in Jericho Governorate Using Sefficiency. Sustainability 2020, 12, 3634. [Google Scholar] [CrossRef]
  53. Roloff, A. Baumkronen: Verständnis Und Praktische Bedeutung Eines Komplexen Naturphänomens; Ulmer: Stuttgart, Germany, 2001. [Google Scholar]
  54. Pretzsch, H.; Biber, P.; Uhl, E.; Dahlhausen, J.; Rötzer, T.; Caldentey, J.; Koike, T.; Van Con, T.; Chavanne, A.; Seifert, T. Crown Size and Growing Space Requirement of Common Tree Species in Urban Centres, Parks, and Forests. Urban For. Urban Green. 2015, 14, 466–479. [Google Scholar] [CrossRef] [Green Version]
  55. Adeoluwa, O.O.; Akinkunmi, O.Y.; Akintoye, H.A.; Shokalu, A.O. Rooting, Growth and Sustainability of Yellow Ficus (Ficus Retusa ‘Nitida’) as Affected by Growth Media under Nursery Conditions. Int. J. Biol. Chem. Sci. 2014, 8, 2071–2080. [Google Scholar] [CrossRef] [Green Version]
  56. Hora, F.B. The Oxford Encyclopedia of Trees of the World; Oxford University Press: Oxford, UK, 1981. [Google Scholar]
  57. Riffle, R.L. The Tropical Look. Portland, Oregon; Timber Press. Inc.: Portland, OR, USA, 1998. [Google Scholar]
  58. Vogt, K.A.; Vogt, D.J.; Brown, S.; Tilley, J.P.; Edmonds, R.L.; Silver, W.L.; Siccama, T.G.; Vogt, K.A.; Vogt, D.J.; Brown, S.; et al. Dynamics of Forest Floor and Soil Organic Matter Accumulation in Boreal, Temperate, and Tropical Forests. In Soil Management and Greenhouse Effect; CRC Press: New York, NY, USA, 1995; pp. 159–178. [Google Scholar]
  59. Chaudhary, L.B.; Sudhakar, J.V.; Kumar, A.; Bajpai, O.; Tiwari, R.; Murthy, G.V.S. Synopsis of the Genus ficus L.(Moraceae) in India. Taiwania 2012, 57, 193–216. [Google Scholar]
  60. Tan, H.T.W.; Yeo, C.K.; Ng, A.B.C. Native and Naturalised Biodiversity for Singapore Waterways and Water Bodies No. 1 Ficus Microcarpa, Malayan Banyan; National University of Singapore: Singapore, 2009. [Google Scholar]
  61. Wee, Y.C.C. The Occurrence of Ficus Spp. on High-Rise Buildings in Singapore. Int. Biodeterior. Biodegrad. 1992, 29, 53–59. [Google Scholar] [CrossRef]
  62. Ankrah, N.; Nyarko, A.K.; Addo, P.G.A.; Ofosuhene, M.; Dzokoto, C.; Marley, E.; Addae, M.M.; Ekuban, F.A. Evaluation of Efficacy and Safety of a Herbal Medicine Used for the Treatment of Malaria. Phyther. Res. 2003, 17, 697–701. [Google Scholar] [CrossRef] [PubMed]
  63. Modi, A.; Mishra, V.; Bhatt, A.; Jain, A.; Mansoori, M.H.; Gurnany, E.; Kumar, V. Delonix Regia: Historic Perspectives and Modern Phytochemical and Pharmacological Researches. Chin. J. Nat. Med. 2016, 14, 31–39. [Google Scholar] [PubMed]
  64. Orwa, C. Agroforestree Database: A Tree Reference and Selection Guide, Version 4.0. Available online: http//www.worldagroforestry.org/sites/treedbs/treedatabases.asp (accessed on 11 March 2023).
  65. Lib, I.; Webb, D.B.; Wood, P.J. A Guide to Species Selection for Tropical and Sub-Tropical Plantations; Commenwealth Forestry Institute, University of Oxford: Oxford, UK, 1984. [Google Scholar]
  66. Singh, S.; Kumar, S.N. A Review: Introduction to Genus Delonix. World J. Pharm. Pharm. Sci. 2014, 3, 2042–2055. [Google Scholar]
  67. Barrow, S.C. A Monograph of Phoenix L. (Palmae: Coryphoideae). In Kew Bulletin; Springer: London, UK, 1998; pp. 513–575. [Google Scholar]
  68. Zohary, D.; Hopf, M.; Weiss, E. Domestication of Plants in the Old World; Oxford University Press: Oxford, UK, 2012; ISBN 9780199549061. [Google Scholar]
  69. Shamsi, M.; Mazloumzadeh, S.M. Some Physical and Mechanical Properties of Date Palm Trees Related to Cultural Operations Industry Mechanization. J. Agric. Technol. 2009, 5, 17–31. [Google Scholar]
  70. Al-Shayeb, S.M.; Seaward, M.R.D. The Date Palm (Phoenix dactylifera L.) Fibre as a Biomonitor of Lead and Other Elements in Arid Environments. Sci. Total Environ. 1995, 168, 1–10. [Google Scholar] [CrossRef]
  71. Manickavasagan, A.; Essa, M.M.; Sukumar, E. (Eds.) Dates: Production, Processing, Food, and Medicinal Values; CRC Press: Boca Raton, FL, USA, 2012. [Google Scholar]
  72. Issa, S.; Dahy, B.; Ksiksi, T.; Saleous, N. Development of a New Allometric Equation Correlated WTH RS Variables for the Assessment of Date Palm Biomass. In Conference Paper; UAE University, College of Science: Al Ain, United Arab Emirates, 2018. [Google Scholar]
  73. El-Khatib, A.A.; Youssef, N.A.; Barakat, N.A.; Samir, N.A. Responses of Eucalyptus Globulus and Ficus Nitida to Different Potential of Heavy Metal Air Pollution. Int. J. Phytoremediat. 2020, 22, 986–999. [Google Scholar] [CrossRef]
  74. Agrawal, M. Relative Susceptibility of Plants in a Dry Tropical Urban Environment; Springer: Berlin/Heidelberg, Germany, 2001; p. 606. ISBN 9783642624759. [Google Scholar]
  75. Manikandan, S.; Udaykumar, M.; Sekar, T. Woody Stem Density and Above-Ground Biomass in Pachaimalai Hills of Southern Eastern Ghats, Tamil Nadu, India. Int. J. Res. Appl. Sci. Eng. Tech. 2019, 7, 151–158. [Google Scholar] [CrossRef]
  76. Tollefson, M. Downloading R and RStudio and Setting Up a File System. In R 4 Quick Syntax Reference; Springer: Berlin/Heidelberg, Germany, 2022; pp. 3–14. [Google Scholar]
  77. Shapiro, S.S.; Wilk, M.B. An Analysis of Variance Test for Normality (Complete Samples). Biometrika 1965, 52, 591–611. [Google Scholar] [CrossRef]
  78. Peper, P.J.; McPherson, E.G.; Mori, S.M. Equations for Predicting Diameter, Height, Crown Width, and Leaf Area of San Joaquin Valley Street Trees. J. Arboric. 2001, 27, 306–317. [Google Scholar] [CrossRef]
  79. Stoffberg, G.H.; Van Rooyen, M.W.; Van der Linde, M.J.; Groeneveld, H.T. Predicting the Growth in Tree Height and Crown Size of Three Street Tree Species in the City of Tshwane, South Africa. Urban For. Urban Green. 2008, 7, 259–264. [Google Scholar] [CrossRef]
  80. Niklas, K.J. Plant Allometry: The Scaling of Form and Process; University of Chicago Press: Chicago, IL, USA, 1994; ISBN 0226580806. [Google Scholar]
  81. Jim, C.Y. Managing Urban Trees and Their Soil Envelopes in a Contiguously Developed City Environment. Environ. Manag. 2001, 28, 819–832. [Google Scholar] [CrossRef] [PubMed]
  82. Harja, D.; Vincent, G.; Mulia, R.; van Noordwijk, M. Tree Shape Plasticity in Relation to Crown Exposure. Trees 2012, 26, 1275–1285. [Google Scholar] [CrossRef]
  83. Ali, S.I.A.; Szalay, Z. Towards Developing a Building Typology for Sudan. In Proceedings of the IOP Conference Series: Earth and Environmental Science; IOP Publishing: Bristol, UK, 2019; Volume 323, p. 12012. [Google Scholar]
  84. Dixon, G.R.; Aldous, D.E. Horticulture: Plants for People and Places, Volume 1; Springer: Dordrecht, The Netherlands, 2014; ISBN 9401785775. [Google Scholar]
  85. Gilman, E. An Illustrated Guide to Pruning, 3rd ed.; Cengage Learning: Belmont, CA, USA, 2012; ISBN 1133715877. [Google Scholar]
  86. Kuser, J.E. (Ed.) Urban and Community Forestry in the Northeast; Springer Science & Business Media: Berlin/Heidelberg, Germany, 2006. [Google Scholar]
  87. Coombes, A.; Martin, J.; Slater, D. Defining the Allometry of Stem and Crown Diameter of Urban Trees. Urban For. Urban Green. 2019, 44, 126421. [Google Scholar] [CrossRef]
  88. Özbayram, A.K.; Cicek, E.; Yılmaz, F. Relationships between Leaf Area Index (LAI) and Some Stand Properties in Turkish Red Pine and Black Pine Stands. Kastamonu Üniversitesi Orman Fakültesi Derg. 2015, 15, 78–85. [Google Scholar]
  89. Liu, S.; Li, J.P.; Xu, M.F.; Sun, Y.D.; Li, W. Bin Understory Light Environment of Canopy Tree Species in Urban Green Land. In Proceedings of the Advanced Materials Research, Lulea, Sweden, 2–22 March 2013; Trans Tech Publ.: Stafa-Zurich, Switzerland, 2013; Volume 671, pp. 2715–2721. [Google Scholar]
  90. Lin, B.-S.; Lin, Y.-J. Cooling Effect of Shade Trees with Different Characteristics in a Subtropical Urban Park. HortScience 2010, 45, 83–86. [Google Scholar] [CrossRef] [Green Version]
  91. Awal, M.A.; Ishak, W.I.W.; Bockari-Gevao, S.M. Determination of Leaf Area Index for Oil Palm Plantation Using Hemispherical Photography Technique. J. Sci. Technol 2010, 18, 23–32. [Google Scholar]
  92. Luo, T.; Pan, Y.; Ouyang, H.; Shi, P.; Luo, J.; Yu, Z.; Lu, Q. Leaf Area Index and Net Primary Productivity along Subtropical to Alpine Gradients in the Tibetan Plateau. Glob. Ecol. Biogeogr. 2004, 13, 345–358. [Google Scholar] [CrossRef]
  93. Roy, S.; Byrne, J.; Pickering, C. A Systematic Quantitative Review of Urban Tree Benefits, Costs, and Assessment Methods across Cities in Different Climatic Zones. Urban For. Urban Green. 2012, 11, 351–363. [Google Scholar] [CrossRef] [Green Version]
  94. Pataki, D.E.; Alberti, M.; Cadenasso, M.L.; Felson, A.J.; McDonnell, M.J.; Pincetl, S.; Pouyat, R.V.; Setälä, H.; Whitlow, T.H. The Benefits and Limits of Urban Tree Planting for Environmental and Human Health. Front. Ecol. Evol. 2021, 9, 603757. [Google Scholar] [CrossRef]
  95. Esperon-Rodriguez, M.; Tjoelker, M.G.; Lenoir, J.; Baumgartner, J.B.; Beaumont, L.J.; Nipperess, D.A.; Power, S.A.; Richard, B.; Rymer, P.D.; Gallagher, R.V. Climate Change Increases Global Risk to Urban Forests. Nat. Clim. Chang. 2022, 12, 950–955. [Google Scholar] [CrossRef]
  96. Issa, S.; Dahy, B.; Saleous, N.; Ksiksi, T. Carbon Stock Assessment of Date Palm Using Remote Sensing Coupled with Field-Based Measurements in Abu Dhabi (United Arab Emirates). Int. J. Remote Sens. 2019, 40, 7561–7580. [Google Scholar] [CrossRef]
  97. Betemariyam, M.; Kefalew, T. Carbon Stock Estimation of Mixed-Age Date Palm (Phoenix dactylifera L.) Farms in Northeastern Ethiopia. Heliyon 2022, 8, e08844. [Google Scholar] [CrossRef] [PubMed]
  98. Rahman, M.A.; Stratopoulos, L.M.F.; Moser-Reischl, A.; Zölch, T.; Häberle, K.H.; Rötzer, T.; Pretzsch, H.; Pauleit, S. Traits of Trees for Cooling Urban Heat Islands: A Meta-Analysis. Build. Environ. 2020, 170, 106606. [Google Scholar] [CrossRef]
  99. Rahman, M.A.; Moser, A.; Rötzer, T.; Pauleit, S. Within Canopy Temperature Differences and Cooling Ability of Tilia Cordata Trees Grown in Urban Conditions. Build. Environ. 2017, 114, 118–128. [Google Scholar] [CrossRef]
  100. Rahman, M.A.; Moser, A.; Gold, A.; Rötzer, T.; Pauleit, S. Vertical Air Temperature Gradients under the Shade of Two Contrasting Urban Tree Species during Different Types of Summer Days. Sci. Total Environ. 2018, 633, 100–111. [Google Scholar] [CrossRef]
  101. Potchter, O.; Shashua-Bar, L. Urban Greenery as a Tool for City Cooling: The Israeli Experience in a Variety of Climatic Zones. In Proceedings of the PLEA, Edinburgh, Scotland, 3–5 July 2017. [Google Scholar]
  102. Shashua-Bar, L.; Pearlmutter, D.; Erell, E. The Cooling Efficiency of Urban Landscape Strategies in a Hot Dry Climate. Landsc. Urban Plan. 2009, 92, 179–186. [Google Scholar] [CrossRef]
Figure 1. Spatial distribution of the measuring site following a north–south and east–west transect within Jericho. (J1) shows the distribution of the selected urban trees along the transects encompassing the urban area. (J2) shows an aerial image of the boundaries of Jericho, depicting the northwest–southeast transect (A,B) with a length of 7 km and the southwest–northeast transect (C,D) with a width of 5 km.
Forests 14 00671 g001
Figure 2. The relationships between dbh and tree height (ac in the top row), crown diameter (df in the middle row), and crown volume (gi in the bottom row) for the investigated species.
Forests 14 00671 g002
Figure 3. Impact of the tree structural variables on above-ground biomass carbon storage of three tree species in three plots using a linear mixed model. the p-value (with levels of significance indicated by symbols such as ***, ** and *) for each ANOVA shows the significant impact of the tree structure variables and above-ground biomass carbon storage for the species.
Forests 14 00671 g003
Figure 4. Impact of the tree structure variables on shaded area of three tree species in three plots using a linear mixed model. D. regia (a), F. nitida (b), with fixed effects of tree species, and random effects accounting for tree pit surface area and tree planting site. the p-value (with levels of significance indicated by symbols such as *** and **) for each ANOVA shows the significant impact of the tree structure variables and shaded area for the species.
Forests 14 00671 g004
Figure 5. Ecosystem services (above-ground biomass carbon storage figure (L) and shading area (R)) of D. regia, F. nitida, and P. dactylifera in the arid city of Jericho. Letters indicate the results of post hoc Tukey test. Different letters denote significant differences.
Forests 14 00671 g005
Table 1. The number of measured tree species for four different planting categories: public space, parking lot, street, and square.
Tree SpeciesPublic SpaceParking LotStreetSquareSum
Delonix regia0762069
Ficus nitida151939073
Phoenix dactylifera50015570
Table 2. Results of linear regression analyses using dbh as a predictor variable and h, cd, and cv as response variables. The equation used was ln(y) = a + b ln(x). The abbreviations used were (dbh) diameter at breast height; (h) tree height; (cd) crown diameter; (cv) crown volume; a and b for regression coefficients; T for T-test value; P for p-value (with levels of significance indicated by symbols such as *** and *); R2 for coefficient of determination; F for F-test value; and df for degree of freedom and standard error (SE).
SpeciesParameternabTPSER2Fdf
D. regialn(dbh) vs. ln(h)690.170.385.15<0.001 ***0.070.2826.5467
ln(dbh) vs. ln(cd)690.100.528.20<0.001 ***0.060.5067.1867
ln(dbh) vs. ln(cv)69−0.061.317.94<0.001 ***0.040.4863.0867
F. nitidaln(dbh) vs. ln(h)730.130.4611.63<0.001 ***0.040.6613571
ln(dbh) vs. ln(cd)730.010.5710.15<0.001 ***0.060.5910371
ln(dbh) vs. ln(cv)73−0.581.7111.10<0.001 ***0.150.6312371
P. dactyliferaln(dbh) vs. ln(h)700.660.281.450.150.190.032.1068
ln(dbh) vs. ln(cd)701.46−0.47−2.090.04 *0.220.064.3768
ln(dbh) vs. ln(cv)704.11−1.41−2.090.04 *0.670.064.3768
Table 3. Allometric linear relationships between age and tree height, crown diameter, and crown volume as a response, and the regression equation for F. nitida, D. regia, and P. dactylifera. Abbreviations: (dbh) diameter at breast height; (h) tree height; (cd) crown diameter; (cv), crown volume; regression coefficients (a, b); coefficients of determination (R2); standard errors (SE); and F-values, as well as P for p-value (with levels of significance indicated by symbols such as *** and *).
ParametersnabTPSEdfR2F
D. regiaAge vs. ln(dbh)692.360.052.090.04 *0.02670.064.38
Age vs. ln(h)691.170.031.380.170.01670.031.89
Age vs. ln (cv)694.320.010.140.890.0567<0.010.02
Age vs. ln (cd)693.1−0.34−0.80.430.4567<0.010.6
F. nitidaAge vs. ln(dbh)732.680.0310.61<0.001 ***<0.01710.61112.6
Age vs. ln(h)731.510.0147.86<0.001 ***<0.01710.4761.81
Age vs. ln (cv)733.30.056.16<0.001 ***<0.01710.3637.92
Age vs. ln (cd)731.570.015.41<0.001 ***<0.01710.329.28
P. dactyliferaAge vs. ln(dbh)703.730.011.90.06<0.01680.053.64
Age vs. ln(h)702.60.00−0.590.560.01680.010.34
Age vs. ln (cv)704.6−0.01−1.580.12<0.01680.042.5
Age vs. ln (cd)701.70.00−1.5770.12<0.01680.042.48
Table 4. Mean of the trees’ structural data: age, dbh, h, hcb, cl, and related SD in response to the growth site for D. regia, F. nitida, and P. dactylifera, as well as the p-value (with levels of significance indicated by symbols such as ***, ** and *) for each ANOVA. The mean in the same column differs significantly when followed by different letters. Abbreviations: (dbh) diameter at breast height; (h) tree height; (cl) crown length; (cd) crown diameter; (cpa) crown projection area; (cv) crown volume; SD, standard deviation.
Site nAge dbh [cm]h [m]hcb [m] cl [m] cd [m]cpa [m2]cv [m3]
Mean ± SDMean ± SDMean ± SDMean ± SDMean ± SDMean ± SDMean ± SDMean ± SD
D. regia p ≤ 0.01 ***p < 0.01 **p = 0.02 *p = 0.2p = 0.12p = 0.53p = 0.69p = 0.26
Parking lot---------
Public place724.1 ± 1.5 a46.8 ± 7.6 a6.7 ± 1.8 a2.2 ± 0.3 a4.5 ± 1.9 a8.4 ± 0.9 a55.6 ± 12.5 a122 ± 42.7 a
Street6221.5 ± 1.1 b33.98 ± 10.7 b5.6 ± 1.1 b1.8 ± 0.7 a3.7 ± 1.2 a7.9 ± 1.8 a52.02 ± 22.98 a98.7 ± 52.4 a
F. nitida p = 0.20p = 0.012 *p = 0.098p= 0.14p = 0.09p = 0.02 *p = 0.02 *p = 0.01 *
Parking lot1919.1 ± 21.5 a25.5 ± 15.6 ab5.60 ± 1.5 a1.93 ± 0.88 a3.67 ± 1.0 a5.84 ± 1.2 b27.94 ± 11.8 b53.7 ± 31.6 b
Public place1514 ± 4.9 a20.1 ± 5.4 b5.89 ± 1.4 a1.76 ± 0.59 a4.13 ± 1.4 a5.92 ± 2.1 ab30.73 ± 77.2 ab73.9 ± 77.2 ab
Street3921.6 ± 13.5 a32.7 ± 15.6 a6.58 ± 2.0 a1.99 ± 0.76 a4.59 ± 1.7 a7.6 ± 3.1 a52.98 ± 45.8 a154.4 ± 187.4 a
P. dactylifera p = 0.11p = 0.13p = 0.8p = 0.67p = 0.83p = 0.06p = 0.05p = 0.02 *
Parking lot0--------
Public place5067.1 ± 21.4 a46.3 ± 6.2 a13.46 ± 3.0 a10.43 ± 3.1 a3.03 ± 1.7 a4.92 ± 1.4 a20.78 ± 11.6 ab78.7 ± 69.7 ab
Street1567.6 ± 22.5 a51.6 ± 10.8 a14.10 ± 3.2 a10.79 ± 2.7 a3.31 ± 1.7 a4.74 ± 1.0 a16.87 ± 35.9 b56.3 ± 35.90 b
square573.3 ± 18.2 a46.1 ± 9.0 a13.25 ± 3.6 a9.9 ± 3.0 a2.74 ± 1.7 a4.88 ± 1.7 a21.60 ± 13.9 a87.2 ± 85.5 a
Table 5. Results of the summary of the regression analysis of tree pit surface area, the predictor variables, and diameter at breast height (dbh), tree height (h), crown diameter (cd), and crown volume (cv), as a response, and the regression equation y = a + b × ln x . The table below lists the determination of R2, residual standard error, and p-values. The R2 value and the p-value (with levels of significance indicated by symbols such as ***, ** and *)for each ANOVA show the relationship between the tree structural variables and the tree pit surface area for the species.
SpeciesParameternAbt-Valuep-ValueRSEdfR2F-Value
D. regia
Tree pit surface area vs. ln(dbh)693.56−0.01−0.950.350.31670.010.9
Tree pit surface area vs. ln(h)691.720−4.080.970.2267<0.010
Tree pit surface area vs. ln(cd)692.0300.650.520.22670.010.42
Tree pit surface area vs. ln(cv)694.40.020.750.460.58670.010.56
F. nitida
Tree pit surface area vs. ln(dbh)733.43−0.12−6.21<0.01 ***0.37710.3538.54
Tree pit surface area vs. ln(h)731.87−0.05−4.08<0.01 ***0.25710.1916.64
Tree pit surface area vs. ln(cd)731.97−0.07−4.66<0.01 ***0.32710.2321.72
Tree pit surface area vs. ln(cv)734.45−0.17−3.56<0.01 ***0.95710.1512.68
P. dactylifera
Tree pit surface area vs. ln(dbh)703.880−1.10.04 *0.15680.050.04
Tree pit surface area vs. ln(h)702.580−0.040.700.2568<0.010.15
Tree pit surface area vs. ln(cd)701.4403.24<0.001 **0.27680.1210.47
Tree pit surface area vs. ln(cv)703.460.025.741<0.001 ***0.72680.3232.66
Table 6. Mean, minimum, maximum, and related standard deviation as well P for p-value (with levels of significance indicated by symbols such as ***) of Csa above-ground biomass carbon storage, shaded area, and shade density for D. regia, F. nitida, and P. dactylifera for different age classes. Means within the columns differ significantly when separated by different letters.
AgenCsa kg [C]Shaded Area [m2]Shade Density [m2/m3]
MeanMaxMinMeanMaxMinMeanMaxMin
D. regia
20–2569178.6 ± 118.8591.646.841.8 + 17.476.84.63.58 ± 2.619.00.9
F. nitida p ≤ 0.001 ***
<153035 ± 12.5 a75.617.420.40 ± 6.943.010.23.88 ± 1.36.31.4
16–2434163.23 ± 129.3 b50013.258.41 ± 35.5211.122.53.34 ± 14.70.8
>259420.3 + 178.7 c711.2180.1269.23 ± 28.1107.137.21.67 ± 0.62.700.6
P. dactylifera p = 0.33
<291077.7 ± 5 a87.468.038.25 + 8.550.426.40.74 + 0.201.10.4
50–702298.95 ± 23.7 a166.560.129.24 + 21.675.43.80.87 + 0.41.70.4
>803892.64 ± 23.5 a132.843.617.21 + 11.749.15.021.00 + 0. 62.70.5
Table 7. Means and SD of the ecosystem services above-ground biomass carbon storage Csa, shaded area, and shade density for D. regia, F. nitida, and P. dactylifera in response to growth site, as well as the p-value (with levels of significance indicated by symbols such as ** and *)for each ANOVA. The mean values in the same column differ significantly when followed by different letters.
Site nCsa [kg C]Shaded Area [m2]Shade Density [m2/m3]
MeanMeanMean
D. regia p = 0.01 **p = 0.28p = 0.16
Public place7134.01 ± 35.5 a35.5 ± 10.2 a4.9 ± 2.1 a
Street62182.0 ± 125.5 b42.8 ± 17.4 a3.5 ± 2.6 a
F. nitida p = 0.03 *p = 0.03 *p = 0.76
Parking lot 19121.8 ± 170.1 ab30.7 ± 12.5 b2.9 ± 1.2 a
Public place1561.3 ± 44.5 b36.8 ± 24.8 ab3.2 ± 1.2 a
Street39183.4.6 ± 173.2 a53.5 ± 39.8 a2.8 ± 1.5 a
P. dactylifera p = 0.88p = 0.84p = 0.37
Public place4592.5 ± 24 a24.2 ± 17.4 a0.89 ± 0.5 a
Street1497.31 ± 20.8 a24.3 ± 15.7 a1.11 ± 0.5 a
Square590.8 ± 19.9 a29.3 ± 11.8 a0.70 ± 0.1 a
Disclaimer/Publisher’s Note: The statements, opinions and data contained in all publications are solely those of the individual author(s) and contributor(s) and not of MDPI and/or the editor(s). MDPI and/or the editor(s) disclaim responsibility for any injury to people or property resulting from any ideas, methods, instructions or products referred to in the content.

