Article

The Effects of Tree Canopy Structure and Tree Coverage Ratios on Urban Air Temperature Based on ENVI-Met

1
State Key Laboratory of Subtropical Silviculture, Zhejiang A&F University, Lin’an 311300, China
2
Zhejiang Provincial Collaborative Innovation Centre for Bamboo Resources and High-Efficiency Utilization, Zhejiang A&F University, Lin’an 311300, China
3
Key Laboratory of Carbon Cycling in Forest Ecosystems and Carbon Sequestration of Zhejiang Province, Zhejiang A&F University, Lin’an 311300, China
4
School of Environmental and Resources Science, Zhejiang A&F University, Lin’an 311300, China
5
Forestry Bureau of Longquan City, Longquan 323700, China
6
College of Forestry, Beijing Forestry University, Beijing 100083, China
*
Author to whom correspondence should be addressed.
These authors contributed equally to this work.
Forests 2023, 14(1), 80; https://doi.org/10.3390/f14010080
Submission received: 9 November 2022 / Revised: 25 December 2022 / Accepted: 29 December 2022 / Published: 1 January 2023
(This article belongs to the Special Issue Urban Forest and Urban Microclimate)

Abstract

:
Vegetation configuration in residential districts improves human comfort by effectively moderating the thermal environment. Herein, the reliability of ENVI-met is verified by comparing the field measured with simulated data, including air temperature and relative humidity. The cooling effect of trees gradually increased with increasing tree coverage. Under the same coverage, trees with a tree crown diameter (TCD) of 3 m have the strongest cooling capacity, followed by trees with a TCD of 7 m, and trees with a TCD of 5 m have the weakest cooling capacity. The cooling capacity of a TCD of 3 m is considerably higher than that a TCD of 5 m and a TCD of 7 m. When the tree coverage ratio is 50%, the difference among the three TCDs is the largest. When the tree coverage is 50% or 70%, the cooling effect of TCD at 7 m is considerably higher than that at 5 m. For different canopy sizes and shapes under the same degree of tree coverage, only when the tree coverage is more than 50% and TCD is 3 m, the cooling capacity of a cylindrical shape is 0.2 to 0.3 °C higher than that of conical and ellipsoidal shapes. However, the difference between conical and ellipsoidal shapes when TCD is 5 or 7 m is not significant (∆Ta < 0.1 °C). Our results suggest that small canopy trees have a better cooling effect than large canopy trees for the same level of coverage.

1. Introduction

Over the past few decades, with rapid population growth, rapid urban expansion, and global climate warming, the phenomenon of urban heat islands has become a common issue in urban cities around the globe [1], significantly impacting human health and daily living, and increasing the frequency of extreme heat stress. Furthermore, the urban thermal environments and the thermal comfort of residents have become challenging. When temperatures become too hot, lives are threatened, and studies have found that temperature is an important factor affecting morbidity and mortality [2,3]; indeed, heat and heat waves are an additional contributing factor to increased mortality in summer. Exposure to heat can impair the body’s ability to regulate its internal temperature, and can result in temperature-related deaths [4,5,6]. Urban cooling can help to mitigate the impact of extreme heat conditions on lives and livelihoods.
In most developed cities, urban green space is extremely limited, hence maximizing the cooling effect of green space is critical. Previous studies have also found that vegetation is one of the effective measures to mitigate the heat island effect and improve human comfort [7,8,9], since it affects air temperature (AT), relative humidity (RH), rainfall, and other conditions in urban areas, and the cooling capacity of trees is much more pronounced than that of grass. The physiological characteristics of trees provide a higher cooling capacity than other vegetation since trees can block the sunlight and absorb some heat and transpiration. Therefore, trees can effectively moderate the urban thermal environment [10,11].
Studies have confirmed that the key factor for trees to exert a cooling effect resides in the canopy [12,13,14], which blocks direct sunlight on the surface, while the leaves of the canopy can perform photosynthesis and transpiration [15,16]. Different canopies have different three-dimensional characteristics, leading to differences in the cooling capacity of trees.
The surface temperature of pileated canopy shapes had the strongest cooling and humidification effects, while the shape of the columnar canopy had the weakest [17,18]. This suggests that canopy shape should be considered when investigating the cooling effect of trees. The size of trees can be described by tree crown diameter (TCD) and tree height (TH), both of which have different effects on the urban thermal environment. At the same time, increasing the diameter of the crown will have better cooling and humidification effects than increasing the height of the trunk [18,19]. A larger TCD is more conducive to improving human thermal comfort [19] since increasing TCD will reduce the average sky view factor of the city [20,21]. TCD can indicate tree coverage; a larger canopy indicates a higher percentage of tree coverage and thus the more shade it provides [19,22].
Tree coverage and number are important factors in urban planning. In addition to crown size and canopy shape, tree coverage is also an important factor in the thermal environment of urban open green spaces [23,24]. Urban vegetation coverage is closely related to urban thermal environment and thermal comfort conditions [25]. In the hot summer months, areas with higher vegetation coverage are cooler than those with lower, as vegetation coverage effectively reduces air and radiation temperatures. Areas with higher vegetation coverage provide greater shade and transpiration, thus effectively improving the urban thermal environment [26]. When the canopy diameter of the trees is fixed, tree coverage is a key factor influencing the number of trees in a green space. The amount of cooling provided by green space and the distance over which that cooling extends depend on factors such as green space size, but this relationship is not linear [27,28].
Previous studies have confirmed that crown size, canopy shape, and tree coverage are important factors affecting AT and RH [25,27,29], although only few studies explained how the canopy affects the surrounding environment. To quantify the effect of crown size, canopy shape, and tree coverage on AT and RH, numerical simulation was used in this study to analyze and predict the urban thermal environment. ENVI-met, RayMan, and SOLWEIG are software packages frequently used in microclimate simulation studies. Among them, RayMan simulation has the fastest operation speed, yet only outputs few radiation parameters and cannot simulate reflected radiation well. SOLWEIG is suitable for radiation simulation of enclosed spaces, while ENVI-met software can calculate more radiation parameters and long-wave and short-wave radiation between buildings and surfaces [30].
ENVI-met is a 3D numerical simulation software based on fluid mechanics and thermodynamic equations [31]. According to the principle of iterative calculation, ENVI-met can simulate the “surface-plant-atmosphere” interaction in the city; then, the influence characteristics of urban planning form and landscape elements on complex space microclimate are quantified, which can be used to assess the influence of architecture and urban planning on environmental variables. ENVI-met can also simulate AT and RH, soil temperature and humidity, solar radiation, surface temperature, and wind speed and direction scenarios; hence, it is widely used in urban green space microclimate regulation effects, especially to simulate the heat island effect [32,33,34], improve human thermal comfort [35,36,37], and reduce air pollutants [38,39].
Previous studies using ENVI-met software found branching position height, planting orientation, crown size, tree shape, and the number of trees differently impact the surrounding microclimate [40,41]. However, these studies are based on the vegetation database in the system, while there are various kinds of vegetation that vary regionally. Therefore, in this study, we created a vegetation model consistent with the study area with the help of a 3D laser scanner. To ensure the reliability of the model’s simulation output, it is often necessary to calibrate the simulated values with the use of measured values and to assess the accuracy of the model using statistical values such as root mean square error (RMSE) and index of agreement (d) [42,43].
Although ENVI-met’s database contains various types of vegetation, in reality, the size, shape, and types of trees are more complicated. To truly restore the information of trees and improve the simulation accuracy of the model, we used the terrestrial laser scanning (TLS) to reconstruct the trees in the sample plot. TLS is a measuring tool that can accurately provide detailed stand and individual tree information without destroying trees, including crown size and shape, tree height, and diameter at breast height (DBH) [44,45]. The tree crown is reconstructed by dividing the point cloud acquired by the TLS into a three-dimensional grid of volume elements (voxel) [46].
In this study, we used the ENVI-met software to simulate a realistic scenario and used the measured data to verify the accuracy of the simulation. Firstly, five groups of different coverage of trees with three tree crown sizes were simulated during the summer. Secondly, three groups of different TCD and three groups of different canopy shapes of trees were simulated in five tree coverage scenarios. Our study aims are to (1) verify the simulation accuracy of the ENVI-met model; (2) study the effects of different crown sizes and tree coverage on the urban thermal environment in the summer; (3) quantify the cooling effect of three canopy shapes on the urban thermal environment in the summer.

2. Materials and Methods
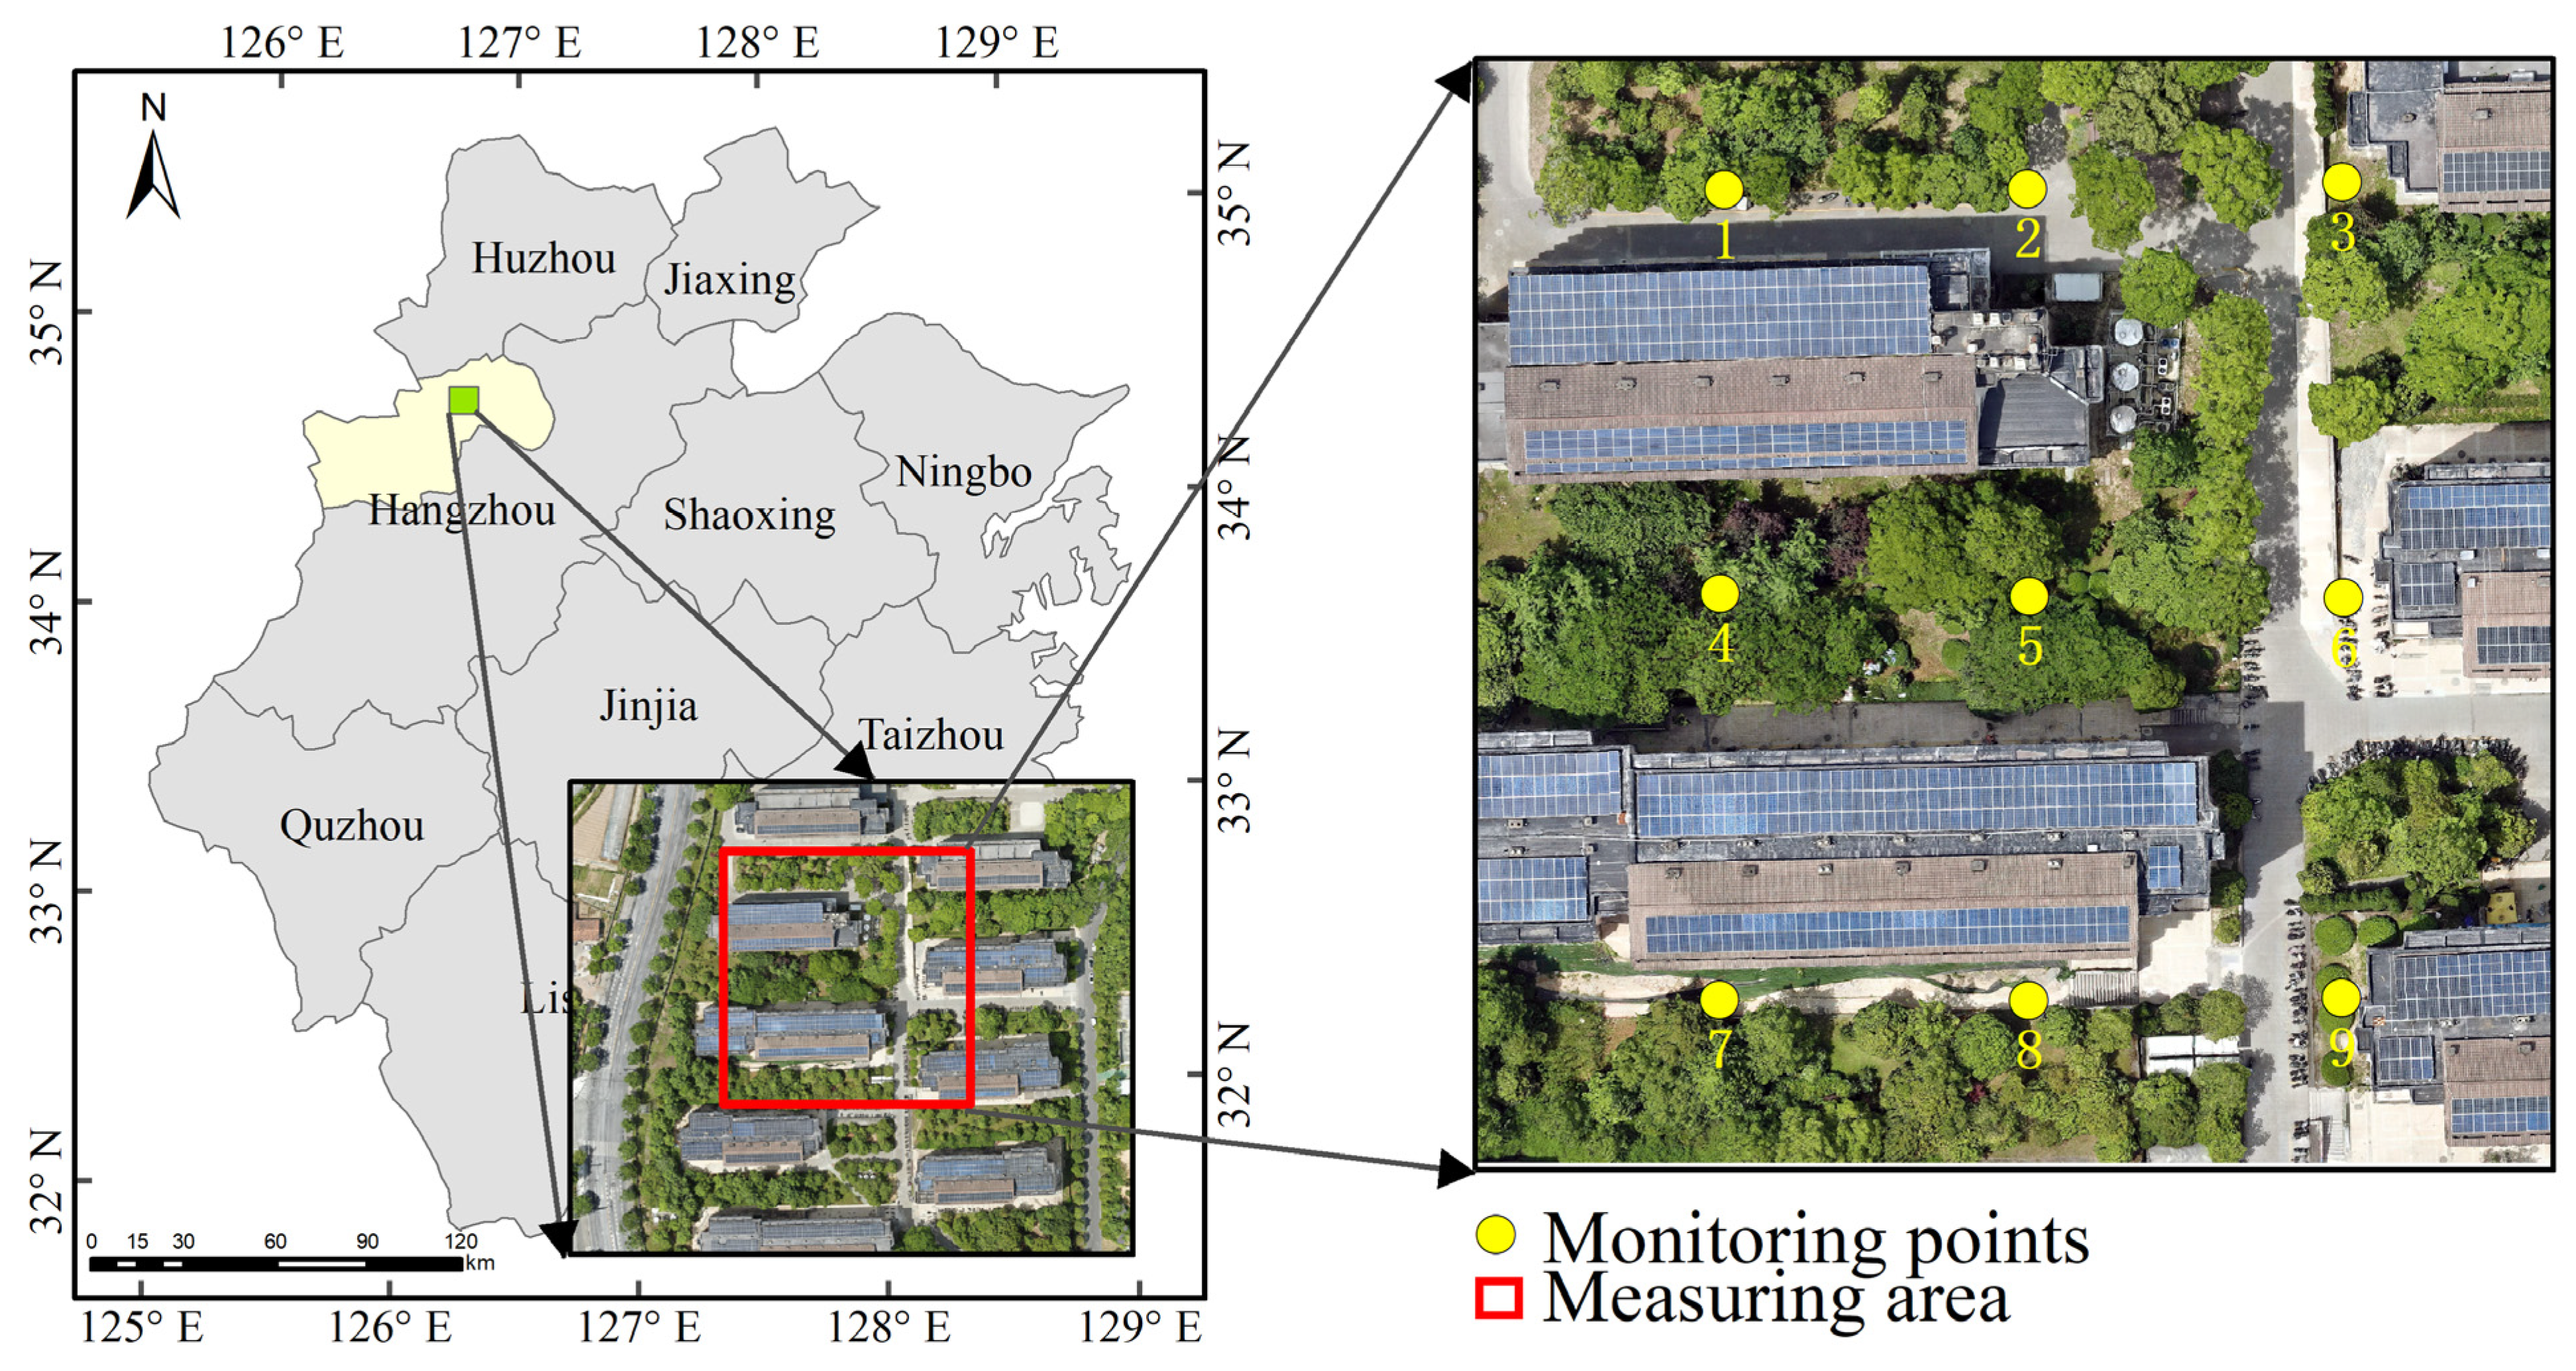
2.1. Study Area

The study area was located in the Lin’an district (118°51′–119°52′ E, 29°56′–30°23′ N), Hangzhou City, Zhejiang Province, China (Figure 1). It has a typical subtropical climate with sufficient light and abundant rainfall. The weather forms of the four seasons are quite different: rainy in spring, hot and humid in summer, cool in autumn, and low temperature with little rain in winter. The annual rainfall is 1628.6 mm, 158 days of precipitation, a frost-free period averaging 235 days per year, with an average temperature of 16.4 °C throughout the year [47].
We selected a 100 m × 100 m size as the study area, and the features included buildings, roads, concrete roads, green space, and vegetation (Table 1). The experiment was conducted from 15 to 17 July 2021. The weather conditions in these three days were similar, with stable weather, cloudless and low wind speed.

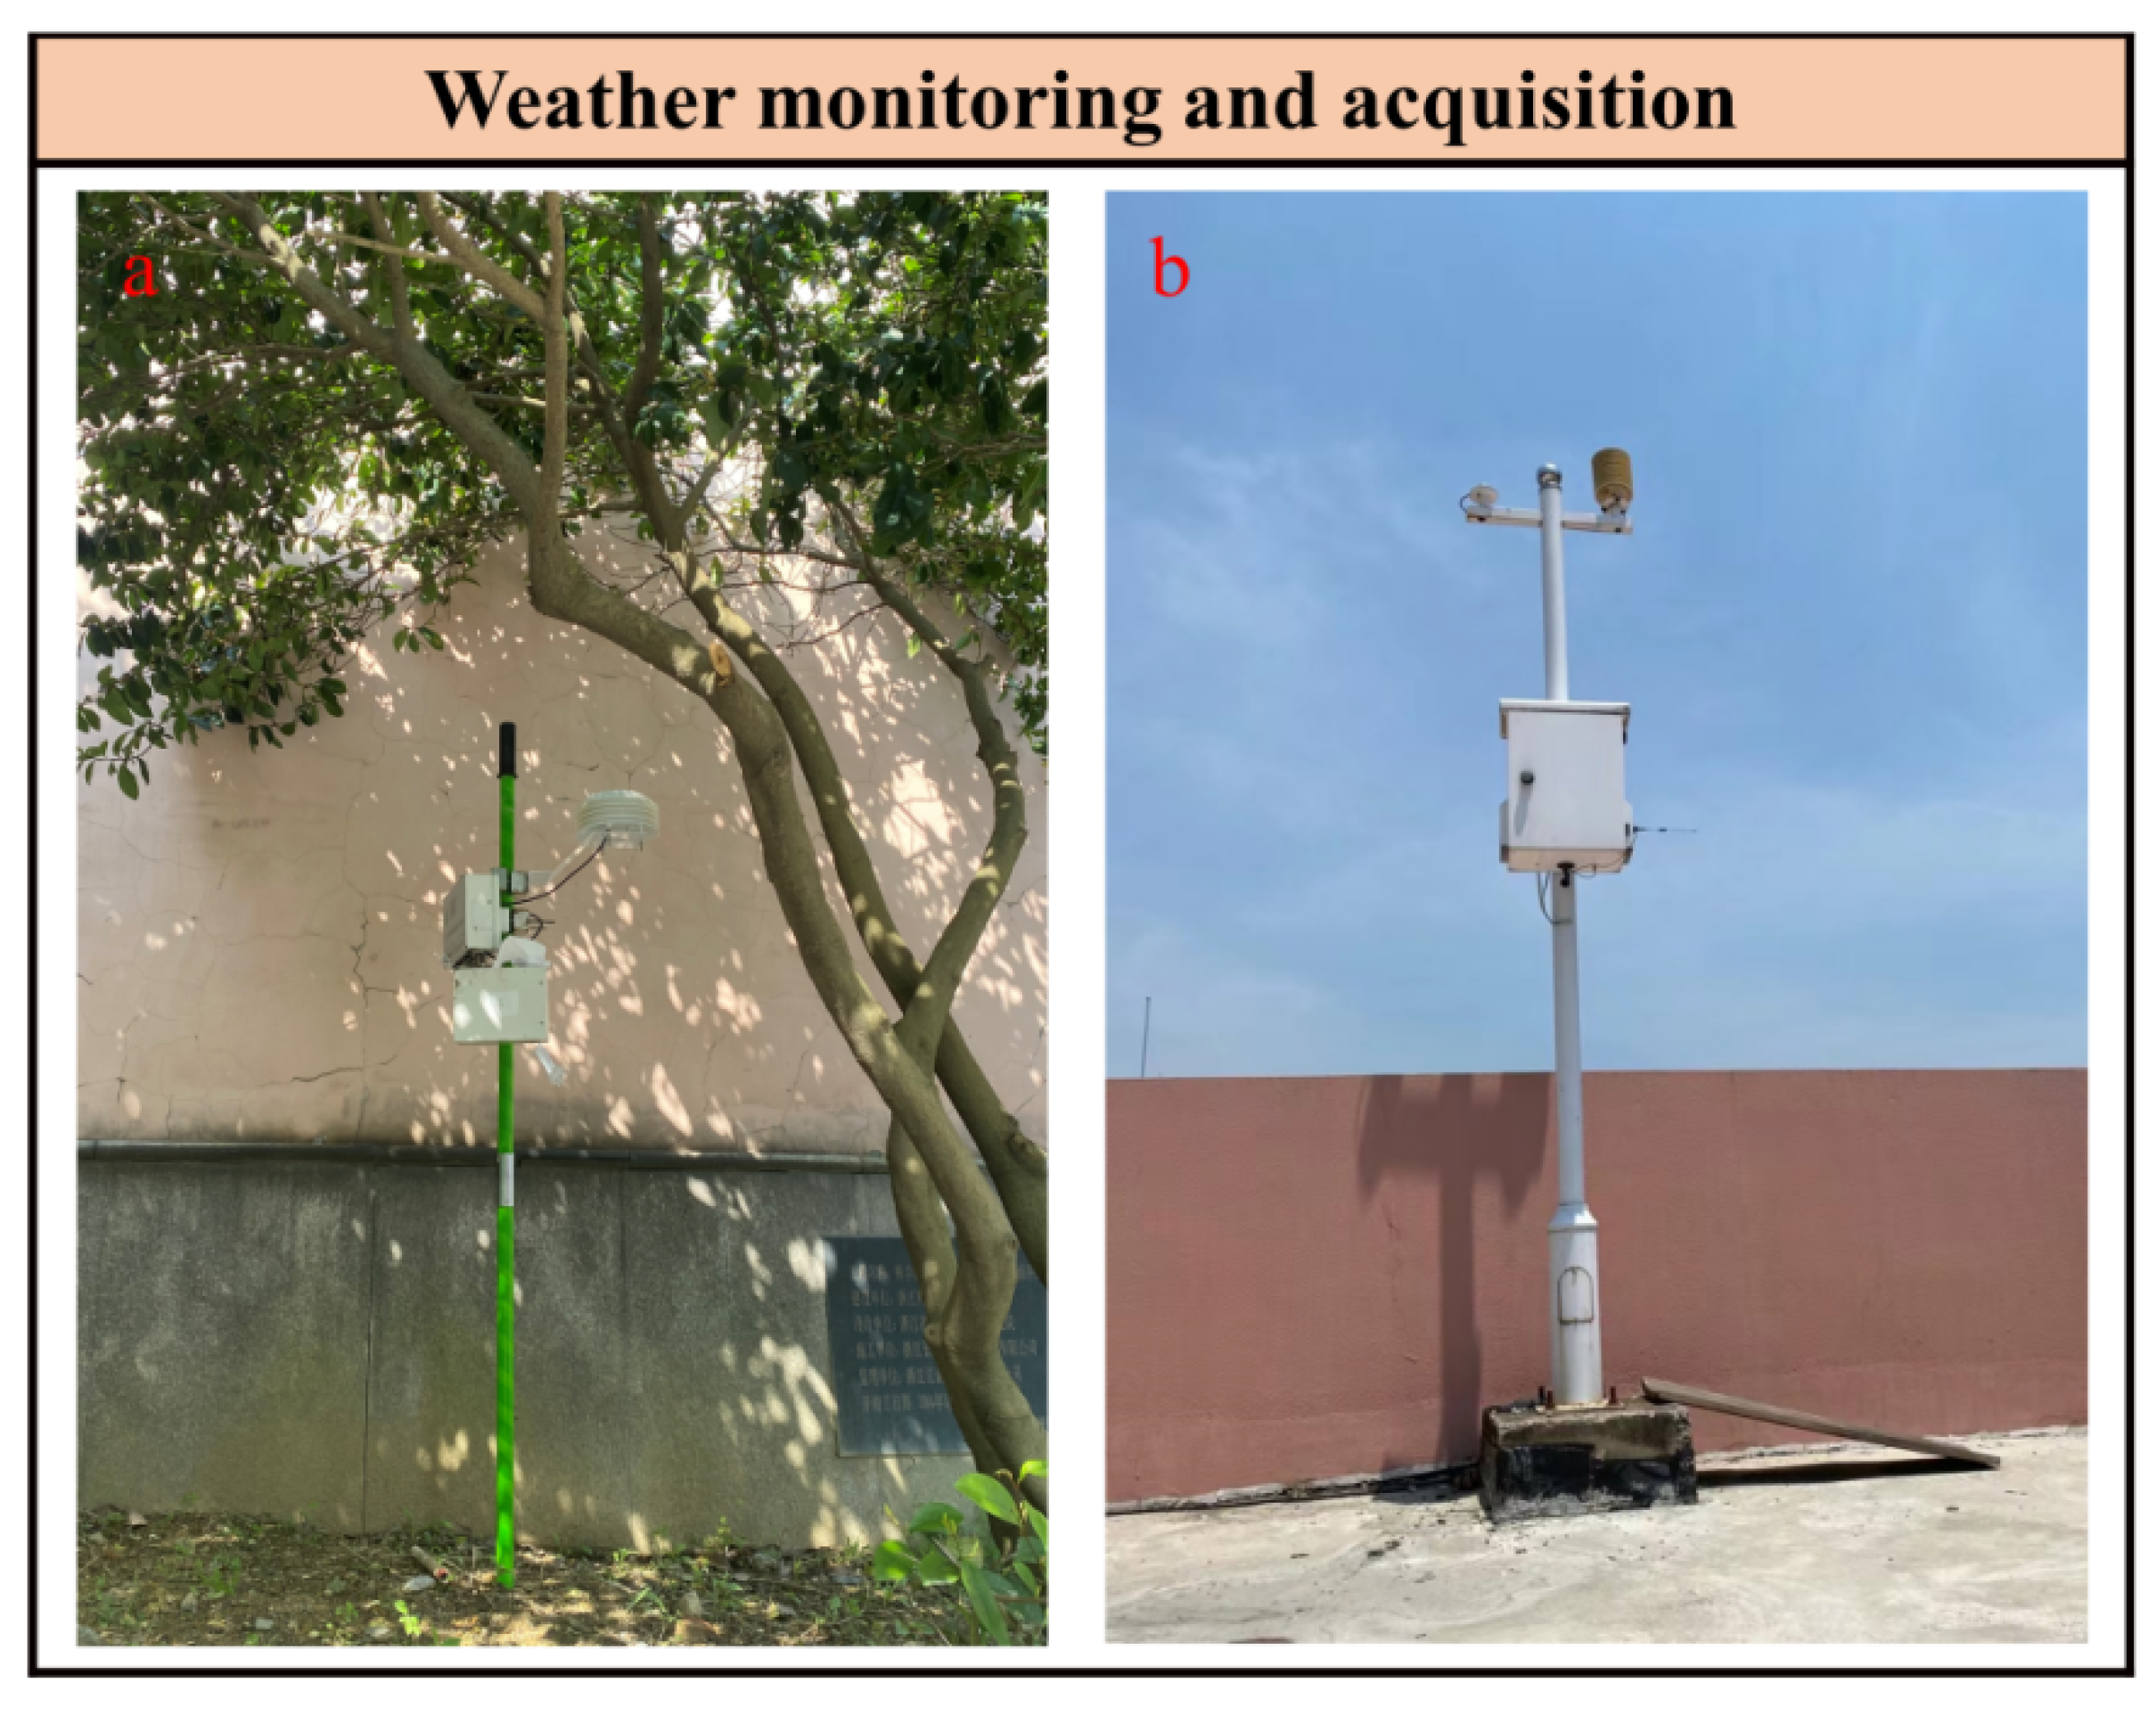
2.2. Meteorological Data and Measured Data Collection

In this study, GHHB-001-485 wireless sensor equipment was used to monitor environmental factors. To ensure the accuracy of experimental results and reduce systematic errors among devices, all wireless sensor equipment were calibrated prior to the start of the experiments. All data were calibrated after being collected via sensors and used in this study. The AT error after calibration was <0.2 °C, while the RH error was <0.5%. Detailed data specifications for wireless sensor equipment are listed in Table 2.
We divided the study area into nine equal-sized cells, and arranged a wireless sensor in the center of each cell. As the center points of some cells fall on the roof, we moved these center points to be distributed on the roof horizontally along the north to the green space, and arranged sensors. Since the air temperature was relatively stable, and the composition and distribution of features in the study area were similar to those outside the study area, we think that the data difference caused by this small-scale movement can be ignored. Finally, nine wireless sensors were arranged in total (Figure 1), and some wireless sensors were under trees, some were in grassland, and some were next to buildings. The sensors were positioned at 1.5 m above the ground (Figure 2a), and recorded data at a frequency of 1 per min. In addition, we obtained three days’ weather data consistent with the experimental time from a weather station located on an open asphalt surface in the campus and 2 m above the ground (Figure 2b). The collection frequency of the weather station was 1 per min. Furthermore, we obtained the wind speed and direction information at 10 m in the experimental day from the nearby Lin‘an Meteorological Station.

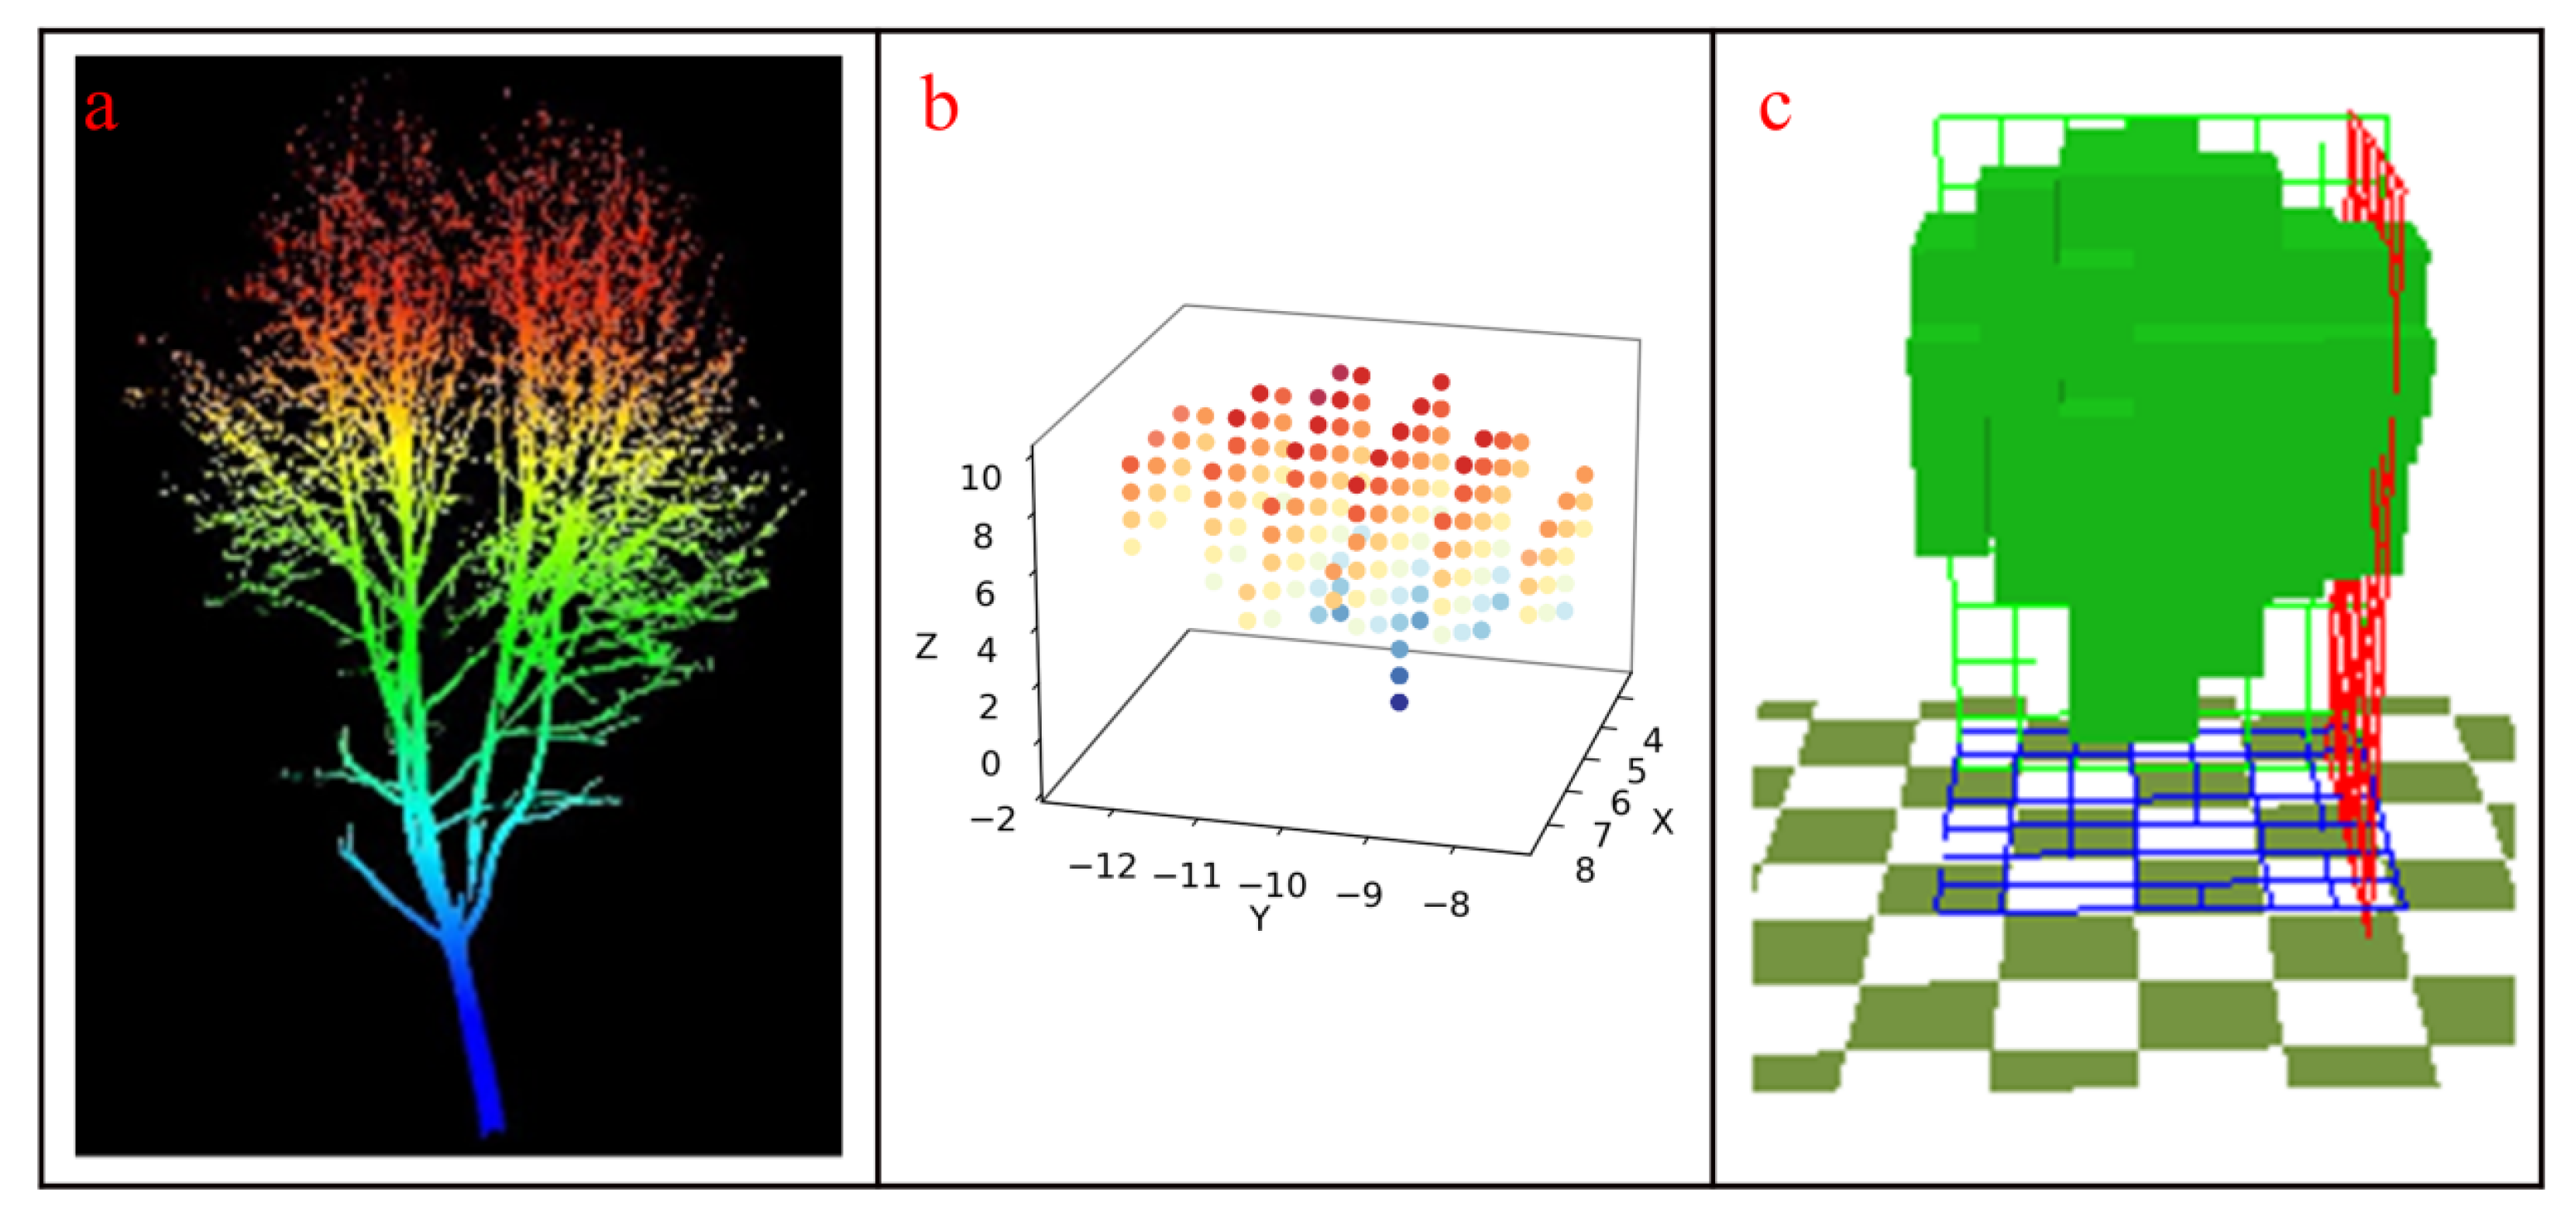
2.3. Tree Information Collectiona

In this study, we used the DJI M300 UAV equipped with a visible light camera to take pictures of the study area to obtain images of the study site, including the composition of the underlying surface and the location of trees, and set the flight altitude at 60 m. We carried out a per-tree survey of the trees in the study area to obtain detailed information about each tree, including TH and DBH. There are 167 trees in the study area, primarily including Koelreuteria paniculata, Prunus cerasifera “Atropurpurea”, Osmanthus fragrans, Elaeocarpus decipiens Hemsl, and Firmiana simplex (Linnaeus) W. Wight. We used a TLS device to obtain the parameters such as TH, TCD, and trunk height. Detailed parameters of the TLS equipment are listed in Table 3.

2.4. Individual Tree Creation Process

The point cloud data collected using the TLS equipment were imported into the Cyclone software for processing and noise point removal near the point cloud of a single tree. Then, the separated point cloud of a single tree was voxelized using the Python 3.6 software, and the voxelization operation was performed on the point cloud data to convert the geometric form of the object into the closest representation form. In the sub-module Albero of ENVI-met software, the voxelized point cloud data were used to create a realistic single-tree model. We have created a total of 14 vegetation models. Cloud point voxelization and single tree creation are shown in Figure 3.

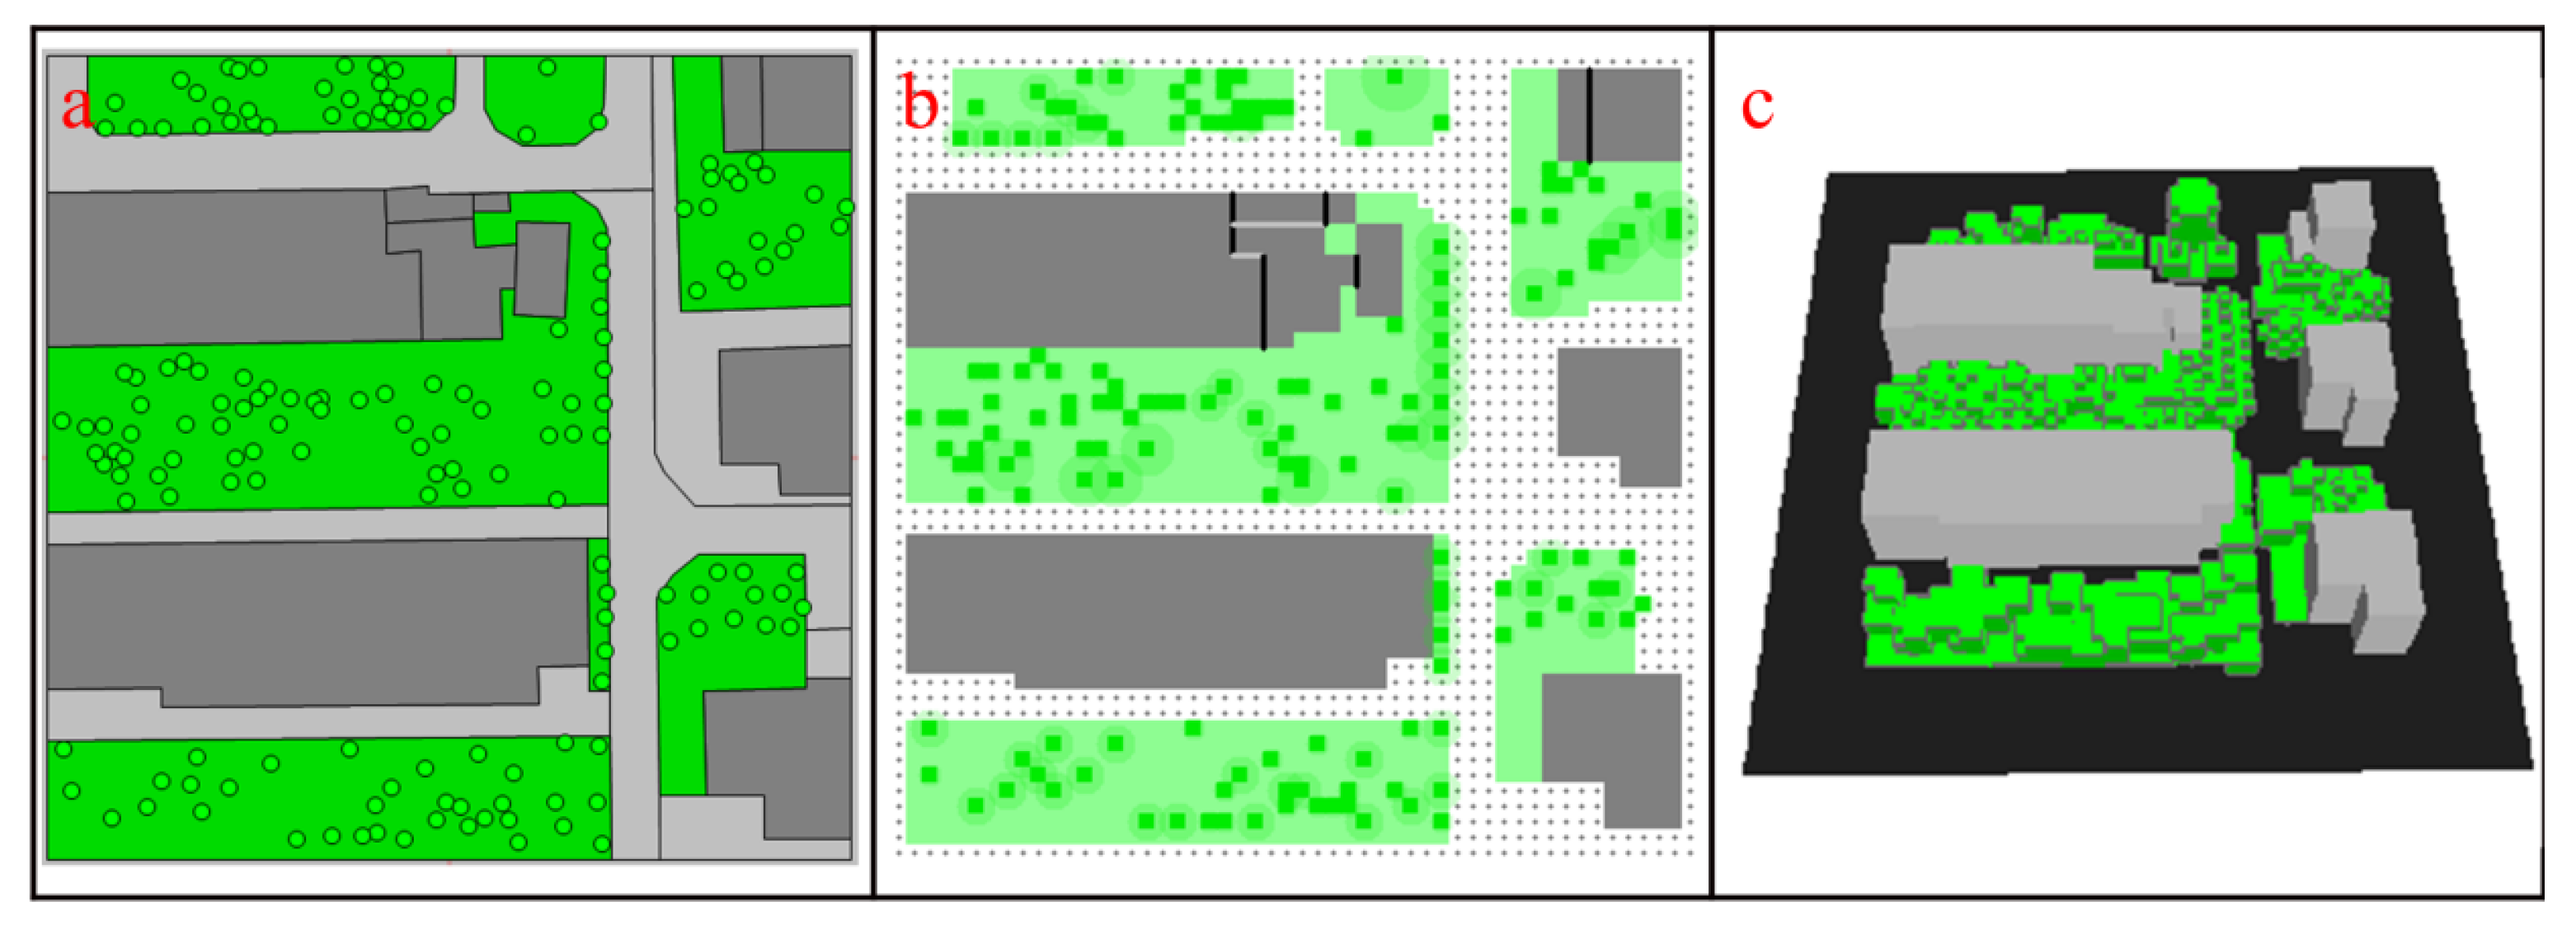
2.5. ENVI-Met Scenario Setting and Simulation

The input parameter settings of the model include area input, configuration, and database files. The area input file included location and size of the study site, categories of ground objects, and areas of various types of ground objects. The related software Context Capture was used to stitch the photos taken via a drone to obtain a complete image map of the study areas, following which ArcGIS 10.4 was used to vectorize the study area photos obtained via the UAV to generate an image interface that can be input into the ENVI-met software. The area input file was mainly the setting of the simulated area file. The realistic scenario creation is illustrated in Figure 4.
The database file includes parameter settings such as vegetation, green space, buildings, and soil. When setting vegetation, users can set parameters such as tree height, tree height width, and leaf shape according to their actual needs. The parameter settings of the configuration file include the AT and RH, wind speed and direction at 10 m, ground roughness, building material, and height. The hourly AT and RH obtained from the weather station were used as meteorological boundary conditions. Our actual field size was 100 m × 100 m. However, in order to minimize the edge effect and enhance the numerical stability, we added 10 empty cells: for each lateral boundary we expanded each edge outwards by 20 m in the simulation to reduce the influence of the model boundary on the simulation results. The final simulation area was a 70 × 70 × 20 3D cell grid, with a grid resolution of 2 × 2 ×3 (dx = 2 m, dy = 2 m, dz = 3 m), and the vertical grid cells of the near-ground was divided into five sub-grid cells. The simulation results were saved at hourly intervals. The specific parameter settings are listed in Table 4.

2.6. Numerical Simulation

2.6.1. Simulation under Different TCDs and Tree Coverage

In this study, 16 July 2021 was selected as the simulation date. To study the cooling effect of different cover and TCD in summer, five different steps of tree cover (10, 30, 50, 70, and 90%) and three different groups of TCD (3, 5, and 7 m) were set. A total of 15 scenes were created, in which we did not consider the influence of the crown shape; hence, we set the crown shape as a cylinder. In this study, the tree height was set to 7 m, except for the trees in the real scene. The cover ratio used in the study is the ratio of vegetation to the overall green space.
Base model: The basic scenario was the part left after all the trees in the realistic scenario were removed. In other words, the difference between the realistic scenario and the basic scene is only whether there are trees or not. In this paper, the analysis of the cooling effect of different scenes was based on the basic scenes.
Case 1 (C1): Tree coverage of 10% with 46 trees (17, 9) based on the base model, and TCD = 3(5, 7).
Case 2 (C2): Tree coverage of 30% with 138 trees (50, 25) based on the base model, and TCD = 3 (5, 7).
Case 3 (C3): Tree coverage of 50% with 230 trees (83, 42) based on the base model, and TCD = 3 (5, 7).
Case 4 (C4): Tree coverage of 70% with 322 trees (116, 59) based on the base model, and TCD = 3 (5, 7).
Case 5 (C5): Tree coverage of 90% with 414 trees (149, 76) based on the base model, and TCD = 3 (5, 7).

2.6.2. Simulation under Different TCDs, Tree Coverage, and Crown Shapes

Based on the above 15 scenes, we set three canopy shapes, namely cylindrical, conical, and ellipsoidal, for each group, creating a total of 45 scenes. According to three groups of different TCDs sizes and three different crown shapes, a total of nine single tree models (Table 5) were created in the vegetation database.
The single tree model used in the scenario was constructed in the submodule Albero in the ENVI-met software. The specific parameter settings of scenes were set in the same way as in the real scenario. In this study, a total of 5 h (09:00–14:00) were simulated with the first 2 h of data being used to stabilize the model, and the average of the simulated data for the 3 h (12:00–14:00) was selected to study the cooling and humidification effects of different scenarios.
Except for the tree configuration, all other settings of scenes, including weather boundary, forcing conditions, and category settings of ground objects, were consistent with the basic model, which can avoid the influence of the model itself on the simulation results. The average temperature with vegetation were compared with that without vegetation, and the cooling effect of trees under different configuration methods was analyzed.

2.7. Statistical Analysis

Python 3.6 and Sigmaplot 14.0 were adopted for statistical analysis. We also used IBM SPSS Statistics 26 for variance analysis to compare the differences in cooling capacity between different scenes. The data acquired by the sensors and those exported using the ENVI-met software were processed using Python software; we used the software to calculate the correlation coefficient R2 between simulated and measured data, as well as the RMSE and index of agreement (d). Scatter plots, histograms, and line plots were produced using Sigmaplot software to compare the cooling and humidification effects of the different tree coverage, TCD, and canopy shapes in summer.

3. Results

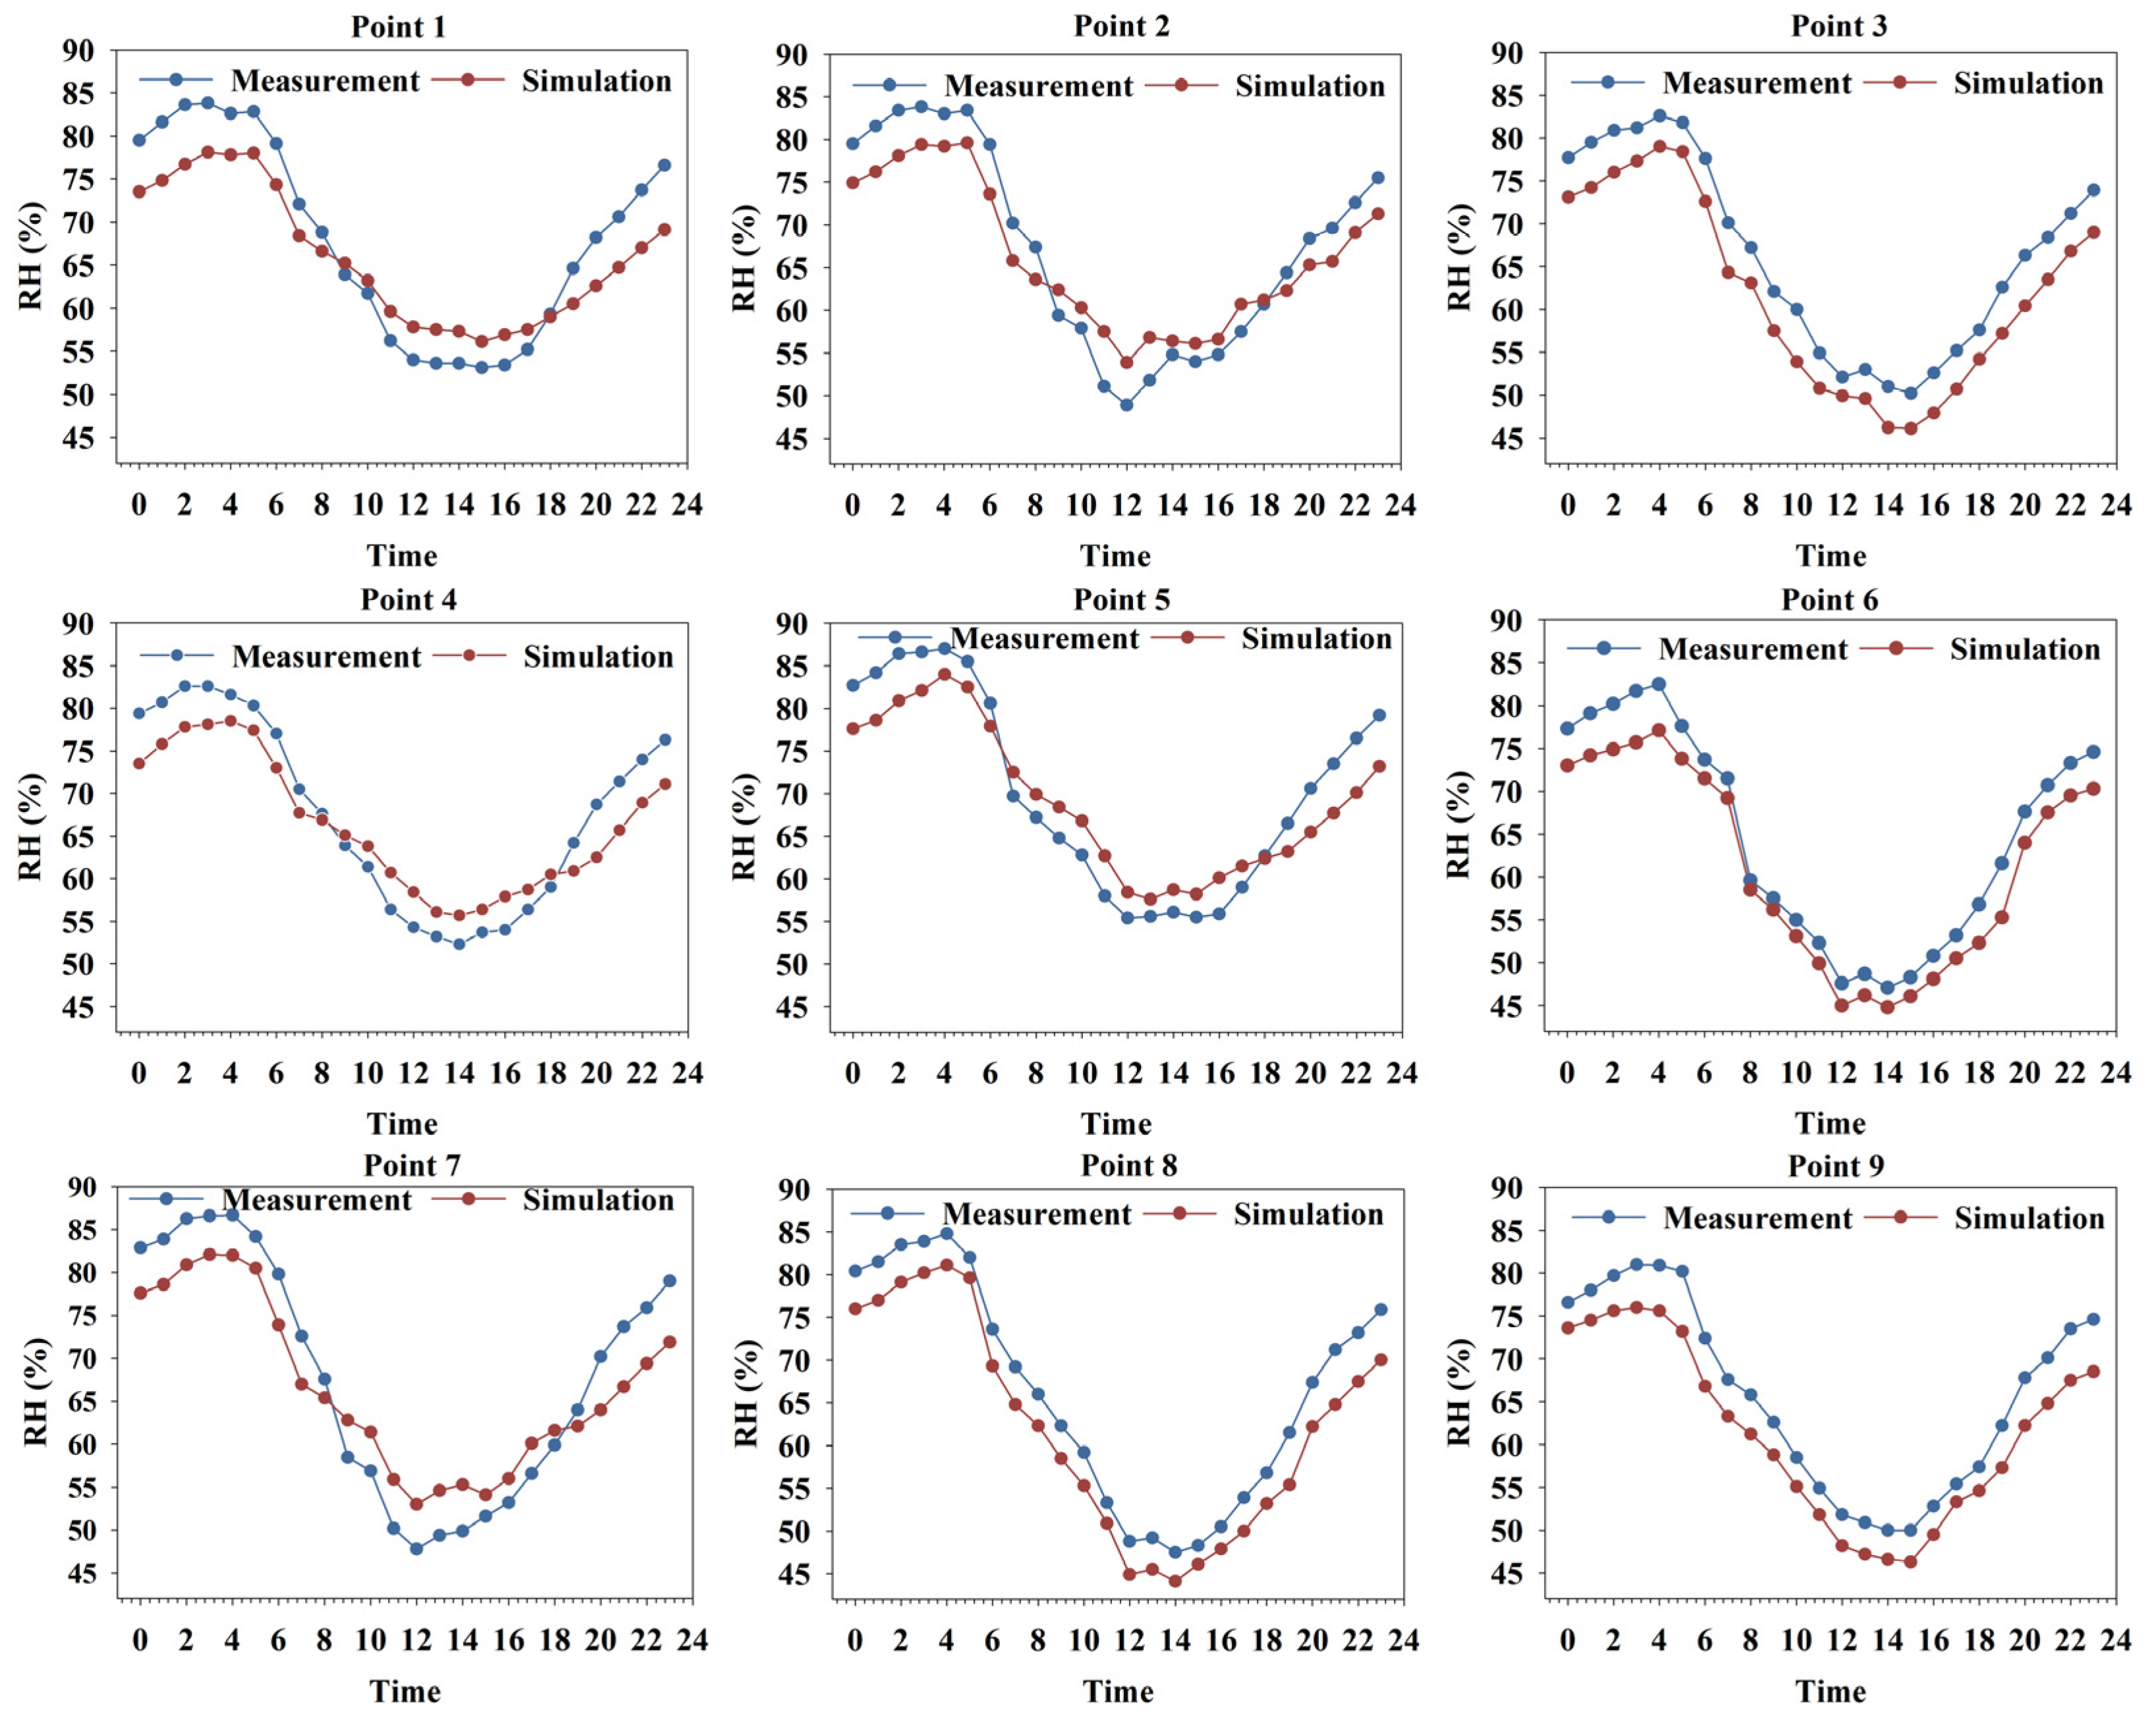
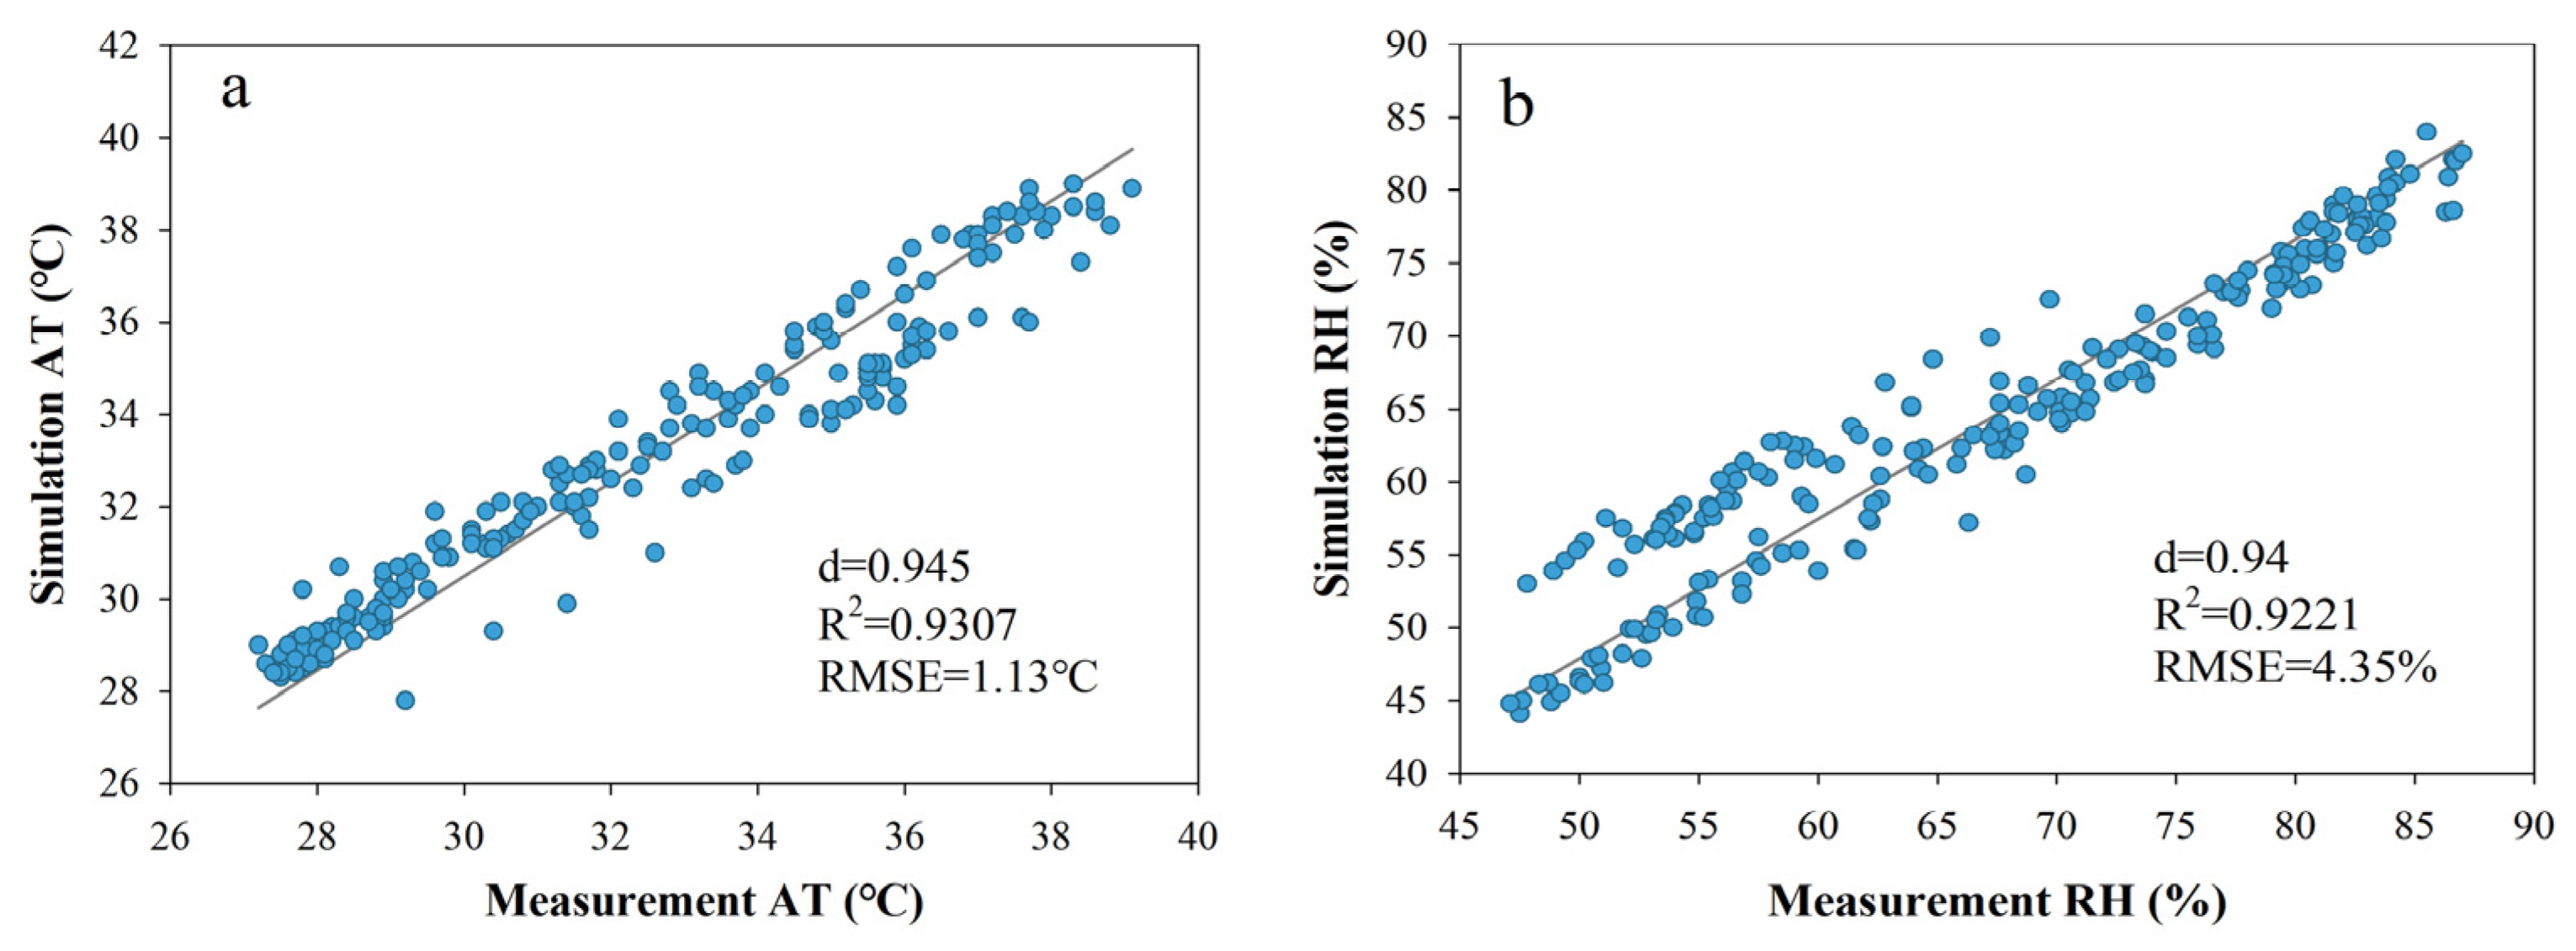
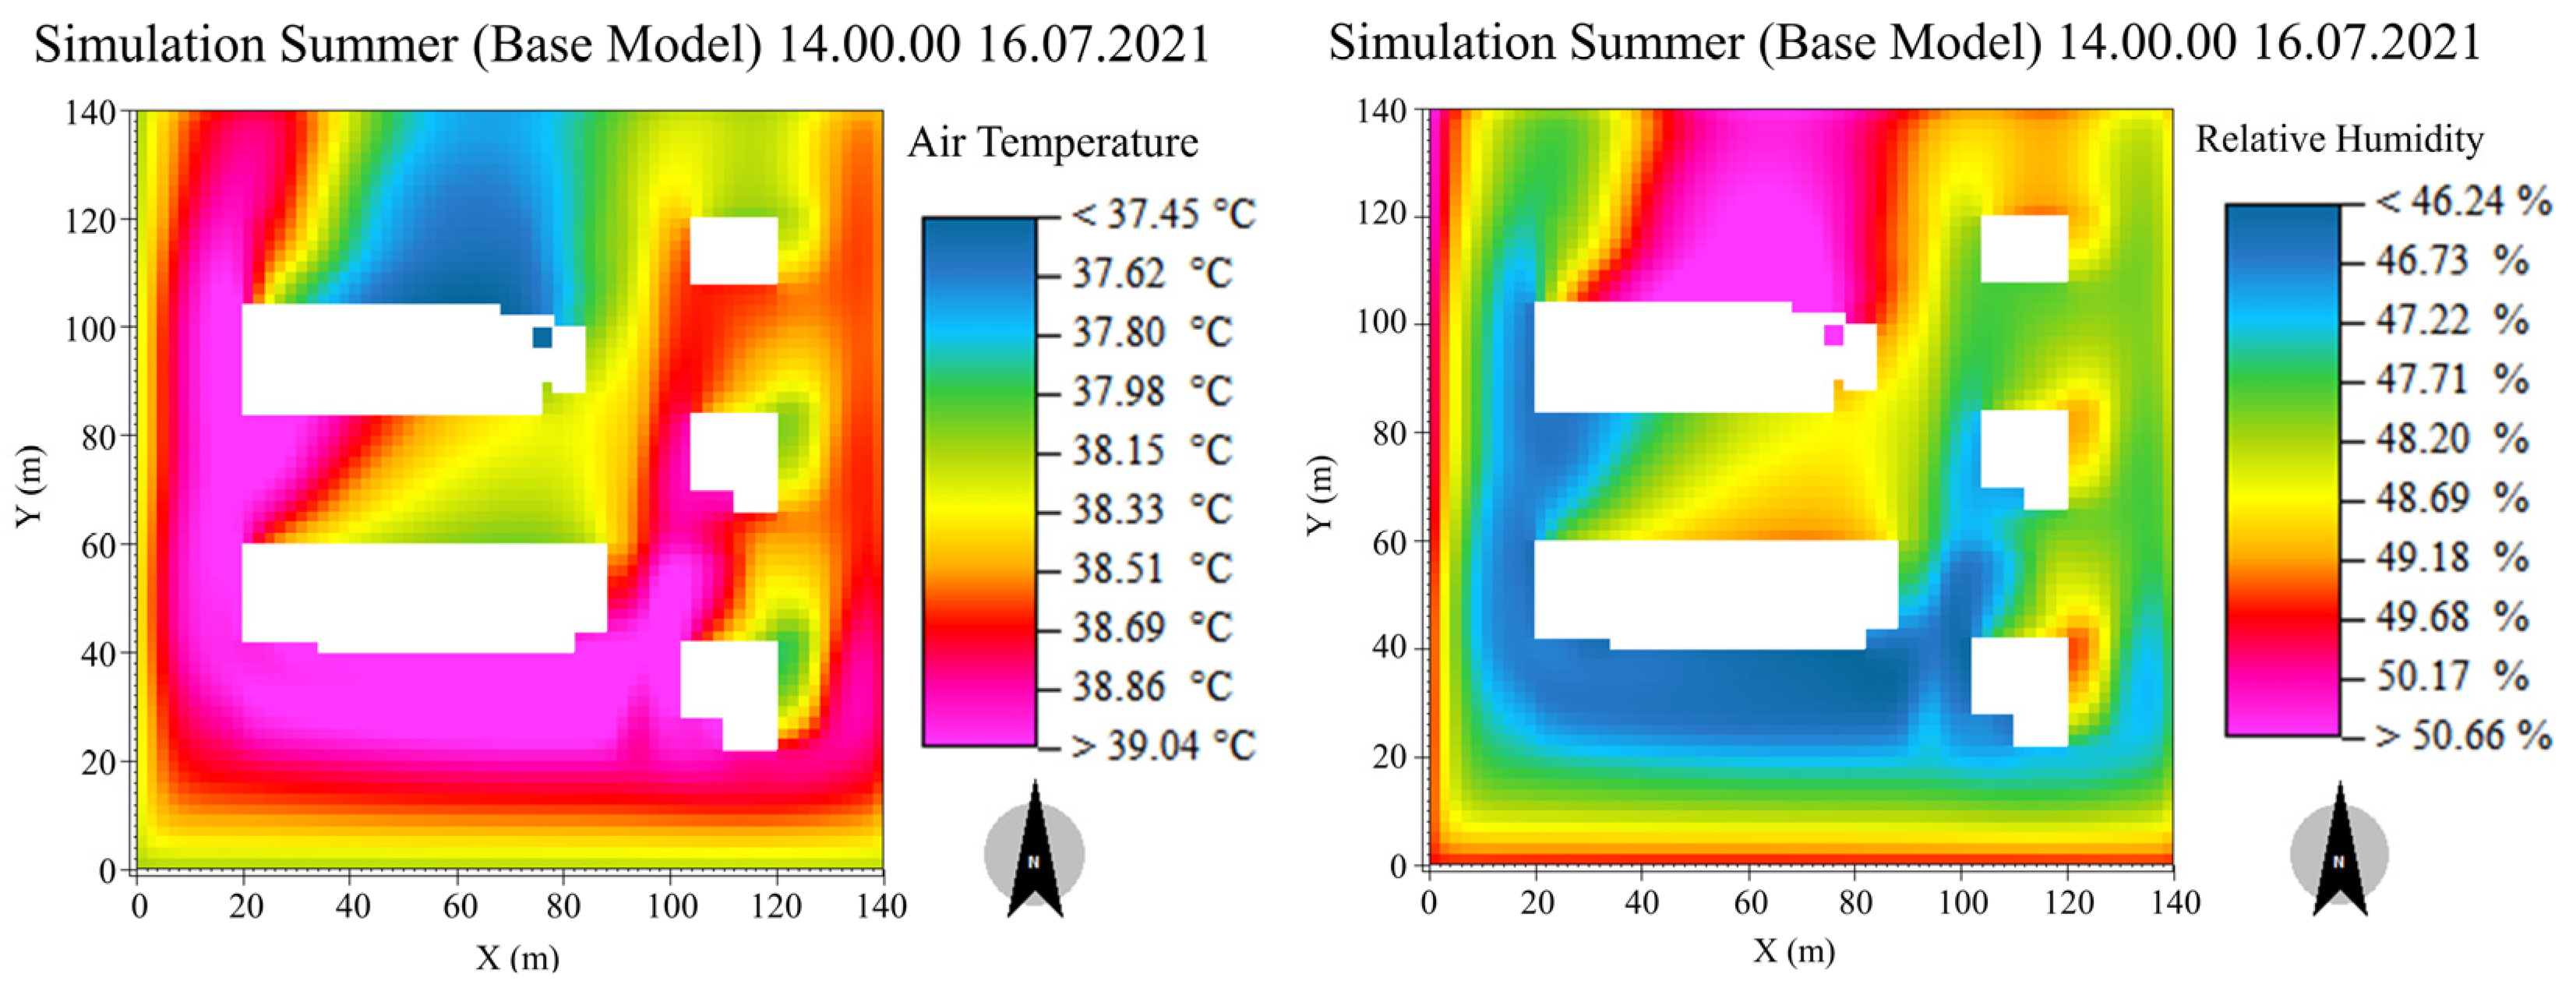
3.1. ENVI-Met Accuracy Verification

To ensure the reliability of the model output, the model was validated to ensure the authenticity of the simulation results of the later scenarios and facilitate further analysis and comparison of the results. In this study, we selected the data from 16 July to verify the model, because it was the hottest day in the three-day experiment: the maximum AT was 38.2 °C and average AT was 32.8 °C. Since the height of the sensor was set to 1.5 m, the simulation results should also be at 1.5 m for the AT and RH. The output results following simulation were analyzed, viewed, and exported through LEONARDO in the ENVI-met module.
Figure 5 shows the changes of the measured AT data of nine wireless sensors and the simulated AT data of the corresponding points of the wireless sensors during the whole day of 16 July. In the daytime, the AT data of wireless sensors which were placed in the unobstructed positions were overestimated, while the AT data of wireless sensors which were placed under the tree were underestimated. All measuring points were overestimated in the nighttime. Although there were differences between the simulated data and the measured data, the simulated data were in good agreement with the measured data of the corresponding sensor location, and the maximum temperature of each point in the simulated data appeared at the same time as the measured data of the corresponding sensor location. From the simulation results, we know that the temperature of the uncovered monitoring points was always higher than that of the trees in the shade, which was completely consistent with the actual situation, which also indicates that ENVI-met model can simulate the spatial distribution of temperature.
Figure 6 shows the 24-h simulated humidity data were consistent with measured humidity data. In the daytime, the measured humidity data in the uncovered place were lower than those from around the grass and trees, because trees provide shade and increase humidity, and the simulated humidity data also conform to this phenomenon. Humidity was generally underestimated in the nighttime.
Although the simulated data of nine points were in good agreement with the measured data, we also needed to evaluate the overall accuracy of the model. We extracted the hourly data of the nine wireless sensors corresponding to the monitoring point at 1.5 m above the ground from the simulation results, with a total of 216 simulate results. At the same time, we also analyzed the correlation between the 24-h measured data collected by nine sensors and the 24-h simulated data of the corresponding nine points. Finally, a total of 216 pairs of simulated and measured data were collected. Figure 7 shows that the R2 of AT was 0.9307, indicating that the simulated values were strongly correlated with the measured values. Root mean square error (RMSE) and index of agreement (d) were used to assess the difference between simulated and measured data. The RMSE of AT and RMSE of RH were 1.13 °C and 4.35%, respectively, and the d of AT and d of RH were 0.945 and 0.94, respectively.

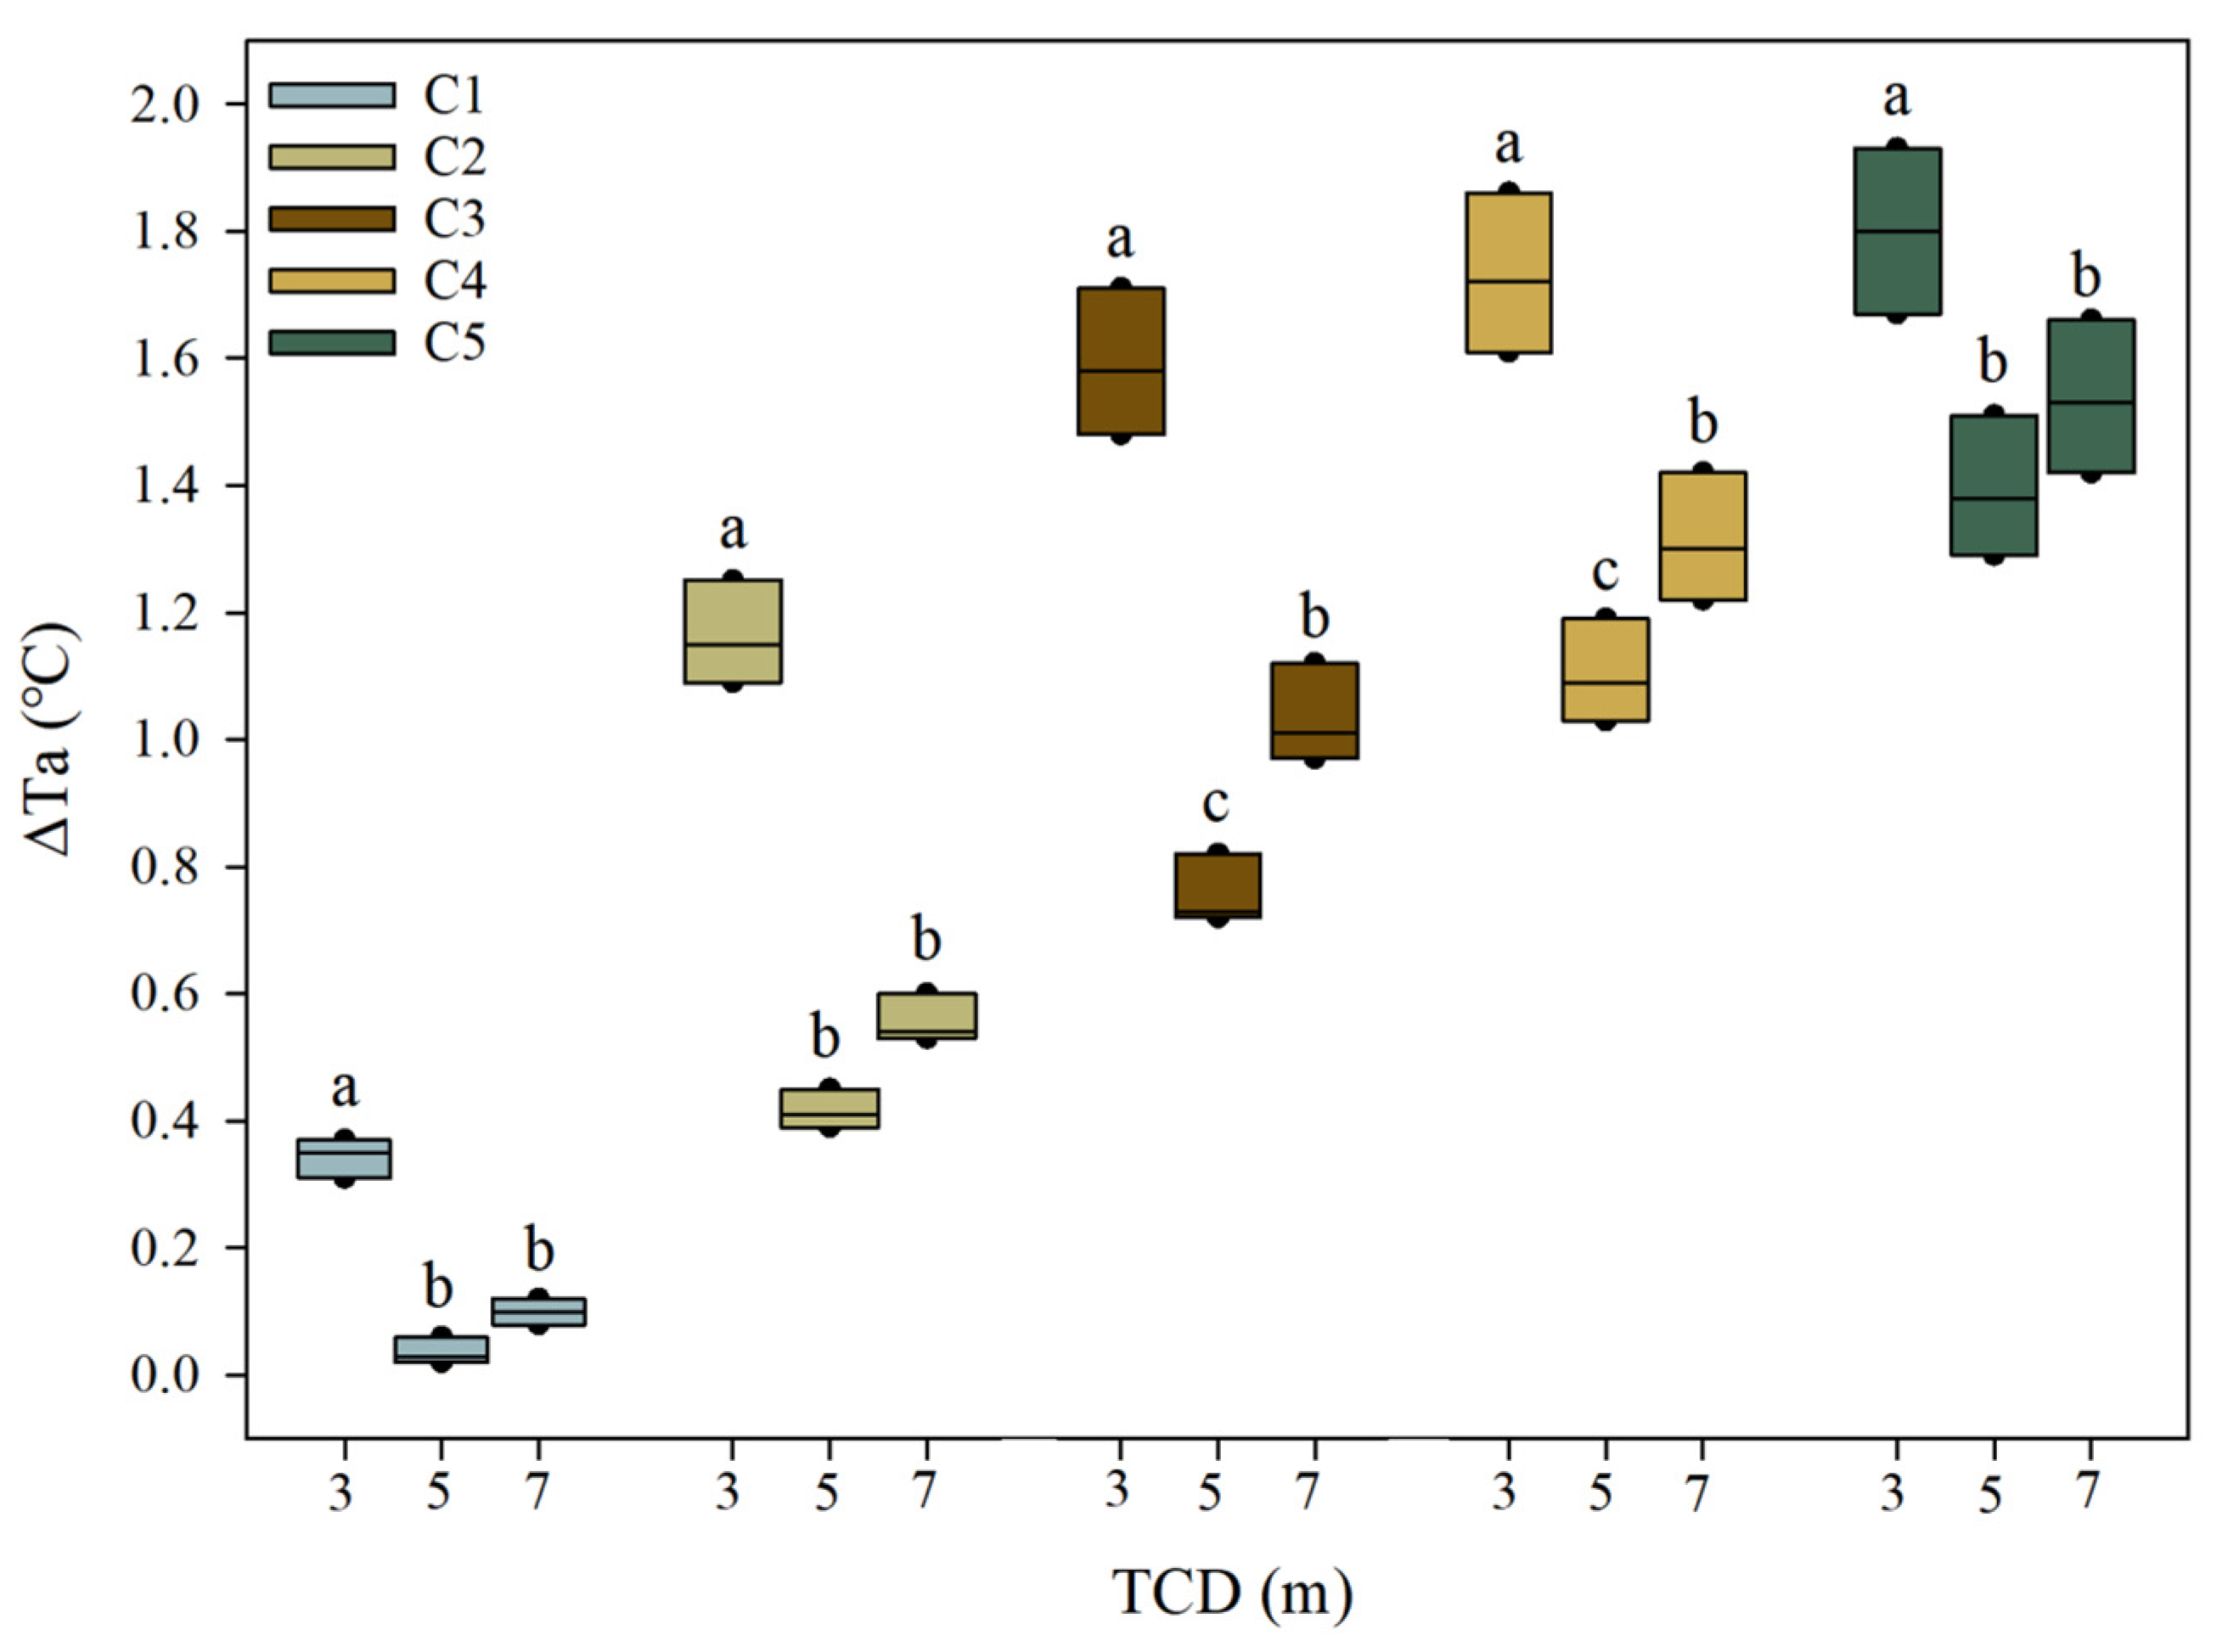
3.2. Effects of TCD on AT and RH under Different Coverages

To better compare the cooling and humidifying effects of each created scene, we used the scene without trees as the base scene for comparison and selected 12:00–14:00 as the period for analysis, with the AT and RH values at 1.5 m. The variation range of AT of the basic model was 37.79–38.46 °C, and the average temperature was 38.14 ± 0.34 °C. The variation range of RH was 48.33–51.27%, and the average AT was 50.07 ± 1.54%. The maximum temperature occurs at 14:00 (38.46 °C), which is very hot in summer. Figure 8 illustrates the AT and RH plan of the basic model at a height of 1.5 m at 14:00.
∆ATij = ATbase model − ATij
where i could be 1, 2, or 3, which corresponded to TCD of 3 m, 5 m, and 7 m, respectively, and j could be 1, 2, 3, 4, or 5 which corresponded to coverage of 10%, 30%, 50%, 70%, and 90%, respectively. ∆ATij indicates the average cooling capacity of a scenario with TCD of i and coverage of j. ATbase model indicates the average air temperature of the base scenario. ATij indicates the average air temperature of the TCD of i and coverage of j.
∆RHij = RHij − RHbase model
where i could be 1, 2, 3, which corresponded to TCD of 3 m, 5 m, and 7 m, respectively, and j could be 1, 2, 3, 4, 5 which corresponded to coverage of 10%, 30%, 50%, 70%, 90%, respectively. ∆RHij indicates the average humidity capabilities of a scenario with TCD of i and coverage of j. RHbase model indicates the average relative humidity of the base scenario. RHij indicates the average relative humidity of the TCD of i and coverage of j.
Figure 9 demonstrates the increasing magnitude of the cooling capacity of trees with an increasing tree coverage ratio. At C1, all three scenes with different TCD showed the weakest cooling effect, the ∆AT11, ∆AT21, ∆AT31 is 0.34, 0.04, and 0.10 °C, respectively; meanwhile, at C5, all three scenes with different TCD showed the strongest cooling effect, with an average cooling of 1.80, 1.39, and 1.54 °C, respectively. The cooling effect of TCD at the 3 m scene was significantly higher than that at 5 and 7 m (p < 0.05), and the biggest difference was among the three scenarios in C3; the ∆AT13, ∆AT23, ∆AT33 is 1.59, 0.76, and 1.03 °C, respectively. Only in scene C3 or C4 was the average cooling effect of TCD at 7 m significantly higher than that at 5 m (p < 0.05). Under the same tree coverage ratio, the cooling effect of TCD at 7 m scene was consistently stronger than that at 5 m.

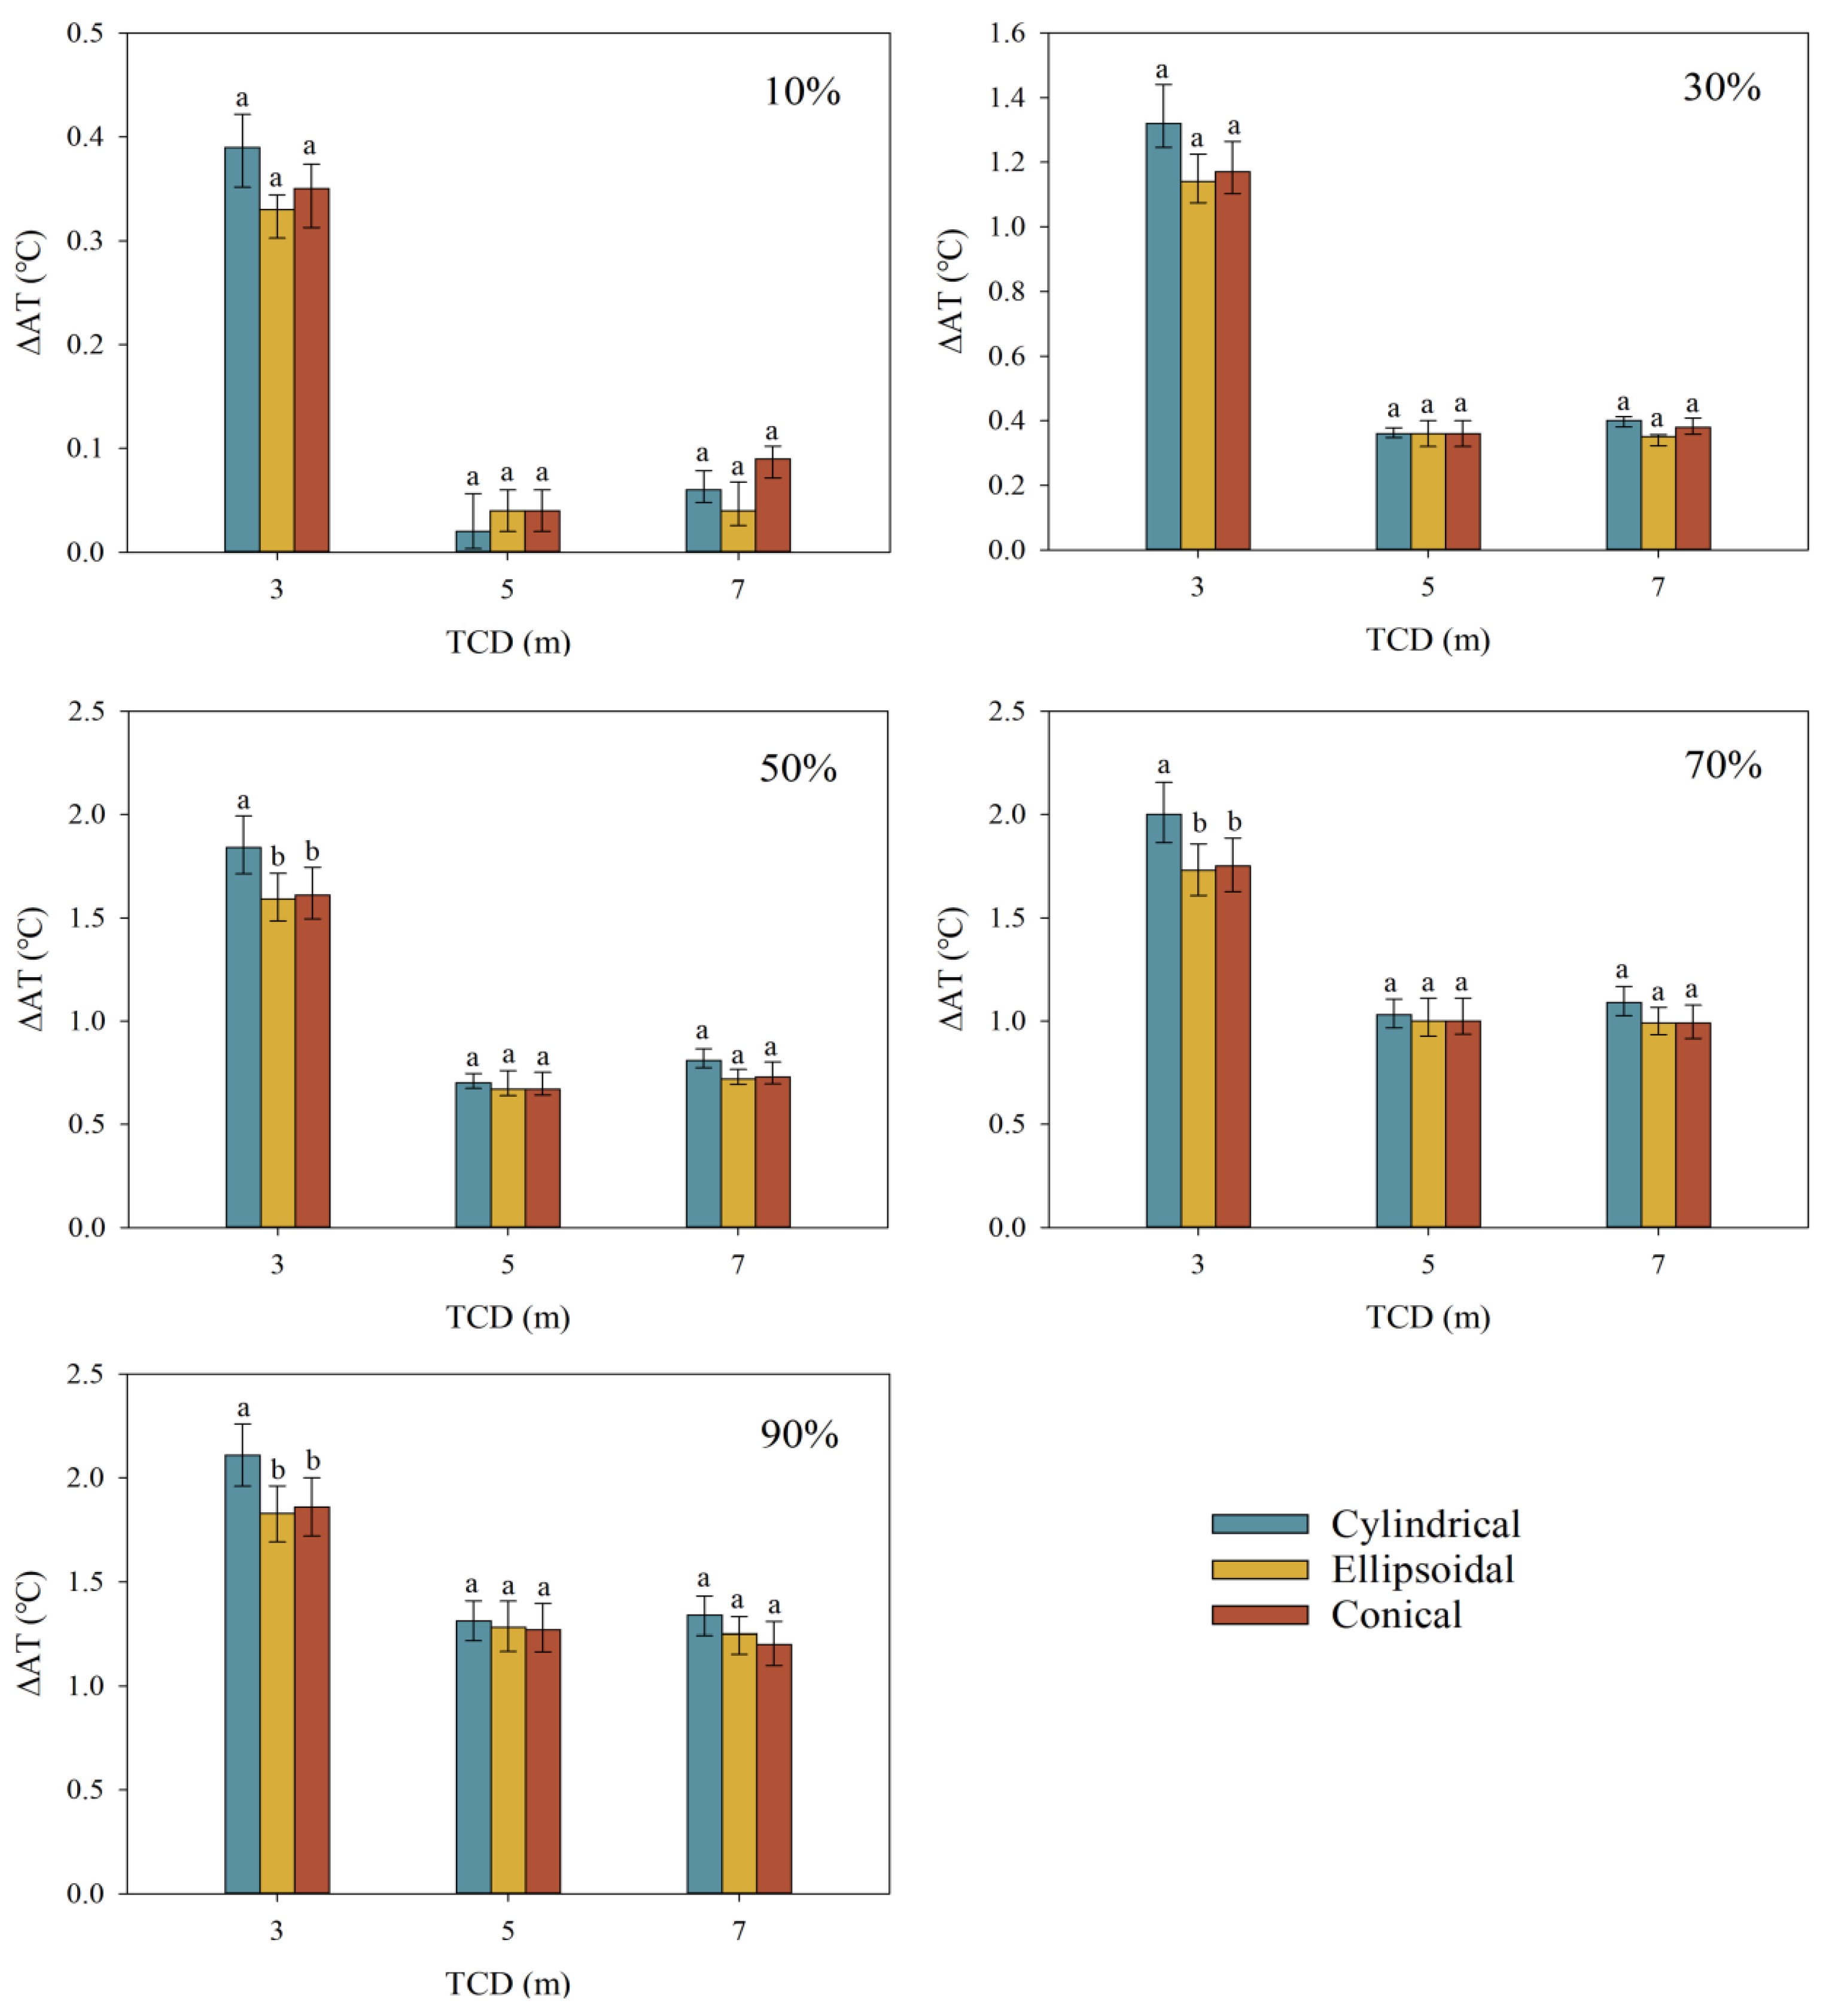
3.3. Effects of Canopy Shapes on AT and RH under Different Coverage and TCD

Crown shape also affected the cooling effect of trees. The influence of the same crown shape differed under different crown diameters and coverage. The histogram shown in Figure 10 illustrates the effect of changing in canopy shape of the trees on the temperature of the study area for five different tree coverage ratios and three different TCDs.
The cooling effect of all scenarios increases with increasing tree coverage. When the tree coverage was at 10%, the difference between the three different canopy shapes at the same TCD was minimal and did not exceed 0.1 °C. The maximum cooling of the three canopy shapes with a TCD of 3 m could reach 0.3–0.4 °C. However, the effect of the three canopy shapes with a TCD of 5 and 7 m on the air temperature was minimal. The maxi-mum cooling value of the scene was reached when the tree coverage was 90%, where the average ∆AT of the three crown shapes, cylindrical shape, conical shape, and ellipsoidal shape, was 2.11 ± 0.15 °C, 1.82 ± 0.13 °C, and 1.86 ± 0.14 °C, respectively; at TCD of 3 and 5 m, the average ∆AT was 1.31 ± 0.10 °C, 1.29 ± 0.12 °C, and 1.28 ± 0.12 °C, respectively, and 1.34 ± 0.09 °C, 1.24 ± 0.09 °C, and 1.20 ± 0.10 °C, respectively, at 7 m. When the tree coverage ratio was 50%, the difference between three TCDs was the biggest, the difference between different TCDs of the same canopy shape was also the biggest, and the cooling effects of trees with cylindrical shapes under three TCDs (3, 5, and 7 m) were 1.86 ± 0.14 °C, 0.71 ± 0.04 °C, and 0.82 ± 0.05 °C, respectively; those with conical and ellipsoidal shapes both were 1.60 ± 0.12 °C, 0.70 ± 0.06 °C, and 0.73 ± 0.04 °C, respectively.
Figure 10 also shows no significant difference among the three crown shapes with a TCD at 5 or 7 m, with a difference of <0.1 °C, regardless of coverage.
The three crown shapes with a TCD of 3 m differed under different coverage. Under the same coverage, the cylindrical shape showed the strongest cooling capacity, while conical and ellipsoidal shapes showed the same cooling capacity, with a maximum difference of <0.1 °C. In addition, there was no significant difference among the three crown shapes when the tree coverage was <50%, while with a TCD of 3 m, the difference between them was <0.2 °C. At TCD of 3 m and tree coverage ratio of >50%, the cooling capacity of the tree with a cylindrical shape was significantly higher than that of the other two crown shapes (p < 0.05).

4. Discussion

4.1. Differences between the Simulated and Measured Values

The AT correlation between the simulated and measured values was 0.9307, the RH correlation was 0.9221, and the d between the simulated and measured values was >0.90, indicating that TLS can be used as an important means of tree reconstruction and be applied to the creation of vegetation in ENVI-met model. The RMSE was 1.13 °C for AT and 4.35% for RH in the simulated and measured values. The results were similar to some studies [40,48], with an underestimation during the day and an overestimation at night. The reasons for the discrepancy between simulated and measured data are attributed to three reasons, namely the limitations of the model itself, the complexity of the realistic scenario, and the data of processing method.
Firstly, the ENVI-met model is limited in the solar radiation input and does not allow users to input by the hour, which may cause the AT in the uncovered place to be overestimated. The inaccuracy in the calculation of energy consumption of simulated buildings accounts for the difference between the simulated and measured values [49]. The model also does not consider radiation between buildings and leaves. These factors impact the surrounding environment [50].
Secondly, the vegetation used in the ENVI-met model was a simplified tree model, while the actual tree geometry is irregular and difficult to digitize [51]. The climate of a residential area is affected by several factors, such as the thermal insulation and radiation characteristics of buildings, concrete, and soil. Human factors also lead to greater differences when the flow of people and vehicles increases, as vehicle fuel combustion and human metabolism release a lot of waste heat [52]. Weather condition is another factor since the wind speed and direction change in real time, while the wind speed and direction in the simulation always remain constant [53]. These factors contribute to the differences between the measured and simulated values. ENVI-met could not accurately simulate the shaded areas of the tree, hence the temperature in the shade of trees is easily underestimated in the daytime and overestimated in the nighttime [54,55].
However, there was a limitation in our study that the sensors we used were not verified for radiation prior to use. Both natural shading and incorrect shading methods can lead to bias in the sensor data, and the sensor bias may be more obvious when the solar radiation was too high or the wind speed was too low; this bias was particularly apparent during the day and has little effect at night [56,57,58]. This may result in a greater data collection from sensors placed in exposed environments than the truthful data.

4.2. Effect of TCD and Tree Coverage Ratio on the Cooling Effect

Vegetation is one of the factors that alleviate urban thermal environment problems; the canopy structure is the main factor for vegetation to exert its cooling effects. In the limited urban open space, we must select the appropriate tree size and tree coverage to maximize the cooling effect of trees. Previous studies have suggested tree coverage ratio as a factor affecting air and surface temperatures, with higher coverage having a more powerful effect. When air flows through green space, trees can alter the wind characteristics that affect air dispersion. Generally, a higher tree coverage rate can effectively reduce wind speed through the canopy while increasing the time to change the thermal characteristics of the air mass [23]. The cooling effect of trees in this study also generally increased with increasing tree coverage ratio [24]; however, after reaching a certain peak, the increase gradually decreases, which indicates that when the vegetation coverage reaches a certain threshold, the cooling effect is optimum. It has been previously reported that the threshold of optimal vegetation coverage depends on the regional location and climatic conditions. The cooling effect of trees is the greatest when the vegetation coverage is 40% in the Midwest of the United States [27], while for some subtropical seasonal climatic regions, the cooling effect of vegetation tends to be stable when the coverage is 20–30% [59], similar to our results.
When the tree coverage rate exceeded 50%, and the increasing rate of the cooling effect gradually decreased as the tree coverage rate increased. Our study also confirmed that canopy size is an important factor in the cooling effect. Indeed, the cooling effect of trees of different canopy sizes in a scene with equal coverage varied between scenes; the cooling effect was strongest in the TCD of 3 m, followed by 7 m, while TCD at 5 m showed the weakest cooling effect. The scene with a TCD of 3 m was considerably higher than that of the other two crown shapes when the tree coverage ratios were >30%. When considering only a single tree in the thermal environment, the cooling effect of large canopies was stronger than that of small canopies. Still, under the same level of tree coverage, trees with smaller crown diameters indicated more trees.
Multiple small patches can provide more shade than a single large patch when the total area covered is the same; the more small patches a scene has, the more shade the tree will provide [26,60]. For the same level of coverage, scenes with a 7 m canopy are cooler than those with a 5 m canopy, possibly since larger canopy trees are more effective at blocking short-wave radiation from the sun and sky, as well as long-wave radiation from the sky and from inside nearby buildings [61]. The cooling capacity and shading effect of larger canopy diameter is greater than that of a small canopy [29,62]. At a coverage of 30%, the ∆AT between the three groups of different TCDs was the largest. The average ∆AT of the TCD at the 3 m scene was 0.56 and 0.83 °C higher than that of the other two scenes, respectively, while at a tree coverage of 10%, the TCD of the 5 m tree scene had a negligible cooling effect on the area (<0.1 °C), yet markedly impacts surface and building temperatures [63].

4.3. Effect of Different Canopy Shapes on the Thermal Environment

In this study, the tree canopy characteristics were correlated with the surrounding thermal environment, as previously reported [17,29]. The differences in the effect of different canopy shapes on the surrounding environment are mainly due to different canopy shapes having different canopy structures, resulting in different shading and wind protection capacities [64,65]. Further, we observed that the cooling effect of the cylindrical shape was greater than that of the ellipsoidal and conical shapes, consistent with a previous study [18]. When TCD was at 3 m, the ∆AT of cylindrical shape was larger with a value of 0.2–0.3 °C than the other shapes. Although the three crown shapes with a TCD of 3 m are narrow at the same coverage level, they have a higher total canopy density, and are associated with the highest number of trees.
A canopy with multiple layers of leaves can reduce the maximum transmittance, and the photosynthesis and transpiration of the trees are also stronger [66,67], which indirectly leads to a better cooling effect. However, different crown shapes do not show great differences in cooling effect in TCD at 5 or 7 m. At a TCD of 5 m, the influence of canopy shape on the surrounding thermal environment becomes less important, with no significant differences between crown shapes. At a TCD of 7 m, the difference between the three canopy shapes occurred only when there was sufficient tree coverage (>70%), and the cylindrical shape was 0.1 °C higher than the other two. The difference between the three canopy shapes with TCD at 5 and 7 m was the smallest. The total leaf area index of all three canopy shapes was set to a constant value to eliminate the influence of other parameters, in which leaf area index was an important factor affecting the cooling capacity of the trees [13,29]. Furthermore, the three canopy shapes have the same short-wave radiation transmittance and dense crowns, hence the solar radiation can hardly penetrate the crown and only a very small amount of light beams and radiation reach the ground [16].

5. Conclusions

In this study, we reconstructed trees in the real scene with TLS and used the reconstructed trees in the real scene simulation. The simulation results were verified, and the simulation data were in good agreement with the measured data. Therefore, when ENVI-met is used to simulate the real scene, TLS can be considered as an important means of tree reconstruction, which can restore the real trees and improve the simulation accuracy of the model. Under the five coverage gradients, the cooling effect of trees increases with the increase in coverage. Tree crown diameter can produce significant cooling effect under the same coverage; the cooling effect of trees with TCD of 3 m was significantly higher than that of the other two crown diameters (p < 0.05). We recommend planting trees with small crown diameter since they provide a better cooling effect. Moreover, at a coverage of 50%, the cooling effect among the three tree crowns showed the biggest difference. The crown shape was also an important factor affecting the cooling effect of several trees, as the tree coverage exceeded 50%, the cooling effect of the cylindrical shapes was significantly higher than that of the other two crowns under the same coverage (p < 0.05), however, the difference of the cooling effect between TCD at 5 and 7 m remained small (<0.1 °C). In future urban planning and construction projects, we recommend selecting appropriate tree coverage and tree crown diameter and making use of the limited available space to achieve maximum cooling effect. More attention should be paid to the use of sensors in future studies, especially in open sites, and radiation shields need to be repeatedly verified before use or higher quality radiation shields and sensors need to be used to reduce errors; when this error is minimized, the study can be reliable.

Author Contributions

Methodology, H.W. and Y.C.; software, H.W., W.D. and F.Z.; validation, H.W. and Y.C.; formal analysis, H.W. and Y.C.; investigation, H.W., L.Z., Y.D., J.S., C.L. (Chen Li) and B.S.; resources, H.W., Y.C., Y.D., J.S., C.L. (Chen Li) and B.S.; data curation, H.W.; writing—original draft preparation, H.W.; writing—review and editing, H.W. and Y.C.; visualization, H.W., C.L. (Chong Li) and G.Z.; supervision, C.L. (Chong Li) and G.Z.; project administration, H.W, Y.C. and G.Z. All authors have read and agreed to the published version of the manuscript.

Funding

This research was funded by the National Natural Science Foundation of China (grant number: U1809208).

Data Availability Statement

Not applicable.

Conflicts of Interest

The authors declare that they have no known competing financial interests or personal relationships that could have appeared to influence the work reported in this paper.

References

  1. Qaid, A.; Bin Lamit, H.; Ossen, D.R.; Raja Shahminan, R.N. Urban Heat Island and Thermal Comfort Conditions at Micro-Climate Scale in a Tropical Planned City. Energy Build. 2016, 133, 577–595. [Google Scholar] [CrossRef]
  2. Ha, J.; Kim, H. Changes in the Association between Summer Temperature and Mortality in Seoul, South Korea. Int. J. Biometeorol. 2013, 57, 535–544. [Google Scholar] [CrossRef] [PubMed]
  3. Xinchuang, X.; Quansheng, G.; Shanfeng, H.; Xuezhen, Z.; Xunliang, X.; Guang Xu, L. Impact of High Temperature on the Mortality in Summer of Wuhan, China. Environ. Earth Sci. 2016, 75, 543. [Google Scholar] [CrossRef]
  4. Allen, M.J.; Sheridan, S.C. Mortality Risks during Extreme Temperature Events (ETEs) Using a Distributed Lag Non-Linear Model. Int. J. Biometeorol. 2018, 62, 57–67. [Google Scholar] [CrossRef] [PubMed]
  5. Chen, K.; Bi, J.; Chen, J.; Chen, X.; Huang, L.; Zhou, L. Influence of Heat Wave Definitions to the Added Effect of Heat Waves on Daily Mortality in Nanjing, China. Sci. Total Environ. 2015, 506–507, 18–25. [Google Scholar] [CrossRef] [PubMed]
  6. Shindell, D.; Zhang, Y.; Scott, M.; Ru, M.; Stark, K.; Ebi, K.L. The Effects of Heat Exposure on Human Mortality Throughout the United States. GeoHealth 2020, 4, e2019GH000234. [Google Scholar] [CrossRef] [Green Version]
  7. Avissar, R. Potential Effects of Vegetation on the Urban Thermal Environment. Atmos. Environ. 1996, 30, 437–448. [Google Scholar] [CrossRef]
  8. Liao, J.; Tan, X.; Li, J. Evaluating the Vertical Cooling Performances of Urban Vegetation Scenarios in a Residential Environment. J. Build. Eng. 2021, 39, 102313. [Google Scholar] [CrossRef]
  9. Barradas, V.L.; Miranda, J.A.; Esperón-Rodríguez, M.; Ballinas, M. (Re)Designing Urban Parks to Maximize Urban Heat Island Mitigation by Natural Means. Forests 2022, 13, 1143. [Google Scholar] [CrossRef]
  10. Roth, M.; Lim, V.H. Evaluation of Canopy-Layer Air and Mean Radiant Temperature Simulations by a Microclimate Model over a Tropical Residential Neighbourhood. Build. Environ. 2017, 112, 177–189. [Google Scholar] [CrossRef]
  11. Gkatsopoulos, P. A Methodology for Calculating Cooling from Vegetation Evapotranspiration for Use in Urban Space Microclimate Simulations. Procedia Environ. Sci. 2017, 38, 477–484. [Google Scholar] [CrossRef]
  12. Deng, J.; Pickles, B.J.; Kavakopoulos, A.; Blanusa, T.; Halios, C.H.; Smith, S.T.; Shao, L. Concept and Methodology of Characterising Infrared Radiative Performance of Urban Trees Using Tree Crown Spectroscopy. Build. Environ. 2019, 157, 380–390. [Google Scholar] [CrossRef]
  13. Lin, B.S.; Lin, Y.J. Cooling Effect of Shade Trees with Different Characteristics in a Subtropical Urban Park. HortScience 2010, 45, 83–86. [Google Scholar] [CrossRef] [Green Version]
  14. Cheung, P.K.; Jim, C.Y.; Hung, P.L. Preliminary Study on the Temperature Relationship at Remotely-Sensed Tree Canopy and below-Canopy Air and Ground Surface. Build. Environ. 2021, 204, 108169. [Google Scholar] [CrossRef]
  15. Kántor, N.; Kovács, A.; Takács, Á. Small-Scale Human-Biometeorological Impacts of Shading by a Large Tree. Open Geosci. 2016, 8, 231–245. [Google Scholar] [CrossRef] [Green Version]
  16. Konarska, J.; Lindberg, F.; Larsson, A.; Thorsson, S.; Holmer, B. Transmissivity of Solar Radiation through Crowns of Single Urban Trees-Application for Outdoor Thermal Comfort Modelling. Theor. Appl. Climatol. 2014, 117, 363–376. [Google Scholar] [CrossRef]
  17. Cai, Y.; Li, C.; Ye, L.; Xiao, L.; Gao, X.; Mo, L.; Du, H.; Zhou, Y.; Zhou, G. Effect of the Roadside Tree Canopy Structure and the Surrounding on the Daytime Urban Air Temperature in Summer. Agric. For. Meteorol. 2022, 316, 108850. [Google Scholar] [CrossRef]
  18. Speak, A.; Montagnani, L.; Wellstein, C.; Zerbe, S. The Influence of Tree Traits on Urban Ground Surface Shade Cooling. Landsc. Urban Plan. 2020, 197, 103748. [Google Scholar] [CrossRef]
  19. Wang, Y.; Akbari, H. The Effects of Street Tree Planting on Urban Heat Island Mitigation in Montreal. Sustain. Cities Soc. 2016, 27, 122–128. [Google Scholar]
  20. Oshio, H.; Kiyono, T.; Asawa, T. Numerical Simulation of the Nocturnal Cooling Effect of Urban Trees Considering the Leaf Area Density Distribution. Urban For. Urban Green. 2021, 66, 127391. [Google Scholar] [CrossRef]
  21. Karimi, A.; Sanaieian, H.; Farhadi, H.; Norouzian-Maleki, S. Evaluation of the Thermal Indices and Thermal Comfort Improvement by Different Vegetation Species and Materials in a Medium-Sized Urban Park. Energy Rep. 2020, 6, 1670–1684. [Google Scholar] [CrossRef]
  22. Middel, A.; Chhetri, N.; Quay, R. Urban Forestry and Cool Roofs: Assessment of Heat Mitigation Strategies in Phoenix Residential Neighborhoods. Urban For. Urban Green. 2015, 14, 178–186. [Google Scholar] [CrossRef]
  23. Wu, Z.; Man, W.; Ren, Y. Influence of Tree Coverage and Micro-Topography on the Thermal Environment within and beyond a Green Space. Agric. For. Meteorol. 2022, 316, 108846. [Google Scholar] [CrossRef]
  24. Ouyang, W.; Morakinyo, T.E.; Ren, C.; Ng, E. The Cooling Efficiency of Variable Greenery Coverage Ratios in Different Urban Densities: A Study in a Subtropical Climate. Build. Environ. 2020, 174, 106772. [Google Scholar] [CrossRef]
  25. Aminipouri, M.; Knudby, A.J.; Krayenhoff, E.S.; Zickfeld, K.; Middel, A. Modelling the Impact of Increased Street Tree Cover on Mean Radiant Temperature across Vancouver’s Local Climate Zones. Urban For. Urban Green. 2019, 39, 9–17. [Google Scholar] [CrossRef]
  26. Jiao, M.; Zhou, W.; Zheng, Z.; Wang, J.; Qian, Y. Patch Size of Trees Affects Its Cooling Effectiveness: A Perspective from Shading and Transpiration Processes. Agric. For. Meteorol. 2017, 247, 293–299. [Google Scholar] [CrossRef]
  27. Ziter, C.D.; Pedersen, E.J.; Kucharik, C.J.; Turner, M.G. Scale-Dependent Interactions between Tree Canopy Cover and Impervious Surfaces Reduce Daytime Urban Heat during Summer. Proc. Natl. Acad. Sci. USA 2019, 116, 7575–7580. [Google Scholar] [CrossRef] [Green Version]
  28. Wu, Z.; Dou, P.; Chen, L. Comparative and Combinative Cooling Effects of Different Spatial Arrangements of Buildings and Trees on Microclimate. Sustain. Cities Soc. 2019, 51, 101711. [Google Scholar] [CrossRef]
  29. Zhang, J.; Gou, Z. Tree Crowns and Their Associated Summertime Microclimatic Adjustment and Thermal Comfort Improvement in Urban Parks in a Subtropical City of China. Urban For. Urban Green. 2021, 59, 126912. [Google Scholar] [CrossRef]
  30. Liu, D.; Hu, S.; Liu, J. Contrasting the Performance Capabilities of Urban Radiation Field between Three Microclimate Simulation Tools. Build. Environ. 2020, 175, 106789. [Google Scholar] [CrossRef]
  31. Bruse, M.; Fleer, H. Simulating Surface-Plant-Air Interactions inside Urban Environments with a Three Dimensional Numerical Model. Environ. Model. Softw. 1998, 13, 373–384. [Google Scholar] [CrossRef]
  32. Fahed, J.; Kinab, E.; Ginestet, S.; Adolphe, L. Impact of Urban Heat Island Mitigation Measures on Microclimate and Pedestrian Comfort in a Dense Urban District of Lebanon. Sustain. Cities Soc. 2020, 61, 102375. [Google Scholar] [CrossRef]
  33. Faragallah, R.N.; Ragheb, R.A. Evaluation of Thermal Comfort and Urban Heat Island through Cool Paving Materials Using ENVI-Met. Ain Shams Eng. J. 2022, 13, 101609. [Google Scholar] [CrossRef]
  34. Tsoka, S.; Tsikaloudaki, A.; Theodosiou, T. Analyzing the ENVI-Met Microclimate Model’s Performance and Assessing Cool Materials and Urban Vegetation Applications–A Review. Sustain. Cities Soc. 2018, 43, 55–76. [Google Scholar] [CrossRef]
  35. Abdallah, A.S.H.; Hussein, S.W.; Nayel, M. The Impact of Outdoor Shading Strategies on Student Thermal Comfort in Open Spaces between Education Building. Sustain. Cities Soc. 2020, 58, 102124. [Google Scholar] [CrossRef]
  36. Rui, L.; Buccolieri, R.; Gao, Z.; Gatto, E.; Ding, W. Study of the Effect of Green Quantity and Structure on Thermal Comfort and Air Quality in an Urban-like Residential District by ENVI-Met Modelling. Build. Simul. 2019, 12, 183–194. [Google Scholar] [CrossRef]
  37. Salata, F.; Golasi, I.; de Lieto Vollaro, R.; de Lieto Vollaro, A. Urban Microclimate and Outdoor Thermal Comfort. A Proper Procedure to Fit ENVI-Met Simulation Outputs to Experimental Data. Sustain. Cities Soc. 2016, 26, 318–343. [Google Scholar] [CrossRef]
  38. Vos, P.E.J.; Maiheu, B.; Vankerkom, J.; Janssen, S. Improving Local Air Quality in Cities: To Tree or Not to Tree? Environ. Pollut. 2013, 183, 113–122. [Google Scholar] [CrossRef]
  39. Jing, L.; Liang, Y. The Impact of Tree Clusters on Air Circulation and Pollutant Diffusion-Urban Micro Scale Environmental Simulation Based on ENVI-Met. IOP Conf. Ser. Earth Environ. Sci. 2021, 657, 12008. [Google Scholar] [CrossRef]
  40. Cortes, A.; Rejuso, A.J.; Santos, J.A.; Blanco, A. Evaluating Mitigation Strategies for Urban Heat Island in Mandaue City Using ENVI-Met. J. Urban Manag. 2022, 11, 97–106. [Google Scholar] [CrossRef]
  41. Yang, J.; Hu, X.; Feng, H.; Marvin, S. Verifying an ENVI-Met Simulation of the Thermal Environment of Yanzhong Square Park in Shanghai. Urban For. Urban Green. 2021, 66, 127384. [Google Scholar] [CrossRef]
  42. Simon, H.; Lindén, J.; Hoffmann, D.; Braun, P.; Bruse, M.; Esper, J. Modeling Transpiration and Leaf Temperature of Urban Trees—A Case Study Evaluating the Microclimate Model ENVI-Met against Measurement Data. Landsc. Urban Plan. 2018, 174, 33–40. [Google Scholar] [CrossRef]
  43. Šimek, M.; Elhottová, D.; Klimeš, F.; Hopkins, D.W. Emissions of N2O and CO2, Denitrification Measurements and Soil Properties in Red Clover and Ryegrass Stands. Soil Biol. Biochem. 2004, 36, 9–21. [Google Scholar] [CrossRef]
  44. Trochta, J.; Kr\uuček, M.; Vrška, T.; Král, K. 3D Forest: An Application for Descriptions of Three-Dimensional Forest Structures Using Terrestrial LiDAR. PLoS ONE 2017, 12, e0176871. [Google Scholar] [CrossRef] [PubMed] [Green Version]
  45. Jacobs, M.; Rais, A.; Pretzsch, H. Analysis of Stand Density Effects on the Stem Form of Norway Spruce Trees and Volume Miscalculation by Traditional Form Factor Equations Using Terrestrial Laser Scanning (TLS). Can. J. For. Res. 2020, 50, 51–64. [Google Scholar] [CrossRef]
  46. Weiser, H.; Winiwarter, L.; Anders, K.; Fassnacht, F.E.; Höfle, B. Opaque Voxel-Based Tree Models for Virtual Laser Scanning in Forestry Applications. Remote Sens. Environ. 2021, 265, 112641. [Google Scholar] [CrossRef]
  47. Gao, X.; Li, C.; Cai, Y.; Ye, L.; Xiao, L.; Zhou, G.; Zhou, Y. Influence of Scale Effect of Canopy Projection on Understory Microclimate in Three Subtropical Urban Broad-Leaved Forests. Remote Sens. 2021, 13, 3786. [Google Scholar] [CrossRef]
  48. Baloloy, A.; Cruz, J.A.; Sta Ana, R.R.; Blanco, A.; Lubrica, N.V.; Valdez, C.J.; Bernardo, J.J. Modelling and Simulation of Potential Future Urbanization Scenarios and Its Effect on the Microclimate of Lower Session Road, Baguio City. ISPRS Ann. Photogramm. Remote Sens. Spat. Inf. Sci. 2020, 5, 187–194. [Google Scholar] [CrossRef]
  49. López-Cabeza, V.P.; Galán-Marín, C.; Rivera-Gómez, C.; Roa-Fernández, J. Courtyard Microclimate ENVI-Met Outputs Deviation from the Experimental Data. Build. Environ. 2018, 144, 129–141. [Google Scholar] [CrossRef]
  50. Krayenhoff, E.S.; Christen, A.; Martilli, A.; Oke, T.R. A Multi-Layer Radiation Model for Urban Neighbourhoods with Trees. Boundary-Layer Meteorol. 2014, 151, 139–178. [Google Scholar] [CrossRef]
  51. Liu, Z.; Zheng, S.; Zhao, L. Evaluation of the ENVI-Met Vegetation Model of Four Common Tree Species in a Subtropical Hot-Humid Area. Atmosphere 2018, 9, 198. [Google Scholar] [CrossRef]
  52. Hu, Z.; Yu, B.; Chen, Z.; Li, T.; Liu, M. Numerical Investigation on the Urban Heat Island in an Entire City with an Urban Porous Media Model. Atmos. Environ. 2012, 47, 509–518. [Google Scholar] [CrossRef]
  53. Acero, J.A.; Arrizabalaga, J. Evaluating the Performance of ENVI-Met Model in Diurnal Cycles for Different Meteorological Conditions. Theor. Appl. Climatol. 2018, 131, 455–469. [Google Scholar] [CrossRef]
  54. Li, X.; Zhou, W.; Ouyang, Z. Relationship between Land Surface Temperature and Spatial Pattern of Greenspace: What Are the Effects of Spatial Resolution? Landsc. Urban Plan. 2013, 114, 1–8. [Google Scholar] [CrossRef]
  55. Rahman, M.A.; Hartmann, C.; Moser-Reischl, A.; von Strachwitz, M.F.; Paeth, H.; Pretzsch, H.; Pauleit, S.; Rötzer, T. Tree Cooling Effects and Human Thermal Comfort under Contrasting Species and Sites. Agric. For. Meteorol. 2020, 287, 107947. [Google Scholar] [CrossRef]
  56. Terando, A.J.; Youngsteadt, E.; Meineke, E.K.; Prado, S.G. Ad Hoc Instrumentation Methods in Ecological Studies Produce Highly Biased Temperature Measurements. Ecol. Evol. 2017, 7, 9890–9904. [Google Scholar] [CrossRef]
  57. Nakamura, R.; Mahrt, L. Air Temperature Measurement Errors in Naturally Ventilated Radiation Shields. J. Atmos. Ocean. Technol. 2005, 22, 1046–1058. [Google Scholar] [CrossRef] [Green Version]
  58. Erell, E.; Leal, V.; Maldonado, E. Measurement of Air Temperature in the Presence of a Large Radiant Flux: An Assessment of Assively Ventilated Thermometer Screens. Boundary-Layer Meteorol. 2005, 114, 205–231. [Google Scholar] [CrossRef]
  59. Grimmond, C.S.B.; Oke, T.R. Turbulent Heat Fluxes in Urban Areas: Observations and a Local-Scale Urban Meteorological Parameterization Scheme (LUMPS). J. Appl. Meteorol. 2002, 41, 792–810. [Google Scholar] [CrossRef]
  60. He, C.; Zhou, L.; Yao, Y.; Ma, W.; Kinney, P.L. Cooling Effect of Urban Trees and Its Spatiotemporal Characteristics: A Comparative Study. Build. Environ. 2021, 204, 108103. [Google Scholar] [CrossRef]
  61. Liu, H.; Lim, J.Y.; Wint Hnin Thet, B.; Lai, P.Y.; Koh, W.S. Evaluating the Impact of Tree Morphologies and Planting Densities on Outdoor Thermal Comfort in Tropical Residential Precincts in Singapore. Build. Environ. 2022, 221, 109268. [Google Scholar] [CrossRef]
  62. Skelhorn, C.; Lindley, S.; Levermore, G. The Impact of Vegetation Types on Air and Surface Temperatures in a Temperate City: A Fine Scale Assessment in Manchester, UK. Landsc. Urban Plan. 2014, 121, 129–140. [Google Scholar] [CrossRef]
  63. Petri, A.C.; Wilson, B.; Koeser, A. Planning the Urban Forest: Adding Microclimate Simulation to the Planner’s Toolkit. Land use policy 2019, 88, 104117. [Google Scholar] [CrossRef]
  64. Kong, F.; Yan, W.; Zheng, G.; Yin, H.; Cavan, G.; Zhan, W.; Zhang, N.; Cheng, L. Retrieval of Three-Dimensional Tree Canopy and Shade Using Terrestrial Laser Scanning (TLS) Data to Analyze the Cooling Effect of Vegetation. Agric. For. Meteorol. 2016, 217, 22–34. [Google Scholar] [CrossRef]
  65. Wang, J.; Guo, W.; Wang, C.; Yao, Y.; Kou, K.; Xian, D.; Zhang, Y. Tree Crown Geometry and Its Performances on Human Thermal Comfort Adjustment. J. Urban Manag. 2021, 10, 16–26. [Google Scholar] [CrossRef]
  66. de Abreu-Harbich, L.V.; Labaki, L.C.; Matzarakis, A. Effect of Tree Planting Design and Tree Species on Human Thermal Comfort in the Tropics. Landsc. Urban Plan. 2015, 138, 99–109. [Google Scholar] [CrossRef]
  67. Shahidan, M.F.; Shariff, M.K.M.; Jones, P.; Salleh, E.; Abdullah, A.M. A Comparison of Mesua ferrea L. and Hura crepitans L. for Shade Creation and Radiation Modification in Improving Thermal Comfort. Landsc. Urban Plan. 2010, 97, 168–181. [Google Scholar] [CrossRef]
Figure 1. Location of the study area, and arrangement of wireless sensors. Wireless sensors at points 1, 2, 4, 5, and 7 were placed in the shade of trees, and wireless sensors at points 3, 6, 8, and 9 were placed in unobstructed places.
Forests 14 00080 g001
Figure 2. (a) Pictures of wireless sensor monitoring in sample plots. (b) Image of the reference weather station in the campus and at 2 m above the ground.
Forests 14 00080 g002
Figure 3. Creation of a single tree model. (a) Single tree point cloud data obtained using the TLS device. (b) Single point cloud data after voxel processing. (c) Single tree model created using ENVI-met.
Forests 14 00080 g003
Figure 4. Realistic scenario creation process: (a) plane figure of the real scene, (b) the 2D display diagram of the real scene in ENVI-met, and (c) the 3D display diagram of the real scene in ENVI-met.
Forests 14 00080 g004
Figure 5. Simulated and measured air temperature data of nine points on 16 July 2021.
Forests 14 00080 g005
Figure 6. Simulated and measured relative humidity data of nine points on 16 July 2021.
Forests 14 00080 g006
Figure 7. The relationship between the measured and simulated data of AT (a) and RH (b) on 16 July 2021.
Forests 14 00080 g007
Figure 8. Distribution of simulated AT and RH at 1.5 m in the simulation domain at 14:00 in the summer (16 July 2021) base model.
Forests 14 00080 g008
Figure 9. Comparison of cooling effects of three different crown diameters (TCD = 3, 5, and 7 m) under five groups of coverage, the tree coverage of C1, C2, C3, C4, and C5 was 10, 30, 50, 70, and 90%, respectively. Lowercase letter (a, b, c) above the boxes indicate significant differences among three different crown diameters (TCD = 3, 5, and 7 m) for five groups of coverage (C1, C2, C3, C4, C5) at p < 0.05.
Forests 14 00080 g009
Figure 10. Effects of the three canopy shapes with three crown diameters on AT and RH under five groups of tree coverage during summer. Lowercase letter (a, b) above the boxes indicate significant differences among three different canopy shapes with same tree crown diameter for five groups of coverage (10%, 30%, 50%, 70%, 90%) at p < 0.05.
Forests 14 00080 g010
Table 1. Area and percentage of land cover types in the study area.
Open Space ElementsArea (m2)Percent (%)
Student apartment301430.14
Green space414241.12
Roads284428.44
Table 2. Specifications data of wireless sensor.
ParameterSensor TypeMeasuring RangeAccuracyResolutionResponse Time
Air TemperatureGHHB-001-485−40–80 °C0.1 °C0.1 °C60 s
Relative HumidityGHHB-001-4850–100%0.3%0.1%60 s
Table 3. System specifications for Leica ScanStation C5 equipment.
ParameterValue
Field of view270° × 360°
Range size35 m @ ≥ 5% albedo
Scan rate25,000 pts/s
Accuracy of position6 mm
Accuracy of distance4 mm
Minimum point spacing<1 mm
Operating temperature0–40 °C
Table 4. ENVI-met model parameter settings.
ParametersValue/Source
Maximum air temperature at 2 m (°C)38.2
Minimum air temperature at 2 m (°C)28.2
Maximum relative humidity at 2 m (%)87.5
Minimum relative humidity at 2 m (%)48.2
Wind speed at 10 m (m/s)1.1
Wind direction at 10 mSW
Grid cell size (Δx, Δy, Δz)2, 2, 3
Number of grid cells (Δx, Δy, Δz)70, 70, 20
Boundary conditionSimple Forcing
Simulation duration24 h
Roughness length 0.01
Albedo of road0.2
Emissivity of road0.9
Albedo of glass0.2
Transmittance of glass0.3
Table 5. Nine individual trees of different crown sizes and canopy shapes.
ShapeTCD = 3 mTCD = 5 mTCD = 7 m
Cylindrical shapeForests 14 00080 i001Forests 14 00080 i002Forests 14 00080 i003
Ellipsoidal shapeForests 14 00080 i004Forests 14 00080 i005Forests 14 00080 i006
Conical shapeForests 14 00080 i007Forests 14 00080 i008Forests 14 00080 i009
Disclaimer/Publisher’s Note: The statements, opinions and data contained in all publications are solely those of the individual author(s) and contributor(s) and not of MDPI and/or the editor(s). MDPI and/or the editor(s) disclaim responsibility for any injury to people or property resulting from any ideas, methods, instructions or products referred to in the content.

