Article

Daily Dynamics of Soil Heat Flux and Its Relationship with Net Radiation in Different Urban Riparian Woodlands

1
School of Agriculture and Biology, Shanghai Jiao Tong University, Shanghai 200240, China
2
School of Design, Shanghai Jiao Tong University, Shanghai 200240, China
3
Shanghai Engineering Research Center of Sustainable Plant Innovation, Shanghai 200231, China
*
Author to whom correspondence should be addressed.
Forests 2022, 13(12), 2062; https://doi.org/10.3390/f13122062
Submission received: 17 October 2022 / Revised: 20 November 2022 / Accepted: 29 November 2022 / Published: 4 December 2022
(This article belongs to the Special Issue Urban Forest and Urban Microclimate)

Abstract

:
Soil heat flux (G) not only affects the Earth’s surface energy balance but also models of calculating soil evaporation. A better understanding on the effect of timing, soil and vegetation on riparian G helps to improve energy balance closure and G simulation in riparian areas with various woodlands. This paper examined diurnal and seasonal variation patterns of soil heat flux in urban riparian areas, together with its relationship with net radiation (Rn) including midday G/Rn and the hysteresis phenomenon under the mutual influence of the timing, soil wetness and vegetation conditions. Study sites lie in the riparian areas of Shanghai with seven vegetation-covered conditions—grassland (CH), broadleaf evergreen woodlands with shrubs (CCO), broadleaf evergreen woodlands (CCH), broadleaf deciduous woodlands with shrubs (CUO), broadleaf deciduous woodlands (CUH), conifer with shrubs (CMO) and conifer (CMH). Hourly data of Rn and G on typical days in four seasons starting from 11/2020 to 10/2021 were obtained with automated data-logging sensors. Diurnal variations in soil heat flux were characterized as two patterns depending on leaf area index (LAI)—unimodal curves followed cycles of Rn in woodlands with low LAI (CCH, CCO, CH and CUO) and sinusoidal ones in woodlands with high LAI (CMO, CMH and CUH). Midday G/Rn was generally no more than 10% with slight variations in most woodlands across the four seasons, but upward trends in the grass and CUO were observed in the afternoon. They were found significantly correlated with SWC. For sparse-canopied riparian sites, hourly G was found to be significantly correlated with Rn and SWC in summer, whereas, for dense sites, the role of canopy characteristics overwhelmed soil properties. Equations were derived to estimate diurnal G from Rn, SWC and LAI. The G of all riparian sites was subject to hysteresis problems to Rn. Phase shifts ranged from one to eight hours in riparian sites and were positively related with LAI and SWC, mainly accounting for the second diurnal pattern of G.

1. Introduction

The microclimatic characteristics of one ecosystem depends on a series of energy exchanging and partitioning from net radiation (Rn) into sensible and latent heat, as well as soil heat [1]. Soil heat flux (G) indicates energy exchanges between the soil surface and subsoil during a given time period [2]. It determines how fast soil temperature changes and influences the rates of chemical and biological processes in the soil, which are essential to plant growth. As a key component of the surface energy balance, G, despite being typically smaller than sensible and latent heat flux (H and LE), not only plays an important role in energy balance closure [3] but also interacts energy transfer processes at the surface (surface energy balance) with energy transfer processes in the soil (soil thermal regime). In that case, information on soil heat variations exerts significant implications for microclimate maintenance and micro-habitats construction, which, in turn, affects the performance and management strategies of plant communities [4,5,6].
G was parameterized as a constant proportion of Rn that is fixed for a period of interest in some studies [2,7]. However, it is neither constant nor negligible on diurnal timescales, particularly for sites of sparse vegetation [8]. The achievement of accurate variations in G is important for measurements and analysis with the Bowen ratio energy balance approach, since it depends on the accurate value of available energy (Rn-G). A number of studies have resulted in a wealth of data concerning G on different temporal scales, either as a parameter alone or as one of the energy balance components. The direction and magnitude of G and its relationship with Rn are proven to be closely related to aboveground vegetation properties [9,10,11], water availability (e.g., soil moisture), topographic features and macroclimate conditions (e.g., the time of a day). For example, G in the mosses of high northern latitudes was found to be 57% lower in summer [12]. Studies on annual crops prove changes in vegetation covers can greatly influence the relative magnitude of energy flux components as a response to differences in morphological canopy attributes of various plant species [8,13]. Payero et al. proposed that relationships between G and Rn in grass and alfalfa depended on plant canopy height [8]. Canopy characteristics (e.g., leaf area index) have a great influence on the amount of radiation that soil surface can receive. In addition, a previous study observed differences in G values due to soil moisture that can be affected by differences in vegetation physiological activities (i.e., evapotranspiration and root water uptake) [14]. Traditionally, the canopied woodland was regarded as a whole to make comparisons of vegetation types, mainly between forests and grassland [15,16]. However, although the role of vegetation characteristics in the soil heat flux and its relationship with net radiation have been increasingly noticed [17], relatively few efforts have been made to characterize the impact of their specific morphologies and structures on soil heat and relationships of soil heat flux to net radiation.
Riparian areas are characterized by reciprocal exchanges on energy occurring between terrestrial and aquatic systems. Different from other ecosystems, the presence of rivers in these areas substantially affects the energy partitioning into soil heat [18], and the relationship between soil heat and net radiation. Concerning soil heat, a wide variety of homogeneously covered surfaces, including deserts, grasslands, crops and orchards, were researched [6], but little attention is given to forests, especially riparian forests, and their inter-site differences under different vegetation indices and soil moisture. It is well acknowledged that the cool and moist microclimate that riparian areas maintain makes these areas function as valuable habitats for distinctive flora and fauna communities. Considering this, an enhanced understanding on the spatial–temporal variabilities of G and its relationships with Rn in vegetation-covered riparian areas may theoretically provide insights for energy balance in riparian areas and practically contribute to urban riparian forestry management, such as species selection, plant community configuration, pruning and thinning strategies of woodlands to maintain the riparian microclimate and soil thermal regimes.
G influences soil temperature regime and evapotranspiration at a daily scale. In addition, it had a negligible impact on the annual energy balance [19], so only soil heat flux at the daily scale are discussed. This work was conducted in the riparian areas of Shanghai, a typical metropolis located within a riverine network. Through approximately one-year field monitoring and measurement of soil heat flux in seven different riparian sites, the objective of this study was to quantify the diurnal variabilities in riparian G and analyze its relationship with Rn (midday G/Rn and phase shifts of G to Rn) over a range of vegetation indices and to identify the effect of timing, vegetation and soil wetness. We mainly addressed three questions: (1) What are the diurnal variability patterns of Rn and G in each riparian site during different seasons? (2) What are relationships between G and Rn (midday G/Rn and phase shifts of G to Rn) in each site? (3) What is the potential influencing mechanism for variations in G and its relationships with Rn? This work ought to be of value for the theoretical understanding of energy partitioning into soil heat under different vegetation-covered riparian sites. It also provides practical and technical guidance for the planning and management strategies of urban riparian woodlands.

2. Methods

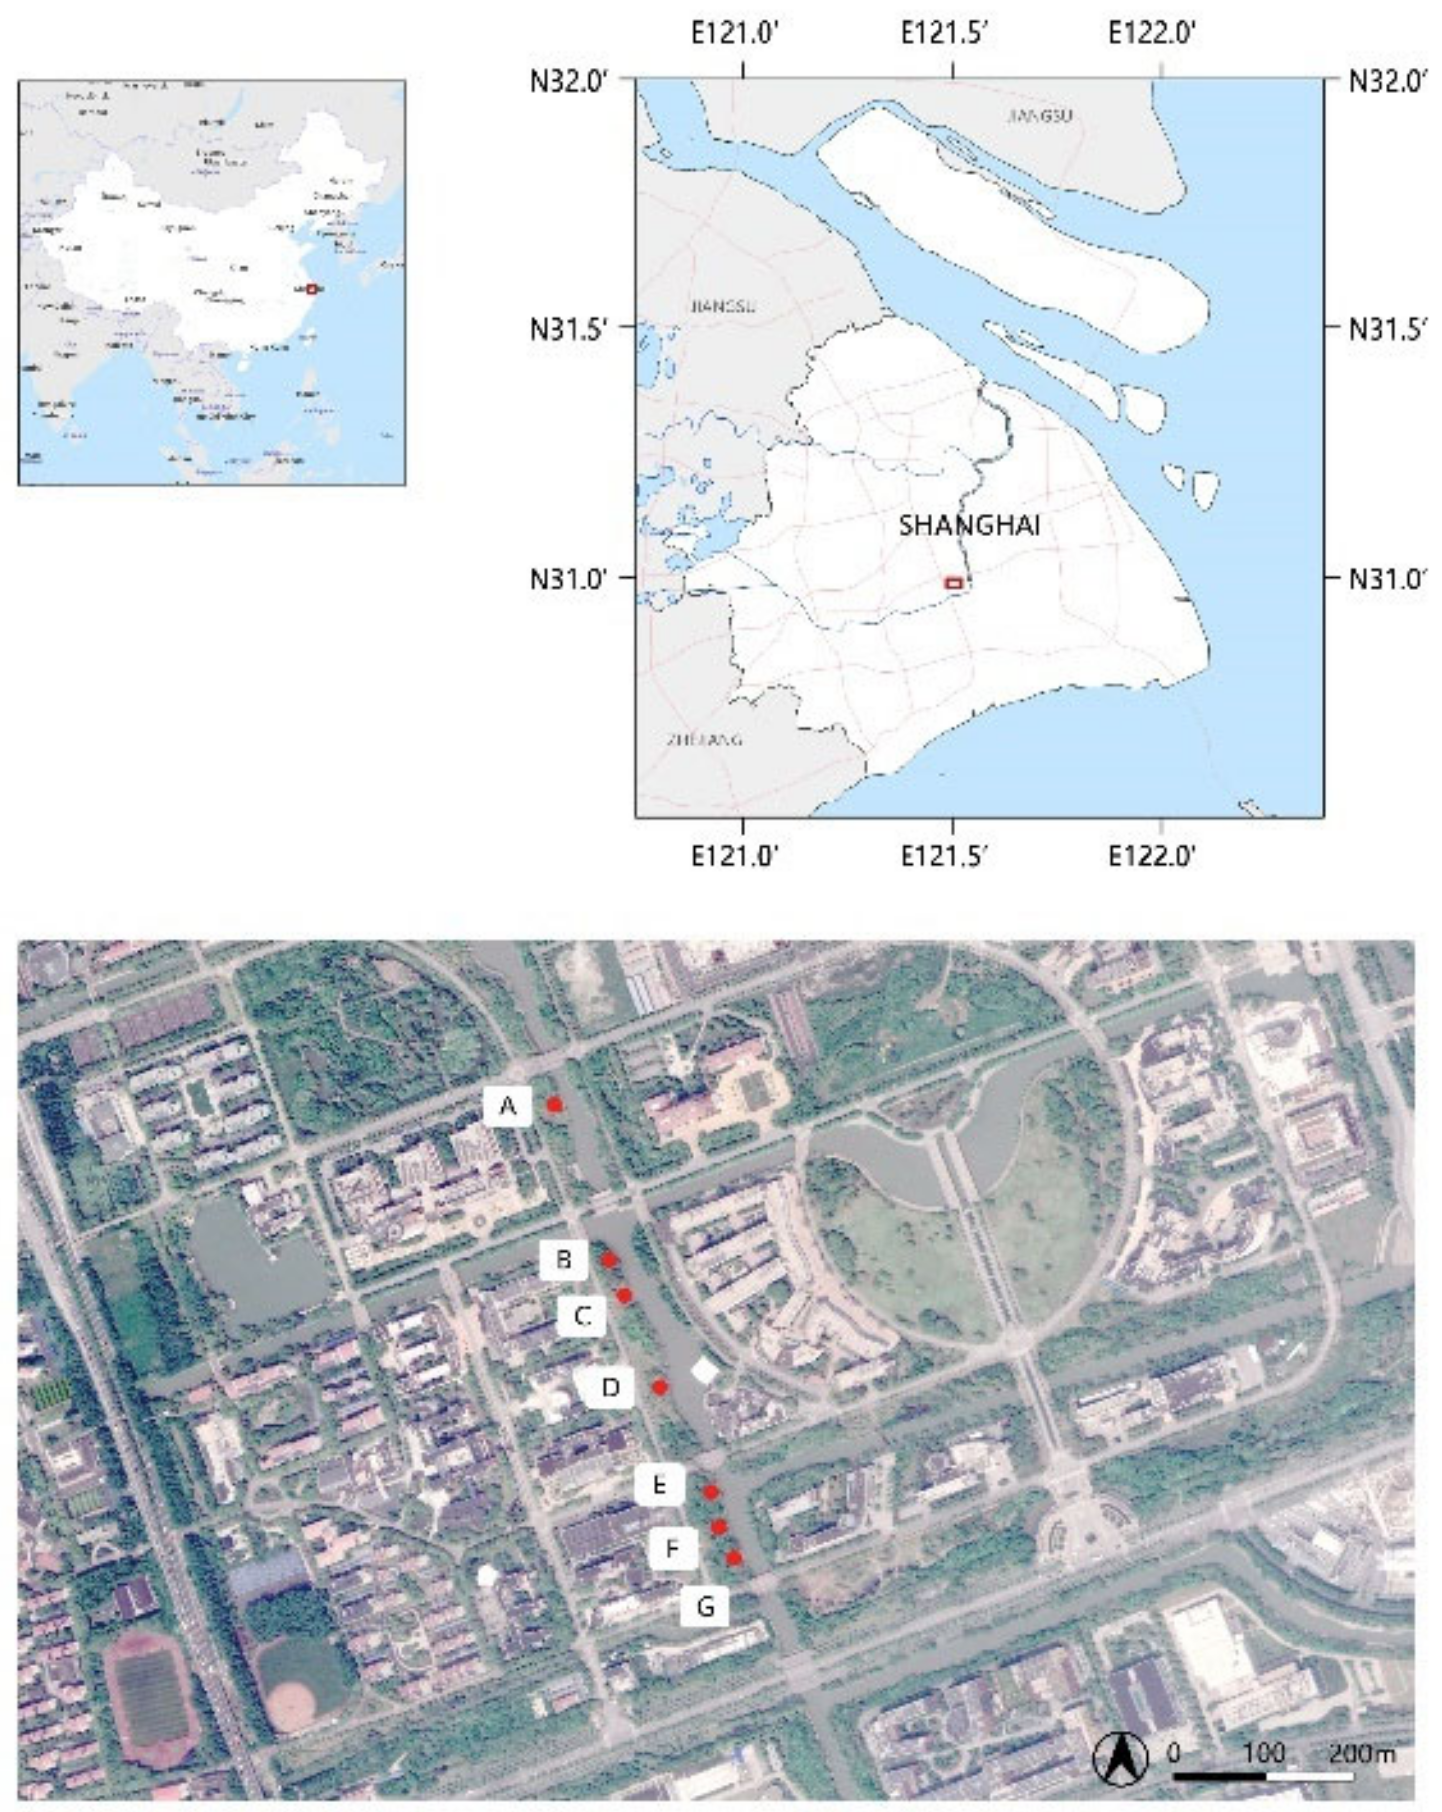
2.1. Site Description

Experimental sites (121°44′ N, 31°03′ W) were chosen along the north–south-running Danshui River (Figure 1), an approximately 20–30 m wide river in Minhang District of Shanghai. The climate of Shanghai is classified as north subtropical monsoon climate with four distinct seasons, with moist and cool winter. Annual air temperature is 17.6 °C and rainfall is approximately 1100 mm. Seven sites (20 m × 20 m) were simultaneously sampled in the western reaches, with consistent open surrounding environment and uncompressed traffic. All revetments are impervious though; they are lower than the ground surface of terrestrial land.
Here, vertical structural characteristics of the forest floor are categorized into three types, regarding their layers—grass, arbor–grass and arbor–shrub–grass. Horizontally, we mainly categorized into three groups for arbored communities—evergreen broadleaves, deciduous broadleaves and conifers. In addition, an open grassland under regular mowing and maintenance was chosen to be a contrast. Based on the frequency of arbor species planted in urban Shanghai, seven riparian sites were chosen, and they are plant communities of (1) Camphor (Cinnamomum camphora), Osmanthus (Osmanthus fragrans (Thunb.) Lour.) and Creeping Woodsorrel (Oxalis corniculate L.), labelled as CCO; (2) Dawn Redwood (Metasequoia glyptostroboides), Osmanthus and Dwarf Lilyturf (Ophiopogon japonicus), labelled as CMO; (3) Japanese Lawn Grass (Zoysia japonica), labelled as CH; (4) Camphor and Creeping Woodsorrel, labelled as CCH; (5) Elm (Ulmus parvifolia Jacq), Osmanthus and Dwarf Lilyturf, labelled as CUO; (6) Dawn Redwood and Japanese Lawn Grass, labelled as CMH and (7) Elm and Creeping Woodsorrel, labelled as CUH, respectively (Figure 1 and Table 1). Canopied communities are all artificially planted and aged more than 15 years. All plants in sites generally have a good growing conditions and maintenance.

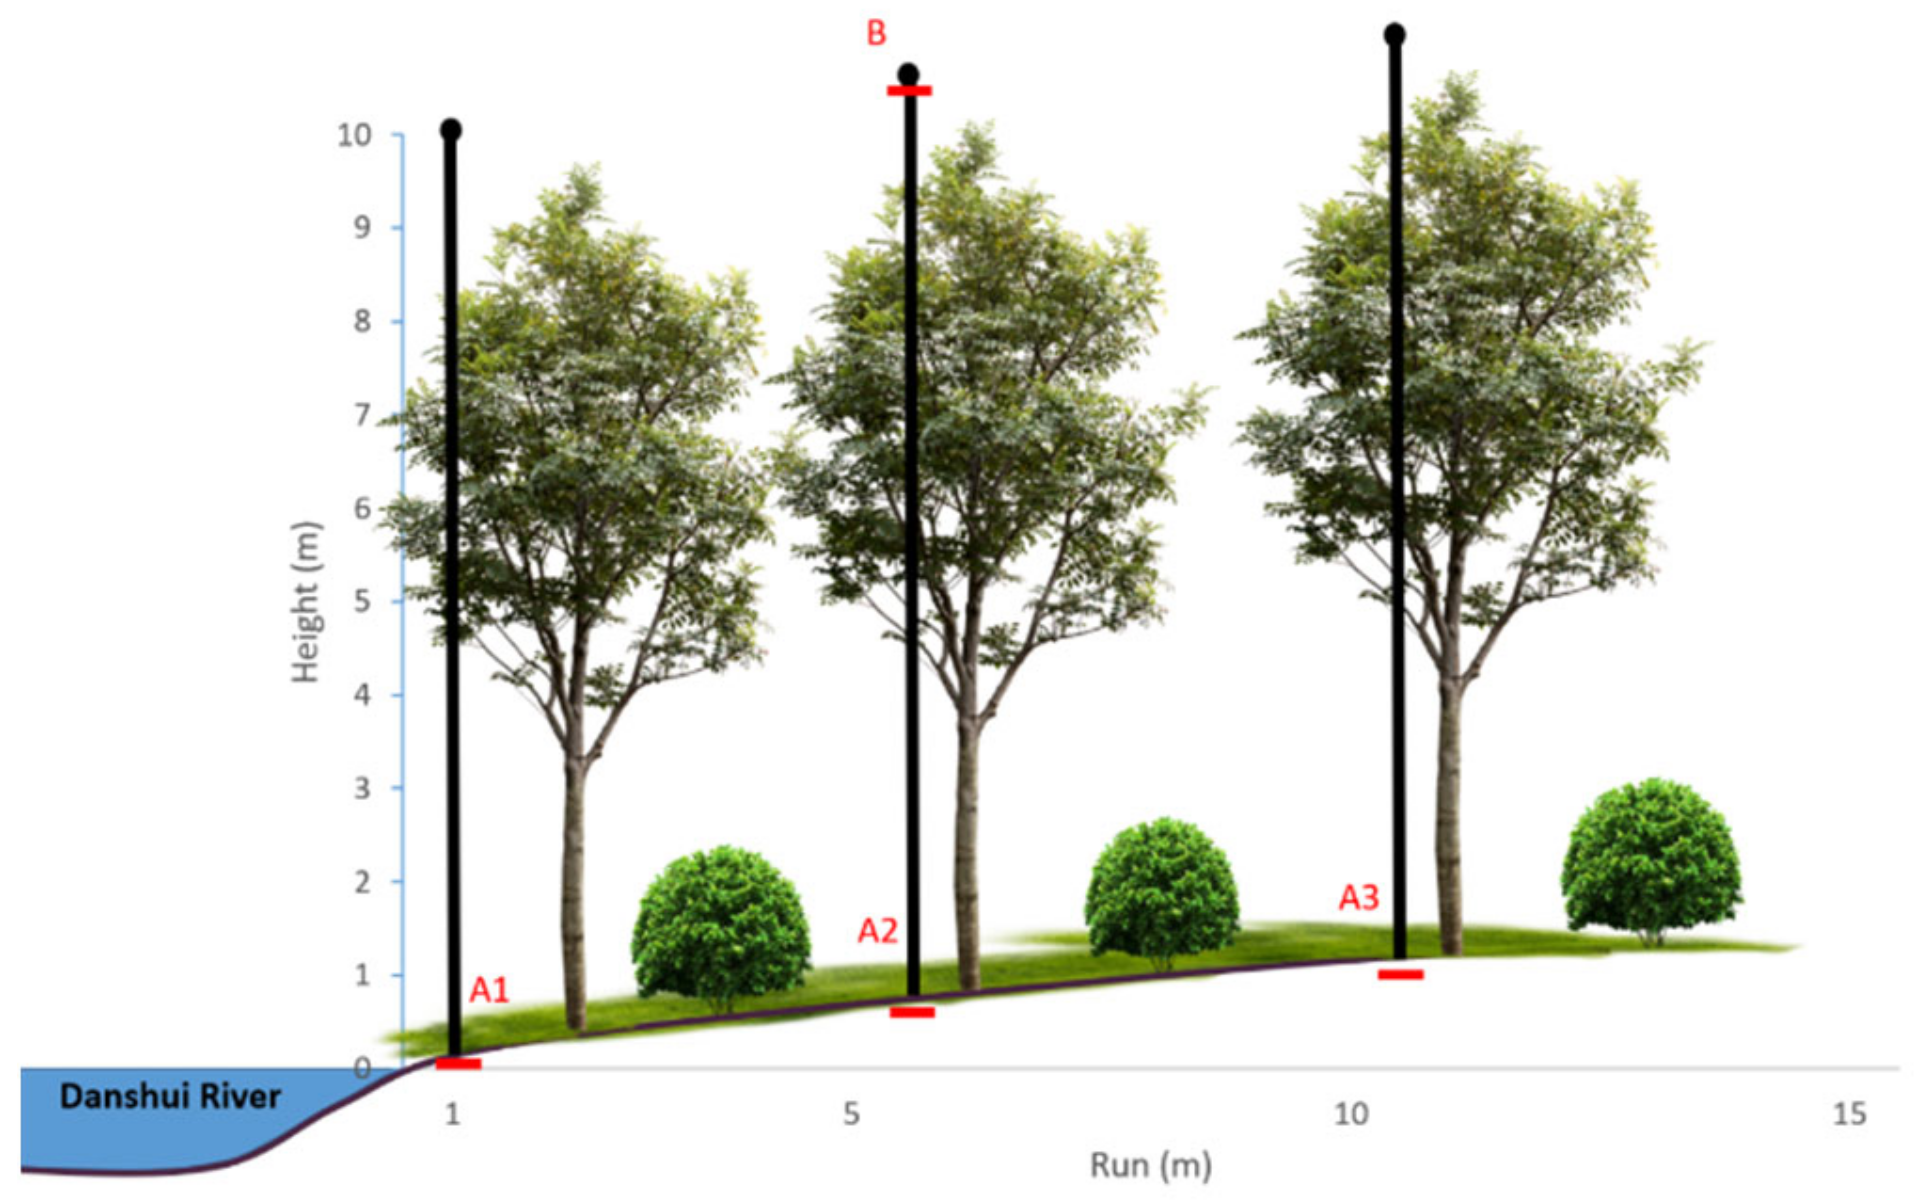
2.2. Experimental Design

Microclimatic variables, soil temperature (Ts), volumetric soil water content (SWC), net radiation (Rn) and soil heat flux (G), were monitored with automated data-logging sensors during the period from November, 2020 to October, 2021. Ts, SWC and G values were measured at three points (A1–3 in Figure 2) at each site, approximately 1, 6 and 11 m distance from the river, and averaged to be fully representative of the whole site (Figure 2, Table 2). Since Rn shows little spatial variability above complex and patchy surfaces [20], one net radiation radiometer was set up above each riparian plant community at 6 m to the river (B in Figure 2). Soil parameters were measured 3 cm under the surface. All measurements were taken at 10 min intervals. Instruments were inter-calibrated before the experiment and installed in the same batch. Note that net radiation towards the soil surface is defined as positive, and opposite for soil heat flux here. In addition, vegetation structure indexes, including plant height, density, crown ratio and summer leaf area index (LAI), were measured.

2.3. Data Analysis

2.3.1. Data Control

Data of three typical sunny days (three days before which no rain was observed) in spring (from March to May, 2021), summer (from June to August, 2021), autumn (from September to November, 2020) and winter (from December, 2020 to February, 2021) were chosen, respectively. All data were applied by data quality control, including performing a de-spiking process to screen outlying measurements [21]. Missing and screened meteorological data during observation periods took account of 3.00%. For gap filling, each gap was a single ten-minute gap and was replaced with the average of two observation values with two adjacent time points. The remaining data were examined to ensure it followed typical daily patterns. After that, all data were compiled into 1 h average to smooth the random errors and higher-frequency fluctuations [22,23].

2.3.2. Data Analysis

Daily variation patterns of Rn and G and midday G/Rn in four seasons were exhibited to identify the dynamic variations in time–energy relationships in line charts. The contour plot was used to illustrate a three-dimensional surface by plotting summer Ts and SWC against G as the independent variable. Relationship between SWC and midday G/Rn was analyzed with linear regression. Linear and polynomial regression models were fitted for Ts, SWC and G, respectively. These analyses were visualized by Origin (Origin Lab, 2019). For the analysis of the relationship between SWC and midday G/Rn and phase shift of G to Rn, data were normalized first with Equation (1), before linear fitting was performed. Pearson correlation analysis was performed to correlate Rn and G at different lagged period conditions, and to correlate lagged time with daily SWC and LAI for each riparian site, respectively. The normality of all data was checked using Kolmogorov–Smirnov’s test prior to the variance analysis. Additionally, hierarchical cluster analysis was applied to identify possible groups of plant communities regarding daily changing amplitude of Rn and G in four seasons, respectively. All above analysis were performed with SPSS 24.0 (IBM SPSS, Chicago, IL, USA).
x = x x m i n x m a x x m i n ,

3. Results

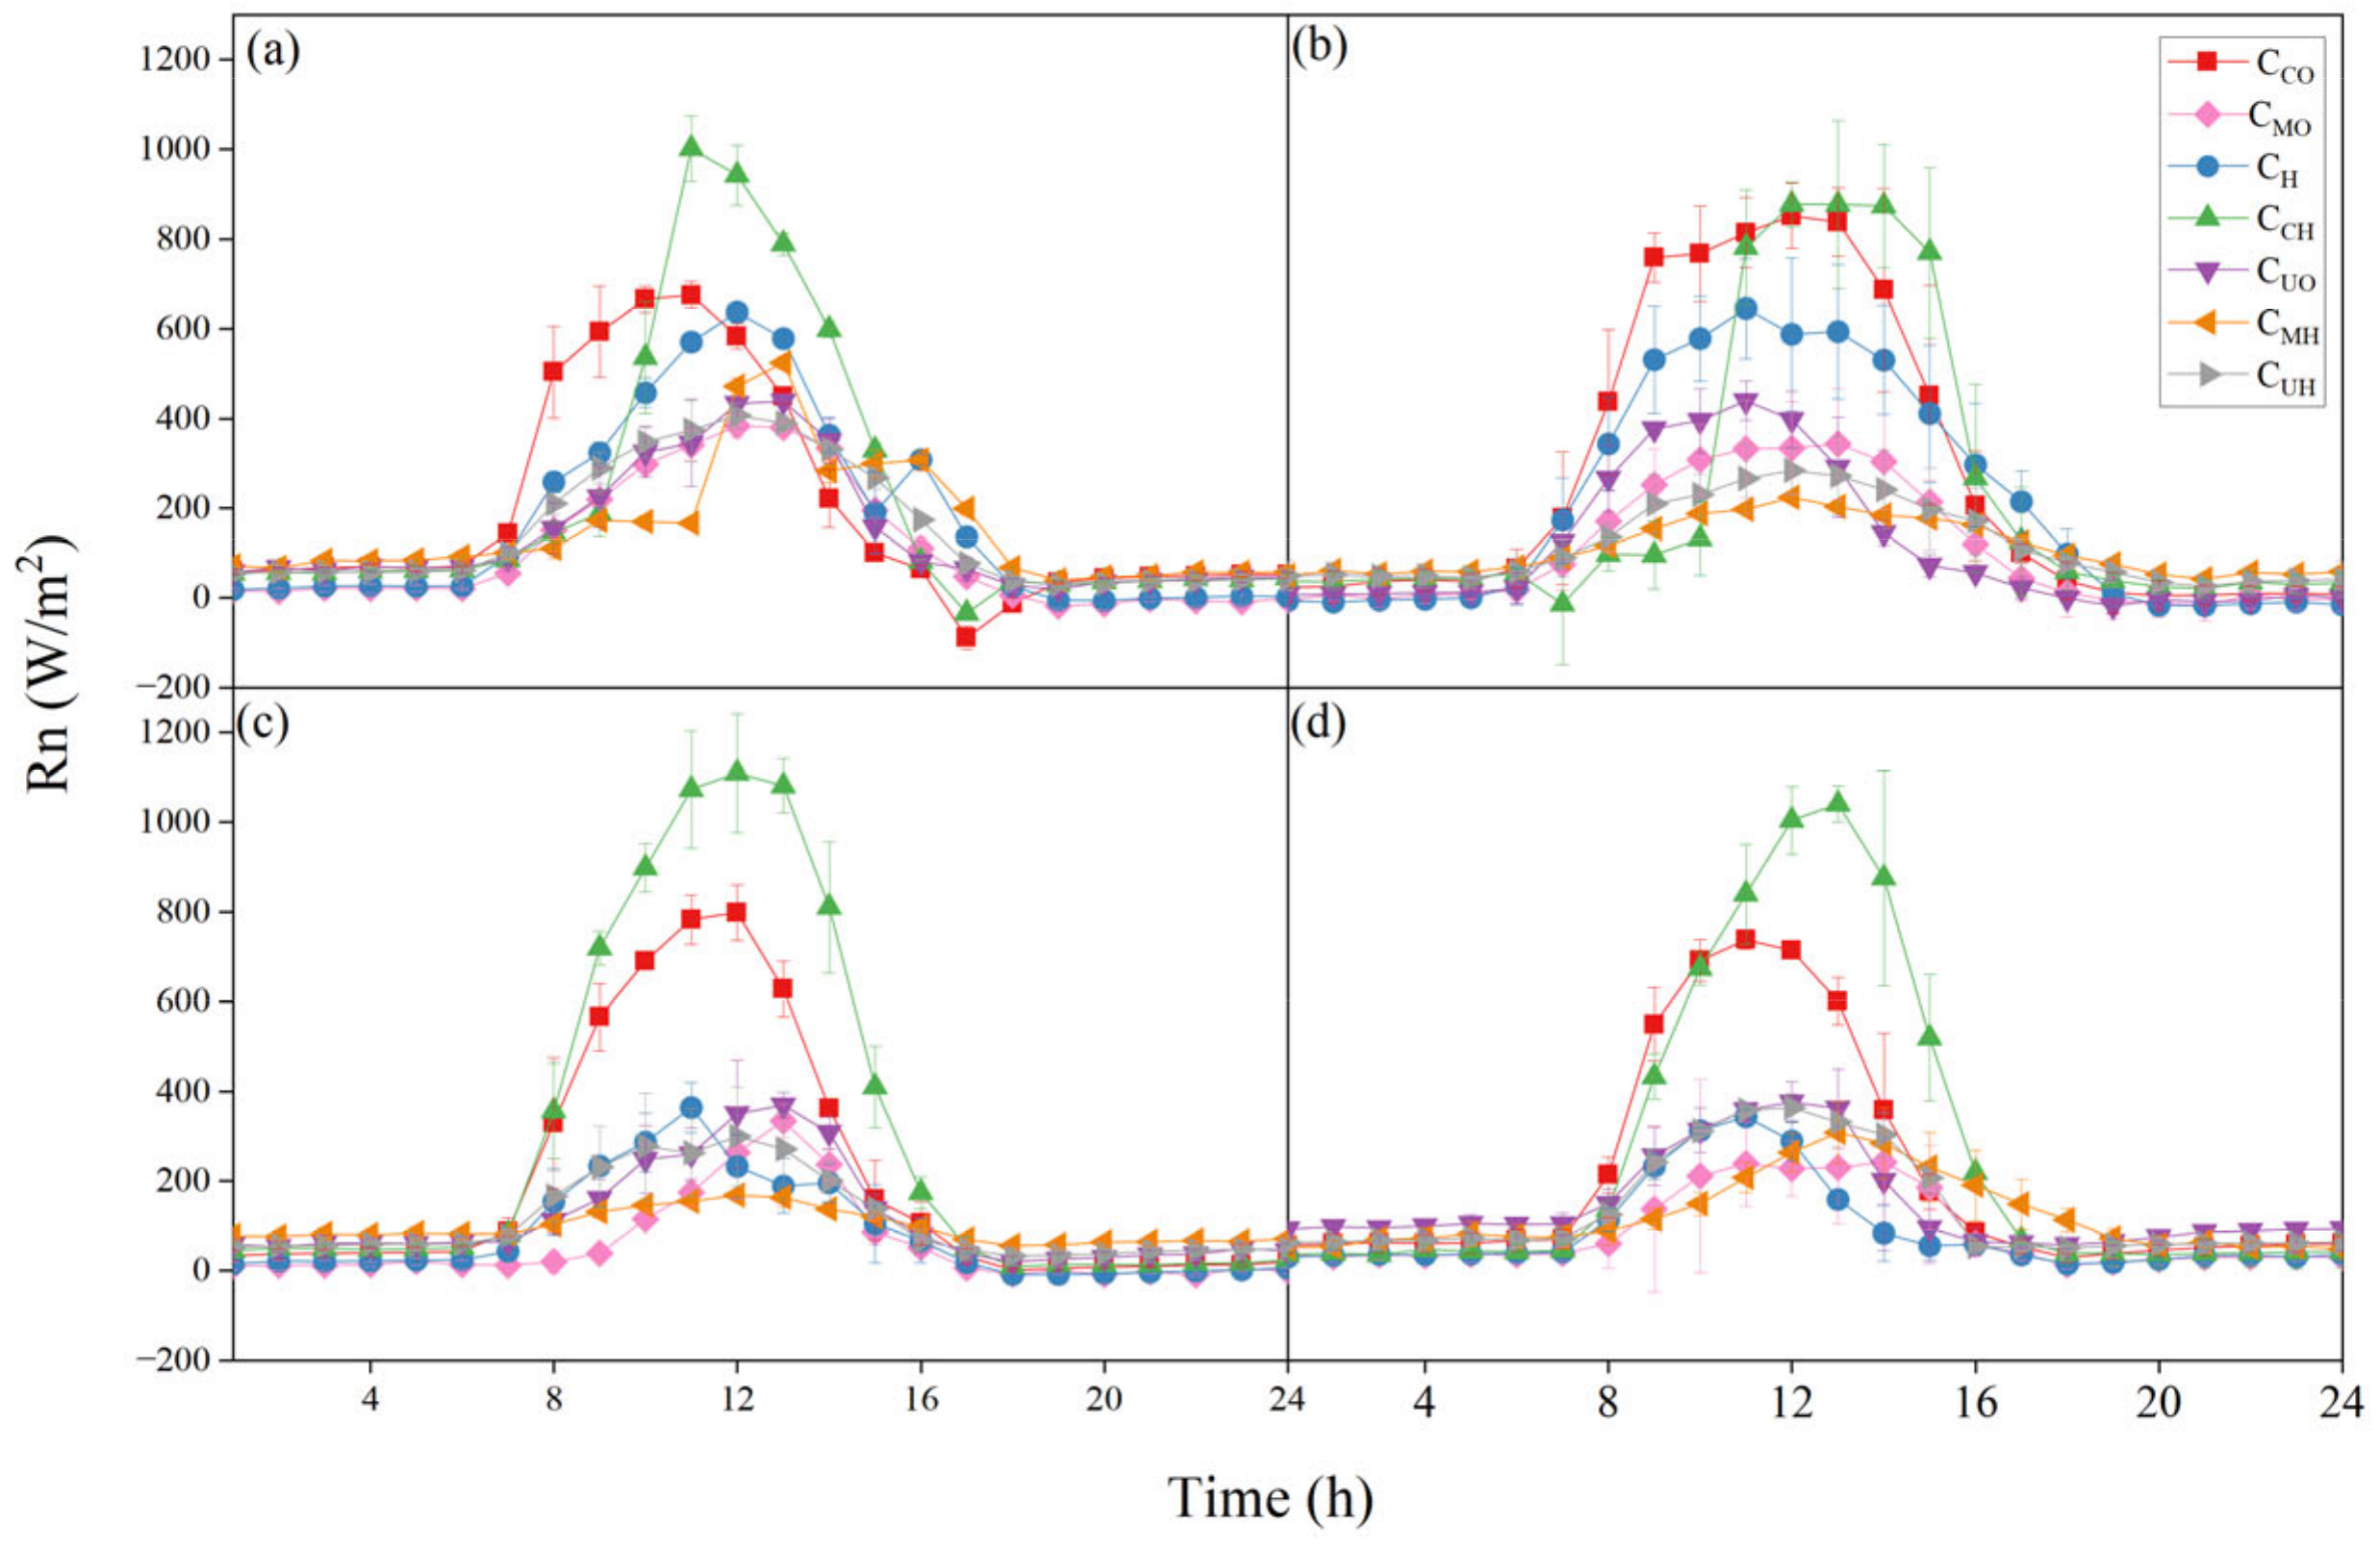
3.1. Diurnal and Seasonal Variations in Rn

Above-canopy net radiation is the determinant of the natural energy processes in riparian areas. Its diurnal variation patterns at sunny days in four seasons are shown in Figure 3. They varied greatly during the whole day but were mostly concentrated on the daytime (approximately starting from 0800 h to 1500 h local time). Regardless of season changes and vegetation types, all variations exhibited as unimodal curves, with peak values occurring around the noon. Daytime peak Rn ranged from 383.01 W/m2 to 1001.59 W/m2 in spring, from 223.61 W/m2 to 919.6 W/m2 in summer, from 167.64 W/m2 to 1109.16 W/m2 in autumn and from 241.77 W/m2 to 1033.72 W/m2 in winter, respectively. All nighttime Rn fluctuated around 0 W/m2 approximately.
The inter-site distinctions of daytime Rn were observed, mainly in two aspects—daytime peak values and the duration of which net radiation was positive. For peaks of Rn, evergreen broadleaf woodlands always received the highest daily net radiation in each season, with maximum values ranging from 652.29 W/m2 to 1109.16 W/m2, followed by the open grassland (from 359.75 W/m2 and 645.62 W/m2), and then conifers and deciduous broadleaf woodlands. No significant differences were found between coniferous and deciduous evergreen woodlands. For the time period of positive net radiation, all-day Rn of CCH, CUO, CMH and CUH was always positive in four seasons. However, for CCO, CMO and CH, their Rn occurred as negative after sunset.
Considering the consistent daily variations among seven riparian plant communities, hierarchical cluster analysis was performed to recognize the groups of plant communities, regarding changing ranges of Rn values (ΔRn, Rnmax-Rnmin, Table 3), indicating the stability of the change in energy that the ecosystem receives. Seven riparian plant communities could be categorized into three groups in spring and summer-I: CCH, II: CCO and CH, III: CMO, CUO, CMH and CUH; three groups in autumn-I: CCH and CCO, II: CH, III: CMO, CUO, CMH and CUH; two groups in winter-I: CCH and CCO, II: CH, CMO, CUO, CMH and CUH.
In addition, each site showed similar seasonal variation trends in Rn but seasonal differences existed in its ranges, mainly in the maximum Rn, rather than the minimum one. The Rn achieved by the grassland in spring and summer (636.7 and 645.62 W/m2, respectively) was approximately twice that in autumn and winter (363.98 and 359.75 W/m2, respectively). For woodlands, Rn in spring was higher than that in summer. Downwards shortwave radiation was far higher than upwards longwave radiation due to low ground surface temperature, while for summer, higher upwards longwave radiation could offset downwards shortwave radiation because of high ground surface temperature. For evergreen broad-leaved woodlands (CCH and CCO), litterfall of Camphor mostly occurs in spring, in which Rn tended to be lower than those in other seasons. Small differences between Rn results were observed in summer, autumn and winter for evergreen woodlands. On the contrary, for deciduous woodlands, Rn was higher in the spring than in other seasons.

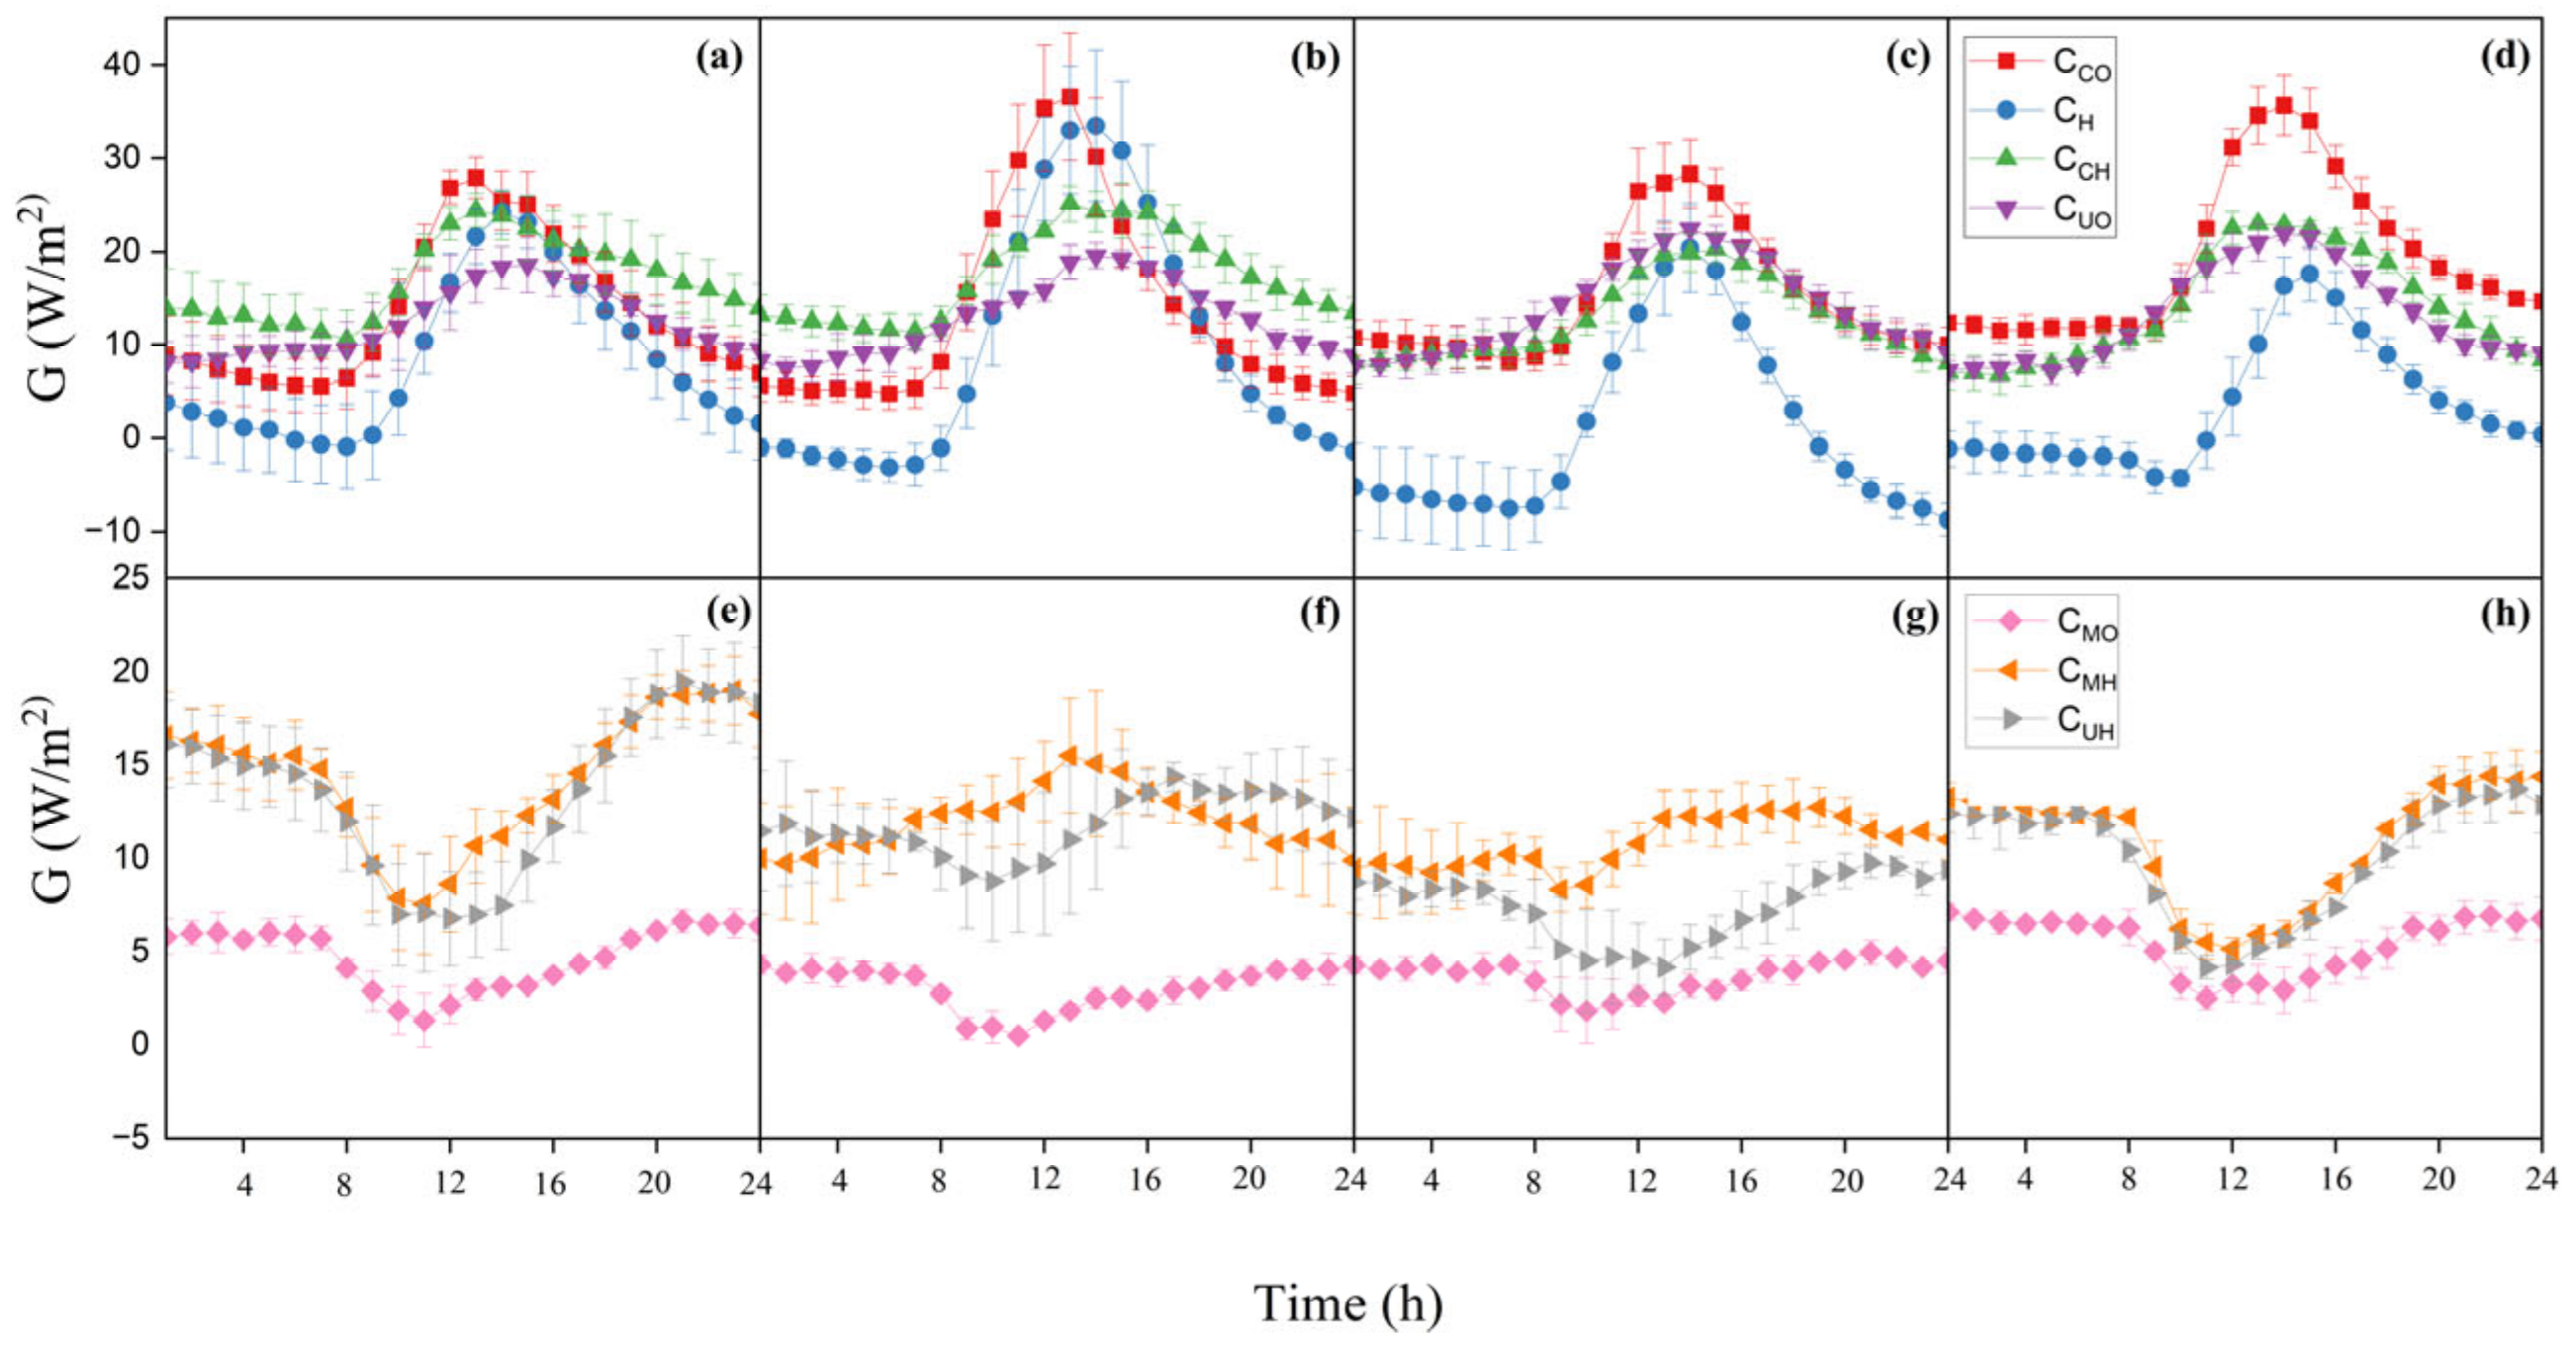
3.2. Diurnal and Seasonal Variations in G

Daily G variations in different riparian sites at sunny days of each season are shown in Figure 4. The 24 h G values in each season for all riparian woodlands were positive, indicating that the soil absorbing heat throughout the whole daily cycle during four seasons. Additionally, soil surfaces in all canopied communities function as heat sink. However, owing to radiative cooling at the ground surface, the release of heat from the soil resulted into negative G values at night in the CH, and soil worked as a heat source during this period.
Daily variations could be mainly grouped into two patterns. The first one is that fluctuations in G varied diurnally in the same pattern as corresponding Rn but with several slight phase differences in each season, exhibiting as unimodal curves (Figure 4a–d). They generally increased during the morning, reaching maximum values before they decreased in the afternoon. This pattern was applied to riparian woodlands with lower LAI-CCH, CCO, CH and CUO (Table 1), while in those with higher LAI- CMO, CMH and CUH, the second variation pattern was observed. Their diurnal variations were assumed to be sinusoidal curves, with a decrease in the morning towards minimum values at 1000 local time and then gradually increasing to maximum values in the late afternoon before a second decrease (Figure 4e–h). For both patterns, soil heat flux and net radiation were observed to vary in terms of synchronization with the 24 h daily cycle at all sites. However, the phase shifts vary among riparian sites, resulting in different daily variation curves (details discussed later).
Higher maximum values of G (Gmax) and wider amplitudes of G variations (ΔG) were found in the first pattern than those in the second one. Gmax in the CCO were the highest all year round, with maximum values of 41.50, 36.56, 28.33 and 35.68 W/m2 in spring, summer, autumn and winter, respectively, while Gmax in the CMO were lowest at 6.63, 4.30, 4.95 and 7.12 W/m2, respectively. Similarly, hourly G for a moist soil beneath plant canopies was often found to be less than 20 W/m2 [5]. G values in evergreen broadleaf communities were the highest, followed by deciduous communities and conifers. For broadleaf communities with shrubs in the understory layer, both Gmax and ΔG were found larger than those in corresponding communities without shrubs—CCO > CCH and CUO > CUH. However, in coniferous communities, the roles of shrublands were not obvious in influencing the magnitude of G. For Gmin, G values in all canopied communities were positive, except that the nighttime G in the grassland dropped below zero (especially during autumn and winter). G values in the CH could go towards −0.90, −3.12, −8.73 and −4.26 W/m2 at night in spring, summer, autumn and winter, respectively.
G in the open grassland exhibited seasonal differences. It was approximately double in summer of what in winter. Similarly, findings were reported in a grassland area of the Netherlands by Jacobs et al. [24]. For canopied woodlands with shrubs (CCO, CMO and CUO), no significant seasonal differences were found, while for those without shrubs (CCH, CMH and CUH), G in spring and summer was found to be higher than that in autumn and winter.
Although diurnal variations in conifers were found to be different from some studies on grassland and crops, their sinusoidal G variations, with minimum values occurring in the morning and maximum in the late afternoon, were similar to the “S-shape” of diurnal variations in G found in the Robinia Pseudoacacia plantation in the Yellow River Delta and tropical forests in Guangdong, China [25,26]. Less amplitudes found in coniferous woodlands than those in the grassland and broadleaf woodlands indicate less intensity of soil heat energy, mainly attributing to morphological features of conifers.
Correlation analysis between summer G and SWC showed that G was highly related with soil moisture in sparse-canopied riparian woodlands and grassland (LAI < 2.45). Since they were found with consistent variation patterns, CCH was chosen here to show their specific relationships as an example (Figure 5). Most soil heat transmissions occurred under relatively high soil water content, whereas higher peaks were found in Ts higher than 28.5 °C and a medium range of SWC (Figure 5a). The linear regression model in Figure 5b indicated a significant positive relationship between Ts and G (r2 = 0.91, p < 0.05). A non-linear curve between SWC and G was obtained by the polynomial regression model (Figure 5c). G increased first and then decreased with the increase in water content in soil (r2 = 0.90, p < 0.05). The optimal range of SWC was 32%–33% at the site of CCH. However, for dense-canopied (LAI > 2.99 in this study) woodlands—CMO, CMH and CUH—no significant relationship between SWC and G was observed.

3.3. Relationships between G and Rn

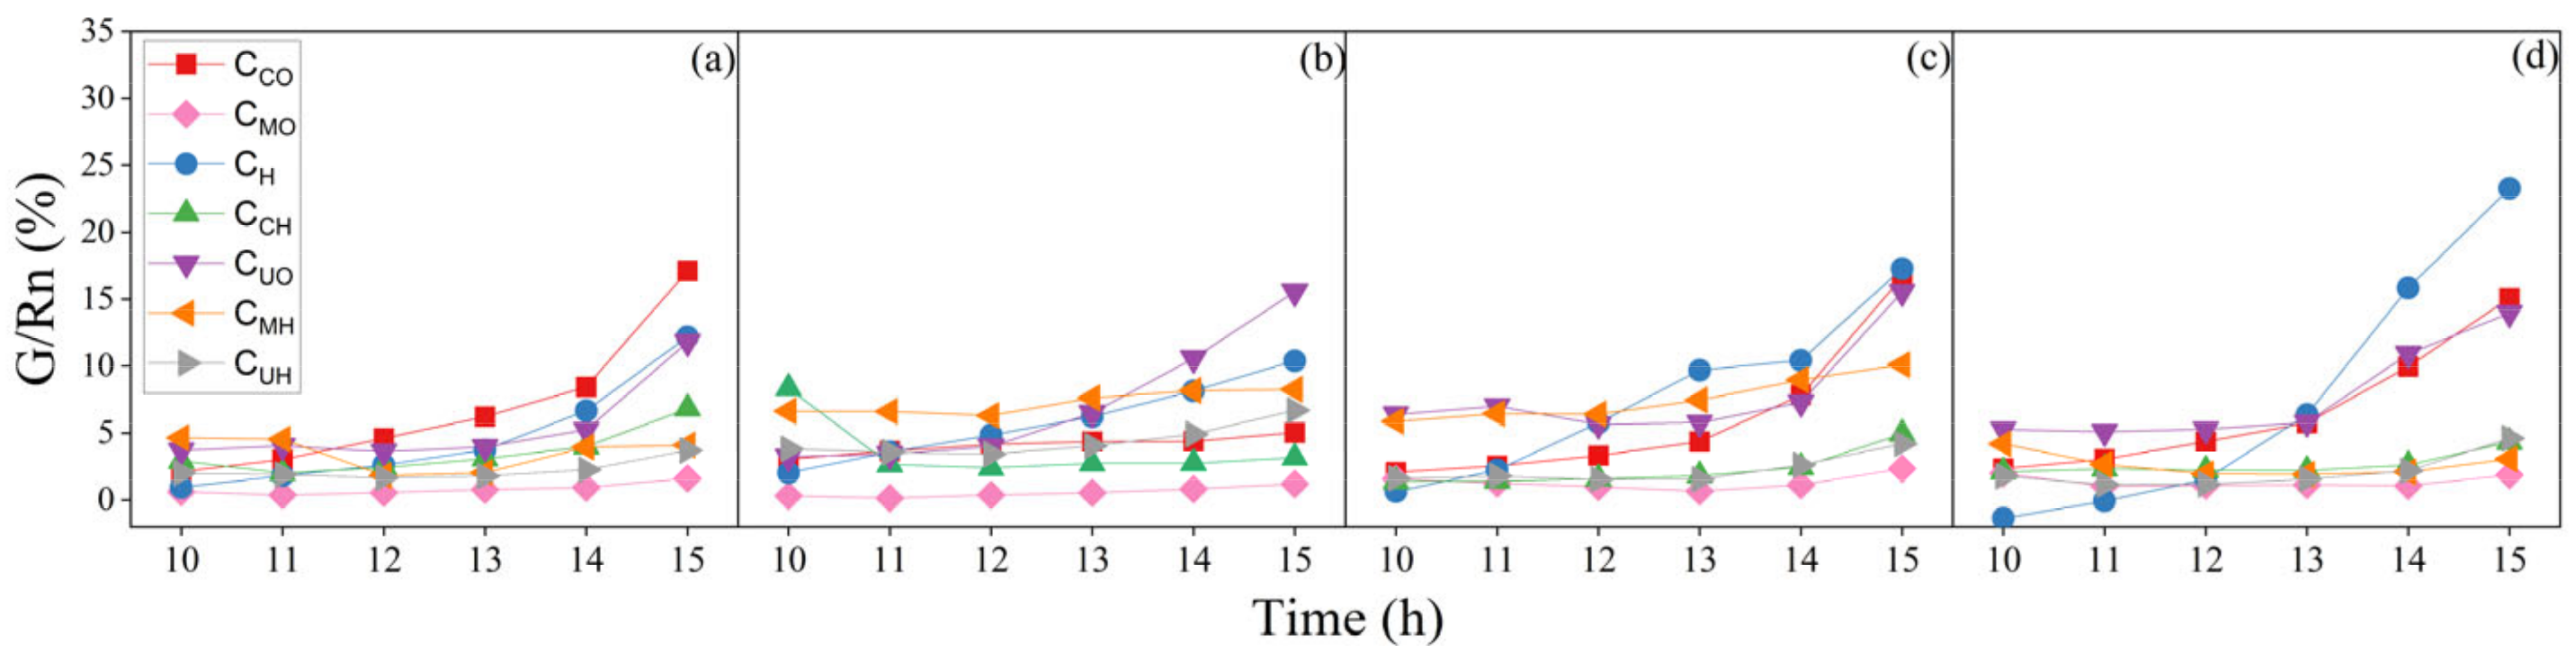
3.3.1. Midday Variations in G/Rn Ratios

The ratio of soil heat to net radiation (G/Rn) is indicative of the relative importance of soil heat to net radiation. It is important not only for simple modeling parameterizations but also for microclimate regulation and productivity promotion [27]. Although midday values of G/Rn are not representative of the entire diurnal cycle, considering variations in heat fluxes were mainly focused during the daytime, differences among variations in ratios of soil heat to net radiation in seven riparian sites were only evaluated for the midday figure (1000–1500 h, local time), as shown in Figure 6. Field observations in our study show that G/Rn is not always constant for some vegetated surfaces at midday. On the one hand, G was found to be accounted for a little proportion of Rn in all riparian sites, especially for those with high LAI. Midday G/Rn ranged from 0.07% to 31.60%, lower than that found in the desert ecosystems in which midday G typically ranged from 20% to 40% in terms of net radiation [28]. On the other hand, regardless of its daytime variation trends, maximum of G/Rn occurs at 1400 h local time or later, which is later than the maximum of Rn (see Figure 3).
For conifers (CMO and CMH) with dense canopies intercepting heat transmitting towards the ground, and broadleaf woodlands without shrubs (CUH and CCH) with high net radiation, soil heat accounts for little of Rn and, undoubtedly, variations in G/Rn were not obvious in each season. G accounted for <8.36% of Rn in these sites. Similarly, no more than 10% with slight diurnal variations for full canopied surface and <5% in forests were observed [29,30,31].
For grassland and broadleaf woodlands with shrubs (CCO, CH and CUO), upward trends were observed. They generally maintained less than 10% until 1400 h local time and then increased quickly afterwards. This is because Rn in these sites decreased dramatically after 1400 h local time. However, G/Rn in the CCO generally maintained at a stable rate in the summer, ranging from 3.06% to 5.03%. This could be ascribed to the notion that net radiation in the summer was too high to observe obvious variations. Furthermore, it was higher in winter and autumn (23.26% and 17.28%, respectively) than those in spring and summer (12.18% and 10.40%, respectively), within ranges of 10% to 50% that was confirmed in bare and sparsely covered soils [28]. Similarly, Meyers found nearly 25% of midday Rn was partitioned into G in a water-stressed watershed, while that figure was 15% for a non-stressed summer [32]. Midday G/Rn variabilities could partially ascribe to soil wetness. The relationship between normalized SWC and midday G/Rn of seven riparian sites in summer in this study indicated their well correlations (Figure 7, r2 = 0.64, p < 0.05).

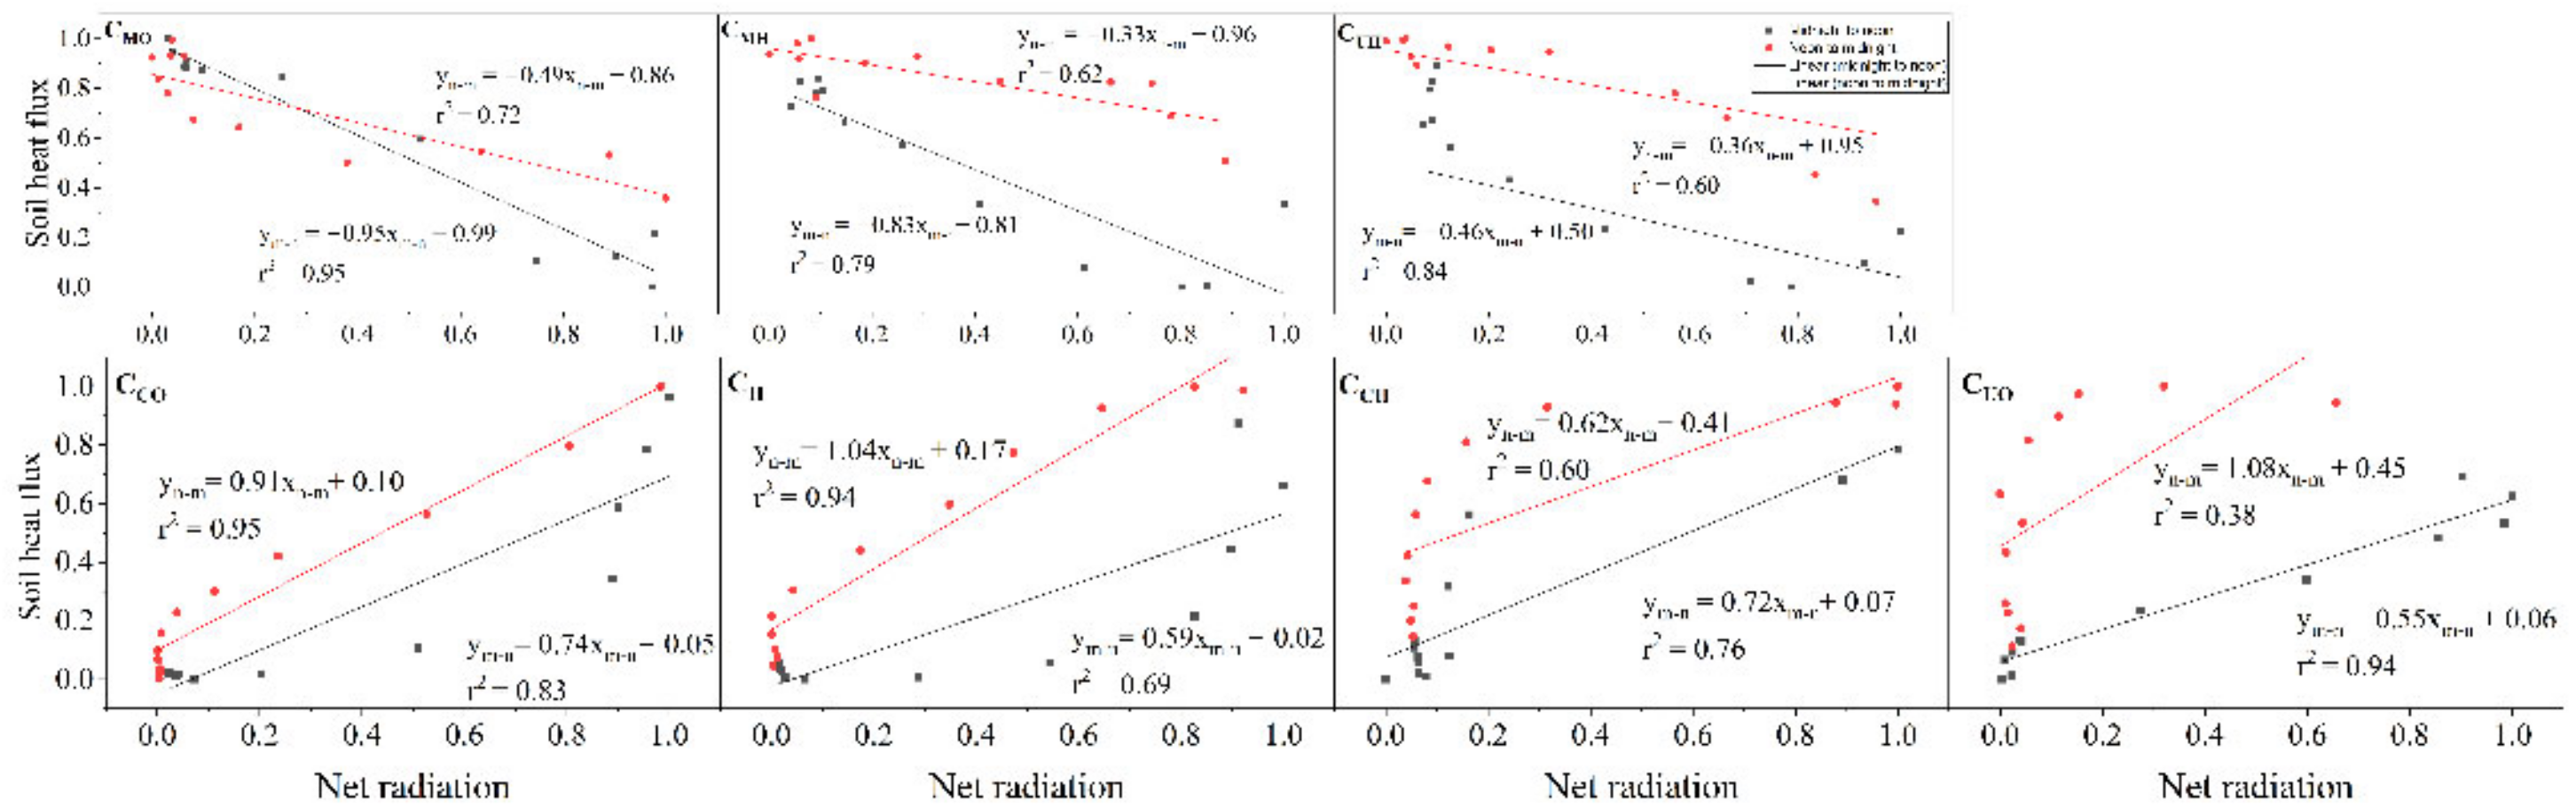
3.3.2. Phase Shift of G to Rn

The linear analysis between the normalized data of hourly G and Rn values for different riparian communities in summer was conducted on a daily scale (Figure 8). It showed soil heat flux varied out of synchronization with net radiation, indicating that soil heat flux on a daily basis, to some extent, suffers from a hysteresis problem to varying degrees. For a given Rn in any riparian site, different G values occurred during the midnight to noon hours, compared to noon to midnight hours, since the diurnal G and Rn waves did not reach their peaks at the same time. This hysteresis phenomenon essentially comes from the existence of phase difference between the diurnal variations in net radiation and soil heat flux [33].
To evaluate the extent of phase shift, a linear regression between net radiation and soil heat flux within different lagged durations, such as real-time G (G0) and one-hour-lagged G (G1h) until eight-hour-lagged G (G8h), was conducted for each riparian site during summertime (Table 4). The r2 values could be interpreted as indicative of the degree of hysteresis. The relationship between Rn and Gnh (n = 0, 1, 2, …8) with the highest r2 values represents the lagging duration of soil heat in this site.
Results showed differences in phase shift among different plant communities (Table 4). The shortest phase shift occurred in evergreen broadleaf woodlands (CCO and CCH), which lagged one hour (r2 = 0.967 and 0.823, respectively, p < 0.01). Soil heat flux in the open grassland lagged two hours to net radiation (r2 = 0.986, p < 0.01) and four hours in the CUO (r2 = 0.923, p < 0.01). However, it was found that conifers with shrubs lagged 8 h (r2 = 0.797, p < 0.01) and 7 h in those without shrubs (r2 = 0.876, p < 0.01). At the site of CMH, soil heat flux also lagged 8 h (r2 = 0.906, p < 0.01).
To evaluate the cause of phase shift, lagged time in each riparian site was correlated with LAI and daily SWC, respectively, via Pearson correlation analysis. Results indicated a positive relationship between lagged time and LAI (r2 = 0.857, p < 0.05) and significantly positive relationship with daily SWC (r2 = 0.842, p ≤ 0.01), suggesting that the hysteresis problem was related to both soil wetness and canopy cover conditions.

4. Discussion

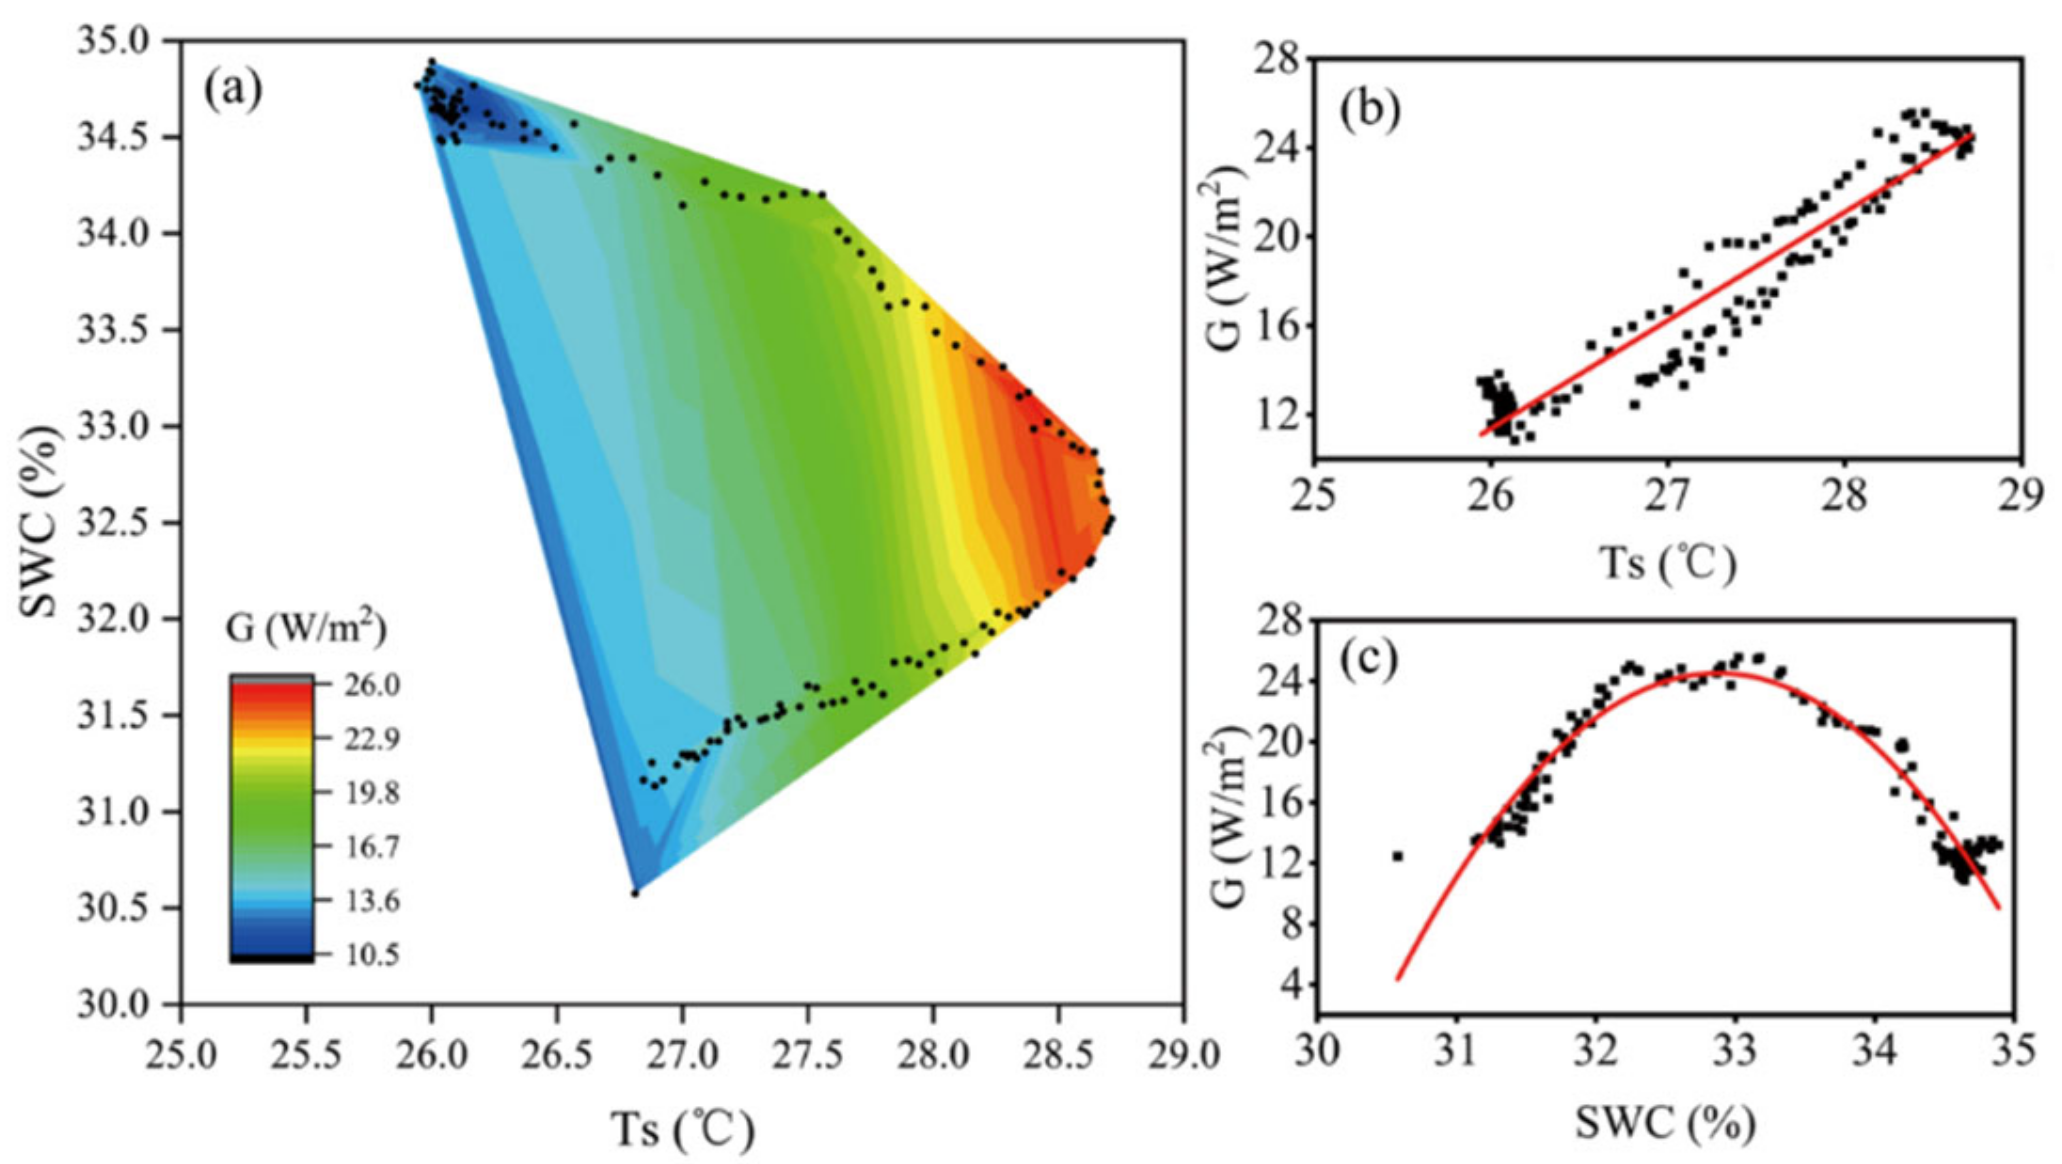
4.1. Factors Influencing Rn

Net radiation is influenced by the transmission of solar radiation and long-wave radiation in the layers of the plant canopy, residue, and soil [34]. In this study, the one-peaked daily behaviors of Rn in sunny days were dominated by the sun’s daily path, quantified as solar zenith angle [35]. The observed diurnal variation curves above some sites were asymmetrical, probably because probes were not set completely horizontal. Diurnal variations in Rn for seven different riparian plant communities during four seasons showed all communities received energy as a result of the incoming shortwave radiation during the day, and a counterbalance reflected longwave radiation from the underlying and incoming longwave radiation from the sky at night.
Inter-site differences in Rn can be attributed to characteristics of the ground surface–soil structural features (soil color and porosity) and physical features (soil temperature and moisture). Evergreen woodland had the highest net radiation all-year-round, while CMH got least. On the one hand, extensive and evergreen Camphor canopies form structural complexity, increasing aerodynamical roughness [36], forming a small surface albedo (α), and thus leading to a high gain of Rn. On the other hand, bare soil under plant communities characterized by an absence of foliage, is almost completely exposed, leading to high α, and thus low net radiation [18]. Heavy litters and dead biomass under deciduous woodlands and conifers, especially during autumn and winter, also have different spectral characteristics, resulting in high α and low Rn received [37,38].

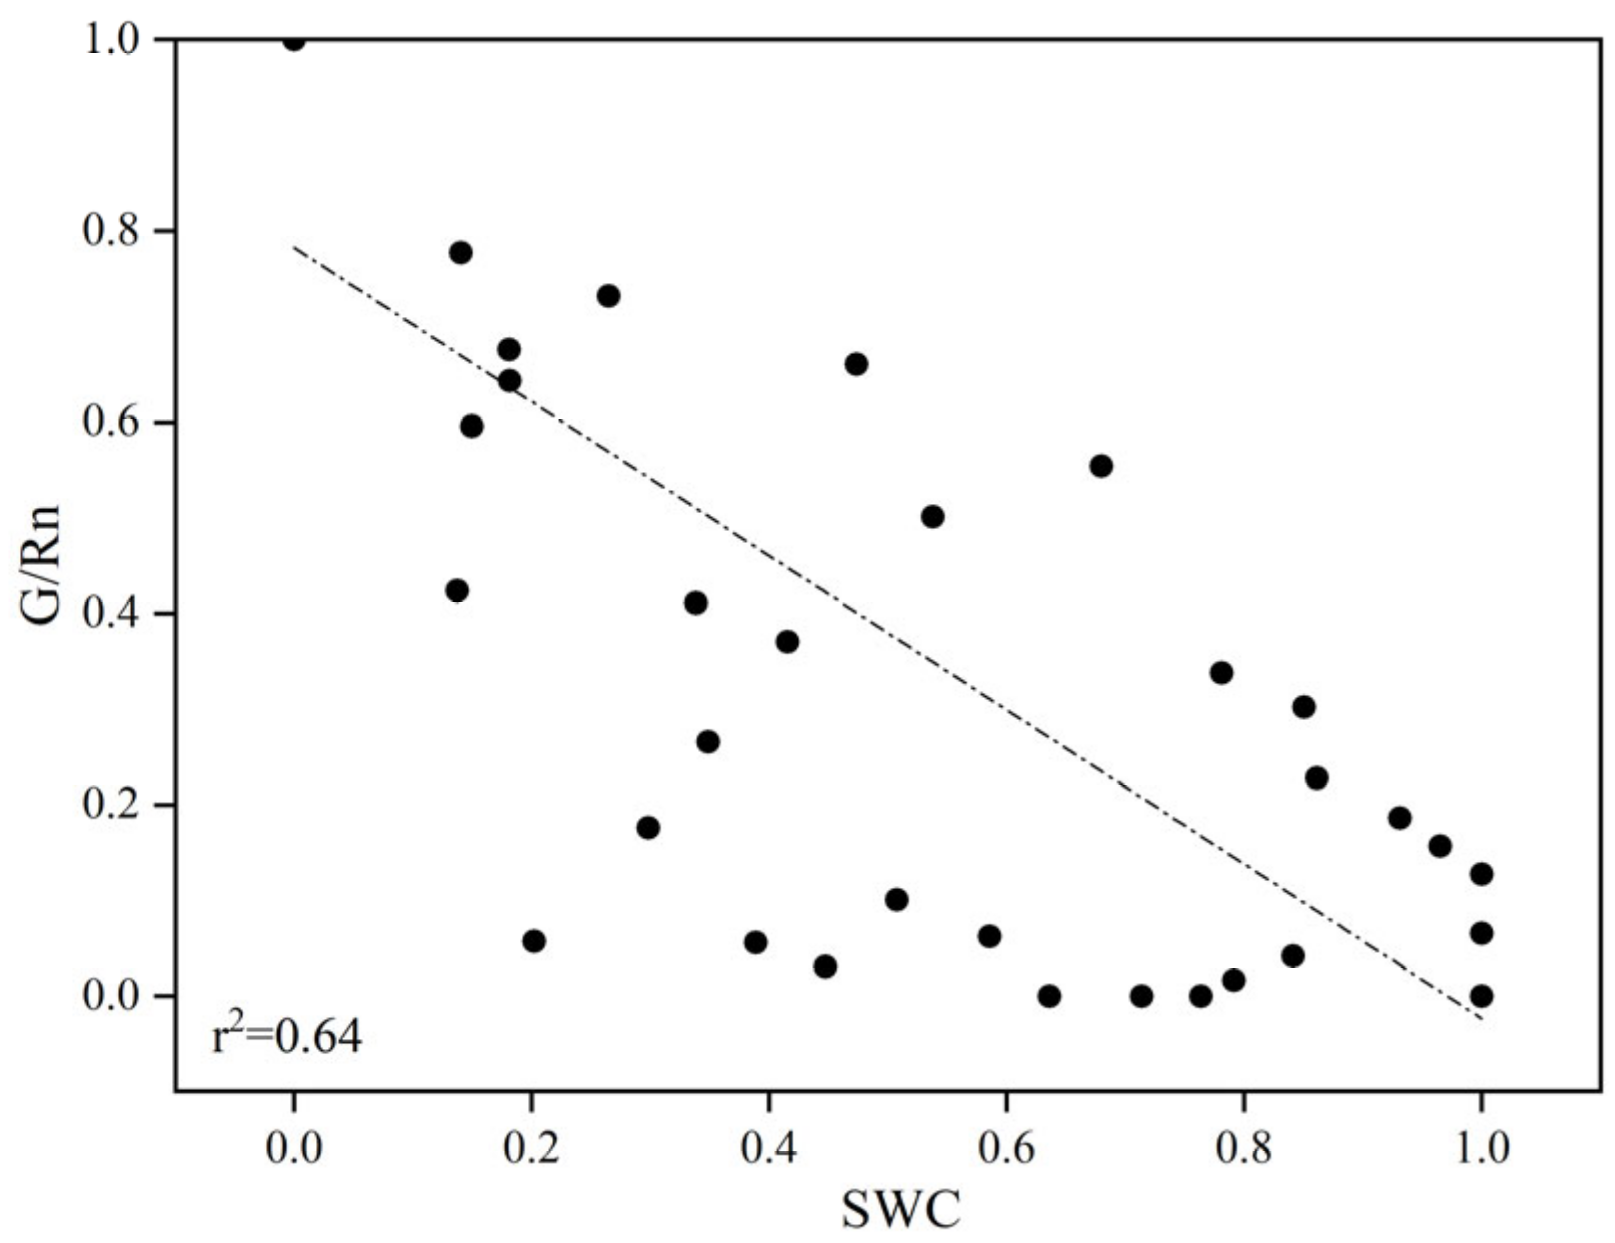
4.2. Factors Influencing G and Its Relationships with Rn

For riparian grassland and sparse-canopied woodlands (CCO, CH, CCH and CUO), daily G varied with variations in Rn, consistent with many previous studies conducted in other ecosystems. Positive linear regression between normalized G and Rn could explain this variation pattern. For dense-canopied riparian woodlands (CMO, CMH and CUH), the hysteresis phenomenon bringing phase shifts of G caused sinusoidal variations in G and non-linearly relationship between G and Rn.
Apart from Rn, soil water content was proven to influence soil heat flux, since it determines the hydraulic and thermal properties for heat transfer. Our study shows that in sparse-canopied riparian sites, soil wetness has dual effects on soil heat flux. G increased when soil moisture was lower and decreased as soil moisture continued to increase. However, in dense-canopied woodlands, insignificant relationships between them indicated that, in this case, the roles of vegetation characteristics overwhelm that of soil moisture. Similarly, Santanello and Friedl [33] proposed that a single relationship of G and Rn is sufficient for dense-covered surfaces (LAI > 2.5), regardless of soil conditions. Potential reasons might lie in species-dependent parameters, such as the height and size of the canopy, and specific crown attributes of trees. They also affect the amount, temporal or spatial variability of light [38], and radiation taken to reach the soil surface. For instance, hemispherical canopies of broadleaf trees favor soil receiving heat, and conic canopies together with a large canopy height of conifers weaken and delay solar radiation hitting the ground, explaining the second variation pattern of soil heat. Meanwhile, the phenological stages for deciduous trees, including foliage emergence and senescence, can alter the exchange properties between vegetation, the atmosphere and soil [20]. Litter layer under conifers, as a mulch at the soil surface, could be regarded as a heat reservoir [38]. Conifers and deciduous woodlands without shrub were covered with thick litter layers, even in summer, where a part of the heat storage term was not included in this work.
Based on two types of hysteresis, multiple regression analysis was performed to derive equations to estimate G from Rn, SWC and LAI. For grassland and sparse-canopied woodlands (CCO, CH, CCH and CUO), the analysis resulted in the following equation (n = 96, r2 = 0.735):
G = 123.2 + 0.048 R n 5.780 S W C 34.69 L A I 9.10   L A I 2 0.016 R n L A I + 2.794 S W C L A I  
For dense-canopied woodlands (CMO, CMH and CUH), the analysis resulted in the following equation (n = 72, r2 = 0.974):
G = 853.4 + 0.2665 R n + 2.98 S W C + 482.3 L A I 64.30 L A I 2 0.006 R n S W C 0.035 R n L A I 1.119 S W C L A I  
All terms included in these two equations were statistically significant (p < 0.01).
Concerning midday G/Rn ratio, it depends on the time of the day/year, soil properties, vegetation amount and height [33]. On the one hand, part of the G/Rn variability on hourly timescale arises from soil moisture. For less-canopied surfaces, such as deciduous woodlands and grassland, a significant fraction of the soil surface is exposed to radiation, resulting in the midday G/Rn taking on a larger range than conifers and evergreen woodlands when considering their growth cycle. This was due to phase shifts in G/Rn at diurnal timescales in our riparian sites. Increased soil heat and decreased net radiation during the late midday period led to an upward pattern of G/Rn ratio in this work. On the other hand, the roles of vegetation characteristics in influencing the magnitude of G/Rn were developed in previous studies with remote sensing [39]. The functions of G and Rn show that near-noon G/Rn ratio decreased with plant canopy, and the cover increased [8]. However, the compounding influences of soil moisture, soil types and phase shift in diurnal variations in G should be included in future work. In our study of full canopied riparian sites, the midday of G/Rn was less than 0.1 and works reasonably well as a constant value.
The relationship between Rn and G in each riparian site suffered with a hysteresis problem, with different extents ranging from 1 h lagged to 8 h lagged. A similar phenomenon was reported before either theoretical assumption [40] or by monitoring measurements. We found that soil wetness partially accounted for this phenomenon. Phase lag was calculated as π/4 for dry soil surfaces, but for moist soil it varied with soil wetness [40,41]. In addition, canopy characteristics were related to the hysteresis. Similarly, it is found that hysteresis changed during the growing cycle of Alfalfa [8]. Horizontally, LAI positively influenced the hysteresis. However, the role of the vertical layering of plant communities was not found in riparian sites. Lagged time was found 0.5 h in an alpine meadow and 1.5–2 h in paddy fields [6]. Additionally, the mutual influence of soil moisture and vegetated conditions could probably explain why phase shifts for each riparian woodland type were larger than those found in other ecosystems. Covered canopies brought hysteresis, but it was one-hour lagged in the grass, compared to the evergreen broadleaf woodlands. One possible reason might lie in the occasional shading from one conifer with a height of over 12 m next to the grass.

5. Conclusions

This study explored diurnal and seasonal variations in G and Rn; their relationships (midday G/Rn ratios and phase shifts of G to Rn); and the effect of timing, vegetation and soil wetness. In general, hourly soil heat flux on a daily scale changes with vegetation characteristics and soil moisture. It was categorized into two patterns—sparse-canopied plant communities with LAI < 2.45 (CCH, CCO, CH and CUO) followed the diel cycles of Rn exhibiting as unimodal curves, and dense-canopied woodlands with an LAI > 2.99 exhibited as sine curves, including the CMO, CMH and CUH. A clear dependence of summertime G on soil water content was found for the first pattern—it increased first and then decreased with SWC.
Midday G/Rn in CMO, CMH, CUH and CCH were no more than 10% with slight variations. Upward trends in CCO, CH and CUO were due to the phase shift of G, leading to increased G but meanwhile decreased Rn. One-hour Rn and G values in summer were linearly related. For all riparian sites, relationships between G and Rn suffered from hysteresis problems. Phase shifts between riparian Rn and G ranged from one to eight hours, and they were significantly correlated with LAI and soil moisture, mainly accounting for the second pattern of hourly G variations. The equations of diurnal changes in G as a function of Rn, SWC and LAI were obtained with multiple regression analysis. In summary, our work provides a supplemental understanding on the influence of vegetation indices and soil moisture on riparian soil heat flux. It is instructive for scientifical planning and management of riparian woodlands and provides favorable micro-habitats of riparian organisms.

Author Contributions

Conceptualization, A.L. and C.X.; methodology, A.L. and C.X.; software, A.L.; validation, A.L. and C.X.; formal analysis, A.L. and C.X.; investigation, J.W., A.L. and C.X.; resources, C.X. and S.C.; data curation, A.L.; writing—original draft preparation, A.L.; writing—review and editing, A.L. and C.X.; visualization, A.L.; supervision, C.X. and S.C.; project administration, C.X. and S.C.; funding acquisition, C.X. and S.C. All authors have read and agreed to the published version of the manuscript.

Funding

This research was funded by NATIONAL NATURAL SCIENCE FOUNDATION OF CHINA, grant number 31971712.

Data Availability Statement

Not applicable.

Conflicts of Interest

The authors declare no conflict of interest.

References

  1. Sun, R.; Chen, L. How can urban water bodies be designed for climate adaptation? Landsc. Urban Plan. 2012, 105, 27–33. [Google Scholar] [CrossRef]
  2. Zhu, W.; Wu, B.; Yan, N.; Feng, X.; Xing, Q. A method to estimate diurnal surface soil heat flux from MODIS data for a sparse vegetation and bare soil. J. Hydrol. 2014, 511, 139–150. [Google Scholar] [CrossRef]
  3. Liu, X.; Yang, S.; Xu, J.; Zhang, J.; Liu, J. Effects of soil heat storage and phase shift correction on energy balance closure of paddy fields. Atmósfera 2017, 30, 39–52. [Google Scholar] [CrossRef]
  4. Bianca, N.I.E.; Madsen, L.; Hagar, J.C.; Temesgen, H. Estimating Riparian Understory Vegetation Cover with Beta Regression and Copula Models. For. Sci. 2011, 57, 212. [Google Scholar]
  5. Yue, P.; Zhang, Q.; Zhang, L.; Li, H.; Yang, Y.; Zeng, J.; Wang, S. Long-term variations in energy partitioning and evapotranspiration in a semiarid grassland in the Loess Plateau of China. Agric. For. Meteorol. 2019, 278, 107671. [Google Scholar] [CrossRef]
  6. Hatfield, J.L.; Baker, J.M. Micrometeorology in Agricultural Systems; American Society of Agronomy: Madison, WI, USA, 2005; pp. 131–143. [Google Scholar]
  7. Tanguy, M.; Baille, A.; González-Real, M.M.; Lloyd, C.; Cappelaere, B.; Kergoat, L.; Cohard, J.M. A new parameterisation scheme of ground heat flux for land surface flux retrieval from remote sensing information. J. Hydrol. 2012, 454–455, 113–122. [Google Scholar] [CrossRef] [Green Version]
  8. Payero, J.O.; Neale, C.M.U.; Wright, J.L. Estimating soil heat flux for alfalfa and clipped tall fescue grass. Appl. Eng. Agric. 2005, 3, 401–409. [Google Scholar] [CrossRef] [Green Version]
  9. Krishnan, P.; Meyers, T.P.; Scott, R.L.; Kennedy, L.; Heuer, M. Energy exchange and evapotranspiration over two temperate semi-arid grasslands in North America. Agric. For. Meteorol. 2012, 153, 31–44. [Google Scholar] [CrossRef]
  10. Bryś, K.; Bryś, T.; Ojrzyńska, H.; Sayegh, M.A.; Głogowski, A. Variability and role of long-wave radiation fluxes in the formation of net radiation and thermal features of grassy and bare soil active surfaces in Wrocław. Sci. Total Environ. 2020, 747, 141192. [Google Scholar] [CrossRef]
  11. Zhang, Y.; Zhao, W.; He, J.; Zhang, K. Energy exchange and evapotranspiration over irrigated seed maize agroecosystems in a desert-oasis region, northwest China. Agric. For. Meteorol. 2016, 223, 48–59. [Google Scholar] [CrossRef]
  12. Jason Beringer, A.H.L.F. The Representation of Arctic Soils in the Land Surface Model: The Importance of Mosses. J. Clim. 2001, 14, 3324–3335. [Google Scholar] [CrossRef]
  13. Hernandez-Ramirez, G.; Hatfield, J.L.; Prueger, J.H.; Sauer, T.J. Energy balance and turbulent flux partitioning in a corn–soybean rotation in the Midwestern US. Theor. Appl. Climatol. 2010, 100, 79–92. [Google Scholar] [CrossRef]
  14. Tianjiao, F.; Dong, W.; Ruoshui, W.; Yixin, W.; Zhiming, X.; Fengmin, L.; Yuan, M.; Xing, L.; Huijie, X.; Caballero-Calvo, A.; et al. Spatial-temporal heterogeneity of environmental factors and ecosystem functions in farmland shelterbelt systems in desert oasis ecotones. Agric. Water Manag. 2022, 271, 107790. [Google Scholar] [CrossRef]
  15. Drexler, J.Z.; Anderson, F.E.; Snyder, R.L. Evapotranspiration rates and crop coefficients for a restored marsh in the Sacramento–San Joaquin Delta, California, USA. Hydrol. Process. 2008, 22, 725–735. [Google Scholar] [CrossRef]
  16. Welsh, J.H.H.; Hodgson, G.R.; Karraker, N.E. Influences of the vegetation mosaic on riparian and stream environments in a mixed forest-grassland landscape in “Mediterranean” northwestern California. Ecography 2005, 28, 537–551. [Google Scholar] [CrossRef]
  17. Acharya, R.H.; Sigdel, M.; Ma, Y.; Wang, B. Diurnal and seasonal variation of heat fluxes over an agricultural field in southeastern Nepal. Theor. Appl. Clim. 2019, 137, 2949–2960. [Google Scholar] [CrossRef]
  18. Masseroni, D.; Facchi, A.; Romani, M.; Chiaradia, E.A.; Gharsallah, O.; Gandolfi, C. Surface energy flux measurements in a flooded and an aerobic rice field using a single eddy-covariance system. Paddy Water Environ. 2015, 13, 405–424. [Google Scholar] [CrossRef]
  19. Ma, J.; Zha, T.; Jia, X.; Tian, Y.; Bourque, C.P.A.; Liu, P.; Bai, Y.; Wu, Y.; Ren, C.; Yu, H.; et al. Energy and water vapor exchange over a young plantation in northern China. Agric. For. Meteorol. 2018, 263, 334–345. [Google Scholar] [CrossRef]
  20. Wilson, K.B.; Baldocchi, D.D.; Aubinet, M.; Berbigier, P.; Bernhofer, C.; Dolman, H.; Falge, E.; Field, C.; Goldstein, A.; Granier, A.; et al. Energy partitioning between latent and sensible heat flux during the warm season at FLUXNET sites. Water Resour. Res. 2002, 38, 30–31. [Google Scholar] [CrossRef] [Green Version]
  21. Dupont, S.; Patton, E.G. Influence of stability and seasonal canopy changes on micrometeorology within and above an orchard canopy: The CHATS experiment. Agric. For. Meteorol. 2012, 157, 11–29. [Google Scholar] [CrossRef]
  22. Leuning, R.; Van Gorsel, E.; Massman, W.J.; Isaac, P.R. Reflections on the surface energy imbalance problem. Agric. For. Meteorol. 2012, 156, 65–74. [Google Scholar] [CrossRef]
  23. Nelli, N.R.; Temimi, M.; Fonseca, R.M.; Weston, M.J.; Thota, M.S.; Valappil, V.K.; Branch, O.; Wizemann, H.; Wulfmeyer, V.; Wehbe, Y. Micrometeorological measurements in an arid environment: Diurnal characteristics and surface energy balance closure. Atmos. Res. 2020, 234, 104745. [Google Scholar] [CrossRef]
  24. Scott, R.L.; Edwards, E.A.; Shuttleworth, W.J.; Huxman, T.E.; Watts, C.; Goodrich, D.C. Interannual and seasonal variation in fluxes of water and carbon dioxide from a riparian woodland ecosystem. Agric. For. Meteorol. 2004, 122, 65–84. [Google Scholar] [CrossRef]
  25. Wang, X.; Zhou, G.; Zhang, D.; Wang, C. Soil heat fluxes of mixed coniferous and broad-leaf forest in the south subtropics in China. Ecol. Environ. 2005, 14, 260–265. (In Chinese) [Google Scholar]
  26. Wang, X.; Liu, D.; Li, Y.; Wang, Z.; Ma, B. Soil Heat Fluxes of Larix gmelinii in Daxing’anling of Heilongjiang Province. Prot. For. Sci. Technol. 2020, 52, 88–93. (In Chinese) [Google Scholar]
  27. Hossen, M.S.; Mano, M.; Miyata, A.; Baten, M.A.; Hiyama, T. Surface energy partitioning and evapotranspiration over a double-cropping paddy field in Bangladesh. Hydrol. Process. 2012, 26, 1311–1320. [Google Scholar] [CrossRef]
  28. Kustas, W.P.; Prueger, J.H.; Hatfield, J.L.; Ramalingam, K.; Hipps, L.E. Variability in soil heat flux from a mesquite dune site. Agric. For. Meteorol. 2000, 103, 249–264. [Google Scholar] [CrossRef]
  29. Ogée, J.; Lamaud, E.; Brunet, Y.; Berbigier, P.; Bonnefond, J.M. A long-term study of soil heat flux under a forest canopy. Agric. For. Meteorol. 2001, 106, 173–186. [Google Scholar] [CrossRef]
  30. Shao, C.; Chen, J.; Li, L.; Xu, W.; Chen, S.; Gwen, T.; Xu, J.; Zhang, W. Spatial variability in soil heat flux at three Inner Mongolia steppe ecosystems. Agric. For. Meteorol. 2008, 148, 1433–1443. [Google Scholar] [CrossRef]
  31. Beringer, J.; Chapin, F.S.; Thompson, C.C.; McGuire, A.D. Surface energy exchanges along a tundra-forest transition and feedbacks to climate. Agric. For. Meteorol. 2005, 131, 143–161. [Google Scholar] [CrossRef]
  32. Meyers, T.P. A comparison of summertime water and CO2 fluxes over rangeland for well watered and drought conditions. Agric. For. Meteorol. 2001, 106, 205–214. [Google Scholar] [CrossRef]
  33. Santanello, J.A., Jr.; Friedl, M.A. Diurnal covariation in soil heat flux and net radiation. Am. Meteorol. Soc. 2003, 42, 851–862. [Google Scholar] [CrossRef]
  34. Guo, D.; Yang, M.; Wang, H. Sensible and latent heat flux response to diurnal variation in soil surface temperature and moisture under different freeze/thaw soil conditions in the seasonal frozen soil region of the central Tibetan Plateau. Environ. Earth Sci. 2011, 63, 97–107. [Google Scholar] [CrossRef]
  35. Lenters, J.D.; Cutrell, G.J.; Istanbullupglu, E.; Scott, D.T.; Herman, K.S.; Irmak, A.; Eisenhauer, D.E. Water and Energy Balance in Response to the Removal of Invasive Phragmites Australis in a Riparian Wetland. J. Hydrol. 2011, 2011, 19–34. [Google Scholar] [CrossRef] [Green Version]
  36. Behera, S.K.; Mishra, A.K.; Sahu, N.; Kumar, A.; Singh, N.; Kumar, A.; Bajpai, O.; Chaudhary, L.B.; Khare, P.B.; Tuli, R. The study of microclimate in response to different plant community association in tropical moist deciduous forest from northern India. Biodivers. Conserv. 2012, 21, 1159–1176. [Google Scholar] [CrossRef]
  37. Zheng, L.; Zhao, G.; Dong, J.; Ge, Q.; Tao, J.; Zhang, X.; Qi, Y.; Doughty, R.B.; Xiao, X. Spatial, temporal, and spectral variations in albedo due to vegetation changes in China’s grasslands. ISPRS J. Photogramm. Remote Sens. 2019, 152, 1–12. [Google Scholar] [CrossRef]
  38. Kovács, B.; Tinya, F.; Ódor, P. Stand structural drivers of microclimate in mature temperate mixed forests. Agric. For. Meteorol. 2017, 234–235, 11–21. [Google Scholar] [CrossRef] [Green Version]
  39. Friedl, M.A. Forward and inverse modeling of land surface energy balance using surface temperature measurements. Remote Sens. Environ. 2002, 79, 344–354. [Google Scholar] [CrossRef]
  40. Gao, Z.; Horton, R.; Liu, H.P. Impact of wave phase difference between soil surface heat flux and soil surface temperature on soil surface energy balance closure. J. Geophys. Res. 2010, 115, D16112. [Google Scholar] [CrossRef]
  41. Sun, T.; Wang, Z.; Ni, G. Revisiting the hysteresis effect in surface energy budgets. Geophys. Res. Lett. 2013, 40, 1741–1747. [Google Scholar] [CrossRef]
Figure 1. Location of 7 riparian experimental sites along Danshui River in Minhang District, Shanghai—CCO (A), CMO (B), CH (C), CCH (D), CUO (E), CMH (F) and CUH (G).
Forests 13 02062 g001
Figure 2. The schematic diagram of the south-facing slope of the study transect in the arbor–shrub–herbaceous community along the Danshui River. Approximate sensor locations are shown with red boxes. A1–A3 are three measuring points of soil heat flux, respectively, and B is the measuring point of net radiation.
Forests 13 02062 g002
Figure 3. Diurnal variations in net radiation (Rn) above seven riparian communities in spring (a), summer (b), autumn (c) and winter (d). The bars show the standard deviations of Rn.
Forests 13 02062 g003
Figure 4. Diurnal variations in soil heat fluxes (G) in seven riparian communities, in spring (a,e), summer (b,f), autumn (c,g) and winter (d,h). The bars show the standard deviations.
Forests 13 02062 g004
Figure 5. Relationships between soil temperature (Ts), soil water content (SWC) and soil heat flux (G) in the CCH over a 24 h cycle in summer. (a) Contour plot showing relationships between Ts, SWC and G (n = 144). (b) Regression curve of Ts vs. G. Linear fitted regression of Ts and G (r2 = 0.91, p < 0.05, n = 144). (c) Regression curve of SWC vs. G. Polynomial fitted regression of SWC and G (r2 = 0.90, p < 0.05, n = 144).
Forests 13 02062 g005
Figure 6. Midday (10–15 h) variations in ratios of soil heat flux to net radiation (G/Rn) in seven riparian communities in spring (a), summer (b), autumn (c) and winter (d).
Forests 13 02062 g006
Figure 7. Relationships between normalized soil water content (SWC) and the normalized ratio of midday G/Rn in summer. Linear fitted regression of SWC and G/Rn (r2 = 0.64, p < 0.05, n = 42).
Forests 13 02062 g007
Figure 8. Relationship between normalized net radiation and soil heat flux for different riparian plant communities during sunny days in summer. Each point represents a half-hour average. The relationships between normalized net radiation and soil heat flux were statistically significant (p < 0.05) for all sites. Gm−n is G from midnight to noon, and Gn−m is G from noon to midnight.
Forests 13 02062 g008
Table 1. Plant communities in each riparian site along the Danshui River, Shanghai.
No.1234567
Plant
type
Evergreen broadleaf
woodland +shrubland
Coniferous woodland
+shrubland
GrasslandEvergreen broadleaf woodland
+grassland
Deciduous woodland
+shrubland
Coniferous woodland
+grassland
Deciduous woodland +grassland
Plant typeCCOCMOCHCCHCUOCMHCUH
DBH (cm)26 ± 2.4318.80 ± 2.95/26 ± 4.7921 ± 7.2317.50 ± 4.3419 ± 1.87
Height (m)9.7612.800.209.809.6013.009.04
Density (/hm2)3751050/325400850400
Crown ratio59.6%72.68%/49.45%52.20%74.91%64.85%
Summer LAI1.802.99/2.102.453.953.22
Site photosForests 13 02062 i001Forests 13 02062 i002Forests 13 02062 i003Forests 13 02062 i004Forests 13 02062 i005Forests 13 02062 i006Forests 13 02062 i007
Table 2. Environmental variables monitored and instruments applied during data collection.
ParameterInstrumentModelAccuracyMeasuring Height 1
Net radiationNet radiometer QT-1±5%10/12 m
Soil temperatureSoil temperature and humidity probesJXBS-3001±0.5 °C−0.2 m
Soil humidity±3%−0.2 m
Soil heat fluxSoil heat flux plateHFP01<0.1%/°C−0.2 m
1 Measuring height is 10 m for broadleaf woodlands and 12 m for conifers.
Table 3. Daily ranges of RnRn, W/m2) of seven riparian plant communities during four seasons.
ΔRn (W/m2)CCHCCOCHCUOCMOCUHCMH
Spring1035.72767.45642.6420.08400.82377.25484.88
Summer898.40881.83662.93462.3359.05257.38181.17
Autumn1099.93796.17372.32348.17342.85266.17111.77
Winter981.98708.63328.73 318.54228.68312.75258.84
Note: The grid color indicates the groups of plant communities—pink for Group I, grey for Group II and blue for Group III.
Table 4. Correlations between summertime net radiation and soil heat flux at different lagged conditions for all riparian sites.
G0G1hG2hG3hG4hG5hG6hG7hG8h
r2pr2pr2pr2pr2pr2pr2pr2pr2p
CCO0.8880.010.9670.010.9350.010.7970.010.5630.01////
CH0.7590.010.9130.010.9860.010.9570.010.8170.010.5670.05///
CCH0.750.010.8230.010.8170.010.7050.010.5520.01////
CUO0.3930.010.580.010.7470.010.8740.010.9230.010.860.010.6740.01//
CMO−0.9080.01−0.8460.01−0.6950.01−0.4760.05///0.6040.050.7970.01
CMH−0.6710.01−0.4480.05///0.6850.010.8310.010.8760.010.8340.01
CUH−0.7870.01−0.5640.01///0.60.010.7960.010.8940.010.9060.01
Publisher’s Note: MDPI stays neutral with regard to jurisdictional claims in published maps and institutional affiliations.

