Article

The Hydrological and Mechanical Effects of Forests on Hillslope Soil Moisture Changes and Stability Dynamics

1
Three-Gorges Reservoir Area (Chongqing) Forest Ecosystem Research Station, School of Soil and Water Conservation, Beijing Forestry University, Beijing 100083, China
2
Chongqing Bureau of Geology and Minerals Exploration Geology No. 107, Chongqing 401120, China
3
Yunnan Infrastructure Investment Co., Ltd., Kunming 650000, China
4
Chongqing No. 107 Municipal Construction Engineering Co., Ltd., Chongqing 401120, China
*
Author to whom correspondence should be addressed.
Forests 2023, 14(3), 507; https://doi.org/10.3390/f14030507
Submission received: 5 February 2023 / Revised: 23 February 2023 / Accepted: 28 February 2023 / Published: 4 March 2023
(This article belongs to the Section Forest Hydrology)

Abstract

:
Vegetation can play a crucial role in stabilizing slopes through their hydrological and mechanical properties, yet few studies have systematically compared their effects on soil moisture resistance and slope stability. To investigate this, four steep slopes covered by different forests were analyzed in terms of climatic conditions, soil moisture dynamics, root strength and soil physical properties. The results revealed that the roots of Phyllostachys pubescens forests had a higher number and were deeper than the main plant species in the other three forests. Although the root tensile strength of Phyllostachys pubescens was not the strongest, its additional cohesion contributed more to hillslope stability. In the other three forests, suction stress was the main factor contributing to hillslope stability. The soil moisture change rate in Phyllostachys pubescens was found to be the smallest among the four forests studied, indicating that it had the greatest rainfall interception ability. The stability of the slope land covered by shrub forest was found to be more variable than the other three lands in high temperature conditions. Through its soil moisture reducing ability, root characteristics and magnitude of safety factor, Phyllostachys pubescens was identified as a suitable species for slope stabilization in the study area. The findings of this work may provide useful insights for local forest management in terms of selecting suitable plant species to reduce shallow landslides.

1. Introduction

Forests can reduce the amount of rainfall that infiltrates into the soil [1,2,3], and act as a stabilizing force to prevent overland flow erosion and landslides [4]. These effects are mainly due to the ability of rainfall interception and plant root uptake of water [5,6,7,8], the water delivery ability of organic litter, and the complexity of the root network [9,10,11]. While the effects of plant roots and evapotranspiration on slopes have been extensively studied [12,13,14,15,16], few cases have focused on the long-term stability of forested slopes. This is of utmost importance, as suitable natural forests or man-made plant communities are essential for selecting plant species for bio-engineering measures.
Vegetation can contribute to slope stability through hydrological mechanisms that reduce soil moisture [17,18,19]. During rainy events or wetting conditions, vegetation can regulate the amount of water reaching the soil through aerial parts. Studies have revealed that the hydrological mechanism is greatly limited under wetting conditions due to the interception capability of the specified forest type [3,20]. Drying mechanisms tend to reduce the degree of soil saturation after a rainfall event [21,22,23]. Ultimately, the hydrological mechanism contributes to soil matric suction [14,24,25], with lower soil moisture corresponding to higher soil matric suction, which is beneficial for slope stability [26,27]. In forests, the amount of stem flow and throughfall can be further regulated by the surficial organic layer [28]. It acts either an absorbing or a resisting function in the slope hydrology because the fallen leaves of some plant species, such as bamboo or conifer, are more difficult to decompose than the leaves of evergreen broadleaf forests and mixed forests [29,30,31,32,33]. The soil moisture changes of forested soil in wetting conditions are not closely related to the rainfall interception ability, but rather to the properties of the organic litter layer. During rainy events or wetting conditions, the aerial parts of vegetation and the superficial organic litter layer together influence the amount of rainfall infiltration into the soil mass. Thus, the soil moisture changes in varied rainfall events during rainy seasons can provide further insight into the hydrological mechanisms of different forest types.
The mechanical process by which vegetation contribute to slope stability lies in their root network, which provides tensile force to sliding mass and potentially promotes saturated hydrological conductivity [2,17,34,35,36,37]. The role of roots in extracting soil water by evapotranspiration is also rather limited during cold, wet seasons, when landslides typically occur in temperate regions [9,38]. Thus, the root network may contribute more to the stability of forested slopes than the canopy. As temperature and rainfall vary in seasons, the stability of forested slopes is a dynamic process with seasonal variation characteristics [9,39,40]. Evaporative demand or rainfall patterns may further enhance the seasonality of hillslope stability [41]. During the wetting season, the effect of the soil suction on slope stability can be smaller than the contribution from root reinforcement; meanwhile, the dry season sees the hydrological effect of soil suction become far more relevant to hillslope stability [40]. Summer sees the greatest potential benefit to stability coming from soil matric suction from evapotranspiration, while winter and spring see plant roots providing the most important contribution [39]. In all, the different contributions of hydrological and mechanical effects in forested slope stability implies that the two aspects also differ among varied forest types, due to the distinctive root strength, distributions and rainfall interception capabilities. Furthermore, the dynamic process of forested slope stability in varied seasons and the different contribution do not tell us how vegetation affects the temporal variability of slope stability, but we can determine which forested slope has failure potential.
This study monitored soil moisture, rainfall and temperature over 2 years in mixed, evergreen broadleaf, Phyllostachys pubescens and shrub forests to compare the hydrological effect of each forest and the stability dynamics of corresponding forested slopes. The hydrological process in each forest focused on the soil moisture change with varied rainfall amounts, which represents the water interception capability of aerial parts and the organic litter layer. The stabilizing effect was assessed through a combination of root network investigation and soil suction stress fluctuation. This work also provided a comparison of the differences in root network and resistance of rainfall infiltration for the four forest types. The results of this study provide a preliminary case study elucidating the role of varied forest types in altering slope hydrology and strengthening steep slopes, which is useful for forest structure improvement.

2. Materials and Methods
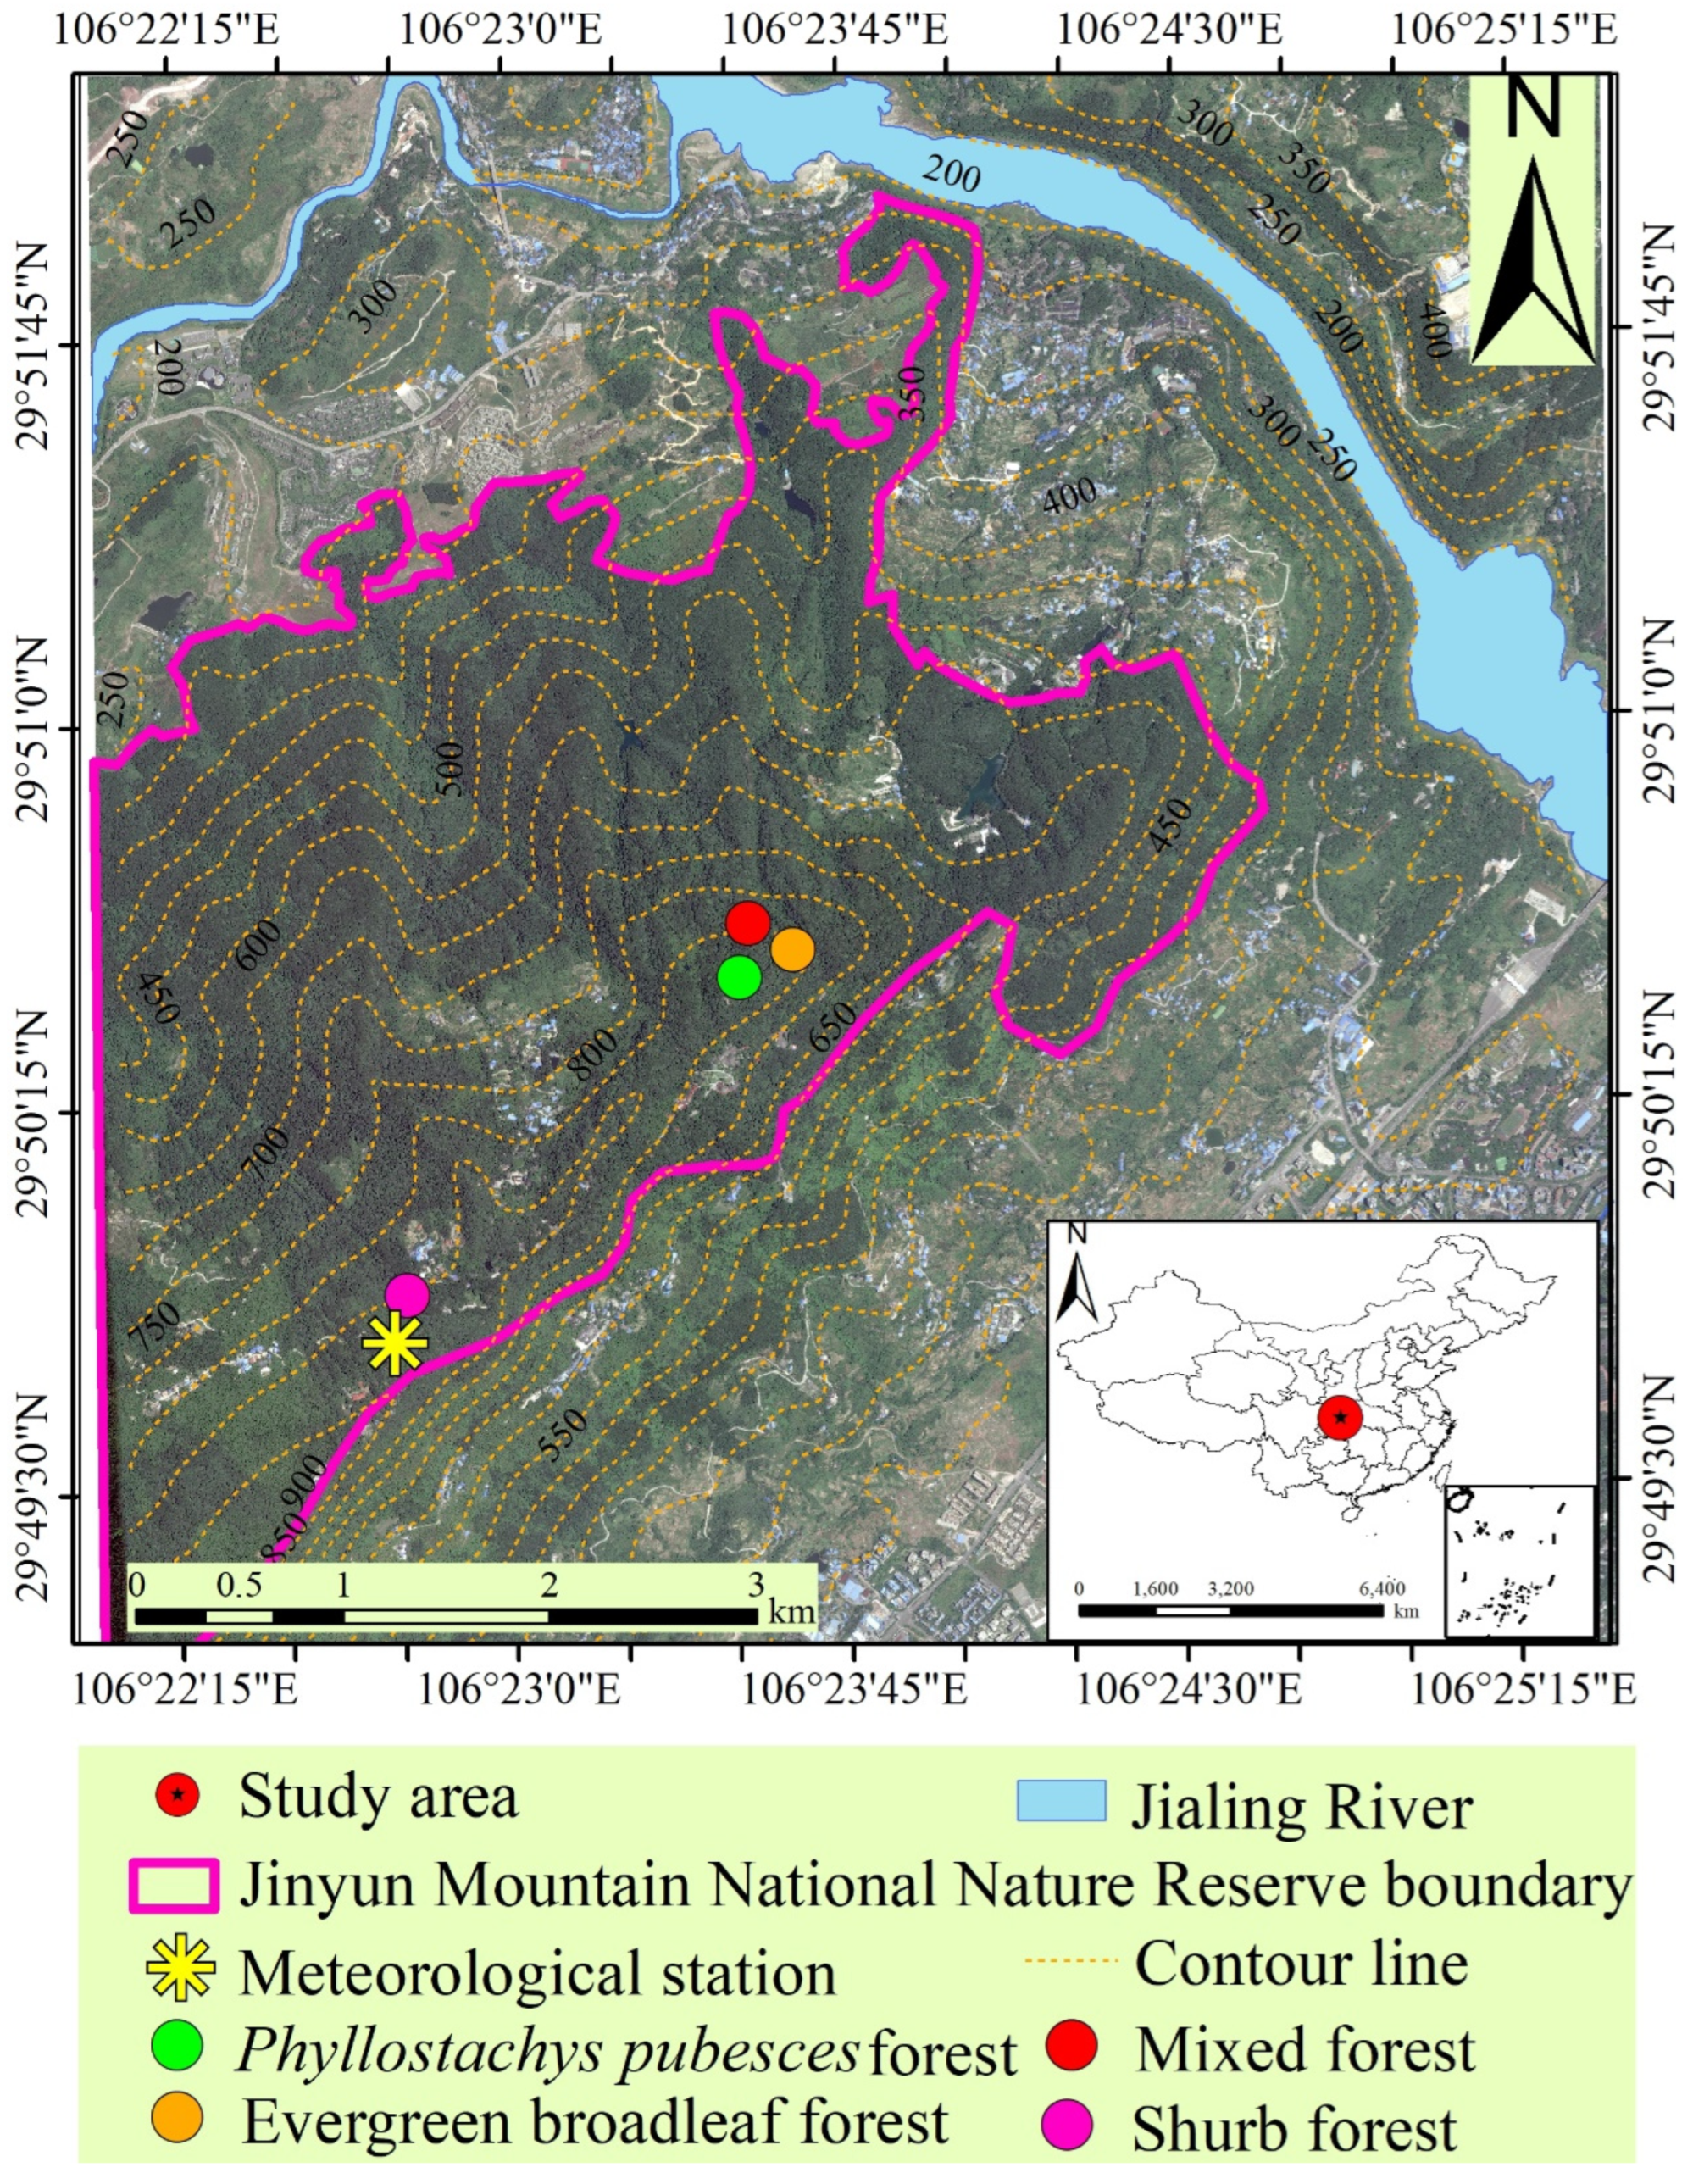
2.1. Study Area

The study area is located on the western margin of the Three Gorges area (Figure 1), with a subtropical monsoon climate featuring a mean annual precipitation of 1610 mm and mean annual temperature of 13.6 °C. About 75% of precipitation falls during summer and autumn. Mountainous areas account for more than 90% of the total area. The soil is derived from sandstone and shale [42], and the dominant soil type is an acid yellow soil weathered from Orthic Acrisols and a small amount of Aric Anthrosols. Most slope terrain is covered by acid yellow soil, with sand stone and mud shale underneath [43]. In general, six main vegetation types exist in this area, including evergreen broadleaf forest, warm conifer forest, evergreen broadleaf shrub, Phyllostachys pubescens forest, subtropical shrub and aquatic vegetation.
This study selected a mixed forest, evergreen broadleaf forest, Phyllostachys pubescens forest, and shrub forest as the study object, with the specific location of the four forest lands shown in Figure 1. The soil layers in most terrain are commonly around 1.0 m, with a slope gradient ranging from 20 to 45° and a soil texture of sandy loam and soil parental material of argillaceous sandstone. Except the Phyllostachys pubescens forest in some areas, the main tree species in the mixed forest mainly are Symplocos sumuntia, Pinus massoniana Lamb and Gordonia axillaris; the main tree species in the evergreen broadleaf forest are Neolitea aurata (hayata) koidz and Gordonia axillaris; and the main tree species in the shrub forest are Lindera kwangtungensis (Liou) Allen and aurata (hayata) koidz.

2.2. Methods

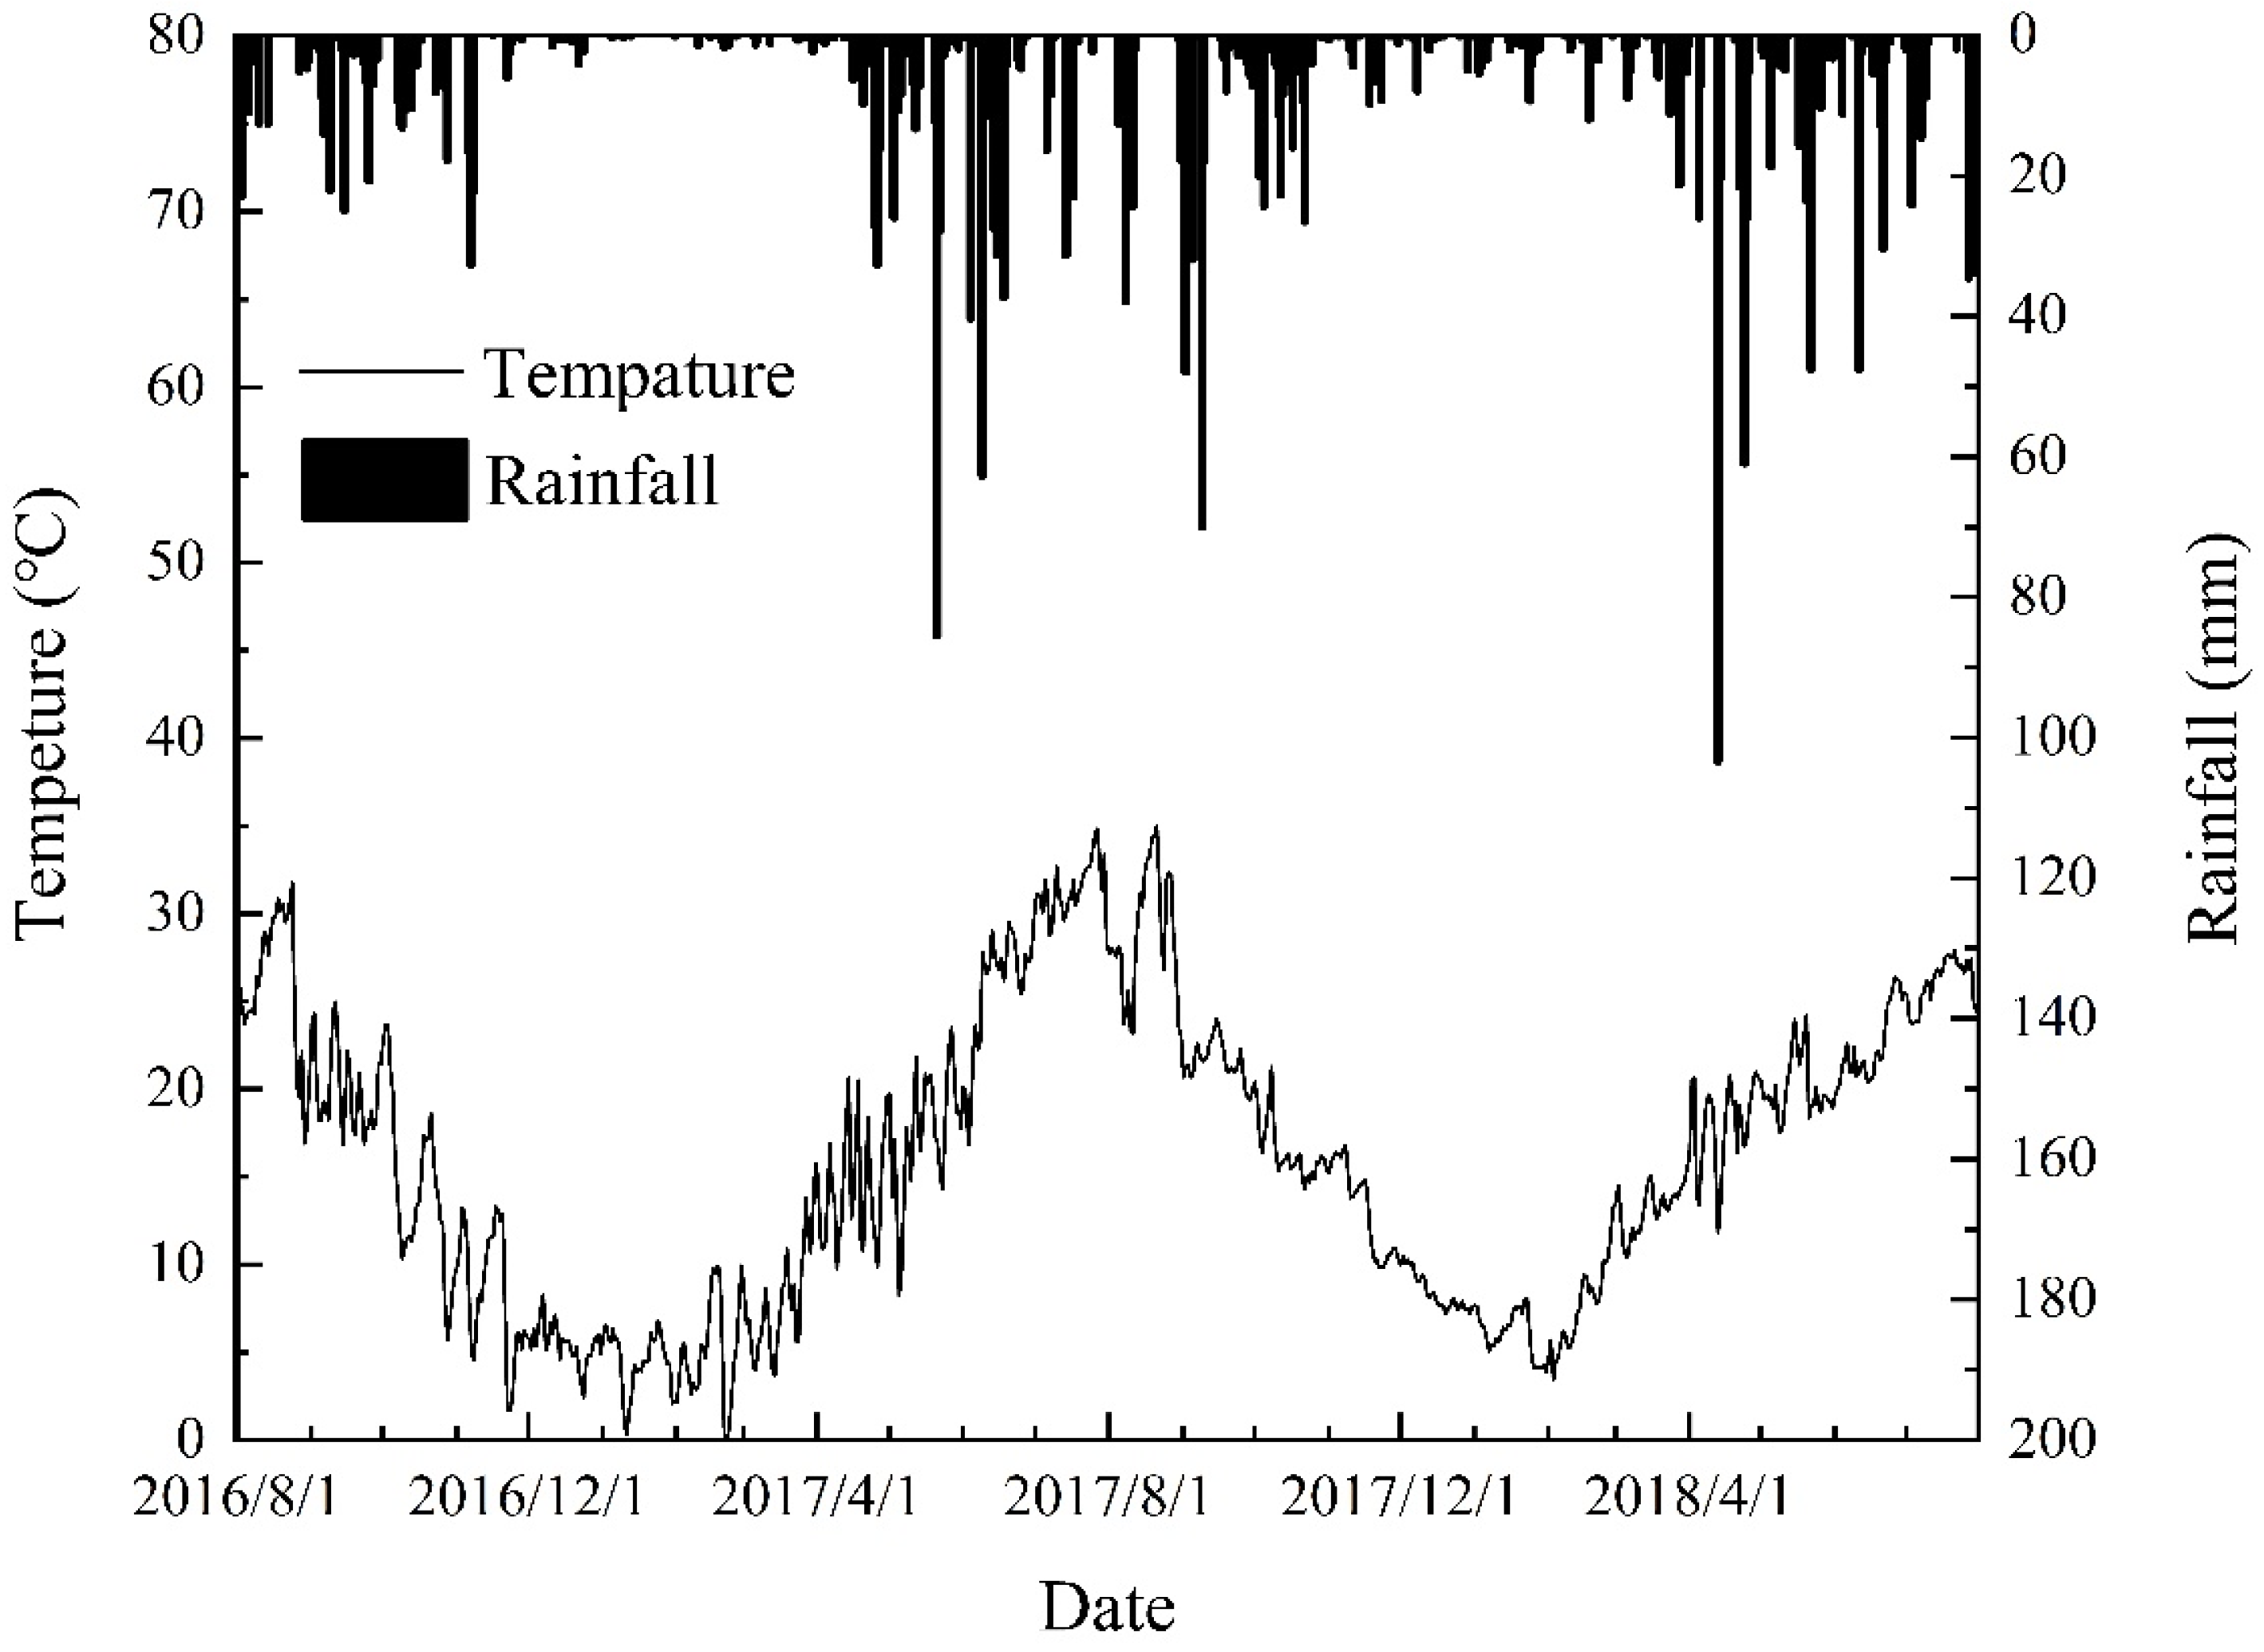
2.2.1. Climatic Data and Soil Moisture Observation

At each slope land, the sensor was activated on 5 May 2016, and soil moisture at depths of 10, 50 and 80 cm were continuously recorded. The 5TM soil moisture temperature sensor produced by the METER Company was used as the sensor model, with an accuracy of ±2% when measuring soil volume moisture content. The Em50, produced by the METER Company, was used as the data collector, with a measurement interval of 30 min. The Jinyun Mountain positioning observatory was used to monitor meteorological data such as rainfall and temperature. The RG-3M rain gauge cylinder, produced by ONSET, was used to collect rainfall data with a resolution of 0.2 mm and an accuracy of ±1%. The ETC air temperature sensor, produced by the METER Company, was used to monitor temperature with a resolution of 0.1 °C and an accuracy of ±0.5 °C, with a sampling interval of 30 min. Rainfall amount, temperature and soil moisture records from August 2016 to July 2018 were continuously recorded. In order to compare the soil moisture variation and analyze the ability delaying rainfall infiltration, an index representing soil moisture variation is proposed and expressed as:
E = ( θ t θ 0 ) / θ 0
where the E is the soil moisture variation rate, which is closely related to rainfall conditions and forest types; θ0 and θt are the soil moisture content before and after a rainfall event, respectively; θ0 is the soil moisture when the rainfall begins; and θt is the maximum soil moisture of one day after rainfall begins.

2.2.2. Slope Stability Simulation

Assuming an infinite slope with a constant gradient, the slope stability was assessed by calculating the ratio of the net downslope driving force that held the soil column in place. [14,44]. Fs < 1 indicates an unstable slope, whereas Fs > 1 denotes a stable slope:
F S = tan φ tan β + 2 ( c + c r ) γ s h sin 2 β σ s γ s h ( tan β + cot β ) tan φ
where Fs is the factor of safety, β is the topographic slope angle (°), φ′ is the effective internal friction angle of soil (°), C′ is the effective cohesion of soil (kPa), Cr is the cohesion attributable to plant roots (kPa), h is soil thickness (m), γs is the unit weight of the soil (g/cm3), and σs is suction stress (kPa) and is estimated by [45]:
σ s = S e ( u a u w ) = S S r 1 S r ( u a u w ) = θ θ r θ s θ r ( u a u w )
where Se is the effective degree of saturation; S is the degree of saturation, the ratio of liquid volume to pore volume per unit volume; Sr is the residual degree of saturation; θ is measured soil volume water content over time; θs is the soil volume water content at saturation; θr is the residual soil volume water content; and (ua − uw) is the matric suction (kPa).

2.2.3. Soil Sample Measurements

In each forested slope, three soil profiles were dug to a depth of around 1 m. Soil samples were collected at depths of 0–20 cm, 20–40 cm, 40–70 cm and 70–100 cm. A total of 144 soil samples were collected, 48 of which were used for the triaxial test, 48 were used for the soil–water characteristic curve, and 48 were used for bulk density measurements. The triaxial test sampler had a diameter of 39.1 mm and a height of 80 mm. The soil sampler for the soil–water characteristic curve samples was 53.6 mm in diameter and 10 mm in height. The sampler for bulk density was 50.46 mm in dimeter and 50 mm in height. The soil moisture content and bulk density were measured using an oven and balance. The effective cohesion and internal friction angle of bare soil were measured by consolidated undrained tests at a confining pressure of 50, 100, 200 and 300 kPa [46]. The soil and water characteristic curve was measured using a pressure film instrument. During measuring process, the soil samples were putted in distilled water overnight, then into a pressure cooker to measure the soil moisture at a pressure of 0.01, 0.05, 0.1, 0.3, 0.5, 0.5, 1, 3, 5, and 10 MPa.

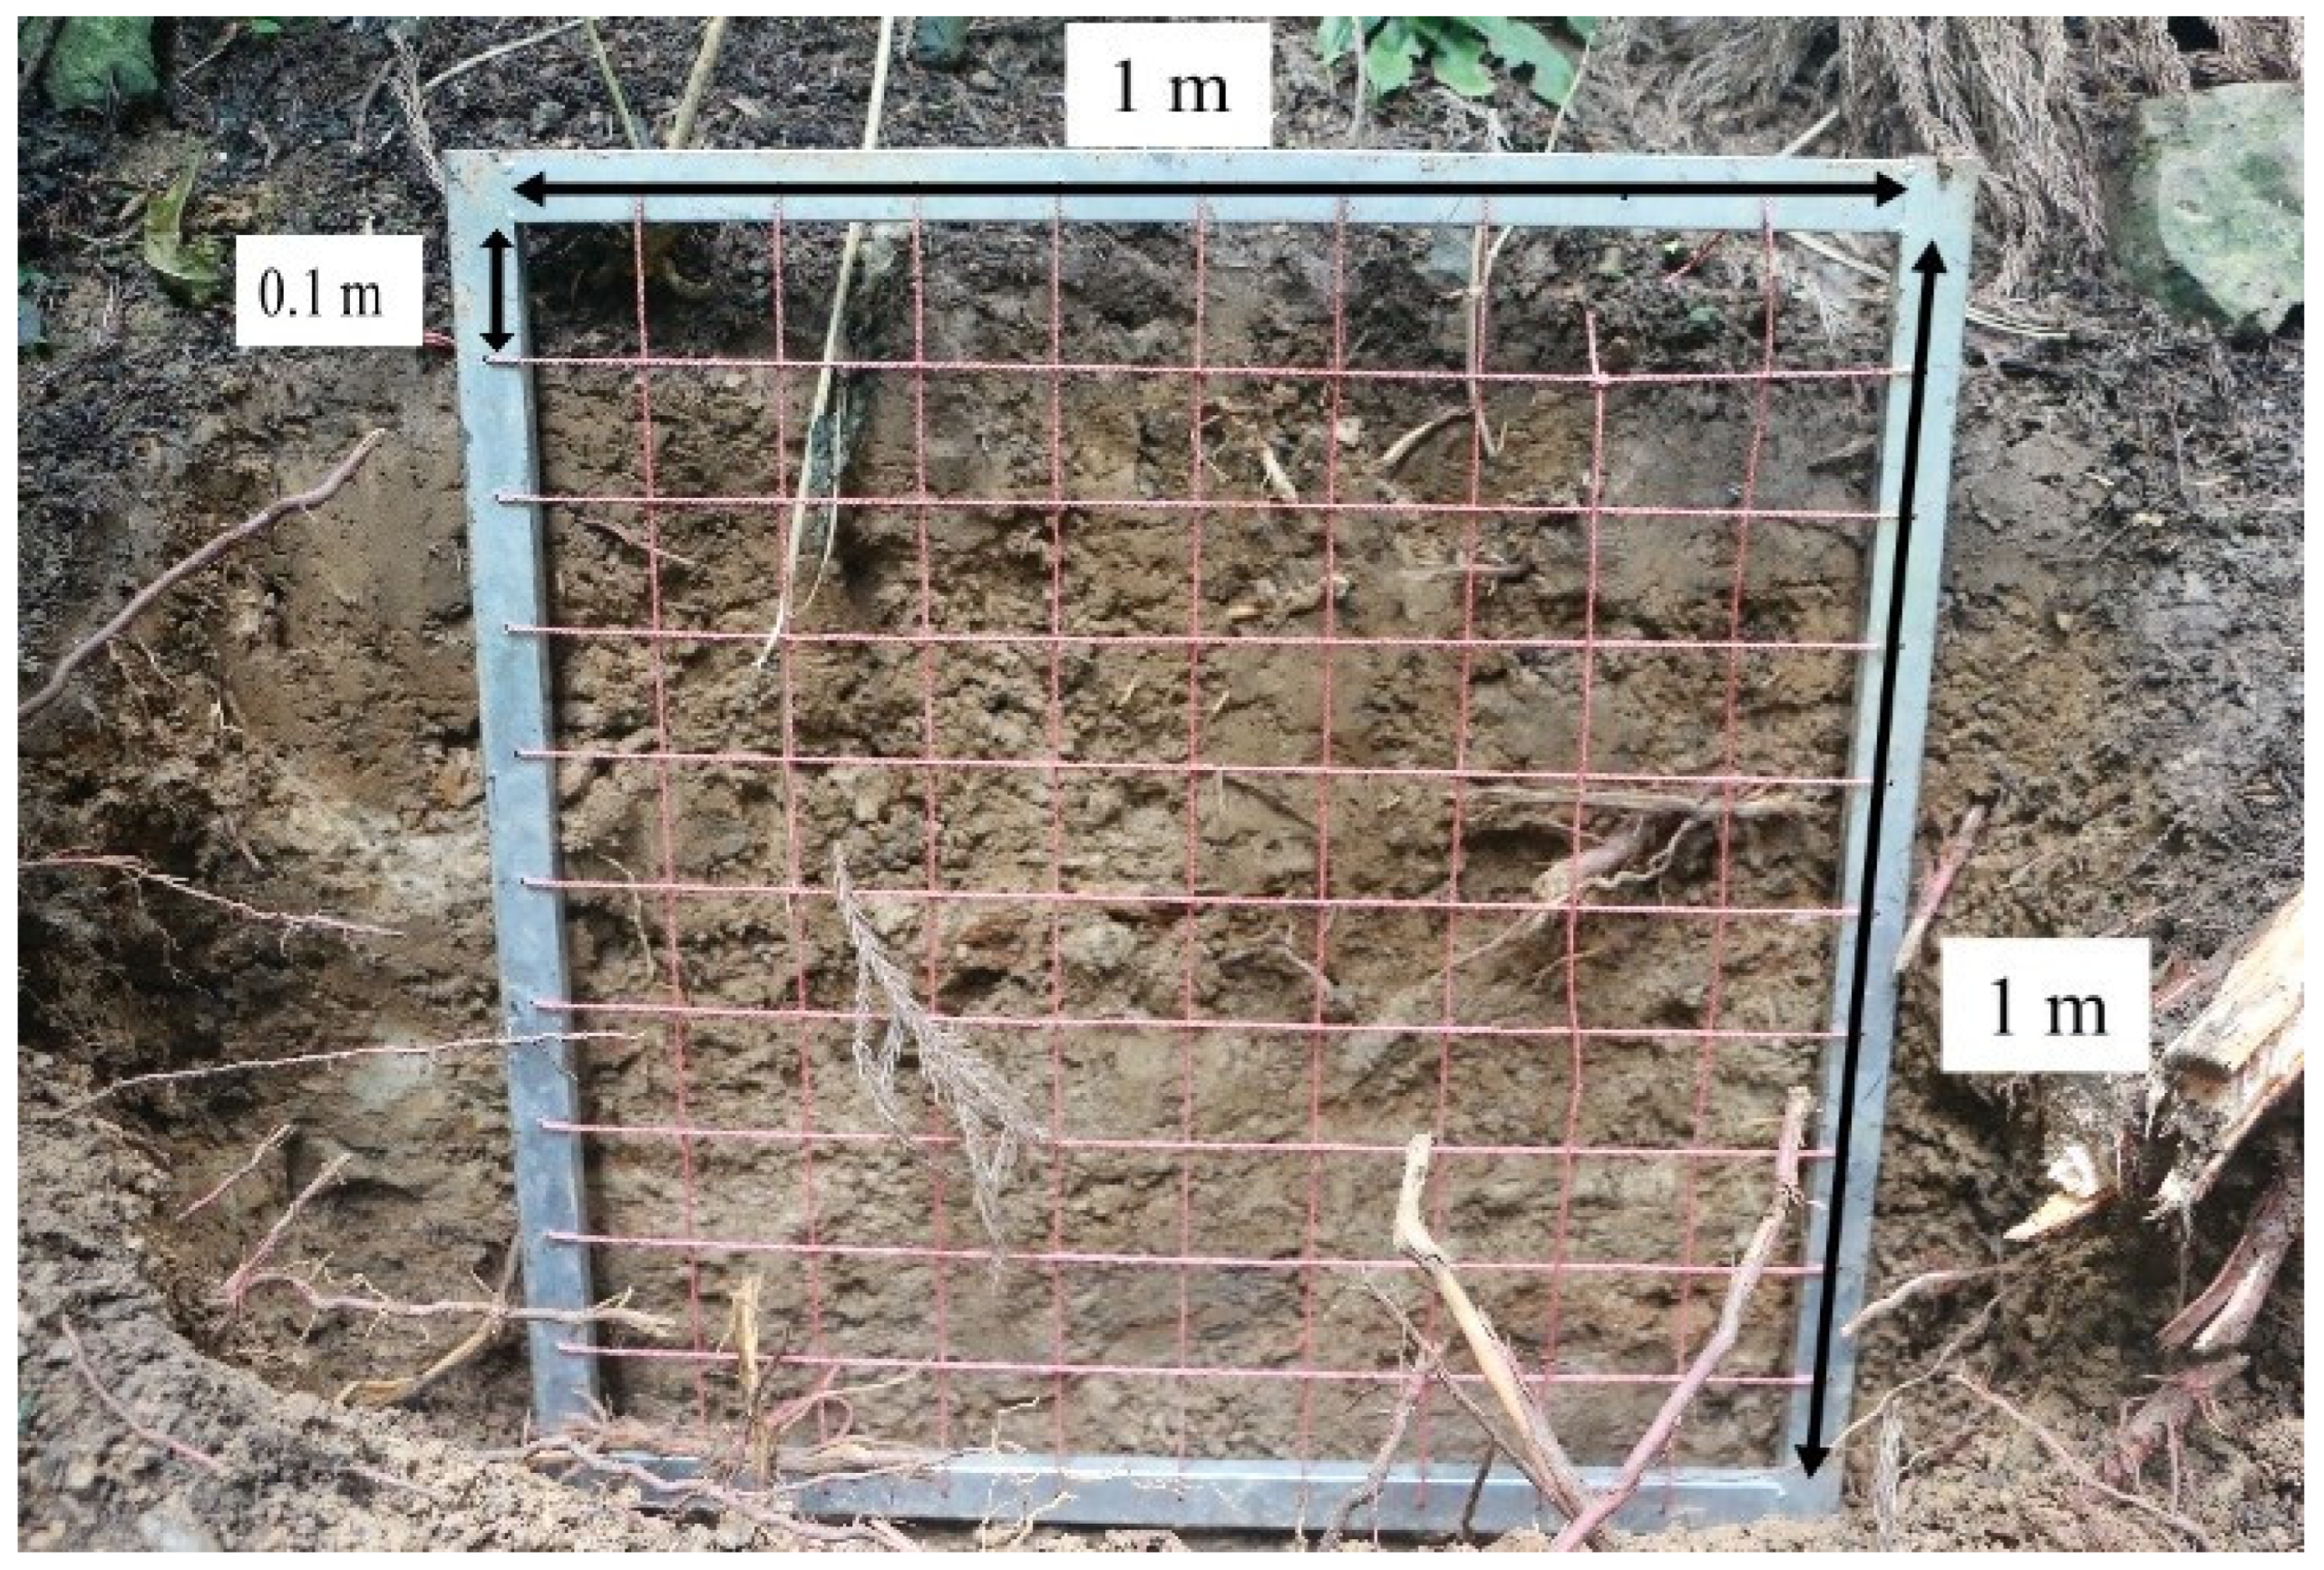
2.2.4. Root Samplings

At each soil profile, the number and diameter of roots in each grid (0.1 m × 0.1 m) were investigated by Vernier calipers (Figure 2). The root area ratio (RAR) of this soil layer was the average of all grid RAR in this soil layer:
R A R = i n n i a i A = A r A
where RAR is the root area ratio; n is the number of root diameter classes (0–2 mm, 2–4 mm, 4–6 mm, 6–8 mm, >8 mm); ni is number of roots in ith diameter classes; ai is the median of the diameter classes in ith diameter classes; i is the serial number of the root diameter classes; Ar is the total area of the roots (mm2); and A is the reference area (mm2). In order to evaluate the differences in RAR between species, analysis of covariance (ANCOVA) was used, taking into account the soil depth as a covariant factor. All statistical analyses were conducted using SPSS.
Roots were collected and taken back to the laboratory for root tensile testing. After excavation, the roots were stored in a plastic bag to preserve their moisture content. The instrument used for the test was an S9M universal testing machine. Tensile tests were conducted on roots with a length of more than 6 cm, at a tensile speed of 10 mm/min [47]. In the tensile test, a fracture of the middle part of the root system is considered successful. After the root fracture, the diameter of the fractured root system is measured with a vernier caliper to calculate the ultimate tensile strength of the roots. According to the previous research results [10,48], the tensile strength of the roots is:
T r = 4 F m a x π D 2
where Tr is the tensile strength of the roots (MPa), D is the root diameter (mm), and Fmax is the maximum tensile force (N). To evaluate the differences in tensile strength between species, analysis of covariance (ANCOVA) was used, taking into account the diameter as a covariant factor.
The additional cohesion force provided by root network is:
C r = K T r R A R
where K is a coefficient. As Wu et al. [49] assumed that all roots break at the same time when the slope fails and overestimated the additional cohesion caused by the presence of roots [50]. The K refers to the previous shear test results and model calculations in the study area, and it is 0.63 [51].

3. Results

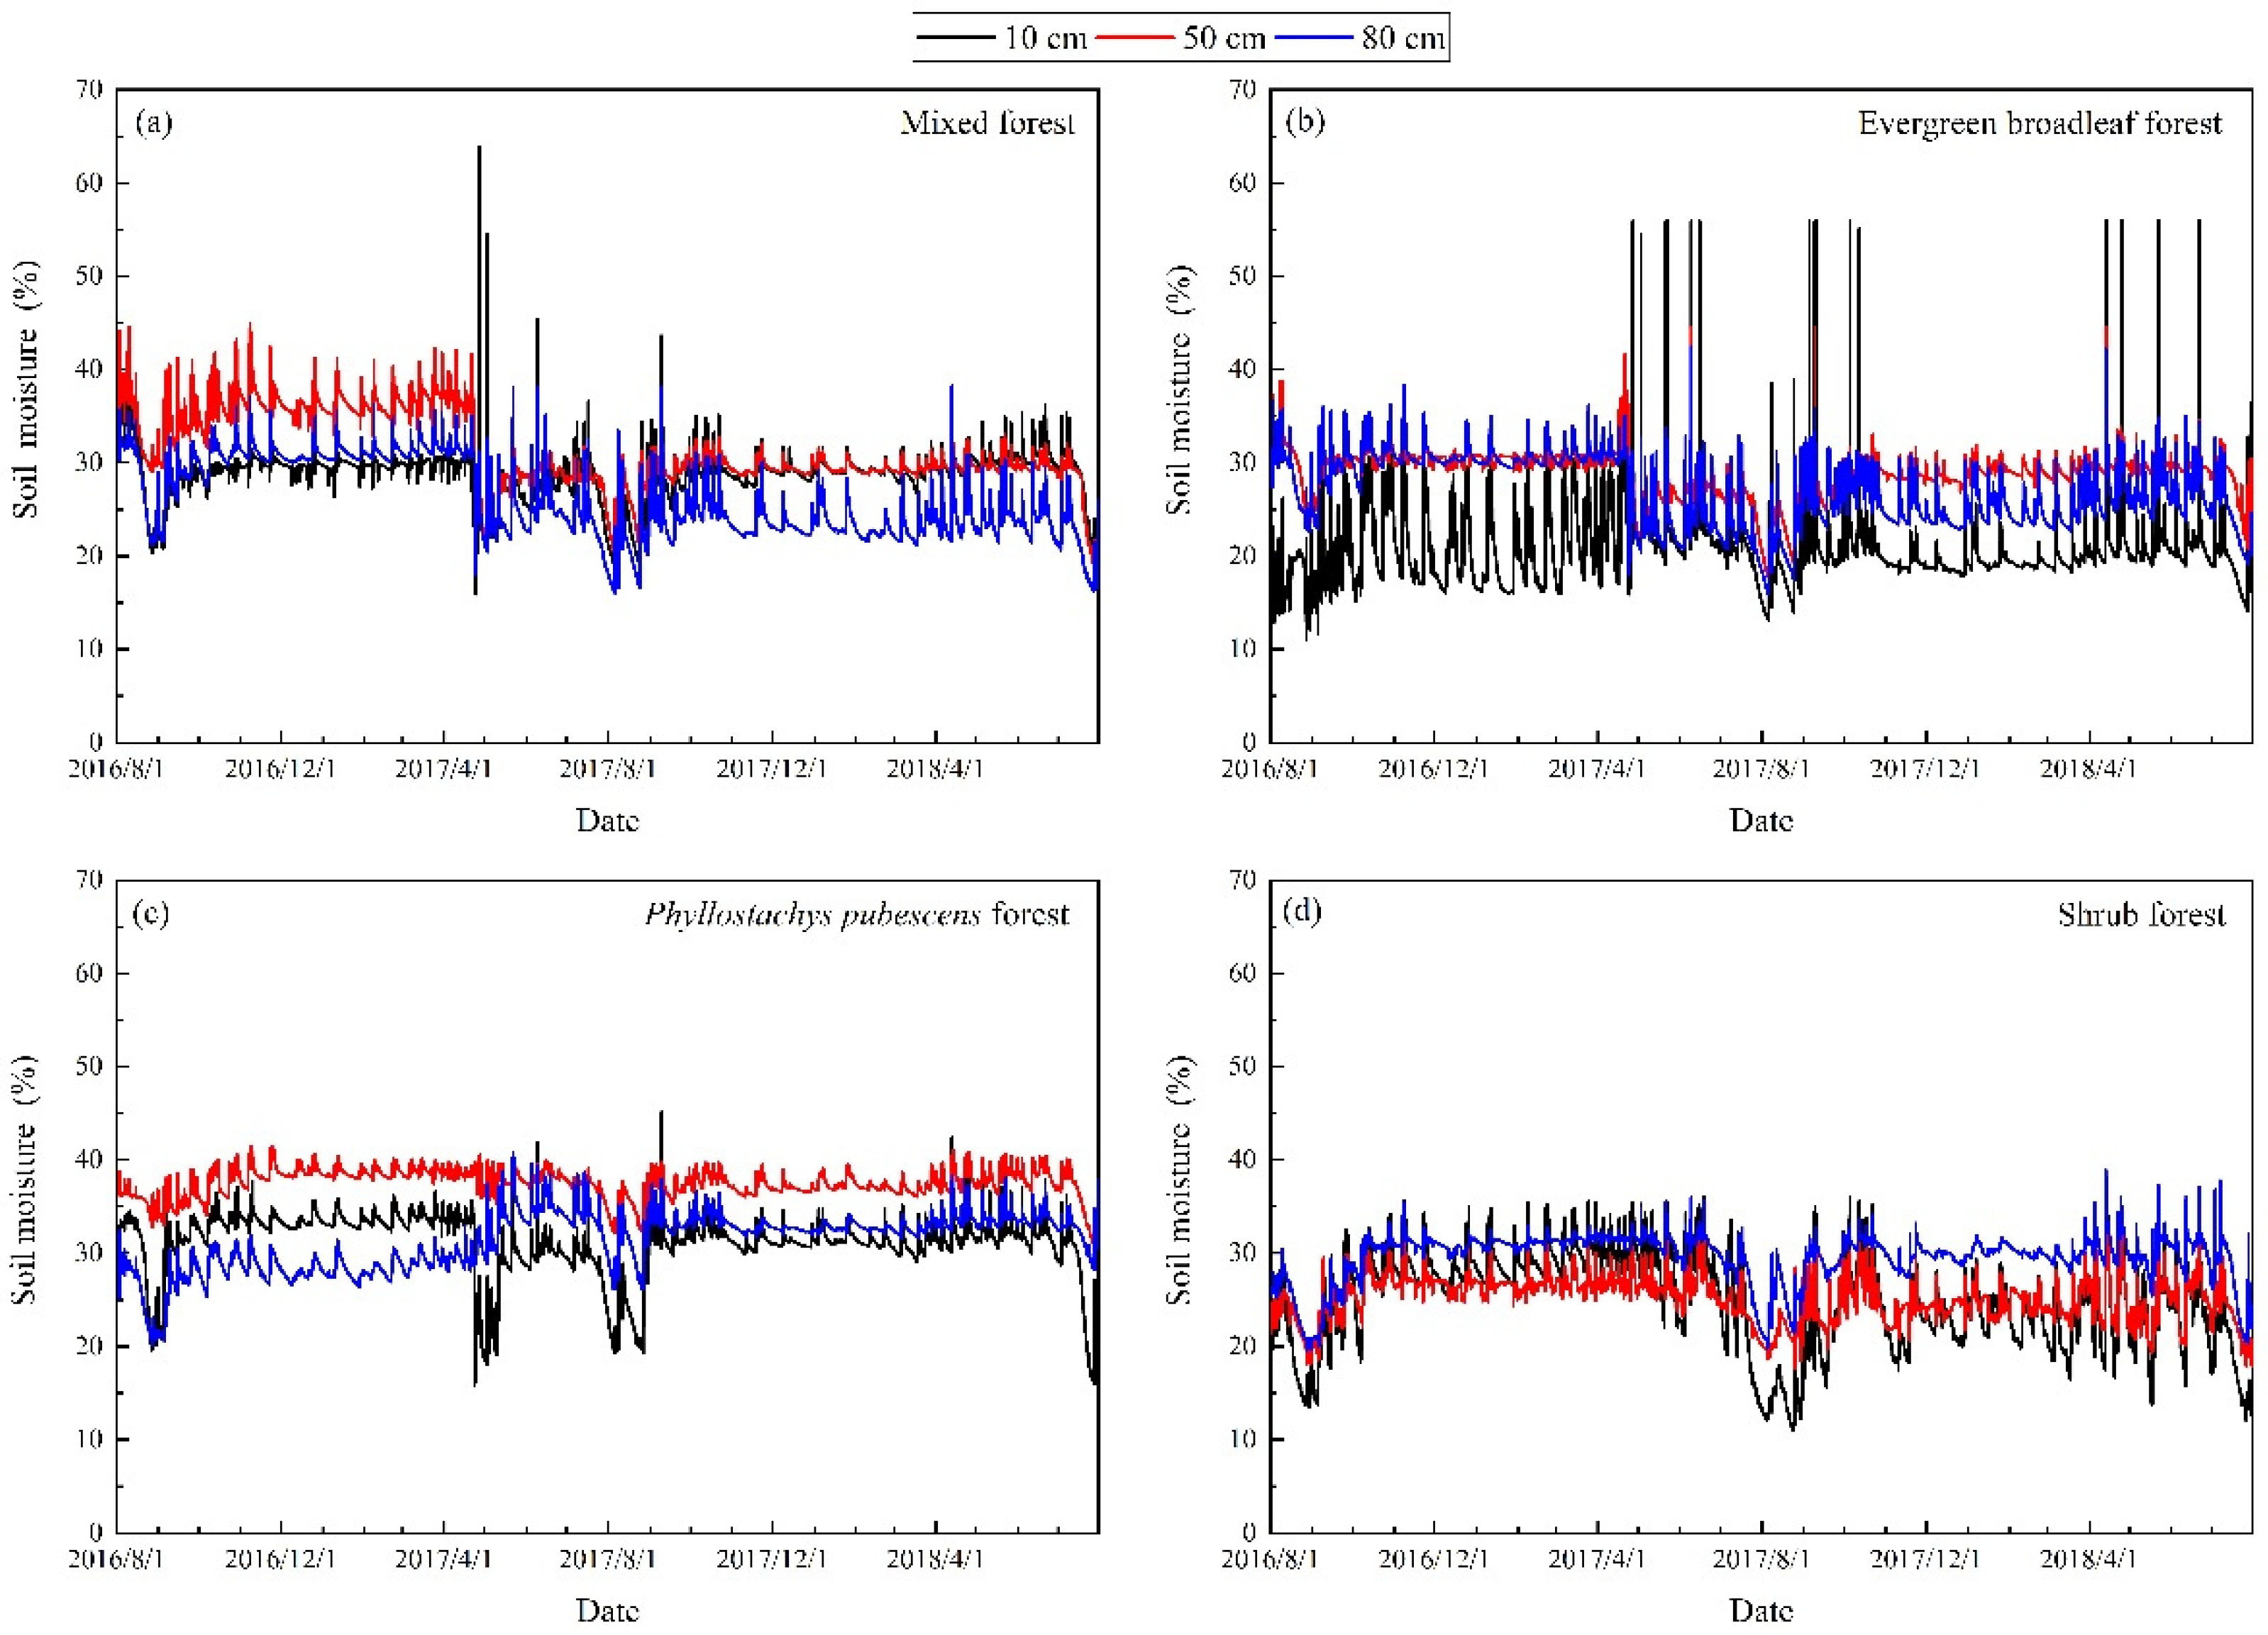
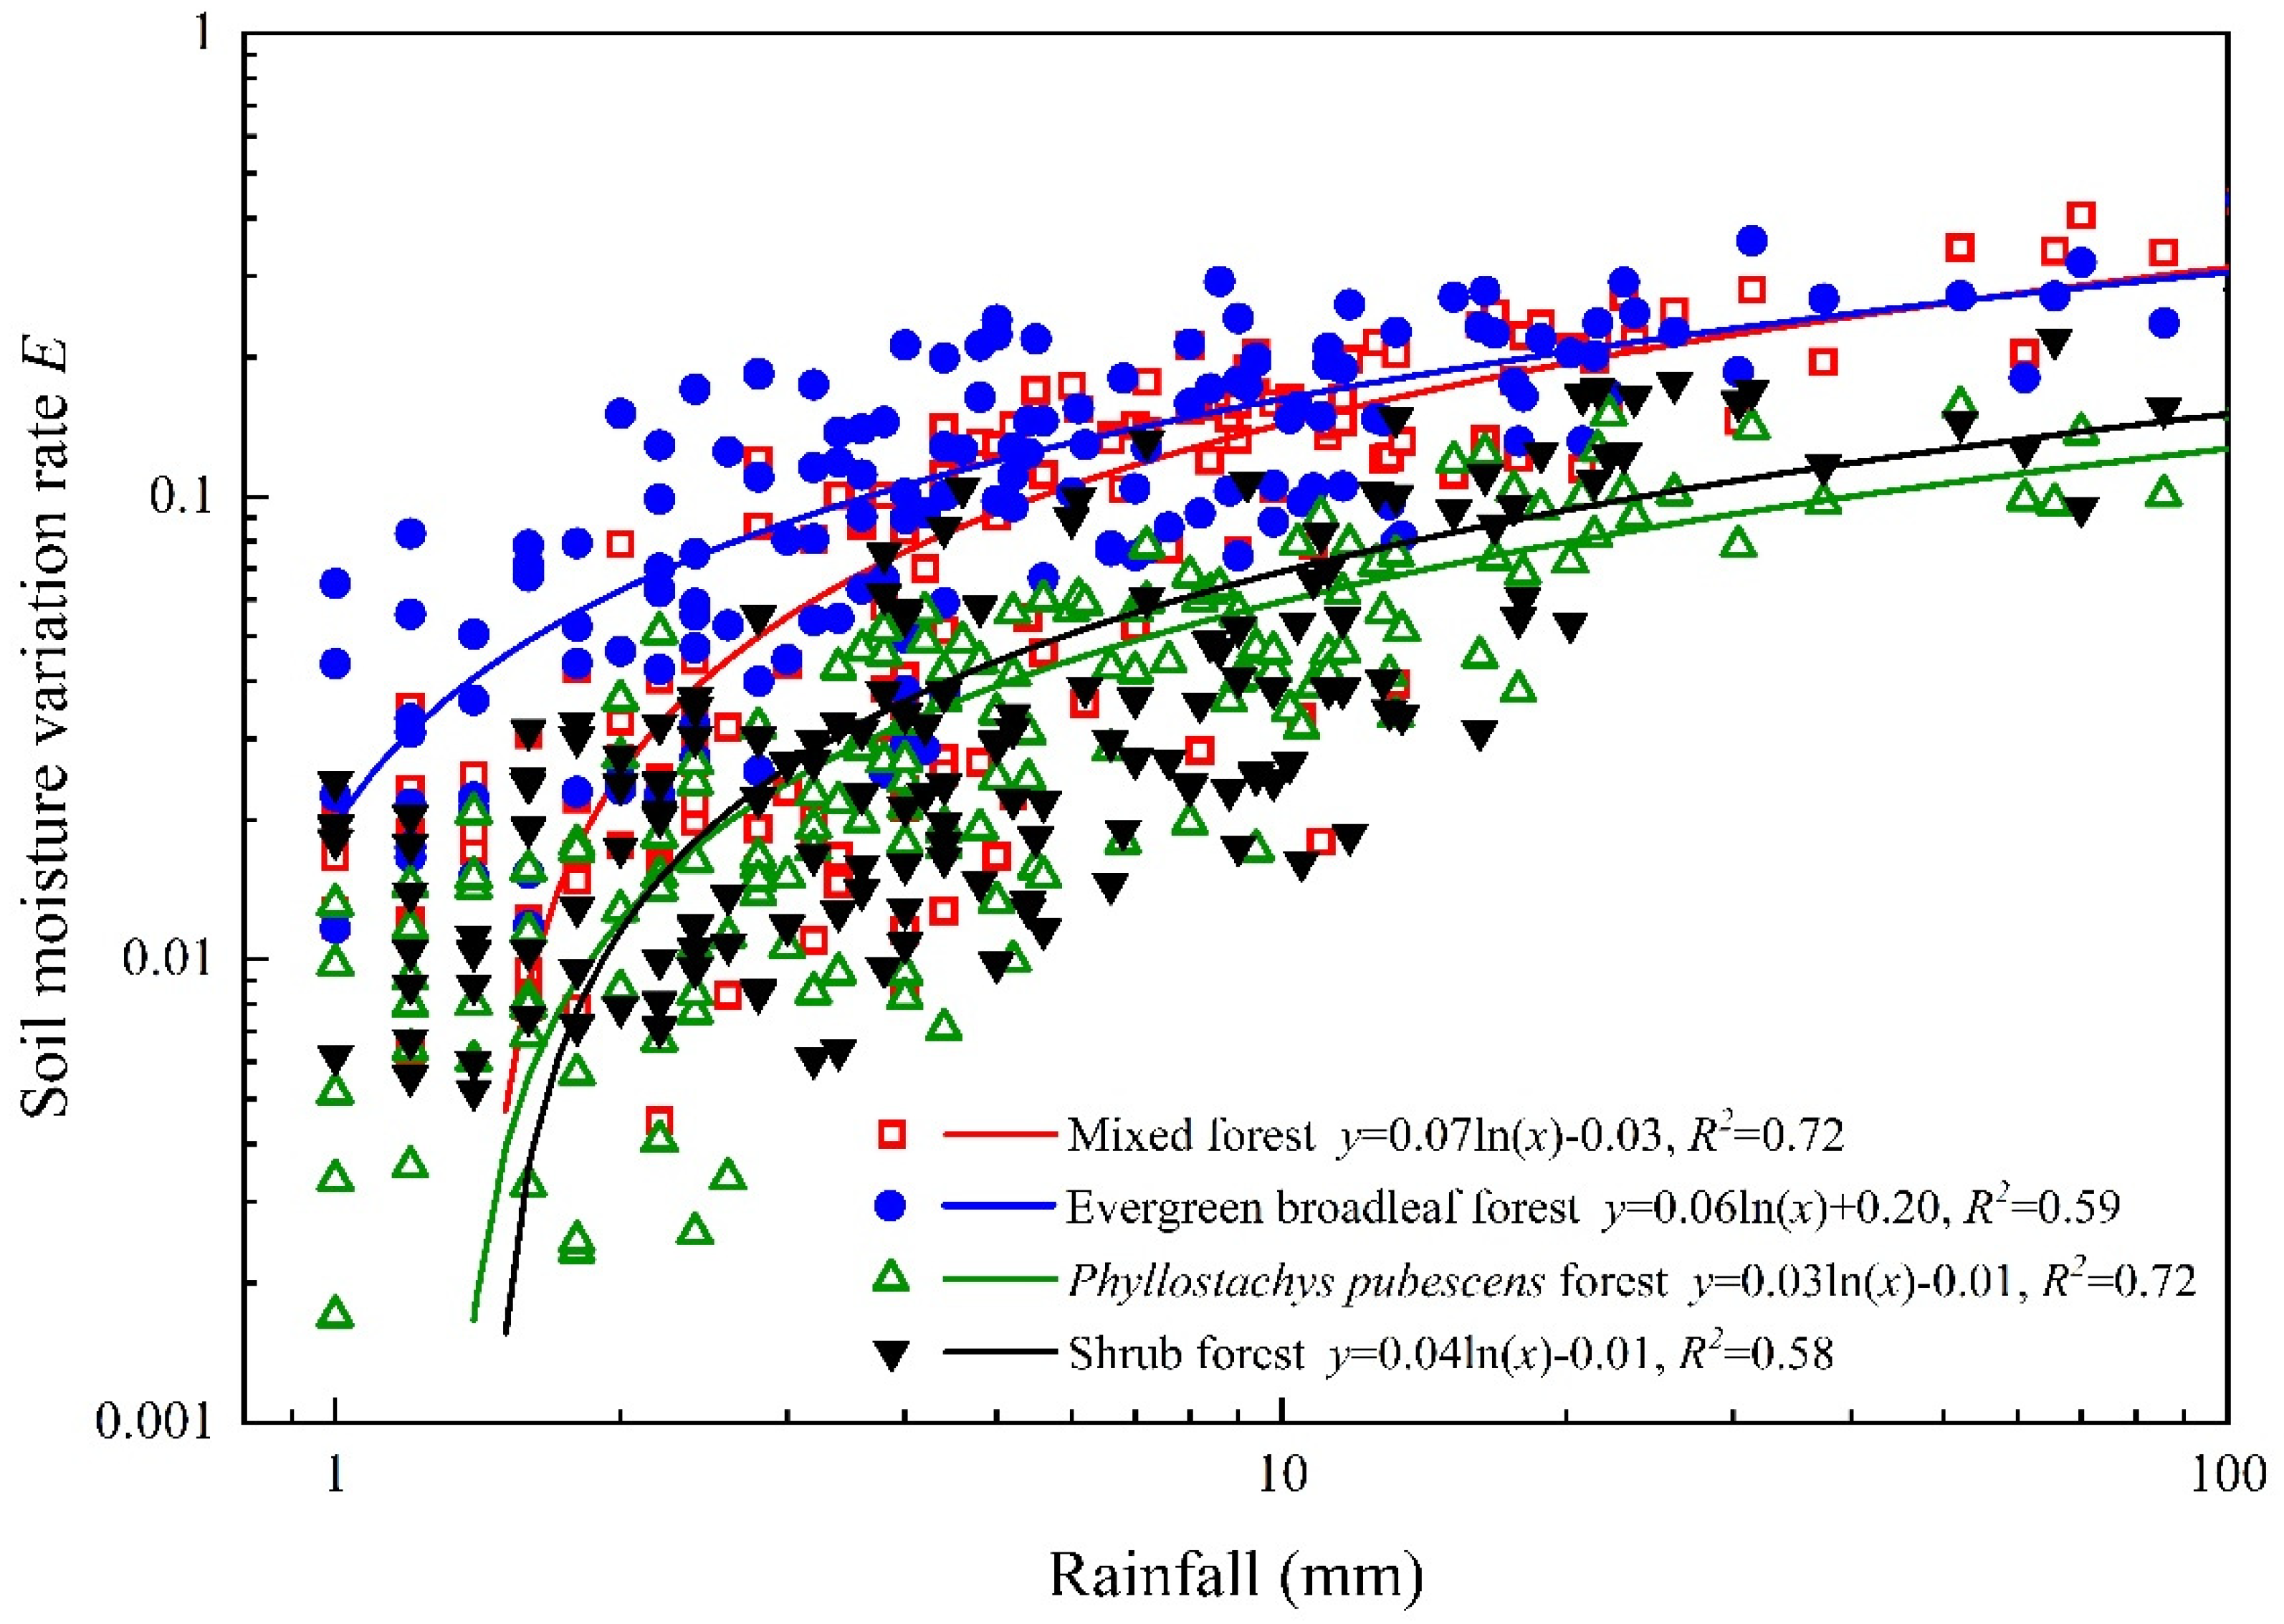
3.1. Soil Moisture Response

As shown in Figure 3, precipitation mainly concentrated during April and November, and the other months were dry seasons. In detail, June and September had abundant rainfalls; the temperature in July and August were higher than other months, sometimes exceeding 30 °C. January had the lowest temperature and less precipitation. A total of 47 rainfall events with a rainfall amount over 10 mm were recorded, and were classified as moderate (29 events), heavy (13 events) or torrential (5 events).
The variation in soil moisture is shown in Figure 4. The response of soil moisture in each slope may be distinctive due to the varied rainfall interception capability and the resistance ability of the litter. In particular, the soil moisture variation rate at the 80 cm soil layer is the focus of this work, as the depth is located just on the boundary between the soil layer and bedrock. During the measurement duration, the soil moisture of the 10, 50 and 80 cm soil layer in the mixed forest and evergreen broadleaf forest was nearly saturated in some rainfall events, indicating that the soil porosity was filled with water. However, no saturation phenomena were found in the whole soil layers in the Phyllostachys pubescens forest and shrub forest.
The relationship between soil moisture variation rate (E) and rainfall amount is shown in Figure 5. The E increased with rainfall amount in a logarithm pattern. In the mixed forest and evergreen broadleaf forest, the E were commonly lower than 0.3 as rainfall increased, sometimes exceeding 0.4. In the Phyllostachys pubescens forest, the E were generally lower than 0.15, and the maximal E was merely 0.16. The E in the shrub forest was similar to the Phyllostachys pubescens forest; the E in most cases was lower than 0.18, and the E maximum was 0.27%. This illustrates that the soil moisture changes in the Phyllostachys pubescens and shrub forest were less sensitive than the mixed forest and evergreen broadleaf forest at a given rainfall amount. Under a given rainfall amount, the moisture variation rate in the Phyllostachys pubescens forest and shrub forest were less sensitive than the mixed forest and evergreen broadleaf forest as the E were commonly lower. By each coefficient in the logarithmic expression, the Phyllostachys pubescens forest had the highest rainfall interception capability, followed by shrub forest, evergreen broadleaf forest and mixed forest. Notably, when the rainfall amount exceeded 25 mm, the E values of the mixed and evergreen broadleaf forests were similar. Note that the soil porosities of the 80 cm soil layer in the four forests were relatively similar, ranging from 38.14 to 43.91% (Table 1). Cheng [52] reported that the interception rate of the four forests were 0.08, 0.07, 0.09 and 0.03%, respectively; the litter storage volumes were 16.29, 17.84, 16.21 and 32.42 t/hm2; and the litter storage volume in the undecomposed layers were 6.20, 5.08, 16.21 and 9.81 t/hm2. In contrast, although the interception rate of the shrub forest was the lowest, the whole and undecomposed litter storage volume were larger than the evergreen broadleaf forest and mixed forest. This may lead to a relatively smaller E in the shrub forest at a given rainfall amount. However, the litter storage volume in the undecomposed layers of Phyllostachys pubescens forest was the highest, which may result in the lowest E.

3.2. Physical Properties of Soil Mass and Plant Roots

3.2.1. Physical Properties of Soil Samplings
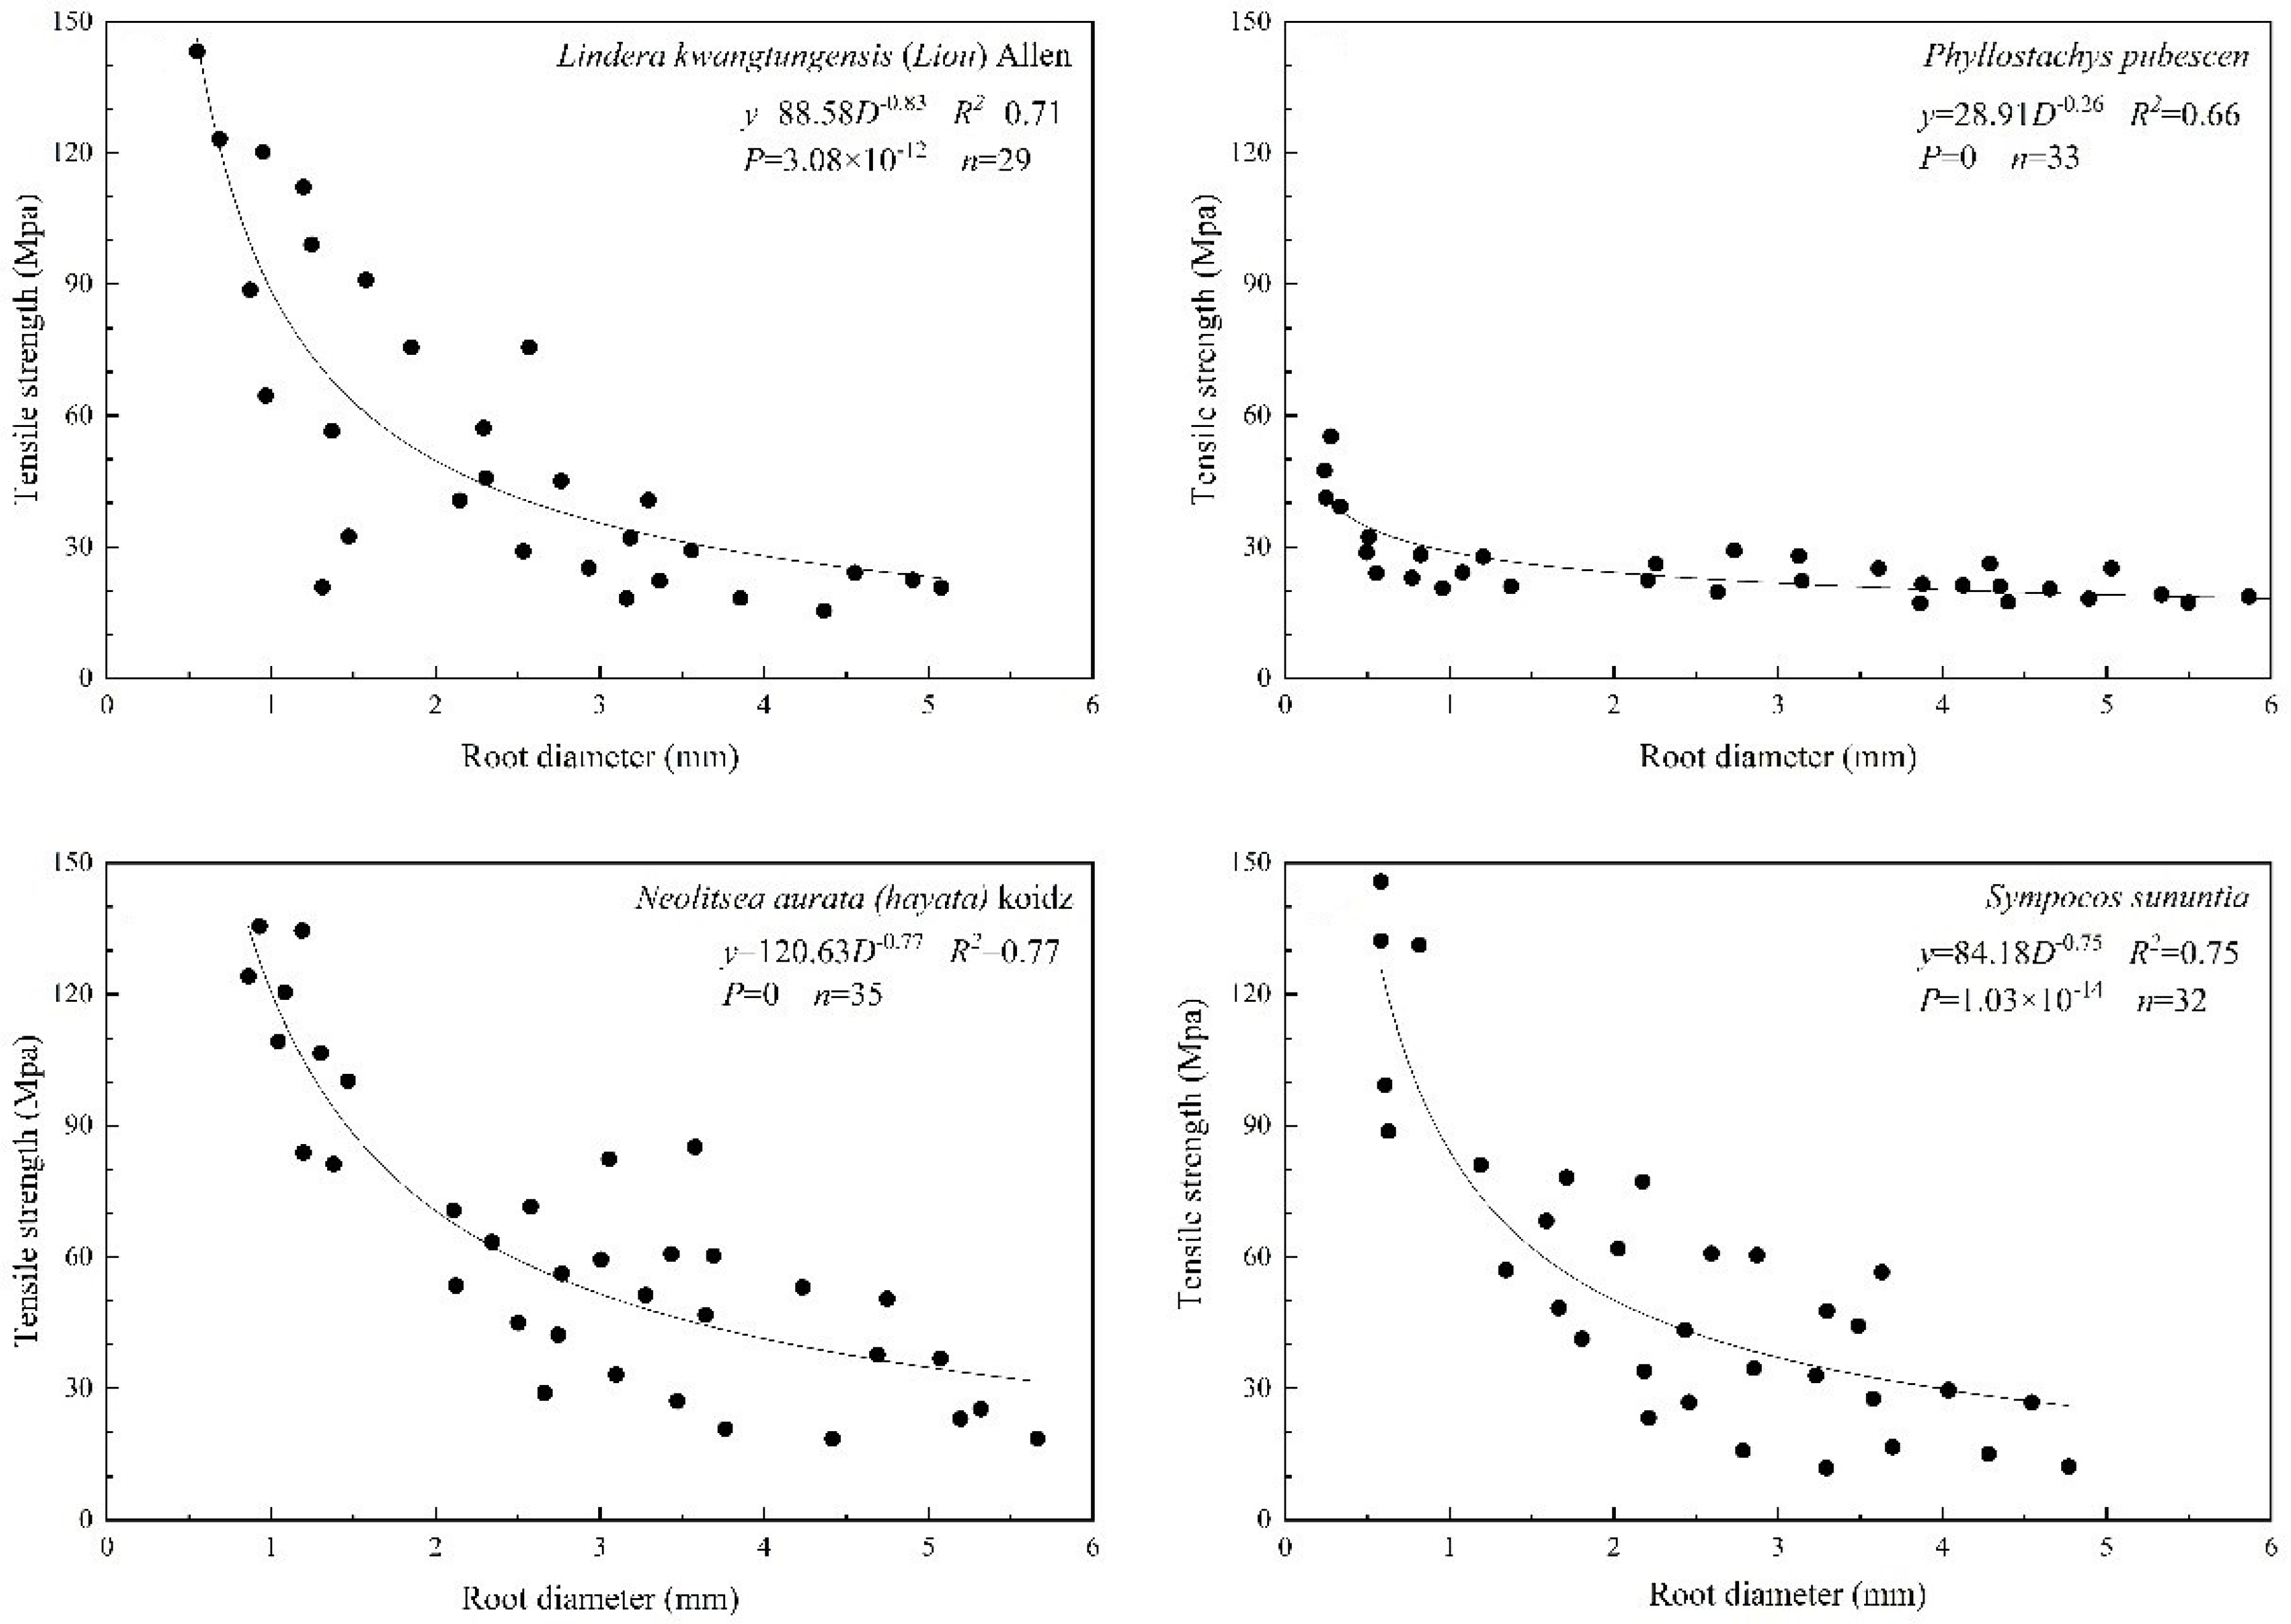
Overall, the porosity ranged from 38.14 to 73.33%, and approximately decreased with soil depth (Table 1). The bulk density of the soil mass was between 0.75 and 1.58 g/cm3, except for the 20–40 cm soil layer in the mixed forest and Phyllostachys pubescens forest in which the bulk density increased with soil depth. The effective cohesion of the shrub forest and Phyllostachys pubescens forest ranged from 11.35 to 45.61 kPa, and increased with soil depth. In the mixed forest and evergreen broadleaf forest, the effective cohesion in the 20–40 cm soil layer were 33.31 and 45.65 kPa, respectively, which was higher than other soil layers. In the mixed forest, the effective cohesion in the 0–20 cm soil layer was merely 14.74 kPa. In the evergreen broadleaf forest, the cohesion in the 70–100 cm layer was 5.18 kPa and lower than other soil layers. In addition, the effective internal friction angles did not differentiate a lot between soil layers, ranging from 17.23 to 28.62°.

3.2.2. Plant Roots

The statistical analysis revealed a strong correlation between RAR and species (F = 5.977, p < 0.001, ANCOVA). Table 2 shows the root distribution and the additional cohesion in each soil layer of the four forests (Table 2). The roots of the mixed forest were mainly in the 0–70 cm soil layer, and the RAR ranged from 0.04% to 0.22%. The roots of the evergreen broadleaf forest penetrated deeply to 1 m, with the RAR of the 0–20 cm soil layer approximately 0.21%, and the RAR of the 20–100 cm soil layer ranged from 0.08% to 0.10%, which was smaller than the 0–20 cm soil layer. In hillslope land covered by the Phyllostachys pubescens forest, the roots were mainly in the 0–100 cm soil layer and the RAR ranged from 0.34 to 0.48%. In detail, the RAR in the 0–20 cm and 20–40 cm soil layers were larger than those in the 40–70 cm and 70–100 cm layers. The roots of the shrub forest were mainly in the 0–40 cm soil layer. The RAR of the 0–20 and 20–40 cm soil layers were about 0.19 and 0.04%, respectively. In detail, the RAR in the 0–20 cm and 20–40 cm soil layers were larger than 40–70 cm and 70–100 cm. The roots of the shrub forest were mainly found in the 0–40 cm soil layer, with an RAR of the 0–20 and 20–40 cm soil layers of approximately 0.19 and 0.04%, respectively. In the mixed, evergreen broadleaf and Phyllostachys pubescens forests, most of the roots had a diameter larger than 2 mm, while the roots in the shrub forest had a diameter ranging from 0 to 2 mm.
The statistical analysis shown that strength was strongly correlated with regard to the species (F = 12.378, p < 0.001, ANCOVA). Figure 6 shows each relationship between root tensile strength and diameter for the main plant species in the four slope lands. In order to the compare the tensile strength at a given root diameter, each relationship was expressed by the power law function. According to the varied decreasing relationship, the four plants can be categorized into two classes: one is Phyllostachys pubescens, which had a root strength < 60 MPa, and the root diameter had little effect on tensile strength; the other includes Symplocos sumuntia, Lindera kwangtungensis (Liou) Allen and Neolitsea aurata (Hayata) Koidz, whose root strength had a wider range (from 10 to 150 MPa), and decreased with the root diameter. For roots with a diameter < 5 mm, the tensile strength of plant roots in the mixed, evergreen broadleaf and shrub forests were higher than that of the Phyllostachys pubescens forest; for roots with a diameter > 5 mm, the tensile strength of the plant roots in the four lands were similar.
The magnitude and variation of the additional cohesion were similar to the RAR. In the mixed forest, the additional cohesion in the 0–70 cm soil layer ranged from 8.22 to 34.15 kPa. In the evergreen broadleaf forest, the additional cohesion in the 0–20 cm soil layer was 47.65 kPa, which had a larger root area ratio than the other three soil layers. Although the root tensile strength and root diameter of Phyllostachys pubescens were smaller than other plant species, the root area ratio was the largest. This implies that the additional cohesion in Phyllostachys pubescens forestland was the largest among them. In detail, the additional cohesion of Phyllostachys pubescens forest land ranged from 39.59 to 59.46 kPa, while additional cohesion of shrub forest land was merely 36.18 and 18.93 kPa in the 0–20 and 20–40 cm soil layers, respectively.

3.3. Stability Fluctuation

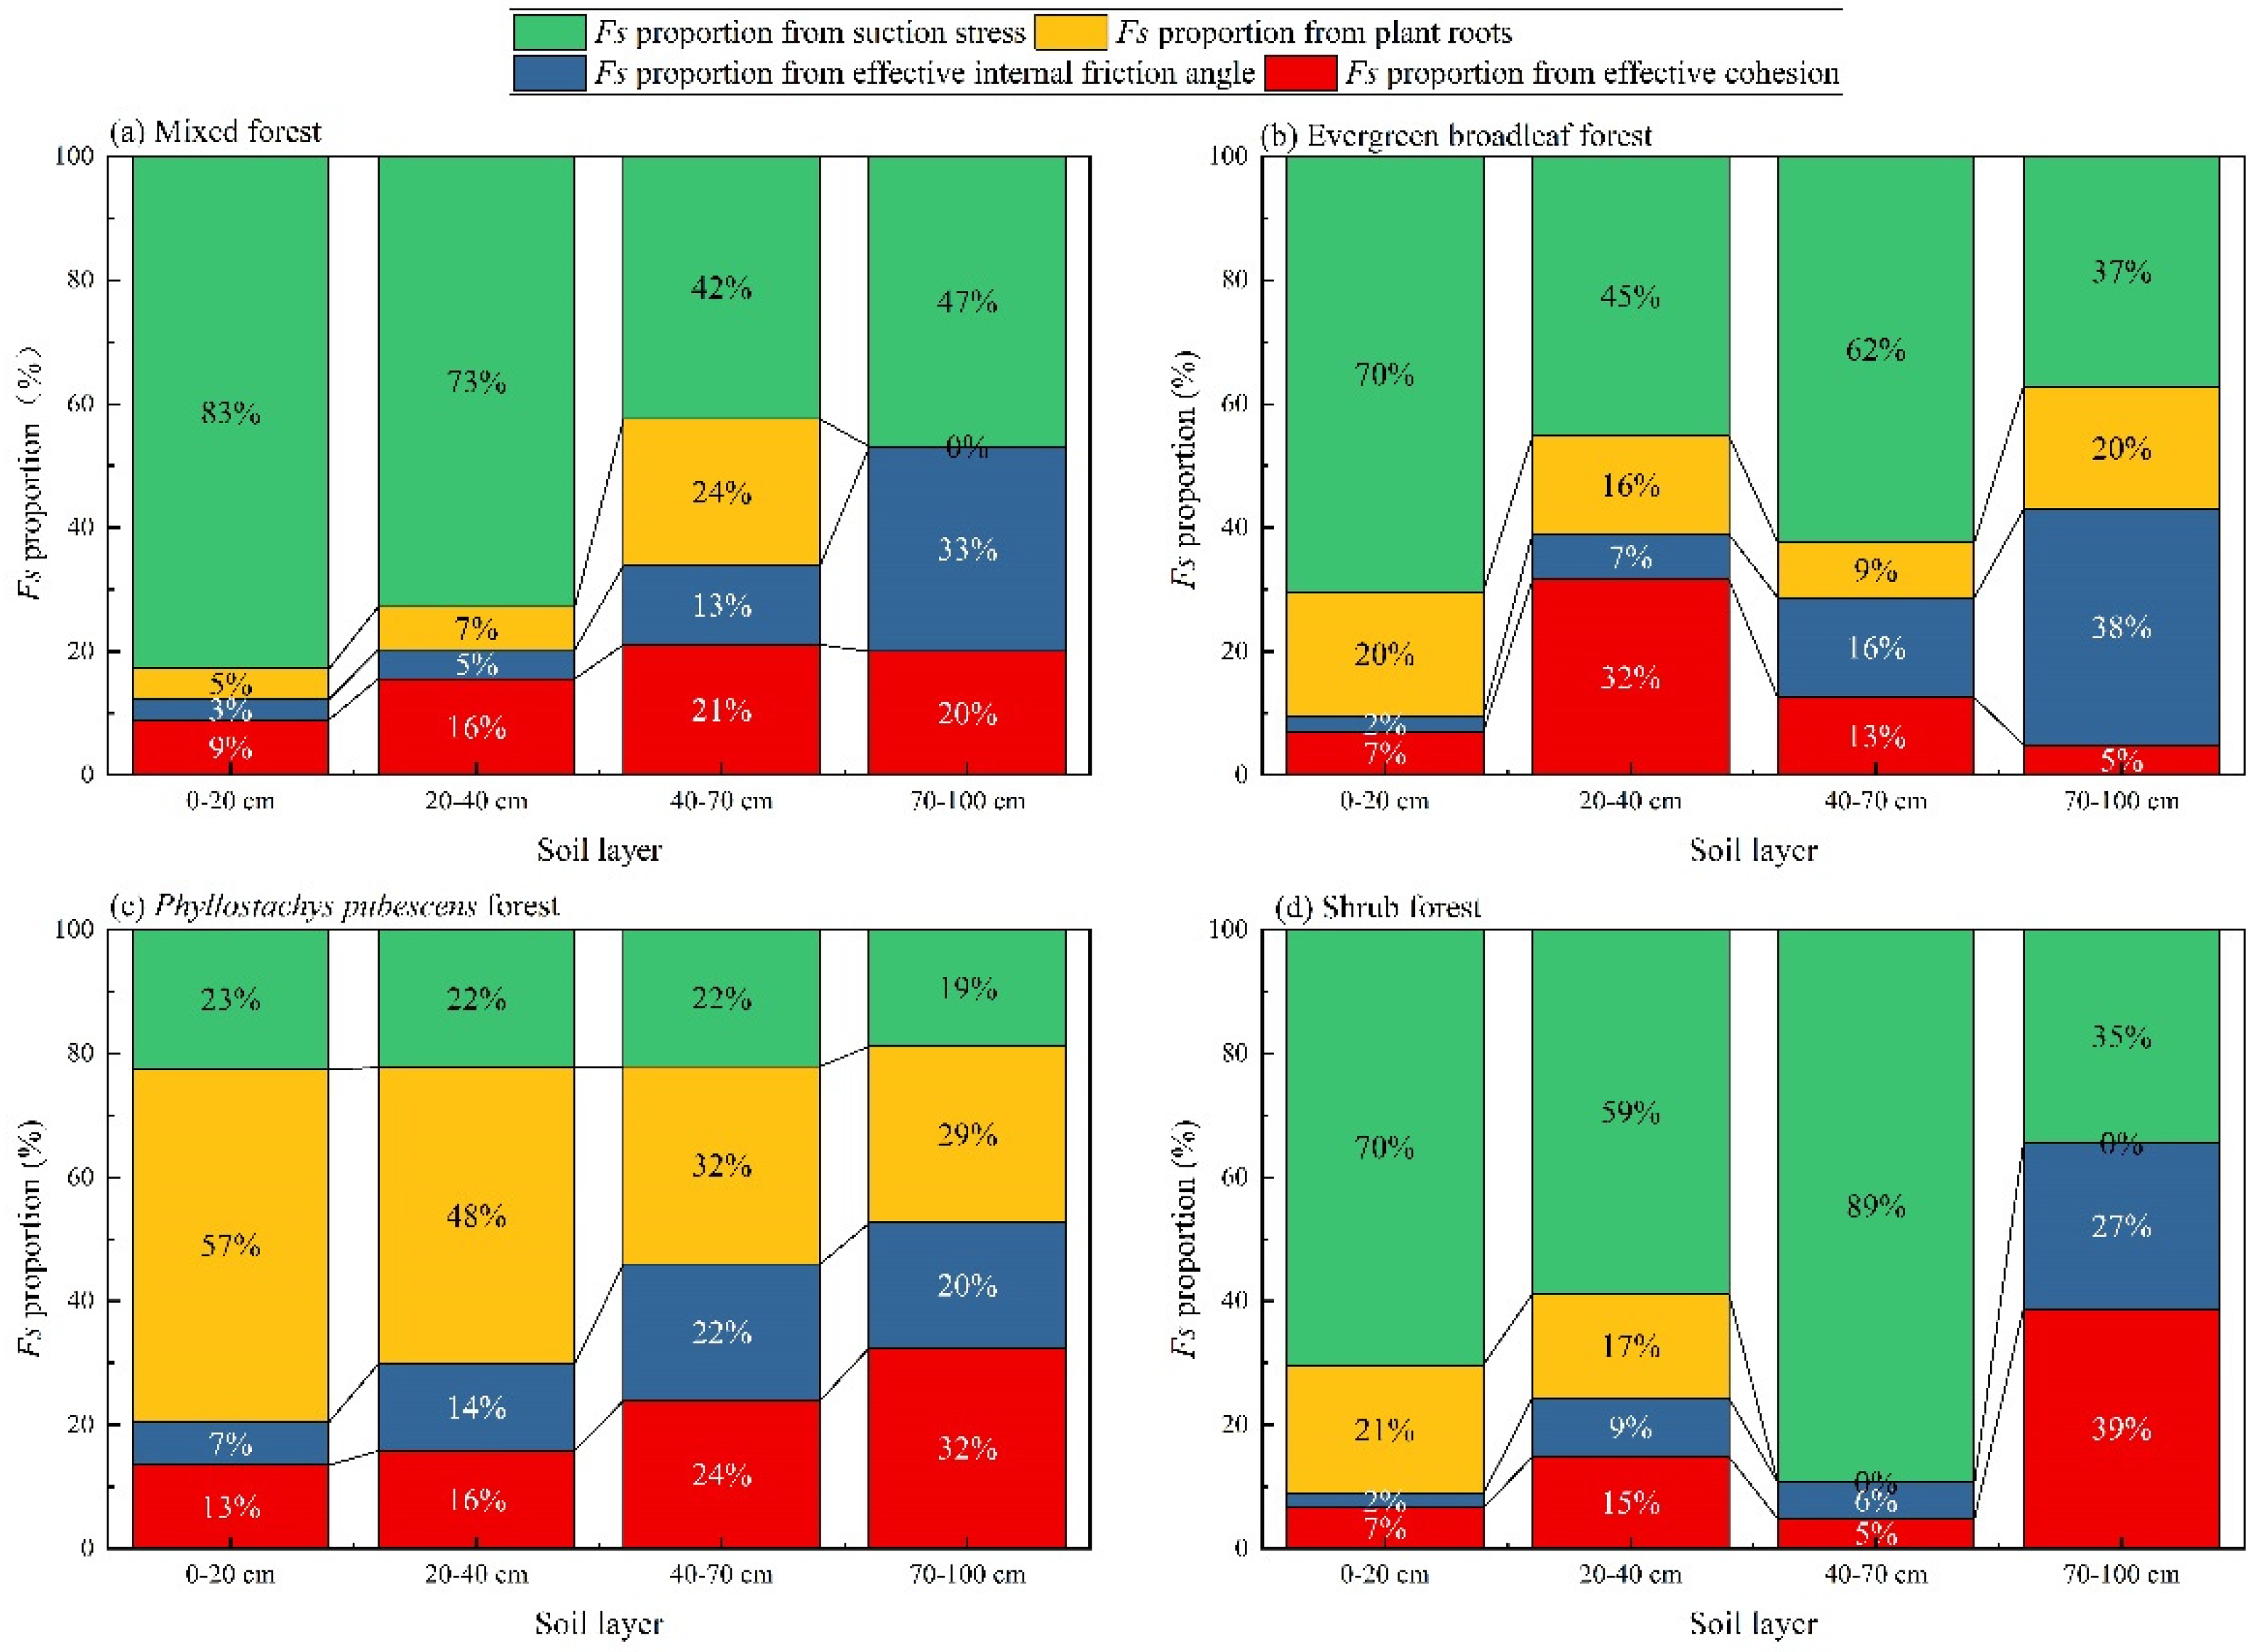
3.3.1. Fs Proportions

Fs proportions of soil effective cohesion, effective friction, additional cohesion and soil suction as calculated with a slope gradient of 45°, are shown in Table 3. The Fs proportions from friction stress in different soil layers had little change, and ranged from 0.26 to 0.60. In the 0–20 cm soil layer of the mixed, evergreen broadleaf and shrub forests, the Fs proportions from effective cohesion ranged from 1.09 to1.52, while in the Phyllostachys pubescens forest it was only 0.86–1.06. In the 20–40 cm soil layer, the Fs proportions from effective cohesion in the mixed and evergreen broadleaf forests were larger than the other two lands, while in the 70–100 cm soil the Fs proportions from effective cohesion in the Phyllostachys pubescens and shrub forests were larger than the other two lands. The Fs proportions from additional cohesion in different soil layers were approximately similar to the distribution of additional cohesion. The roots of the mixed forest were in the 0–70 cm soil layer, and the Fs proportion was between 0.52 and 0.80. In the evergreen broadleaf forest, although plant roots were found in the four soil layers, most of them were in the superficial soil layer. The Fs proportion in the 0–20 cm soil layer was about 3.68–4.18, while the proportions in the underlined soil layer range from 0.21 to 1.06. The roots of the Phyllostachys pubescens forest were distributed throughout the whole soil layer and the Fs proportion ranged from 0.46 to 4.21, which was far larger than that of the mixed and evergreen broadleaf forests. In the shrub forest, the Fs proportion in the 0–20 cm soil layer was 3.44–4.24 owing to majority of roots, while the proportion of the 20–40 cm soil layer was merely 0.76–0.90. The suction stress was closely related to the soil moisture fluctuation and the suction–moisture properties of the soil mass. The Fs proportions from suction stress in the four typical woodlands decreased with the soil depth except for the 40–70 cm soil layer in the Phyllostachys pubescens forest. In the mixed forest, evergreen broadleaf forest and shrub forest, the Fs proportions were significantly greater than that of the Phyllostachys pubescens forest, which may be attributed to higher soil moisture and lower suction stress.
In order to clearly exhibit the importance of soil cohesion, friction, additional cohesion from plant roots, and soil suction on the safety factor, the mean percentage of the four Fs proportions are plotted in Figure 7. Expect for the evergreen broadleaf forest, the Fs proportion from effective cohesion was greater than effective internal friction angle. Owing to the varied root numbers in each soil layer, the range of proportion from additional cohesion differed a lot. The percentage of additional cohesion proportion in the Phyllostachys pubescens forest ranged from 29% to 57%, which was far larger than other proportions (Figure 7c). The variation scope of proportion from suction stress was most obvious among the different proportions. In the mixed forest, evergreen broadleaf forest and shrub forest, the percentages of the suction stress proportion exceeded 35%, even reaching up to 89% (Figure 7a,b,d). This illustrates that the suction stress plays a most important role than other Fs proportions in affecting slope stability in the three forest lands. Overall, the Fs proportion from effective cohesion and effective internal fraction angle increased with the soil depth, while the Fs proportion from plant roots and suction stress decreased with the soil depth. This phenomenon was mainly due to the distribution of fewer roots and larger self-weight stress in deeper soil layers.

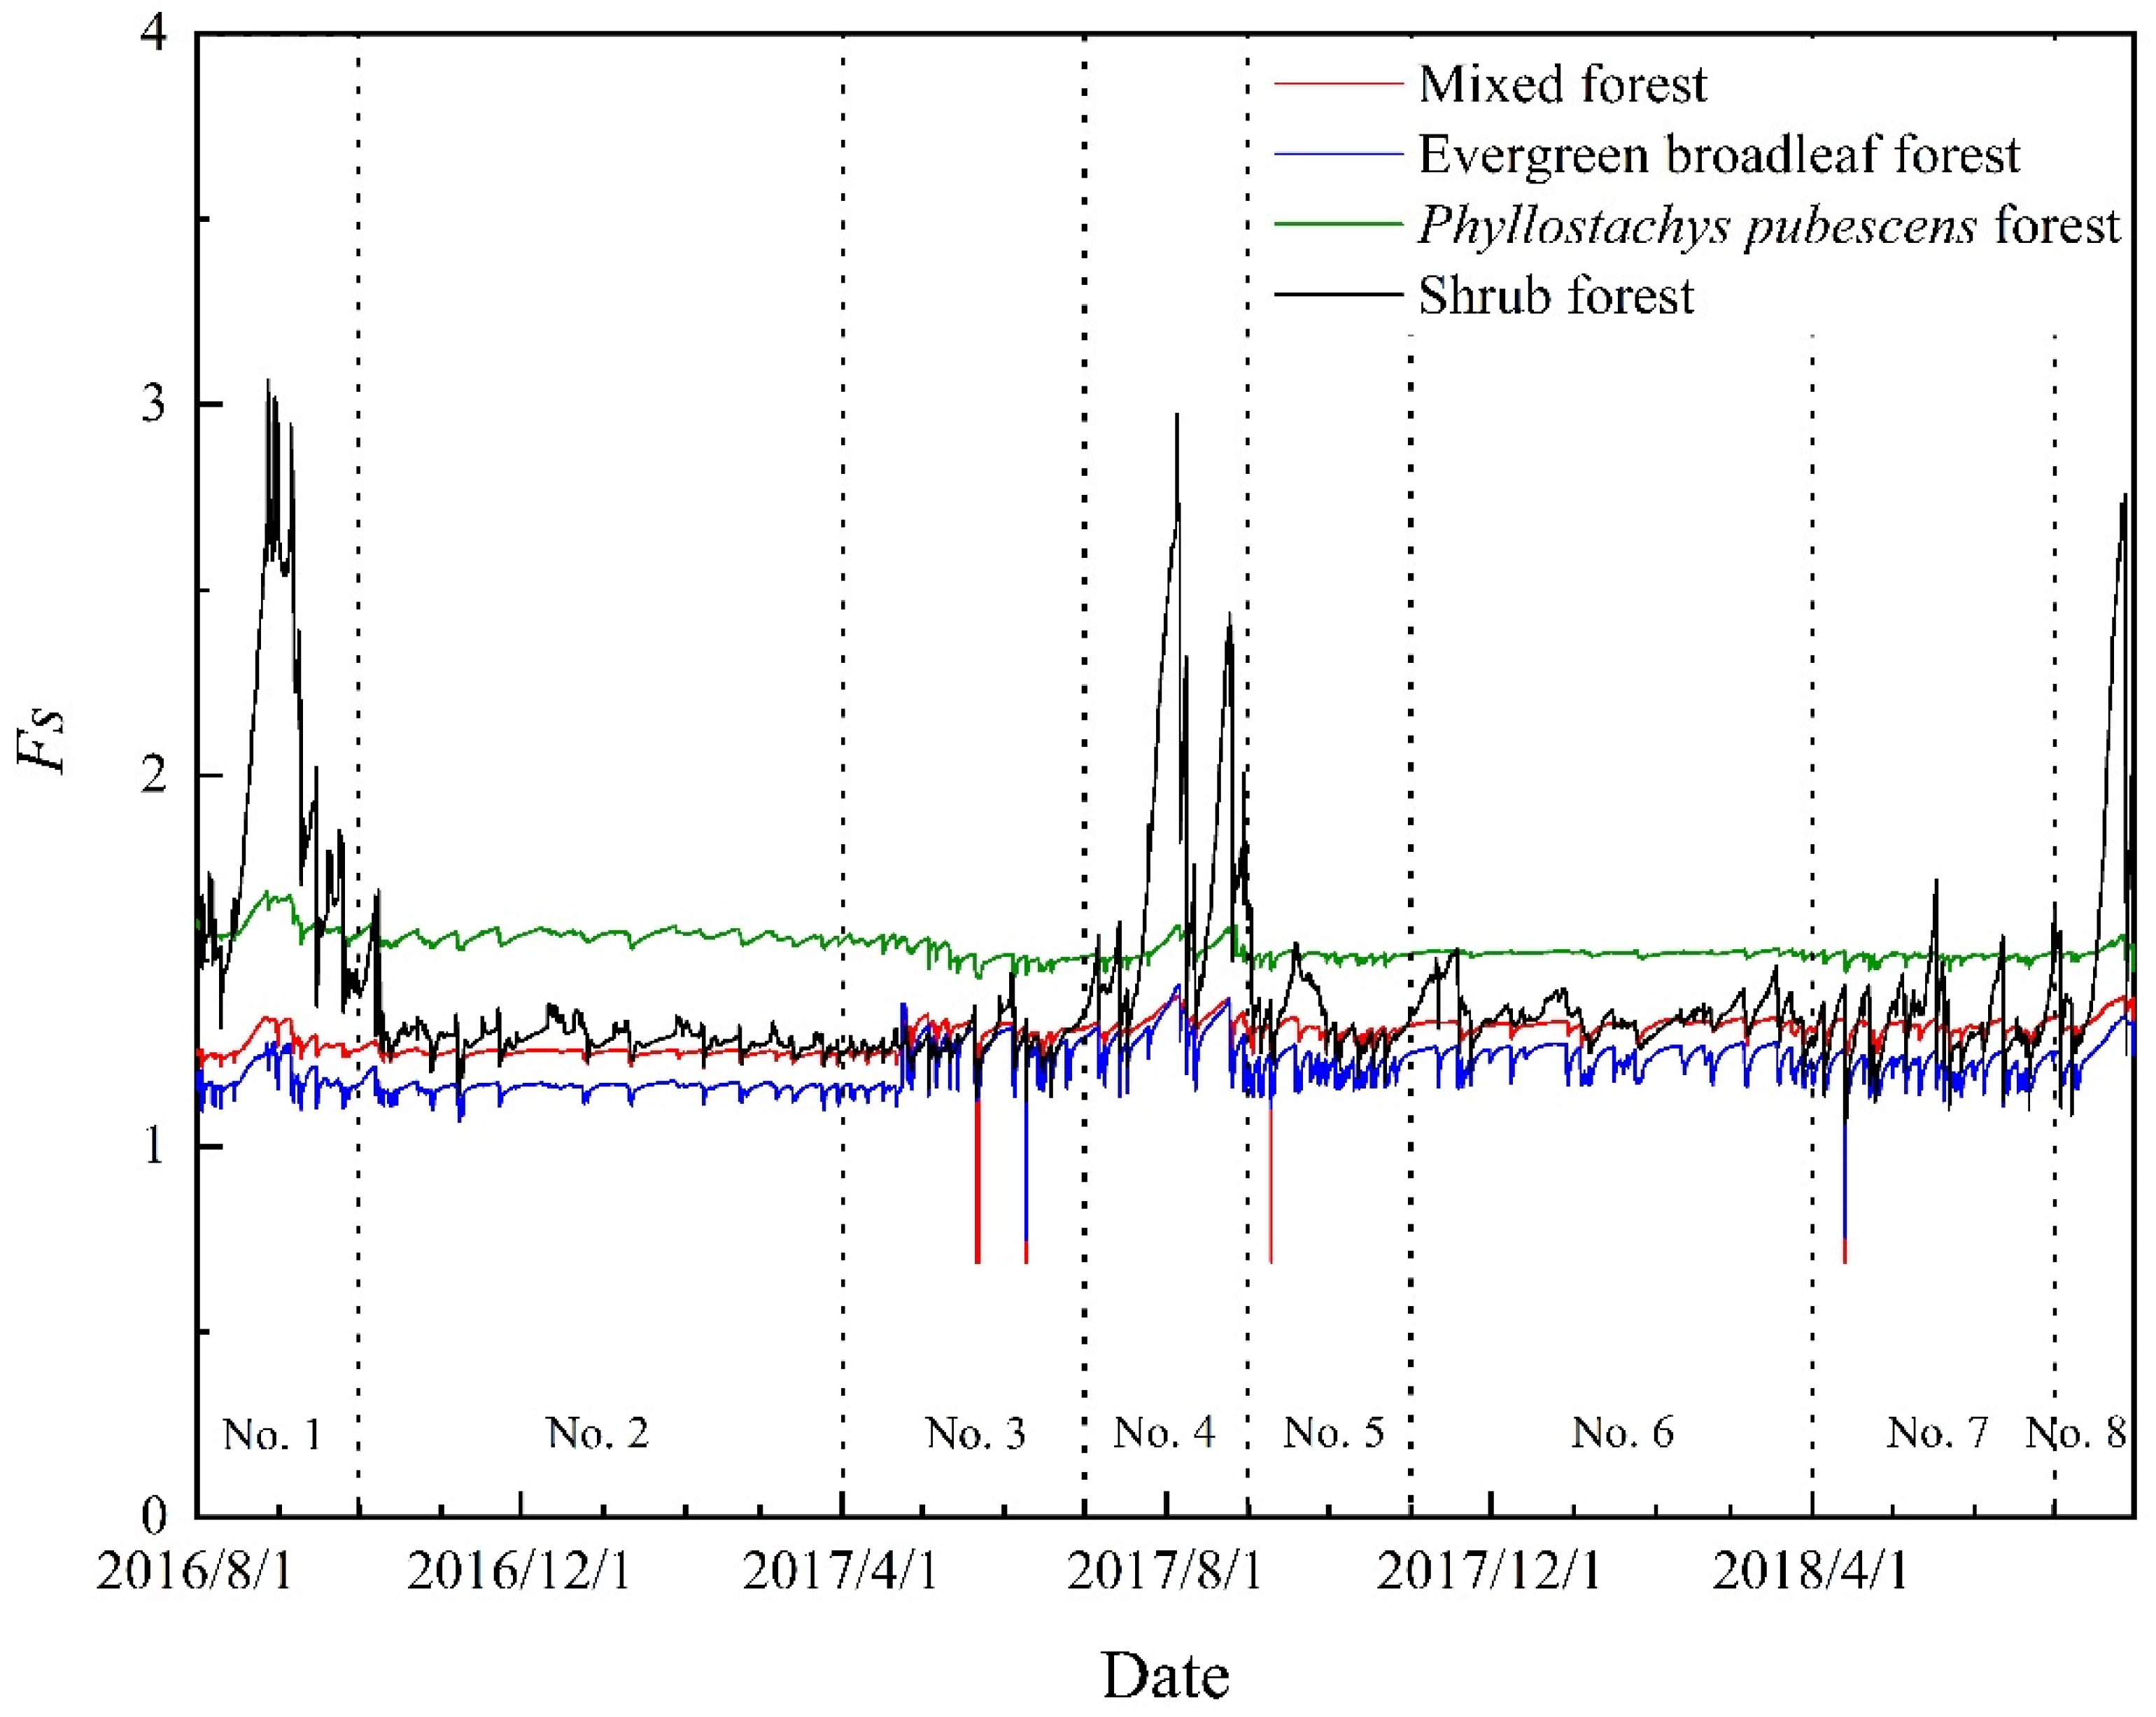
3.3.2. Fs Fluctuation

To reflect the stability of the whole soil mass, Fs fluctuations of the 80 cm soil depth of the four forest lands were analyzed. Figure 8 shows the Fs fluctuations for the period from August 2016 to July 2018. In August and September 2016, rainfall was high and the temperature gradually reached the maximum, resulting in a peak in Fs. Until October, temperature and rainfall gradually decreased, and the Fs fluctuation tended to stabilize. Since the start of the rainy season in April 2017, the temperature increased, and the Fs fluctuation continued to be stable. Hillslopes have a great potential for failure during heavy rainfall or prolonged rainfall. After entering July and August 2017, the temperature reached the maximum, rainfall decreased, and Fs fluctuated greatly, resulting in a peak. In September and October, the temperature dropped, rainfall increased and Fs tended to be stable. During November 2017 to March 2018 rainfalls and temperature gradually decreased and Fs fluctuations continued to stable. As it entered the rainy season again in April 2018, temperature also started to rise, and Fs tended to stable. In July, temperatures rose, resulting in a great fluctuation in Fs and a peak.
In order to better analyze the changes, they were classified into eight phases (Table 4): phases No. 1, 4 and 8 had highest temperatures, phases No. 3, 5 and 7 had abundant rainfall, while phases No. 2 and 6 had few rainfall events and low temperatures (Figure 4). Among the eight phases, No. 1, 4 and 8 exhibit relatively stronger fluctuations than the other phases. The high Fs in the forest coincided with the peak temperature. However, the magnitude and fluctuations of Fs in each forest land were different. In the shrub forest, the Fs peaked in phases No. 1, 4 and 8 at 3.07, 2.98 and 2.76, respectively, which were far higher than the Fs in the other three forest lands. In regard to the Fs fluctuation, the stability of shrub forest showed more intensive fluctuations, followed by the evergreen broadleaf forest, mixed forest and Phyllostachys pubescens forest. As far as the magnitude of Fs in phases No. 2 and 6, the steep slope covered by the Phyllostachys pubescens forest was the most stable, followed by shrub, mixed and evergreen broadleaf forests.
The Fs of the slope land covered by mixed forest was lower than 1.0 on 22 May 2017, owing to precipitation of 12 mm and 85.6 mm on previous days and 28 mm on this day. In addition, the Fs were lower than 1.0 on 9 June and 9 September 2017, and 13 April 2018, with a daily precipitation of 62.8, 70 and 103.4 mm, respectively. In the evergreen broadleaf forest, the Fs were lower than 1.0 on 9 June 2017 and 13 April 2018. This illustrates that slope terrains covered by a mixed forest and broadleaf forest have great potential for failure assuming that the accumulative precipitation exceeds 62.8 mm, or its combination with intensive rainfall.

4. Discussion

It is well-known that canopy interception capability, litter absorption, topography and permeability of the root–soil composite together influence the hillslope hydrology [3,16,53,54]. These processes have a great effect on slope stability in forested areas. In particular, suitable vegetation in steep slope stabilization is of utmost importance for forest management and shallow landslide mitigation, while few documents address this issue. This work quantitatively analyzed the steep slope stability with varied forest types, supported by root measurements, soil moisture monitoring and climatic records.

4.1. Stability Proportion

The influence of vegetation on slope stability can be divide into hydrological effects and mechanical effects. Hydrological effects mainly refer to the interception and redistribution of rainfall [24,25], which affects soil infiltration rate and water uptake by plant roots [17,55]. Plant roots could increase slope stability by enhancing the shear strength of soil [56]. The reinforcement of plant roots can be considered as an additional cohesion [57], which has been addressed by different root reinforcement models, such as the Wu model [49], the fiber bundle model [58], the root bundle model [59] and the energy approach model [60]. In this study, we used the Wu model to estimate additional cohesion from plant roots, due to use of the Wu model by many other studies in the same study area.
In addressing the effect of vegetation on hillslope stability, one major controversy in recent decades has been the proportion of mechanical or hydrologic effects on slope stability. Simon and Collison [9] found that they are equally important in stabilizing slopes while their contribution is rarely addressed. Kim et al. [41] proved that proportions of the difference in Fs between the woody and herbaceous vegetation in Laos, Costa Rica, and France due to differences in suction stress averaged 86, 68, and 50% for Laos, Costa Rica, and France, respectively. This indicates that the suction stress may play a relatively more important role than the mechanical effects. Similarly, we also found that hydrological effects in mixed, evergreen broadleaf and shrub forests (but not the Phyllostachys pubescens forest) exceeded the mechanical effect from plant roots.
In the mixed, evergreen broadleaf and shrub forests, the suction stress proportions were 42–83%, 37–70% and 35–89%, respectively. Apart from the Phyllostachys pubescens forest, the contribution of suction stress exceeded 35%. Therefore, the difference in safety factors may mainly be attributed to the suction stress. No matter how the forest affects the hillslope hydrology process, soil moisture was one of the most significant determinants of slope failure, as it is closely related to the suction stress in unsaturated conditions and is the primary indicator of high pore water pressure generation [2,40,61]. The long-term soil moisture observation in this work reveals that the soil moisture variation rate in the mixed forest and evergreen broadleaf forest was far greater than in the Phyllostachys pubescens forest and shrub forest at a given rainfall amount. This illustrates that the soil moisture resistance ability of the Phyllostachys pubescens forest and shrub forest are stronger than other two forest types, although this work did not further examine the capability of canopy interception and litter absorption, or their effect in altering slope hydrology.
The Fs proportion from plant roots in the Phyllostachys pubescens forest was higher than that in the evergreen broadleaf forest, though they had a similar distribution depth. This may be attributed to widely distributed roots in all soil layers of the Phyllostachys pubescens forest. Similarly, Simon and Collison [9] reported that the increased percentage of Fs from roots of birch (Betula nigra) and sycamore (Platanus occidentalis) were higher than black willow (Salix nigra) and sweetgum (Liquidambar styroflora), and their roots commonly shared a similar distribution depth. Therefore, the additional cohesion force does not merely rely on tensile strength, but on the root distribution.
In the Phyllostachys pubescens forest, the Fs proportion from suction stress was relatively smaller while the Fs proportion from plant root systems was far higher than the other three forests. In detail, the maximum Fs proportions from plant root systems in the other three forests were commonly smaller than 24%, while the proportion in the Phyllostachys pubescens forest ranged from 29 to 57%. Ma’ruf [62] proved that the presence of bamboo roots could promote the peak shear strength of soil. Arnone et al. [40] reported that trees could produce a better effect in slope stabilization owing to greater root area and deeper root distribution than shrubs. Their results and the findings in this work together prove the fact that some plant species with deeper roots and great quantities of root numbers have advantages in slope stabilization.

4.2. The Changing of Hillslope Stability

The hillslope stability fluctuation may relate to the temperature and precipitation conditions [39,63,64,65]. In the phases No.1, 4 and 8, higher temperature and less rainfall may result in lower soil moisture content than other phases. This caused the Fs in the three phases to exhibit stronger fluctuations and have peak values. In contrast, the Fs in the phases No. 2 and 6 were more stable and relatively small. In the phases No. 3, 5 and 7, the Fs of the hillslope in the mixed and evergreen broadleaf forests were temporally lower than 1. Assuming that some events with higher soil moisture such as continuous rainfall and heavy rainfall, the steep slopes covered by mixed and evergreen broadleaf forest may fail at a relatively higher rate than the other two forest types. In comparison, the hillslope in the shrub forest had the most fluctuations. The slopes in the mixed, evergreen broadleaf and Phyllostachys pubescens forests were more stable, while there was a high possibility of slope failure in the mixed evergreen broadleaf forest during long durations of antecedent precipitation and heavy rainfall. Kim et al. [41] documented that the forest with evergreen leaf cover and deep roots have the advantage in stabilizing steep slopes and buffering the destabilizing effects from climate variability. Based on the fluctuation and magnitude of Fs, as well as the soil moisture change rates in a given rainfall amount, we estimate that the Phyllostachys pubescens forest is probably the most suitable species in the study area for slope stabilization.

5. Conclusions

Forest structures have a distinctive capability of altering slope hydrology and complex root systems, which are of utmost importance for hillslope stability. By studying the four slopes lands covered by mixed, broadleaf, Phyllostachys pubescens and shrub forests, their stabilities were assessed focusing on the contribution from soil cohesion, friction stress, suction stress and additional cohesion provided from plant roots. In addition, this work highlights the hillslope stability fluctuations at varied precipitation and temperature conditions, providing a new perspective of forest management in view of hillslope stabilization. The following results can be drawn:
  • Based on the soil moisture changes, the Phyllostachys pubescens forest has the greatest moisture resistance capability, followed by shrub forest, mixed forest and evergreen broadleaf forest.
  • The roots of the Phyllostachys pubescens forest have a higher number and deeper distribution, providing a larger additional cohesion than the other three forest types although the root tensile strength is not stronger among the main plant species in the four slope lands.
  • The Fs fluctuation indicates that some steep slopes covered by mixed forest and evergreen broadleaf forest in the study area may have a higher failure potential, if the slope landslide is affected by prolonged antecedent precipitation and intensive rainfall events. The Phyllostachys pubescens forest may be considered the most suitable type for protecting steep hillslopes in forest management implementation.

Author Contributions

X.W.: Conceptualization, Methodology, Formal analysis, Writing—original draft, Writing—review and editing. Y.W. (Yujie Wang): Resources, Data curation, Writing—review and editing, Supervision, Project administration, Funding acquisition. C.M.: Methodology, Formal analysis, Writing—review and editing. Y.W. (Yunqi Wang): Resources, Data curation, Supervision, Project administration. T.L., Z.D. and Z.Q.: Validation, Methodology, Formal analysis. L.W. and Y.H.: Software, Visualization, English editing. All authors have read and agreed to the published version of the manuscript.

Funding

This research was funded by the National Natural Science Foundation of China (No. 31971726) and Chongqing Bureau of Geology and Minerals Exploration Geology No.107 Team Scientific research project (2023-z105).

Data Availability Statement

Not applicable.

Conflicts of Interest

The authors declare no conflict of interest.

References

  1. Francis, J.R.; Wuddivira, M.N.; Farrick, K.K. Exotic tropical pine forest impacts on rainfall interception: Canopy, understory, and litter. J. Hydrol. 2022, 609, 127765. [Google Scholar] [CrossRef]
  2. Garg, A.; Coo, J.L.; Ng, C.W.W. Field study on influence of root characteristics on soil suction distribution in slopes vegetated with Cynodon dactylon and Schefflera heptaphylla. Earth Surf. Process. Landf. 2015, 40, 1631–1643. [Google Scholar] [CrossRef]
  3. Liu, C.X.; Wang, Y.J.; Ma, C.; Wang, Y.Q.; Zhang, H.L.; Hu, B. Quantifying the effect of non-spatial and spatial forest stand structure on rainfall partitioning in mountain forests, Southern China. For. Chron. 2018, 94, 162–172. [Google Scholar] [CrossRef]
  4. Norris JSStokes, A.; Mickovski, S.B.; Cammeraat, E.; van Beek, R.; Nicoll, B.C.; Achim, A. Slope Stability and Erosion Control: Ecotechnological Solutions; Springer: Doerdrecht, The Netherlands, 2008. [Google Scholar]
  5. Ng, C.W.W.; Ni, J.J.; Leung, A.K.; Zhou, C.; Wang, Z.J. Effects of planting density on tree growth and induced soil suction. Géotechnique 2016, 66, 711–724. [Google Scholar] [CrossRef] [Green Version]
  6. Boldrin, D.; Leung, A.K.; Bengough, A.G. Correlating hydrologic reinforcement of vegetated soil with plant traits during establishment of woody perennial. Plant Soil 2017, 416, 437–451. [Google Scholar] [CrossRef] [Green Version]
  7. Van Stan, J.; Gutman, E.; Friesen, J. Precipitation partitioning by vegetation: A global synthesis. In EGU General Assembly Conference Abstracts EGUGA; Springer Nature: Berlin, Germany, 2020. [Google Scholar]
  8. Lin, M.; Sadeghi, S.; Stan, J. Partitioning of Rainfall and Sprinkler-Irrigation by Crop Canopies: A Global Review and Evaluation of Available Research. Hydrology 2020, 7, 76. [Google Scholar] [CrossRef]
  9. Simon, A.; Collison, A.J.C. Quantifying the mechanical and hydrologic effects of riparian vegetation on streambank stability. Earth Surf. Process. Landf. 2002, 27, 527–546. [Google Scholar] [CrossRef]
  10. Fan, C.C. A displacement-based model for estimating the shear resistance of root-permeated soils. Plant Soil 2012, 355, 103–119. [Google Scholar] [CrossRef]
  11. Bordoni, M.; Meisina, C.; Vercesi, A.; Bischetti, G.B.; Chiaradia, E.A.; Vergani, C.; Chersich, C.; Valentino, R.; Bittelli, M.; Comolli, R.; et al. Quantifying the contribution of grapevine roots to soil mechanical reinforcement in an area susceptible to shallow landslides. Soil Tillage Res. 2016, 163, 195–206. [Google Scholar] [CrossRef]
  12. Fan, C.C.; Chen, Y.W. The effect of root architecture on the shearing resistance of root-permeated soils. Ecol. Eng. 2010, 36, 813–826. [Google Scholar] [CrossRef]
  13. Li, Y.P.; Wang, Y.Q.; Ma, C.; Zhang, H.L.; Wang, Y.J.; Song, S.S.; Zhu, J.Q. Influence of the spatial layout of plant roots on slope stability. Ecol. Eng. 2016, 91, 477–486. [Google Scholar] [CrossRef]
  14. Mcguire, L.A.; Rengers, F.K.; Kean, J.W.; Coe, J.A.; Mirus, B.B.; Baum, R.L.; Godt, J.W. Elucidating the role of vegetation in the initiation of rainfall-induced shallow landslides: Insights from an extreme rainfall event in the Colorado Front Range. Geophys. Res. Lett. 2016, 43, 9084–9092. [Google Scholar] [CrossRef] [Green Version]
  15. Sidle, R.C.; Ziegler, A.D. The canopy interception–landslide initiation conundrum: Insight from a tropical secondary forest in northern Thailand. Hydrol. Earth Syst. Sci. 2017, 21, 651–667. [Google Scholar] [CrossRef] [Green Version]
  16. Wang, X.H.; Wang, Y.Q.; Ma, C.; Wang, Y.J. Effect of root architecture on soil permeability. Sci. Soil Water Conserv. 2018, 16, 73–82. (In Chinese) [Google Scholar]
  17. Ghestem, M.; Sidle, R.C.; Stokes, A. The Influence of Plant Root Systems on Subsurface Flow: Implications for Slope Stability. Bioscience 2011, 61, 869–879. [Google Scholar] [CrossRef]
  18. Damiano, E.; Greco, R.; Guida, A.; Olivares, L.; Picarelli, L. Investigation on rainwater infiltration into layered shallow covers in pyroclastic soils and its effect on slope stability. Eng. Geol. 2017, 220, 208–218. [Google Scholar] [CrossRef]
  19. Alessio, P. Spatial variability of saturated hydraulic conductivity and measurement-based intensity-duration thresholds for slope stability, Santa Ynez Valley, CA. Geomorphology 2019, 342, 103–116. [Google Scholar] [CrossRef]
  20. Gonzalez-Ollauri, A.; Mickoski, S.B. Hydrological effect of vegetation against rainfall-induced landslides. J. Hydrol. 2017, 549, 374–387. [Google Scholar] [CrossRef] [Green Version]
  21. Rodriguez-Iturbe, I.; Porporato, A. Ecohydrology of Water Controlled Ecosystems; Cambridge University Press: New York, NY, USA, 2004. [Google Scholar]
  22. Laio, F. A vertically extended stochastic model of soil moisture in the root zone. Water Resour. Res. 2006, 42, W02406. [Google Scholar] [CrossRef] [Green Version]
  23. Liang, W.L.; Kosugi, K.I.; Mizuyama, T. Soil water dynamics around a tree on a hillslope with or without rainwater supplied by stemflow. Water Resour. Res. 2011, 47, W02541. [Google Scholar] [CrossRef]
  24. Wilkinson, P.L.; Anderson, M.G.; Lloyd, D.M. An integrated hydrological model for rain-induced landslide prediction. Earth Surf. Process. Landf. 2002, 27, 1285–1297. [Google Scholar] [CrossRef]
  25. Keim, R.F.; Skaugest, A.E. Modelling effects of forest canopies on slope stability. Hydrol. Process. 2003, 17, 1457–1467. [Google Scholar] [CrossRef]
  26. Lu, N.; Godt, J.W. Hillslope Hydrology and Stability; Cambridge University Press: New York, NY, USA, 2013. [Google Scholar]
  27. Lu, N.; Likos, W.J. Rate of capillary rise in soil. J. Geotech. Geoenvironmental. Eng. 2004, 130, 646–650. [Google Scholar] [CrossRef]
  28. Dykes, A.P.; Thornes, J.B. Hillslope hydrology in tropical rainforest steeplands in Brunei. Hydrol. Process. 2000, 14, 215–235. [Google Scholar] [CrossRef]
  29. Gurevitch, J.; Scheiner, S.M.; Fox, G.A. The Ecology of Plants; Sinauer Press: Sunderland, MA, USA, 2002. [Google Scholar]
  30. Hubbert, K.R.; Oriol, V. Temporal fluctuations in soil water repellency following wildfire in chaparral steeplands, southern California. Int. J. Wildland Fire 2005, 14, 439–447. [Google Scholar] [CrossRef]
  31. Lin, H.S.; Kogelmann, W.; Walker, C.; Bruns, M.A. Soil moisture patterns in a forested catchment: A hydropedological perspective. Geoderma 2006, 131, 345–368. [Google Scholar] [CrossRef]
  32. Pugnaire, F.; Valladares, F. (Eds.) Functional Plant Ecology; CRC Press: Boca Raton, FL, USA, 2007. [Google Scholar]
  33. Gomi, T.; Sidle, R.C.; Ueno, M.; Miyata, S.; Kosugi, K.I. Characteristics of overland flow generation on steep forested hillslopes of central Japan. J. Hydrol. 2008, 361, 275–290. [Google Scholar] [CrossRef]
  34. Fan, C.C.; Tsai, M.H. Spatial distribution of plant root forces in root-permeated soils subject to shear. Soil Tillage Res. 2016, 156, 1–15. [Google Scholar] [CrossRef]
  35. Sanchez-Castillo, L.; Kubota, T.; Hasnawir Cantu-Silva, I. Influence of root reinforcement of forest species on the slope stability of sierra Madre oriental, Mexico. J. Fac. Agric. Kyushu Univ. 2017, 62, 177–181. [Google Scholar] [CrossRef]
  36. Nespoulous, J.; Merino-Martin, L.; Monnier, Y.; Bouchet, D.C.; Ramel, M.; Dombey, R.; Viennois, G.; Mao, Z.; Zhang, J.L.; Cao, K.F.; et al. Tropical forest structure and understorey determine subsurface flow through biopores formed by plant roots. Catena 2019, 181, 104061. [Google Scholar] [CrossRef]
  37. Wang, X.H.; Ma, C.; Wang, Y.Q.; Wang, Y.Q.; Li, T.; Dai, Z.S.; Li, M.Y. Effect of root architecture on rainfall threshold for slope stability: Variabilities in saturated hydraulic conductivity and strength of root-soil composite. Landslides 2020, 17, 1965–1977. [Google Scholar] [CrossRef]
  38. Sidle, R.C.; Ziegler, A.D.; Negishi, J.N.; Nik, A.R.; Siew, R.; Turkelboom, F. Erosion processes in steep terrain—Truths, myths, and uncertainties related to forest management in Southeast Asia. For. Ecol. Manag. 2006, 224, 199–225. [Google Scholar] [CrossRef]
  39. Pollen-bankhead, N.; Simon, A. Hydrologic and hydraulic effects of riparian root networks on streambank stability: Is mechanical root-reinforcement the whole story? Geomorphology 2010, 116, 353–362. [Google Scholar] [CrossRef]
  40. Arnone, E.; Caracciolo, D.; Noto, L.V.; Preti, F.; Bras, R.L. Modeling the hydrological and mechanical effect of roots on shallow landslides. Water Resour. Res. 2016, 52, 8590–8612. [Google Scholar]
  41. Kim, J.H.; Fourcaud, T.; Jourdan, C.; Maeght, J.; Mao, Z.; Metayer, J.; Meylan, L.; Pierret, A.; Rapidel, B.; Roupsard, O.; et al. Vegetation as a driver of temporal variations in slope stability: The impact of hydrological processes. Geophys. Res. Lett. 2017, 44, 4897–4907. [Google Scholar] [CrossRef]
  42. FAO; ISSS; ISRIC. World Reference Base for Soil Resources; FAO: Rome, Italy, 1998. [Google Scholar]
  43. Soil Survey Staff. Keys to Soil Taxonomy, 6th ed.; US Department of Agriculture, Soil Conservation Service: Lincoln, NE, USA, 1994; pp. 161–186. [Google Scholar]
  44. Lu, N.; Godt, J.W. Infinite-slope stability under steady unsaturated conditions. Water Resour. Res. 2008, 44, 1–13. [Google Scholar] [CrossRef]
  45. Lu, N.; Likos, W.J. Unsaturated Soil Mechanics; Wiley: Hoboken, NJ, USA, 2004. [Google Scholar]
  46. China National Standards CNS-GB/T50123-1999; Standard for Soil Test Method. Standardization Administration of China (SAC), Ministry of Construction, Ministry of Water Resources. China Planning Press: Beijing, China, 1999. (In Chinese)
  47. Batse, S.D.; Poesen, J.; Reubens, B.; Wemans, K.; De Baerdemaeker, J.; Muys, B. Root tensile strength and root distribution of typical Mediterranean plant species and their contribution to soil shear strength. Plant Soil 2008, 305, 207–226. [Google Scholar] [CrossRef]
  48. Preti, F.; Giadrossich, F. Root reinforcement and slope bioengineering stabilization by Spanish Broom (Spartium junceum L.). Hydrol. Earth Syst. Sci. Discuss. 2009, 13, 1713–1726. [Google Scholar] [CrossRef] [Green Version]
  49. Wu, T.H.; McKinnell, W.P.; Swanston, D.N. Strength of tree roots and landslides on Prince of Wales Island, Alaska. Can. Geotech. J. 1979, l, 19–33. [Google Scholar] [CrossRef]
  50. Fan, C.C.; Su, C.F. Role of roots in the shear strength of root-reinforced soils with high moisture content. Ecol. Eng. 2008, 33, 157–166. [Google Scholar] [CrossRef]
  51. Zhu, J.Q.; Wang, Y.Q.; Wang, Y.J.; Zhang, H.L.; Li, Y.P.; Liu, Y. Analysis of root system enhancing shear strength based on experiment and model. Rock Soil Mech. 2014, 35, 449–458. (In Chinese) [Google Scholar]
  52. Cheng, Y. Mechanism of Water Resources Conservation and Recharge of Forest and Its Ecological FUNCTION value Evaluation in Jinyun Mountain; Beijing Forestry University: Beijing, China, 2007. (In Chinese) [Google Scholar]
  53. Pérez-Suárez, M.; Arredondo-Moreno, J.T.; Huber-Sannwald, E.; Serna-Pérez, A. Forest structure, species traits and rain characteristics influences on horizontal and vertical rainfall partitioning in a semiarid pine-oak forest from central Mexico. Ecohydrology 2014, 7, 532–543. [Google Scholar] [CrossRef]
  54. Masi, E.B.; Segoni, S.; Tofani, V. Root Reinforcement in Slope Stability Models: A Review. Geosciences 2021, 11, 212. [Google Scholar] [CrossRef]
  55. Collison, A.J.C.; Anderson, M.G. Using a combined slope hydrology/stability model to identify suitable conditions for landslide prevention by vegetation in the humid tropics. Earth Surf. Process. Landf. 1996, 21, 737–747. [Google Scholar] [CrossRef]
  56. Schmid, I.; Kazda, M. Vertical distribution and radial growth of coarse roots in pure and mixed stands of Fagus sylvatica and Picea abies. Can. J. For. Res. 2001, 31, 539–548. [Google Scholar] [CrossRef]
  57. Waldron, L.J.; Dakessian, S. Soil reinforcement by roots: Calculation of increased soil shear resistance from root properties. Soil Sci. 1981, 132, 427–435. [Google Scholar] [CrossRef]
  58. Pollen, N.; Simon, A. Estimating the mechanical effects of riparian vegetation on stream bank stability using a fiber bundle model. Water Resour. Res. 2005, 41, 233–245. [Google Scholar] [CrossRef]
  59. Schwarz, M.; Lehmann, P.; Or, D. Quantifying lateral root reinforcement in steep slopes–from a bundle of roots to tree stands. Earth Surf. Process. Landf. 2010, 35, 354–367. [Google Scholar] [CrossRef]
  60. Ekanayake, J.C.; Phillips, C.J. A method for stability analysis of vegetated hillslopes: An energy approach. Can. Geotech. J. 1999, 36, 1172–1184. [Google Scholar] [CrossRef]
  61. Cogan, J.; Gratchev, I.; Wang, G. Rainfall-induced shallow landslides caused by ex-Tropical Cyclone Debbie, 31st March 2017. Landslides 2018, 15, 1215–1221. [Google Scholar] [CrossRef]
  62. Ma’ruf, M.F. Shear strength of Apus bamboo root reinforced soil. Ecol. Eng. 2012, 41, 84–86. [Google Scholar] [CrossRef]
  63. Bittellia, M.; Valentino, R.; Salvatorelli, F.; Pisa, P.R. Monitoring soil-water and displacement conditions leading to landslide occurrence in partially saturated clays. Geomorphology 2012, 173–174, 161–173. [Google Scholar] [CrossRef]
  64. Damiano, E.; Olivares, L.; Picarelli, L. Steep-slope monitoring in unsaturated pyroclastic soils. Eng. Geol. 2012, 137–138, 1–12. [Google Scholar] [CrossRef]
  65. Harris, S.J.; Orense, R.P.; Itoh, K. Back analyses of rainfall-induced slope failure in Northland Allochthon formation. Landslides 2012, 9, 349–356. [Google Scholar] [CrossRef]
Figure 1. Location of the study area.
Forests 14 00507 g001
Figure 2. Map showing the one of the soil profile in field condition and the measurement apparatus.
Forests 14 00507 g002
Figure 3. Rainfall and temperature from August 2016 to July 2018.
Forests 14 00507 g003
Figure 4. Changes of soil moisture (volumetric moisture) at different soil depths in (a) mixed forest, (b) evergreen broadleaf forest, (c) Phyllostachys pubescens forest and (d) shrub forest.
Forests 14 00507 g004
Figure 5. Soil moisture (volumetric moisture) variation rate with rainfall amount in different forestlands.
Forests 14 00507 g005
Figure 6. Tensile strength of roots as a function of root diameter in different forestlands.
Forests 14 00507 g006
Figure 7. Contribution percentage of each influencing factor to hillslope safety factors at different soil depths in (a) mixed forest, (b) evergreen broadleaf forest, (c) Phyllostachys pubescens forest and (d) shrub forest.
Forests 14 00507 g007
Figure 8. Dynamic changes of hillslope safety factors in different forest lands from August 2016 to July 2018. No. 1–8 is the number of Fs variation in different phases.
Forests 14 00507 g008
Table 1. Physical properties of soil in different forest lands.
Physical PropertySoil LayerMixed ForestEvergreen Broadleaf ForestPhyllostachys pubescens ForestShrub Forest
Porosity (%)0–20 cm63.96 ± 5.8955.92 ± 4.1458.52 ± 3.3173.33 ± 4.58
20–40 cm50.42 ± 5.4044.6 ± 4.8447.11 ± 2.7557.85 ± 3.23
40–70 cm49.43 ± 4.6138.23 ± 4.3745.4 ± 3.8345.29 ± 2.58
70–100 cm38.14 ± 4.2242.44 ± 4.0043.91 ± 3.6142.35 ± 3.00
Unit wight (g/cm3)0–20 cm0.98 ± 0.071.03 ± 0.061.21 ± 0.040.75 ± 0.05
20–40cm1.18 ± 0.071.16 ± 0.051.35 ± 0.060.91 ± 0.11
40–70 cm1.12 ± 0.041.26 ± 0.071.29 ± 0.091.19 ± 0.07
70–100 cm1.58 ± 0.061.54 ± 0.081.57 ± 0.051.42 ± 0.05
Effective cohesion (kPa)0–20 cm14.74 ± 1.2016.54 ± 1.3213.97 ± 1.1811.35 ± 1.20
20–40 cm33.31 ± 1.8845.65 ± 1.3419.73 ± 1.3016.56 ± 1.76
40–70 cm30.26 ± 1.3018.31 ± 1.3428.14 ± 1.0921.72 ± 1.99
70–100 cm23.21 ± 1.215.18 ± 0.9945.15 ± 1.2945.61 ± 0.64
Effective internal friction angle (°)0–20 cm24.80 ± 0.6025.50 ± 1.2826.75 ± 1.7522.39 ± 1.06
20–40 cm19.49 ± 0.6420.77 ± 0.5928.29 ± 1.9425.49 ± 1.03
40–70 cm21.38 ± 0.7824.12 ± 1.0925.36 ± 2.4228.62 ± 0.23
70–100 cm23.44 ± 0.4624.78 ± 1.6117.23 ± 2.7720.77 ± 0.92
Soil water characteristic curves0–20 cmy = 22.37x−0.20y = 18.1x−0.22y = 9.772x−0.28y = 20.47x−0.12
20–40 cmy = 23.72x−0.23y = 17.26x−0.23y = 8.122x−0.33y = 18.45x−0.13
40–70 cmy = 18.02x−0.19y = 16.38x−0.20y = 5.995x−0.40y = 24.18x−0.16
70–100 cmy = 5.732x−0.44y = 6.942x−0.38y = 7.207x−0.40y = 17.01x−0.10
Note: y is the soil moisture; x is the matric suction.
Table 2. Tensile strength and additional cohesion distribution of root systems.
Soil LayerMixed ForestEvergreen Broadleaf ForestPhyllostachys pubescens ForestShrub Forest
RAR
(%)
Cr
(kPa)
RAR
(%)
Cr
(kPa)
RAR
(%)
Cr
(kPa)
RAR
(%)
Cr
(kPa)
0–20 cm0.04 ± 0.018.22 ± 1.010.21 ± 0.0247.65 ± 2.550.45 ± 0.0459.46 ± 1.690.19 ± 0.0236.18 ± 3.13
20–40 cm0.10 ± 0.0214.67 ± 2.820.08 ± 0.0123.06 ± 2.500.48 ± 0.0456.97 ± 3.700.04 ± 0.0118.93 ± 1.52
40–70 cm0.22 ± 0.0434.15 ± 4.020.07 ± 0.0212.88 ± 2.850.30 ± 0.0537.00 ± 2.79--
70–100 cm--0.10 ± 0.0121.60 ± 2.650.34 ± 0.0339.59 ± 3.08--
Table 3. Contribution of each influencing factor to hillslope safety factor.
Forest TypesSoil LayerSafety Factor Contribution by Effective Internal Friction AngleSafety Factor Contribution by Effective CohesionSafety Factor Contribution by Plant RootsSafety Factor Contribution by Suction StressFs
Mixed forest0–20 cm0.44–0.471.09–1.330.52–0.760–35.042.05–37.60
20–40 cm0.34–0.371.09–1.230.39–0.630–12.842.06–14.82
40–70 cm0.37–0.410.60–0.660.60–0.800–3.881.57–5.76
70–100 cm0.42–0.440.24–0.280.000–0.700.66–1.42
Evergreen broadleaf forest0–20 cm0.45–0.511.25–1.523.68–4.180–32.615.10–38.82
20–40 cm0.36–0.391.63–1.750.70–1.060–5.622.69–8.82
40–70 cm0.42–0.470.32–0.370.17–0.290–4.790.91–5.92
70–100 cm0.42–0.500.07–0.070.21–0.280–0.660.67–1.51
Phyllostachys pubescens forest0–20 cm0.46–0.550.86–1.063.95–4.210.94-3.486.21–9.31
20–40 cm0.50–0.600.56–0.651.60–1.870.77–1.053.42–4.15
40–70 cm0.41–0.540.49–0.540.61–0.740.42–0.551.94–2.37
70–100 cm0.26–0.380.48–0.520.39–0.460.23–0.411.41–1.78
Shrub forest0–20 cm0.38–0.441.03–1.323.44–4.241.23–139.436.08–145.42
20–40 cm0.45–0.490.63–0.810.76–0.900.64–10.462.53–12.62
40–70 cm0.54–0.550.39–0.490.002.69–22.043.66–23.04
70–100 cm0.36–0.400.54–0.560.000.15–2.111.10–3.07
Table 4. The date and Fs description of phase.
PhaseDateFs
12016.8.1–2016.9.30Stronger fluctuation and a peak were observed
22016.10.1–2017.3.31Stable
32017.4.1–2017.6.30Had potential for failure
42017.7.1–2017.8.31Stronger fluctuation and a peak were observed
52017.9.1–2017.10.30Had potential for failure
62017.11.1–2018.3.31Stable
72018.4.1–2018.6.30Had potential for failure
82018.7.1–2018.7.31Stronger fluctuation and a peak were observed
Disclaimer/Publisher’s Note: The statements, opinions and data contained in all publications are solely those of the individual author(s) and contributor(s) and not of MDPI and/or the editor(s). MDPI and/or the editor(s) disclaim responsibility for any injury to people or property resulting from any ideas, methods, instructions or products referred to in the content.

