Article

Genetic Diversity and Population Structure Analysis in the Chinese Endemic Species Michelia crassipes Based on SSR Markers

1
College of Forestry, Central South University of Forestry & Technology, Changsha 410004, China
2
Research Institute of Subtropical Forestry, Chinese Academy of Forestry, Hangzhou 311400, China
3
National Forestry and Grassland Engineering Technology Research Center of Exotic Pine Cultivation, Hangzhou 311400, China
*
Author to whom correspondence should be addressed.
Forests 2023, 14(3), 508; https://doi.org/10.3390/f14030508
Submission received: 16 January 2023 / Revised: 26 February 2023 / Accepted: 1 March 2023 / Published: 4 March 2023
(This article belongs to the Special Issue Genetic Diversity and Conservation of Forest Species)

Abstract

:
Michelia crassipes Y. W. Law (Magnoliaceae) is endemic to China and is the only species with purple flowers in the genus Michelia. It is commonly used as an important parent for flower color improvement and hybrid breeding. M. crassipes is recognized as an endangered plant. An urgent need exists to explore the genetic diversity of M. crassipes to efficiently select hybrid parents and develop efficient conservation strategies. In this study, a total of 128 samples were selected from seven natural populations of M. crassipes to explore their genetic diversity and structure. A total of 14 microsatellite (SSR) markers with high polymorphism and repeatability were developed, and 218 alleles were detected. This study mainly revealed three results: (1) The parameters of expected heterozygosity (He = 0.536) and mean Shannon’s information index (I = 1.121) revealed moderately high levels of genetic diversity for the M. crassipes natural population; (2) The genetic differentiation coefficient (Fst = 0.108) showed that there was a low level of genetic differentiation, and AMOVA indicated that genetic variation existed mainly within populations and that there was frequent gene exchange between populations; and (3) The population genetic structure analysis showed that seven natural populations originated from two ancestral groups, and the Mantel test revealed that genetic and geographical distances between populations were significantly correlated. Our study is the first to explore the genetic diversity and structure of the M. crassipes natural population, which provides an important reference for the collection, conservation and utilization of Michelia crassipes germplasm resources.

1. Introduction

Michelia crassipes Y. W. Law is an evergreen shrub or small tree of the genus Michelia that has a height of 2–5 m. Endemic to China, M. crassipes is sporadically distributed in southern Hunan, northern Guangdong, northeastern Guangxi and Jiangxi provinces, where it grows in deep forests and valleys at altitudes of 300–1000 m [1]. M. crassipes is propagated by seeds [2]. However, due to the lack of effective pollinators and the requirement of certain conditions and time restraints before stamens and gynoecia can mature, the natural fecundity of M. crassipes is low, and its seeds are too weak for natural reproduction [3]. Wild populations of M. crassipes are scarce [4]. In the “China Biodiversity Red List” “https://www.iplant.cn/rep/protlist/4? (accessed on 1 October 2022)”, M. crassipes is recognized as “endangered” and needs urgent protection. The flower color of the species of the genus Michelia is mostly white or pale yellow, while the tepals of M. crassipes are purple-red or dark purple, making it a beautiful flower for flower color breeding (Figure 1). In recent years, the discovery and utilization of M. crassipes has gradually gained attention, and new Michelia cultivars such as ‘Mo Zi’, ‘Duan Zi’, ‘Yuan Zi’, ‘Meng Yuan’, ‘Meng Zi’ and ‘Meng Xing’ have been bred with M. crassipes as parents [5,6,7,8,9], showing the potential for the discovery and utilization of its excellent germplasm resources. Previous research on M. crassipes has mainly focused on its geographical distribution, biological characteristics, asexual reproduction techniques, hybrid breeding, pollination biology and flower color formation mechanism [3,10,11,12,13,14,15]. Xu, et al. [16] analyzed the affinities between M. crassipes and other species of the genus Michelia by using highly polymorphic SSR primers. However, there have been no studies on the genetic diversity and population structure of the natural M. crassipes population.
Genetic diversity is the most fundamental, central and important dimension for ecosystem diversity, species diversity and biodiversity [17]. Meanwhile, genetic diversity is necessary for species to adapt to environmental changes and to resist pests and diseases [18]. The level of genetic diversity determines the long-term viability and evolutionary potential of a species. Generally, it is believed that the genetic diversity of endangered plants is lower than that of ordinary species due to the small number of remaining plants, genetic drift caused by inbreeding or self-inbreeding, and the increase in homozygotes [19]. Exploring the genetic diversity level of a species would help develop efficient conservation and breeding strategies [20,21]. Assessing the genetic diversity level of M. crassipes germplasm is urgent so that germplasm collection strategies can be developed and suitable hybrid parents can be selected to accelerate the cultivation of new cultivars.
Microsatellites (simple sequence repeats, SSRs) are still one of the most effective molecular markers to reveal the level of genetic diversity and structure of plants due to their codominant inheritance, high polymorphism, high stability, repeatability and low cost of detection [22,23,24]. Therefore, in this study, we aimed to analyze the genetic diversity and population genetic structure of 128 M. crassipes specimens from seven natural populations using SSR molecular markers. Our study will provide an important reference for the collection and conservation of M. crassipes germplasm resources and breeding new elite cultivars.

2. Materials and Methods

2.1. Plant Material

A total of 128 specimens from seven natural populations of M. crassipes were selected as research samples. The seven natural populations are located in Jiangxi, Guangdong, Guangxi and Hunan Provinces in China (Figure 2). The distance between sampled single plants within the population was more than 5 times the height of the tree [25,26,27]. Fresh and healthy leaves were collected from each specimen and immediately dried in silica gel for subsequent DNA extraction.

2.2. DNA Extraction

Total DNA from each specimen was extracted from dried leaves using the Hi-DNAsecure Plant Kit (DP350, TianGen Biotech Co., Ltd., Beijing, China) according to the manufacturer’s instructions. The quality and concentration of the total DNA were evaluated using a NanoDropTM 2000 UV spectrophotometer (Thermo Fisher Scientific, Wilmington, NC, USA) and 1% agarose gel electrophoresis. The high concentration of DNA was diluted to 20 ng/μL before subsequent PCR amplification.

2.3. Primer Screening and PCR Amplification

The flowers and leaves of M. crassipes were collected and sent to Wuhan MetWare Biotechnology Co., Ltd. for transcriptome sequencing. A total of 82.77 Gb clean data were obtained, and 90,980 unigenes were obtained after sequence assembly. A total of 44,024 SSR markers were obtained based on the structural analysis of SSR genes in the unigene library at MISA [28], and using that information, primers were designed by selecting dinucleotide repeat SSRs and trinucleotide repeat SSRs. Primer3 software [29] was used for the designs with the following parameters: primer length 18–22 bp, product size 150–300 bp, annealing temperature 57–62 °C, and optimal annealing temperature 60 °C. The suitable 71 primer pairs were selected from the designed primers and synthesized by Zhejiang Shangya Biotechnology Co., Ltd. (Hangzhou, China). A total of 27 primer pairs could amplify clear bands using two random samples of DNA as templates. We further screened the primers based on 32 samples. Finally, a total of 14 primer combinations were selected for subsequent study considering the high polymorphism and repeatability (Table 1). The PCR system was as follows: total volume of 25 μL, including 12.5 μL Mix (Vazyme 2×Taq Plus Master Mix, P211), 1 μL each of forward and reverse primers, 20 ng of template DNA, and finally sterile deionized water was supplemented to 25 μL. The SSR-PCR amplification was performed on the BIO-REDMYCYLE PCR (TaKaRa, Beijing, China) as follows: predenaturation at 94 °C for 5 min; next, 2 cycles of 30 s denaturation at 94 °C, 30 s annealing at 63 °C and 1 min extension at 72 °C; after that, 26 cycles of 30 s denaturation at 94 °C, 30 s annealing at 62 °C and 1 min extension at 72 °C, with the annealing temperature decreased by 0.5 °C for each cycle; then, 30 s denaturation at 94 °C, 30 s annealing at 49 °C and 1 min extension at 72 °C; and finally, 7 min extension at 72 °C.

2.4. Analysis of Genetic Diversity and Population Genetic Structure

The PCR products were detected by capillary electrophoresis, the bands were interpreted by Bioptic Qsep 100 (Bioptic, Inc., Taiwan, China) and the results were displayed as fluorescent signals. The genetic diversity parameters of each population of M. crassipes were calculated by GenAlEx 6.502 [30]. The null allele frequency (Fn) and deviation from Hardy–Weinberg equilibrium (HWE) were computed by Cervus 3.0.7 [31]. Principal coordinate analysis (PCoA), analysis of molecular variance (AMOVA) and the Mantel test were performed by GenAlEx 6.502. The genetic diversity indices of each locus were calculated using POPGENE Version 1.32 software [32]. The software Structure 2.3.4 was used to estimate the genetic structure of the M. crassipes populations based on Bayesian analysis [33]. K values were set from one to seven with 20 independent runs for each K value. The software was run with a burn-in period of 100,000 and 100,000 MCMC reps after burn-in. The K value with the largest DeltaK was deemed to be the optimal K value [34], and the running results were uploaded to the “Structure Harvester” website “http://taylor0.biology.ucla.edu/structureHarvester/# (accessed on 15 October 2022)” to analyze the optimal K value [35]. The results of 20 replicates of the optimal K values were sampled and integrated using CLUMPP 1.1.2 [36]. The genetic structure plot was visualized by DISTRUCT 1.1 [37]. The phylogenetic tree of seven populations and 128 specimens was constructed by neighbor-joining methods (NJ) and unweighted pair group method with arithmetic mean (UPGMA), respectively, based on Nei’s genetic distance using MEGA 11 software [38].

3. Results and Analysis

3.1. Genetic Diversity of M. crassipes Populations

A total of 218 alleles were detected by 14 pairs of SSR primers, with an average of 15.571 alleles per primer pair. Each primer pair amplified between 7 and 31 alleles; the M27 had the highest number of alleles (31). The highest effective allele (Ne) was 6.601 for primer M25, the lowest was 1.457 for primer M19, and the mean effective allele (Ne) was 2.865. The mean percentage of polymorphic bands (PPB) was 91.14%, with 100.00% PPB for primers M30, M32 and N8, and primer N13 had the lowest PPB. The lowest percentage of polymorphic bands (PPB) was 70.00% for primer N13. The polymorphic information content (PIC) of each primer varied between 0.242 and 0.879, with a mean value of 0.610. The PIC of N10 was equal to 0.242, which was a low polymorphic locus; the PIC values of M19, N2 and M31 were less than 0.5, which were moderate polymorphic loci; and the PIC values of the remaining loci were greater than 0.5, which were high polymorphic loci [39]. The mean value of Shannon’s index (I) for all specimens was 1.121, with a maximum value of 2.016 and a minimum value of 0.519. The maximum and minimum values of observed heterozygosity (Ho) were 0.821 and 0.199, respectively. The average observed heterozygosity was 0.445. The maximum and minimum values of expected heterozygosity (He) were 0.831 and 0.236, respectively. The average expected heterozygosity was 0.536, which was greater than the average observed heterozygosity and showed heterozygosity deficiency. The Nm ranged from 0.408 to 6.115, with a mean value of 1.897 (Table 2).
The mean observed alleles (Na) and Ne of M. crassipes populations were 5.694 and 2.865, respectively, with the minimum Na and Ne being 4.571 (P2) and 2.395 (P4), respectively; the maximum Na and Ne were 8.500 (P6) and 3.723 (P6), respectively. The Shannon’s index (I) ranged from 0.920 to 1.494 with a mean value of 1.121. The minimum He was 0.439 (P2), and the maximum He was 0.666 (P6). The mean value of He in all populations was 0.536, which was larger than the mean Ho (0.445) of all populations, showing heterozygosity deficiency (Table 3). Most loci deviated from HWE, and no populations fully satisfies HWE; this was particularly true for populations P2, P4, P5 and P6, where more than half of the loci deviated from HWE. The analysis of genetic diversity parameters revealed a moderately high level of genetic diversity in M. crassipes.

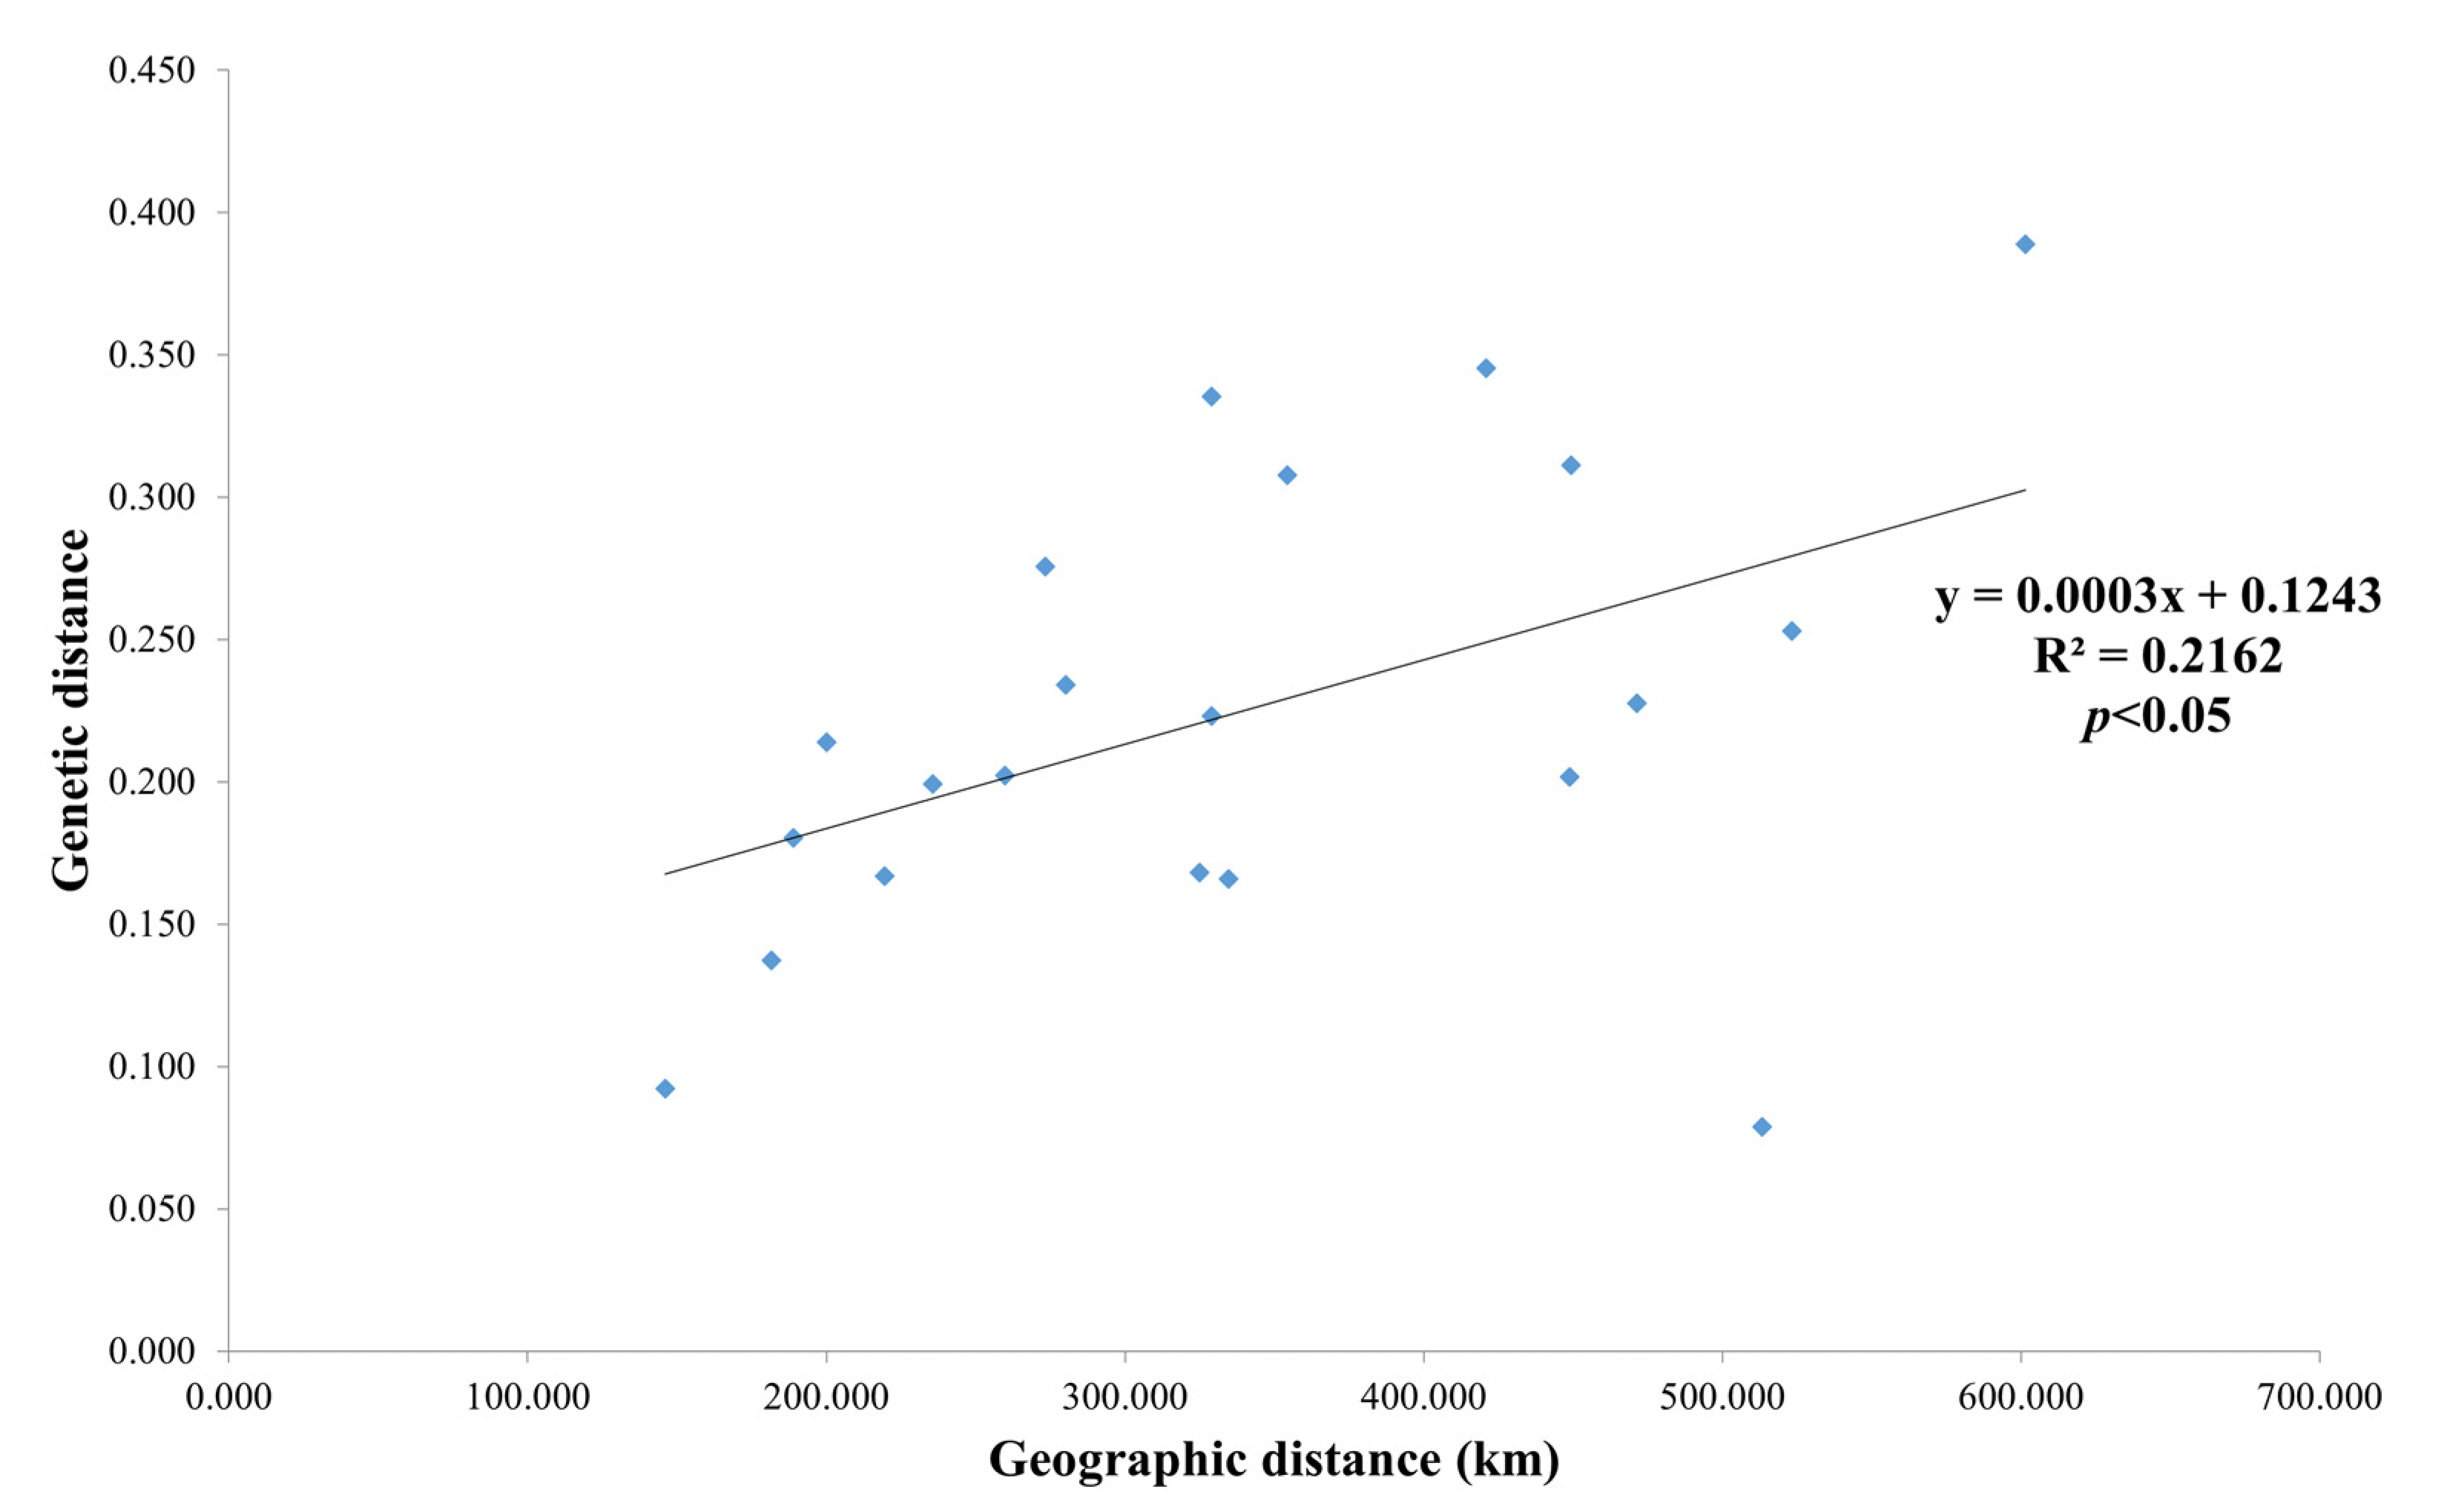
3.2. Genetic Differentiation and Gene Flow

The inbreeding coefficient among specimens (Fis) ranged from −0.199 to 0.662 with a mean value of 0.158 (Table 2). The M17, M28, M31, M19, N8, N10 and N13 loci had some heterozygotes excess, while the other seven loci had some heterozygotes deficiency. The inbreeding coefficient in the total populations (Fit) ranged from −0.075 to 0.677 with a mean value of 0.312, which showed heterozygotes deficiency and the presence of inbreeding. The coefficient of population differentiation (Fst) ranged from 0.039 to 0.380 with a mean value of 0.185, which indicated moderate genetic differentiation between populations. AMOVA (Table 4) demonstrated that 21.09% of the total molecular variance occurred among populations, while the remainder occurred within populations. The Fst value between populations ranged from 0.040 to 0.221, with an average value of 0.108, which was lower than the mean Fst (0.22) of outcrossing plants (Table 5). The gene flow between populations was in the range of 0.883–5.934 with a mean value of 2.454 (Table 5). Gene flow greater than 1 indicates that gene exchange between populations can prevent genetic differentiation due to genetic drift [40].

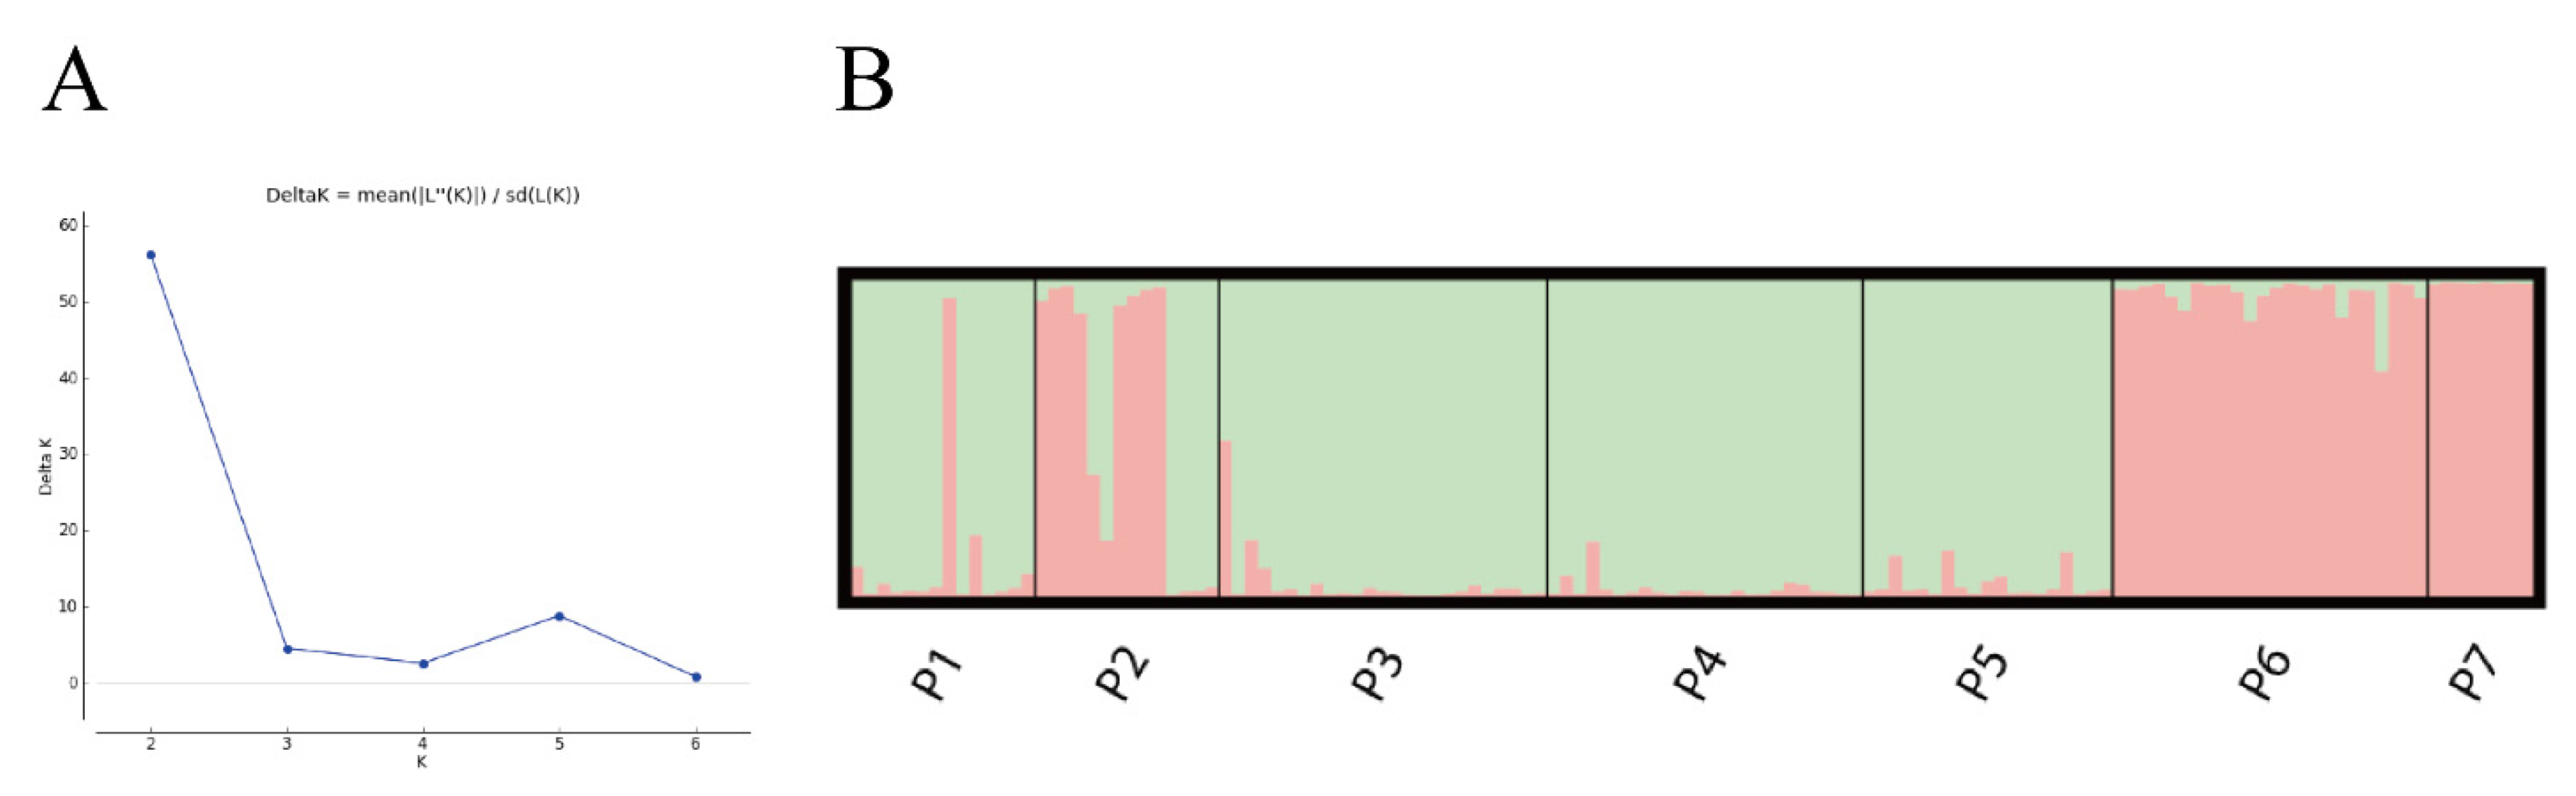
3.3. Population Clustering and Genetic Structure

Based on Nei’s genetic distance among populations, cluster analysis of seven populations of M. crassipes was carried out based on the neighbor-joining method using MEGA 11. The seven natural populations were divided into two clusters (Figure 3A). One cluster included the P6 and P7 populations, and one cluster included the P1, P2, P3, P4 and P5 populations. Populations P3 and P4 had the smallest genetic distance. This result of principal coordinate analysis (PCoA) was similar to that of NJ (Figure 4), presumably dividing all specimens into two groups. Based on Nei’s genetic distance among individuals, the UPGMA tree of 128 samples of M. crassipes showed that all specimens were divided into five groups (Figure 3B). All specimens from the P1, P2, P3, P4 and P5 populations, and three specimens from the P6 population, were gathered into a mixed group V (yellow), which was similar to the results of the NJ tree and PCoA. A specimen from the P7 population was gathered into a separate group I (purple). Two specimens from the P6 populations were gathered into a small group II (red), the remaining specimens of the P7 population and some specimens of the P6 population were gathered into another group III (green), and the remaining specimens from the P6 populations were gathered into another group IV (blue).
The population structure of M. crassipes was analyzed using Structure 2.3.4, and the most likely number of population groups (K) was determined with delta K (ΔK). The maximum value of Delta K was 56.178 when K was equal to 2, indicating that the seven natural populations of M. crassipes originated from two ancestral groups (Figure 5A). There were 125 specimens that originated from a single ancestral group, with 85 specimens belonging to ancestral Group A (green), 40 specimens belonging to ancestral Group B (red) and 3 specimens considered to have mixed origins (Figure 5B) [41].
Some of the specimens of population P2 and the main specimens of populations P1, P3, P4 and P5 were from ancestral Group A; the genetic background of populations P6 and P7 was from ancestral Group B. In the P2 population, eight specimens were attributed to ancestral Group B and five specimens to ancestral Group A. Both NJ cluster analysis and structure analysis of genetic background showed an association between the degree of genetic differentiation among populations and geographical location. Additionally, the Mantel test revealed a significant correlation between genetic and geographic distances among populations of M. crassipes (r = 0.465, p = 0.030 < 0.05, Figure 6).

4. Discussion

4.1. Genetic Diversity of Michelia crassipes

The genetic diversity level of plants is related to their life type and ecological characteristics. Generally, genetic diversity is higher within populations of widely distributed species with multiyear growth lifespans, outbreeding, and wind seeding or sowing for animal feed [42,43]. M. crassipes is a perennial, outbreeding and insect pollinator with a bright red seed coat that is very easy for animals to feed on [1]. Compared with endangered plants of the same genus, M. crassipes has a wider suitable distribution area [44,45,46,47,48], seeds germinate more easily under shaded and humid conditions, seedlings prefer shade, and they can regenerate naturally in the forest understory. Adult M. crassipes is sun-loving and shade-tolerant, although it can grow in the understory. It is not competitive with other tall trees and usually grows poorly in dense forests; it only grows well in forest windows or forest margins [15]. Therefore, the natural population size of M. crassipes is generally small and scattered. In recent years, M. crassipes has been known as a landscape tree species. Although the habitat has not been severely damaged and the resources have been overexploited, as in the case of endangered plants, there were cases of habitat destruction and blind exploitation of resources. Jiangxi Province classified M. crassipes as a tertiary protected plant “https://www.wpca.org.cn/newsinfo/405881.html (accessed on 23 November 2022)”.
The genetic diversity of a population can reflect the adaptability of a species, and lower genetic diversity means a worse ability to adapt to the environment [49]. Usually, it is believed that endemic, endangered and narrowly distributed plants have low genetic diversity [50]. However, many studies have indicated that not all endangered and endemic plants have a low level of genetic diversity, such as Populus wulianensis (He = 0.611 and I = 1.114), Paeonia decomposita (He = 0.405 and I = 0.777) and Semiliquidambar cathayensis (He = 0.727 and I = 1.244) [22,51,52]. The high genetic diversity of endangered plants might help them survive. In this study, the level of genetic diversity of M. crassipes was revealed to be moderately high. The values of expected heterozygosity He and Shannon’s information index I were used as indicators of genetic diversity. In this study, the values of He and I were 0.536 and 1.121, respectively, for M. crassipes at the species level. Meanwhile, values of He = 0.536 and I = 1.121 were found at the population level. The results were higher than those of plants of the genus Magnolia, such as Magnolia sieboldii (He = 0.361) and Magnolia sinostellata (He = 0.521 and I = 0.880), but lower than Magnolia salicifolia (He = 0.782) [53,54,55]. The results were also higher than those of endangered plants of the same genus or family that were also analyzed using SSR markers, such as Michelia coriacea (He = 0.47), Michelia wilsonii (He = 0.418 and I = 0.597), Magnolia officinalis (He = 0.342 and I = 0.496), and Sinomanglietia glauca (He = 0.423 and I = 0.696) [56,57,58,59]. However, the level of genetic diversity of M. crassipes is lower than that of Kmeria septentrionalis (He = 0.687), Liriodendron chinense (He = 0.74 and I = 1.13) and Michelia shiluensis (He = 0.718 and I = 1.506), which were also analyzed using SSR molecular markers [60,61,62]. In addition, the level of genetic diversity of M. crassipes is lower than those of tree crops, such as Iranian and some European grapes (He = 0.81) and Juglans regia L. (He = 0.78) [63,64]. Our study was the first to reveal moderately high levels of genetic diversity for M. crassipes.
Generally, the PIC value is used as an indicator of polymorphism of microsatellite primers [50]. A PIC value higher than 0.50 indicates a high polymorphism level [65]. In this study, the mean PIC value of 14 primer pairs was 0.610, and 10 of them were highly polymorphic, which indicates that they were well polymorphic and suitable for molecular genetic study of M. crassipes at the population level.
In addition, a high deviation between Ho and He was found at some loci, such as M27, M29 and M32. This is thought to be due to the presence of heterozygotes deficiency or null alleles [66]. The presence of the null allele also significantly reduces the values of Ho and He and may further cause genetic diversity to be underestimated [50,67]. Meanwhile, all loci had a deviation from the HWE except M20, M25, M28 and M31. In general, population deviation from HWE is thought to be likely due to high heterozygosity or a high frequency of null alleles at the locus [68,69]. The wild populations of M. crassipes are sporadically distributed, and random mating and sufficiently large population sizes are required to meet the HWE [70]. The incomplete fulfillment of HWE for all populations may be due to an insufficient population size and number of individuals.

4.2. Genetic Differentiation and Genetic Structure

In the present study, the AMOVA results indicated that genetic variation in M. crassipes occurred mainly within populations. In general, genetic variation in species with long lifespans and outcrossing occurred mainly within populations, while genetic variation in self-inbreeding species occurred mainly between populations [71]. The gene flow between populations of M. crassipes was 2.454, which was higher than the average plant gene flow of 1.82 [72]. The mating system of M. crassipes was insect outbreeding, and the dispersal mechanism was animal feeding and seeding, which might be the main reason that the gene flow was at a higher level. If a plant has a gene flow Nm > 1, it is sufficient to suppress genetic differentiation between populations caused by genetic drift [73]. The Fst value between populations ranged from 0.040 to 0.221, with an average value of 0.108. Referring to the criteria suggested by Wright [74], the level of genetic differentiation between populations was low, except for a medium level of genetic differentiation between P7 and the P2, P4 and P5 populations. The mean Nm = 2.454 between populations indicates relatively frequent gene flow between M. crassipes populations, which replaced the effects of genetic drift or geographic isolation between some populations. The inbreeding coefficient among specimens Fis is equal to 0.158, and the inbreeding coefficient at total populations Fit is equal to 0.312, both indicating the absence of heterozygotes and the existence of inbreeding in the M. crassipes population. The mating system of M. crassipes is dominated by outbreeding and partially self-compatible [3]. Due to pollination limitations, habitat destruction and habitat fragmentation, M. crassipes performs a small amount of self-inbreeding and biparental inbreeding, which may be one of the reasons for the existence of M. crassipes heterozygotes deficiency as well as high Fis values [75,76]. Heterozygotes deficiency results in reduced genetic diversity.
The results of PCoA, clustering analysis and structure analysis are cross-referenced and validated. Clustering analysis and PCoA can elucidate intuitive relationships based on Nei’s genetic distance, but they cannot fully classify populations. However, Structure software can objectively classify populations based on a Bayesian analysis. The genetic structure of M. crassipes among populations indicated that seven populations could be assigned into two groups, which are the same as those of the PCoA and NJ tree. Overall, these results showed that the seven natural populations of M. crassipes originated from two ancestral groups. The P1, P3, P4 and P5 populations originated from the same group, and the P6 and P7 populations originated from a separate group. The P2 population was special in that the genetic component of the population contained both Group A and Group B. The Mantel test showed a significant positive correlation between genetic and geographic distances among M. crassipes populations. JiuLianShan (P1), Nanling (P2), Huaping (P3) and Ganchong (P4) all belong to the Nanling Mountains landform area. JiuLianShan is located in the eastern section of the Nanling Mountains and Huaping and Ganchong are located in the western section of the Nanling Mountains in the YueChengling mountain range, so these three populations were clustered into one group. Hengshan (P5), Jinggangshan (P6) and Guanshan (P7) belong to the same Chiang-nan hilly landform area. Jinggangshan and Guanshan belong to the Luoxiao Mountains, while Hengshan is located in the central Hunan hilly terrain subregion [77]. The geographical barrier between the Hengshan and Luoxiao Mountains may be the main reason why the P5 population originated from the same ancestral group as the P1, P3, and P4 populations. The Nanling population is geographically adjacent to the Jinggangshan population, and the gene exchange between the Nanling and Jinggangshan populations is less restricted, which may be the main reason for the special genetic structure of the Nanling population.

4.3. Conservation Proposal

The level of genetic diversity revealed the utilization potential of the species and provided a basis for resource conservation and selection of breeding material [78]. This study showed that M. crassipes has moderately high genetic diversity at the species and population levels. Therefore, in situ conservation measures should be implemented for the seven wild populations of M. crassipes, which is the most effective way to conserve endangered plants. In particular, P3 and P6 have the highest level of genetic diversity and the richest alleles, which should have a priority level of protection. In addition, ex situ conservation is an important complementary measure, as some populations of M. crassipes grow near villages and farmlands (P3, P5, P7), tourist development areas (P6) and roadsides (P4), meaning that they are subject to high levels of human disturbance [75]. Due to the small size of the populations and the concentrated distribution of specimens within the populations, it is feasible to collect branches from all specimens of these populations for asexual propagation or to collect seeds for ex situ culture. P2 and P7 had the farthest relatives, so we suggest further collection and utilization of their germplasm resources. A previous survey found that M. crassipes was rich in phenotypic variation among individuals [79], which can be combined with phenotypic traits to discover specific germplasm, and a M. crassipes germplasm resource bank should be established.

5. Conclusions

M. crassipes natural populations are rare and can be used as an important hybrid parent for flower color enhancement in the genus Michelia. Based on the 14 developed SSR markers, we first revealed that natural populations of M. crassipes were rich in genetic diversity and moderate in genetic differentiation. Cluster analysis showed that the seven natural populations of M. crassipes clustered into two major groups; genetic background analysis showed that the seven populations were derived from two groups. Populations with high levels of genetic diversity have important potential for germplasm conservation and breeding. Therefore, the conservation of populations P3 and P6 with high genetic diversity should be strengthened. The germplasm resources of populations P2 and P7 can also be collected, conserved and utilized ex situ. To better exploit the genetic resources of M. crassipes, specific germplasm can be explored in combination with phenotypic traits to establish a germplasm resource bank of M. crassipes and lay the foundation of genetic material for the selection and breeding of excellent new cultivars of M. crassipes.

Supplementary Materials

The following supporting information can be downloaded at: https://www.mdpi.com/article/10.3390/f14030508/s1, Table S1: The geographical location and sampling number of 7 populations of M. crassipes.

Author Contributions

Conceptualization, J.J. and J.L.; formal analysis, Y.X. and X.J; investigation, Y.X. and C.L.; resources, S.D. and J.L.; data curation, Y.X. and X.J.; writing—original draft preparation, Y.X.; writing—review and editing, S.D.; supervision, J.L. and J.J.; project administration, J.L. and S.D.; funding acquisition, S.D. All authors have read and agreed to the published version of the manuscript.

Funding

The research was supported by Zhejiang Science and Technology Major Program on Agricultural New Variety Breeding (2021C02071-3).

Data Availability Statement

The data presented in this study are available on request from the corresponding author. The data are not publicly available due to the data from transcriptome sequencing will be used to write additional articles on M. crassipes.

Conflicts of Interest

The authors declare no conflict of interest.

References

  1. Flora of China Editorial Committee. Flora of China; Science Press: Beijing, China, 1996. [Google Scholar]
  2. Liu, D.; Ouyang, S.; Zeng, G. Rare ornamental flowering trees—M. crassipes. Plants 2002, 2, 18–19. [Google Scholar]
  3. Chai, Y.; Cai, M.; Jin, X.; Zhang, D. Pollination biology of Michelia crassipes. Guihaia 2017, 37, 1322–1329. [Google Scholar]
  4. Liu, Y. Magnolias of China; Beijing Science and Technology Press: Beijing, China, 2004. [Google Scholar]
  5. Shao, W.; Jiang, J.; Dong, R. A New Michelia Cultivar ‘Mengxing’. Acta Hortic. Sin. 2016, 43, 1219–1220. [Google Scholar] [CrossRef]
  6. Shao, W.; Jiang, J.; Dong, R.; Luan, Q. A New Variety, Michelia ‘Mengyuan’. Sci. Silvae Sin. 2015, 51, 155. [Google Scholar]
  7. Shao, W.; Jiang, J.; Dong, R. A New Michelia Cultivar ‘Mengzi’. Acta Hortic. Sin. 2015, 42, 1863–1864. [Google Scholar] [CrossRef]
  8. Bo, B. Kunming Institute of Botany successfully produces five new cultivars of the genus Michelia. China Flowers Hortic. 2011, 11, 40. [Google Scholar]
  9. Liao, J. Selective Breeding of New Cultivars for the Michelia crassipes Law. J. Northwest For. Univ. 2007, 22, 76–78. [Google Scholar]
  10. Yu, Q.; Liu, C.; Jin, X.; Tan, Y. Changes of Physiolocical indexes and Pigment during the Flowering Process in the Perianth of Michelia crassipes. J. Northeast. For. Univ. 2021, 49, 39–43. [Google Scholar] [CrossRef]
  11. Liu, C.; Yu, Q.; Li, Z.; Jin, X.; Xing, W. Metabolic and transcriptomic analysis related to flavonoid biosynthesis during the color formation of Michelia crassipes tepal. Plant Physiol. Biochem. 2020, 155, 938–951. [Google Scholar] [CrossRef] [PubMed]
  12. Gong, W.; Xiao, J.; Gan, Q.; Huang, F.; Ouyang, S.; He, L. The Effects of the Substrate and Rooting Reagent on the Rooting of Michelia Crassipes by Cutting Propagation. Fujian For. 2018, 6, 37–40. [Google Scholar]
  13. Chai, Y.; Hu, X.; Zhang, D.; Liu, X.; Liu, C.; Jin, X. Studies on Compatibility of lnterspecific Hybridization Between Michelia crassipes and M. Figo, M. maudiae, M. platypetala. Acta Hortic. Sin. 2018, 45, 1970–1978. [Google Scholar] [CrossRef]
  14. Liu, X.; Tang, S.; Sun, Q.; Yao, G. Geographic Distribution of Magnoliaceae Plants in East China Plant Zone. For. Inventory Plan. 2008, 10, 40–43. [Google Scholar]
  15. Yang, C.; Chen, J.; Fang, X.; Yang, l. Excellent garden tree species Michelia crassipes. Guizhou For. Sci. Technol. 2003, 6, 16–18. [Google Scholar]
  16. Xu, F.; Zhu, B.; Pan, W.; Zhu, Z.; Zhong, N.; Li, W.; Zhao, Q. Study on the Genetic Relationship of 11 Michelia Species Based on SSR Markers. Guangdong Agric. Sci. 2021, 48, 87–93. [Google Scholar] [CrossRef]
  17. Biodiversity Committee; Chinese Academy of Sciences. Principles and Methods of Biodiversity Research; Science and Technology of China Press: Beijing, China, 1994. [Google Scholar]
  18. Booy, G.; Hendriks, R.; Smulders, M.; Van Groenendael, J.; Vosman, B. Genetic diversity and the survival of populations. Plant Biol. 2000, 2, 379–395. [Google Scholar] [CrossRef]
  19. Xu, Y.; Zang, R. Theoretical and practical research on conservation of Wild Plants with Extremely Small Populations in China. Biodivers. Sci. 2022, 30, 84–105. [Google Scholar] [CrossRef]
  20. Liu, R.; Li, J.; Yu, J.; Yu, W.; Huang, X.; Han, S.; Lu, M. SSR Marker-based Analysis on Genetic Relationship of 16 Torreya grandis Germplasms. Mol. Plant Breed. 2022, 20, 4144–4152. [Google Scholar] [CrossRef]
  21. Khodadadi, M.; Fotokian, M.H.; Miransari, M. Genetic Diversity of Wheat (Triticum aestivum L.) Genotypes Based on Cluster and Principal Component Analyses for Breeding Strategies. Aust. J. Crop Sci. 2011, 5, 17–24. [Google Scholar]
  22. Wu, Q.; Zang, F.; Ma, Y.; Zheng, Y.; Zang, D. Analysis of genetic diversity and population structure in endangered Populus wulianensis based on 18 newly developed EST-SSR markers. Glob. Ecol. Conserv. 2020, 24, e01329. [Google Scholar] [CrossRef]
  23. Li, S.; Liu, S.-L.; Pei, S.-Y.; Ning, M.-M.; Tang, S.-Q. Genetic diversity and population structure of Camellia huana (Theaceae), a limestone species with narrow geographic range, based on chloroplast DNA sequence and microsatellite markers. Plant Divers. 2020, 42, 343–350. [Google Scholar] [CrossRef]
  24. Kumar, M.; Chaudhary, V.; Sirohi, U.; Singh, M.K.; Malik, S.; Naresh, R. Biochemical and molecular markers for characterization of chrysanthemum germplasm: A review. J. Pharmacogn. Phytochem. 2018, 7, 2641–2652. [Google Scholar]
  25. Wang, X.; Gao, C.; Li, K. Construction strategy and verification of timber-used germplasm conservation bank of Pinus vunnanensis. J. Plant Resour. Environ. 2019, 28, 105–114. [Google Scholar]
  26. Chen, X.; Shen, X. Forest Tree Breeding; Higher Education Press: Beijing, China, 2005. [Google Scholar]
  27. Li, B.; Gu, W.; Lu, B. A study on phenotypic diversity of seeds and cones characteristics in Pinus bungeana. Biodivers. Sci. 2002, 10, 181–188. [Google Scholar]
  28. Thiel, T.; Michalek, W.; Varshney, R.; Graner, A. Exploiting EST databases for the development and characterization of gene-derived SSR-markers in barley (Hordeum vulgare L.). Theor. Appl. Genet. 2003, 106, 411–422. [Google Scholar] [CrossRef]
  29. Koressaar, T.; Remm, M. Enhancements and modifications of primer design program Primer3. Bioinformatics 2007, 23, 1289–1291. [Google Scholar] [CrossRef] [Green Version]
  30. Peakall, R.; Smouse, P.E. GenAlEx 6.5: Genetic analysis in Excel. Population genetic software for teaching and research—An update. Bioinformatics 2012, 28, 2537–2539. [Google Scholar] [CrossRef] [Green Version]
  31. Kalinowski, S.T.; Taper, M.L.; Marshall, T.C. Revising how the computer program CERVUS accommodates genotyping error increases success in paternity assignment. Mol. Ecol. 2007, 16, 1099–1106. [Google Scholar] [CrossRef]
  32. Yeh, F.C.; Yang, R.C.; Boyle, T.B.; Ye, Z.; Mao, J.X. POPGENE, the user-friendly shareware for population genetic analysis. Mol. Biol. Biotechnol. Cent. Univ. Alta. Can. 1997, 10, 295–301. [Google Scholar]
  33. Pritchard, J.K.; Stephens, M.; Donnelly, P. Inference of population structure using multilocus genotype data. Genetics 2000, 155, 945–959. [Google Scholar] [CrossRef] [PubMed]
  34. Evanno, G.; Regnaut, S.; Goudet, J. Detecting the number of clusters of individuals using the software STRUCTURE: A simulation study. Mol. Ecol. 2005, 14, 2611–2620. [Google Scholar] [CrossRef] [Green Version]
  35. Earl, D.A.; VonHoldt, B.M. STRUCTURE HARVESTER: A website and program for visualizing STRUCTURE output and implementing the Evanno method. Conserv. Genet. Resour. 2012, 4, 359–361. [Google Scholar] [CrossRef]
  36. Jakobsson, M.; Rosenberg, N.A. CLUMPP: A cluster matching and permutation program for dealing with label switching and multimodality in analysis of population structure. Bioinformatics 2007, 23, 1801–1806. [Google Scholar] [CrossRef] [Green Version]
  37. Rosenberg, N.A. DISTRUCT: A program for the graphical display of population structure. Mol. Ecol. Notes 2004, 4, 137–138. [Google Scholar] [CrossRef]
  38. Tamura, K.; Stecher, G.; Kumar, S. MEGA11: Molecular evolutionary genetics analysis version 11. Mol. Biol. Evol. 2021, 38, 3022–3027. [Google Scholar] [CrossRef]
  39. Botstein, D.; White, R.L.; Skolnick, M.; Davis, R.W. Construction of a genetic linkage map in man using restriction fragment length polymorphisms. Am. J. Hum. Genet. 1980, 32, 314. [Google Scholar] [PubMed]
  40. Wright, S. The genetical structure of populations. Ann. Eugen. 1949, 15, 323–354. [Google Scholar] [CrossRef] [PubMed]
  41. Belaj, A.; Muñoz-Diez, C.; Baldoni, L.; Porceddu, A.; Barranco, D.; Satovic, Z. Genetic diversity and population structure of wild olives from the north-western Mediterranean assessed by SSR markers. Ann. Bot. 2007, 100, 449–458. [Google Scholar] [CrossRef] [Green Version]
  42. Nybom, H.; Bartish, I.V. Effects of life history traits and sampling strategies on genetic diversity estimates obtained with RAPD markers in plants. Perspect. Plant Ecol. Evol. Syst. 2000, 3, 93–114. [Google Scholar] [CrossRef]
  43. Hamrick, J.L.; Godt, M.J.W.; Sherman-Broyles, S.L. Factors influencing levels of genetic diversity in woody plant species. In Population Genetics of Forest Trees; Springer: Berlin/Heidelberg, Germany, 1992; pp. 95–124. [Google Scholar]
  44. Qin, A.; Ma, F.; Xu, G.; Shi, Z.; Chen, Q. Population structure and dynamic characteristics of a rare and endangered tree species Michelia wilsonii Finet et Gagn. Acta Ecol. Sin. 2020, 40, 4445–4454. [Google Scholar]
  45. Wei, Y.; Hong, F.; Yuan, L.; Kong, Y.; Shi, Y. Population Distribution and Age Structure Characteristics of Michelia shiluensis, an Endangered and Endemic Species in Hainan lslano. Chin. J. Trop. Crops 2017, 38, 2280–2284. [Google Scholar]
  46. Li, H.; Xiong, Z.; Chen, Z.; Yang, C. A Preliminary Investigation of Rare and Endangered Michelia angustioblonga. J. Sichuan For. Sci. Technol. 2016, 37, 96–98. [Google Scholar] [CrossRef]
  47. Guan, Z.; Zhang, L. The Study on Conservation and Utilization of Endangered Plant Michelia hedyosperma. Chin. Wild Plant Resour. 2004, 23, 11–14. [Google Scholar]
  48. Zhao, N.; Park, S.; Zhang, Y.-Q.; Nie, Z.-L.; Ge, X.-J.; Kim, S.; Yan, H.-F. Fingerprints of climatic changes through the late Cenozoic in southern Asian flora: Magnolia section Michelia (Magnoliaceae). Ann. Bot. 2022, 130, 41–52. [Google Scholar] [CrossRef]
  49. Reed, D.H.; Frankham, R. Correlation between fitness and genetic diversity. Conserv. Biol. 2003, 17, 230–237. [Google Scholar] [CrossRef]
  50. Niu, Y.; Bhatt, A.; Peng, Y.; Chen, W.; Gao, Y.; Zhan, X.; Zhang, Z.; Hu, W.; Song, M.; Yu, Z. Genetic diversity and population structure analysis of Emmenopterys henryi Oliv., an endangered relic species endemic to China. Genet. Resour. Crop Evol. 2021, 68, 1135–1148. [Google Scholar] [CrossRef]
  51. Ye, X.; Wen, G.; Zhang, M.; Liu, Y.; Fan, H.; Zhang, G.; Chen, S.; Liu, B. Genetic diversity and genetic structure of a rare and endangered species Semiliquidambar cathayensis Hung T.Chano. Plant Sci. J. 2021, 39, 415–423. [Google Scholar]
  52. Wang, S.-Q. Genetic diversity and population structure of the endangered species Paeonia decomposita endemic to China and implications for its conservation. BMC Plant Biol. 2020, 20, 510. [Google Scholar] [CrossRef]
  53. Kikuchi, S.; Osone, Y. Subspecies divergence and pronounced phylogenetic incongruence in the East-Asia-endemic shrub Magnolia sieboldii. Ann. Bot. 2021, 127, 75–90. [Google Scholar] [CrossRef] [PubMed]
  54. Wang, X.; Chen, W.; Luo, J.; Yao, Z.; Yu, Q.; Wang, Y.; Zhang, S.; Liu, Z.; Zhang, M.; Shen, Y. Development of EST-SSR markers and their application in an analysis of the genetic diversity of the endangered species Magnolia sinostellata. Mol. Genet. Genom. 2019, 294, 135–147. [Google Scholar] [CrossRef]
  55. Tamaki, I.; Kawashima, N.; Setsuko, S.; Itaya, A.; Tomaru, N. Morphological and genetic divergence between two lineages of Magnolia salicifolia (Magnoliaceae) in Japan. Biol. J. Linn. Soc. 2018, 125, 475–490. [Google Scholar] [CrossRef]
  56. Xiong, M.; Tian, S.; Zhang, Z.; Fan, D.; Zhang, Z. Population genetic structure and conservation units of Sinomanglietia glauca (Magnoliaceae). Biodivers. Sci. 2014, 22, 476–484. [Google Scholar]
  57. Yu, H.-H.; Yang, Z.-L.; Sun, B.; Liu, R.-n. Genetic diversity and relationship of endangered plant Magnolia officinalis (Magnoliaceae) assessed with ISSR polymorphisms. Biochem. Syst. Ecol. 2011, 39, 71–78. [Google Scholar] [CrossRef]
  58. Xiang, C.; Zhu, X.; Zhang, H.; Qiu, D. Genetic Diversity of Endangered Plant Michelia wilsonii. J. Northwest For. Univ. 2009, 24, 66–69. [Google Scholar]
  59. Zhao, X.; Ma, Y.; Sun, W.; Wen, X.; Milne, R. High genetic diversity and low differentiation of Michelia coriacea (Magnoliaceae), a critically endangered endemic in southeast Yunnan, China. Int. J. Mol. Sci. 2012, 13, 4396–4411. [Google Scholar] [CrossRef] [PubMed] [Green Version]
  60. Deng, Y.; Liu, T.; Xie, Y.; Wei, Y.; Xie, Z.; Shi, Y.; Deng, X. High Genetic Diversity and Low Differentiation in Michelia shiluensis, an Endangered Magnolia Species in South China. Forests 2020, 11, 469. [Google Scholar] [CrossRef] [Green Version]
  61. Lin, Y. The Population Genetic Structure and Gene Flow of Kmeria septentrionalis Assessed by Microsatellite Markers. Master’s Thesis, Guangxi Normal University, Guilin, China, 2012. [Google Scholar]
  62. Li, K.; Chen, L.; Feng, Y.; Yao, J.; Li, B.; Xu, M.; Li, H. High genetic diversity but limited gene flow among remnant and fragmented natural populations of Liriodendron chinense Sarg. Biochem. Syst. Ecol. 2014, 54, 230–236. [Google Scholar] [CrossRef]
  63. Bernard, A.; Barreneche, T.; Lheureux, F.; Dirlewanger, E. Analysis of genetic diversity and structure in a worldwide walnut (Juglans regia L.) germplasm using SSR markers. PLoS ONE 2018, 13, e0208021. [Google Scholar] [CrossRef] [Green Version]
  64. Ebadi, A.; Ghaderi, N.; Vafaee, Y. Genetic diversity of Iranian and some European grapes as revealed by nuclear and chloroplast microsatellite and SNP molecular markers. J. Hortic. Sci. Biotechnol. 2019, 94, 599–610. [Google Scholar] [CrossRef]
  65. Xiao, Z.; Zhai, M.; Wang, Z.; Xu, J.; Li, L.; Yang, H. Application of microsatellite DNA on analyzing genetic diversity of Juglans regia. J. Cent. South Univ. For. Technol. 2014, 34, 55–61. [Google Scholar] [CrossRef]
  66. Zhao, P.; Li, D.; Ma, J.; Liang, W.; Pang, X.; Long, C.; Ma, J.; Guo, H. SSR marker development, genetic diversity and population structure analysis in oil tree species Vernicia montana. J. Beijing For. Univ. 2021, 43, 50–61. [Google Scholar]
  67. Paetkau, D. The molecular basis and evolutionary history of a microsatellite null allele in bears. Mol. Ecol. 1995, 4, 519–520. [Google Scholar] [CrossRef] [PubMed]
  68. Barros, J.; Winkler, F.M.; Velasco, L.A. Assessing the genetic diversity in Argopecten nucleus (Bivalvia: Pectinidae), a functional hermaphrodite species with extremely low population density and self-fertilization: Effect of null alleles. Ecol. Evol. 2020, 10, 3919–3931. [Google Scholar] [CrossRef] [PubMed] [Green Version]
  69. Chen, B.; Cole, J.W.; Grond-Ginsbach, C. Departure from Hardy Weinberg equilibrium and genotyping error. Front. Genet. 2017, 8, 167. [Google Scholar] [CrossRef] [PubMed] [Green Version]
  70. Liu, Y.; Zheng, Y.; Li, C.; Lin, F.; Huang, P. Genomic Characteristics and Population Genetic Variation of Dalbergia cultrata Graham ex Benth in China. For. Res. 2022, 35, 44–53. [Google Scholar] [CrossRef]
  71. Nybom, H. Comparison of different nuclear DNA markers for estimating intraspecific genetic diversity in plants. Mol. Ecol. 2004, 13, 1143–1155. [Google Scholar] [CrossRef]
  72. Morjan, C.L.; Rieseberg, L.H. How species evolve collectively: Implications of gene flow and selection for the spread of advantageous alleles. Mol. Ecol. 2004, 13, 1341–1356. [Google Scholar] [CrossRef]
  73. Govindaraju, D.R. Relationship between dispersal ability and levels of gene flow in plants. Oikos 1988, 52, 31–35. [Google Scholar] [CrossRef]
  74. Wright, S. Evolution and the Genetics of Populations, Volume 4: Variability within and among Natural Populations; University of Chicago press: Chicago, IL, USA, 1984; Volume 4. [Google Scholar]
  75. Liu, H.; Gao, J.; Song, C.; Yu, S. Conservation status and human disturbance of the habitats of Michelia crassipes Law in China. China Environ. Sci. 2019, 39, 3976–3981. [Google Scholar] [CrossRef]
  76. Collevatti, R.G.; Telles, M.P.; Lima, J.S.; Gouveia, F.O.; Soares, T.N. Contrasting spatial genetic structure in Annona crassiflora populations from fragmented and pristine savannas. Plant Syst. Evol. 2014, 300, 1719–1727. [Google Scholar] [CrossRef]
  77. Guo, Z.; Cui, G. Geomorphologic regionalization of China aimed at construction of nature reserve system. Acta Ecol. Sin. 2013, 33, 6264–6276. [Google Scholar]
  78. Lu, J.; Zhang, Y.; Diao, X.; Yu, K.; Dai, X.; Qu, P.; Crabbe, M.J.C.; Zhang, T.; Qiao, Q. Evaluation of genetic diversity and population structure of Fragaria nilgerrensis using EST-SSR markers. Gene 2021, 796–797, 145791. [Google Scholar] [CrossRef] [PubMed]
  79. He, X.; Jiao, Z.; Zheng, J.; Dou, Q.; Huang, L.; Wang, B.; Huang, R. Construction of Fingerprint of Michelia Germplasm by Fluorescent SSR Markers. Mol. Plant Breed. 2018, 16, 4705–4714. [Google Scholar]
Figure 1. Flowers of M. crassipes in the wild.
Forests 14 00508 g001
Figure 2. The geographical distribution of M. crassipes populations; P1 is located in Jiulianshan, Longnan County, Jiangxi Province, with 14 individuals; P2 is located in Nanling, Ruyuan County, Guangdong Province, with 14 individuals; P3 is located in Huaping, Guilin City, Guangxi Province, with 25 individuals; P4 is located in Ganchong, Xinning County, Hunan Province, with 24 individuals; P5 is located in Hengshan, Hunan Province, with 19 individuals; P6 is located in Jinggangshan, Jiangxi Province, with 24 individuals; P7 is located in Guanshan, Yifeng County, Jiangxi Province, with 8 individuals. The detailed geographical locations and sample numbers of the 7 populations of M. crassipes are listed in Table S1.
Forests 14 00508 g002
Figure 3. (A) NJ tree of 7 M. crassipes populations based on Nei’s genetic distance; (B) UPGMA tree of 128 M. crassipes samples based on Nei’s genetic distance. The first part with a purple branch is Group I, the second part with red branches is Group II, the third part with green branches is Group III, the fourth with blue branches is Group IV, the fifth part with yellow branches is Group V.
Forests 14 00508 g003
Figure 4. Principal coordinate analysis (PCoA) of all specimens from seven M. crassipes populations.
Forests 14 00508 g004
Figure 5. (A) The change in Delta K values with K value. The maximum Delta K values correspond to the optimal clustering. (B) Population structure distribution of 128 M. crassipes specimens from seven populations when K values are equal to 2. The vertical bars represent each sample, and the length of the colored bars (Q value) indicates the estimated proportion of affiliated ancestral group degree at K = 2. If this specimen had a value of Q (>0.75), it indicated that the specimen had a single origin; otherwise, the specimen was considered of ‘mixed origin’ [41].
Forests 14 00508 g005
Figure 6. The correlation between the matrix of genetic distance and the corresponding geographic distance among seven populations of M. crassipes (R2 = 0.2162, p < 0.05).
Forests 14 00508 g006
Table 1. The characteristics of SSR primers.
Primer PairPrimer Sequence (5′-3′)Repeat MotifAnnealing Temperature (°C)Product Size/bp
M17F:GCTGCAGAGGCATTATGGTT(ATC)660239
R:ATGTCTGGTGGGCAGATGAT
M19F:AGCTTCCGGGACTTCAAACT(CAG)560237
R:CGTAGGCAAGAACGGATGAT
M20F:CCCTACTTCGACCATTGCAT(TTG)660275
R:CGAACCAAGAGTCCGTCAAT
M25F:TGCTCCATAAGGTAGGGCAT(TC)660251
R:TCACTCCCTCTGAAGCCATT
M27F:GAAGACGCTTTCCTGCAGAT(AT)660218
R:CACATCAAGCTTGCACGAGT
M28F:GCCTAAGGCGCTTCTTTTCT(GT)860237
R:ATGGCTAAACGAAGGGAGGT
M29F:AGGGGCAGAAGATGTCCTTT(GT)660267
R:TGCCTTGGCTTAGAAGCTGT
M30F:GTGGTATTGTTGGGTTCGCT(CA)660276
R:CCTCCAAAACCCTCCTCTTT
M31F:CCATGGGCAAGAGAATCAGT(CA)660246
R:GAAGTTCAGCCAACCACCAT
M32F:TCGTCCCTGGAATGAGAAGT(CA)660240
R:CTTAACCGATGGTGGCTTGT
N2F:GCGTAATTTCGTCACCCACT(AT)660231
R:CCTGACCGTTGGTTTGAGTT
N8F:CCCACCCTCAAACATCACTT(GC)660230
R:AATACCTTGGTTGAGGGGGT
N10F:TGCAAGAGTCATCCATTTCAG(AAG)560260
R:GCTGGGGACGTAATGTTGTT
N13F:CCTCACACTCACAGCAGCAT(CAG)662218
R:GTGGAGCTGTTACCGTTGGT
Table 2. Genetic diversity parameters of 14 SSR loci in M. crassipes.
LocusNaNePPB (%)IHoHePICFisFitFstNmFnHWE
M17143.59485.71%1.4570.8210.6970.755−0.178−0.0360.1211.818−0.037***
M1971.45785.71%0.5260.2910.2730.458−0.0650.3400.3800.4080.221*
M20192.72288.89%1.2890.4590.6000.7080.2340.3540.1561.3490.144NS
M25226.60190.48%2.0160.7910.8310.8790.0480.1120.0673.4570.014NS
M27314.42893.33%1.8280.2600.7690.8060.6620.6750.0396.1150.577***
M28203.95694.74%1.6280.7470.7390.765−0.0120.0470.0584.064−0.011NS
M29182.66994.44%1.0940.2170.5800.6100.6250.6770.1371.5730.567***
M30121.804100.00%0.7830.2260.4070.5700.4440.6320.3390.4870.510***
M3181.70387.50%0.6170.4200.3510.426−0.1990.1010.2500.7520.012NS
M32142.469100.00%1.0060.2920.5110.6390.4300.5910.2820.6350.334***
N2141.81592.31%0.7850.1990.3950.4980.4960.6380.2810.6400.540***
N8152.238100.00%0.9070.4760.4510.519−0.0560.2270.2680.6840.144*
N10141.47192.86%0.5190.2470.2360.242−0.0460.0800.1211.8230.093ND
N13103.18370.00%1.2400.7770.6630.667−0.173−0.0750.0832.750−0.042***
Mean15.5712.86591.14%1.1210.4450.5360.6100.1580.3120.1851.8970.219
Note: Na, number of observed alleles; Ne, number of effective alleles; PPB, percentage of polymorphic bands; I, Shannon’s Information Index; Ho, observed heterozygosity; He, expected heterozygosity; PIC, polymorphism information content; Fis, inbreeding coefficient among individuals; Fit, inbreeding coefficient at total populations; Fst, genetic differentiation coefficient among populations; Nm, gene flow; Fn, null alleles frequency; HWE, p value for deviation from Hardy–Weinberg equilibrium (*** p < 0.001 * p < 0.05. NS, not significant, ND, not done).
Table 3. Genetic diversity of seven M. crassipes populations by SSR analysis.
PopulationsNaNeIHoHeHWE
P14.9292.5901.0630.5050.528M17 **, M20 *, M27 ***, M29 *, N2 ***
P24.5712.6240.9200.3480.439M17 *, M20 *, M27 ***, M28 ***, M29 **, M30 **, M32 ***, N13 ***
P36.2143.2251.2130.5400.583M19 ***, M25 *, M27 ***, M29 ***, M30 ***, N2 ***
P45.5712.3950.9900.3980.478M17 ***, M20 *, M25 *, M27 ***, M29 ***, M30 ***, M32 ***, N2 ***, N10 ***, N13 **
P55.4292.6731.0460.4330.501M17 ***, M25 *, M27 ***, M28 *, M29 ***, M30 **, M32 ***, N13 **
P68.5003.7231.4940.4880.666M17 ***, M19 **, M20 **, M27 ***, M28 **, M29 ***, M30 ***,
M32 ***, N2 ***, N13 **
P74.6432.8251.1200.4010.557M17 *, M20 **, M25 ***, M29 **, M32 **, N8 *, N13 **
Mean5.6942.8651.1210.4450.536
Note: Na, number of observed alleles; Ne, number of effective alleles; I, Shannon’s Information Index; Ho, observed heterozygosity; He, expected heterozygosity; HWE, p value for deviation from Hardy–Weinberg equilibrium (*** p < 0.001, ** p < 0.01, * p < 0.05).
Table 4. Molecular variance analysis of M. crassipes populations.
Source of Variationd.f.SSDMSDVariance ComponentVariance
Ratio
p Value
Among populations6333.84955.6422.56421.09%0.001
Within populations1211161.2219.5979.59778.91%0.001
Note: d.f, degrees of freedom; SSD, sum of squares of deviations; MSD, mean of standard deviation.
Table 5. Genetic differentiation coefficient (Fst) and gene flow among M. crassipes populations.
PopulationsP1P2P3P4P5P6P7
P1 2.2202.7083.0994.8772.6801.459
P20.101 2.1821.8542.9191.5730.883
P30.0850.103 5.9343.0622.3571.478
P40.0750.1190.040 3.6112.0931.415
P50.0490.0790.0750.065 2.1361.172
P60.0850.1370.0960.1070.105 1.827
P70.1460.2210.1450.1500.1760.120
Note: Genetic differentiation coefficient (below diagonal) and gene flow (above diagonal).
Disclaimer/Publisher’s Note: The statements, opinions and data contained in all publications are solely those of the individual author(s) and contributor(s) and not of MDPI and/or the editor(s). MDPI and/or the editor(s) disclaim responsibility for any injury to people or property resulting from any ideas, methods, instructions or products referred to in the content.

