Article

Estimation of the Population Dynamics of Taxus cuspidata by Using a Static Life Table for Its Conservation

1
School of Forestry, Northeast Forestry University, Harbin 150040, China
2
College of Forestry, Beihua University, Jilin 132013, China
*
Author to whom correspondence should be addressed.
Forests 2023, 14(11), 2194; https://doi.org/10.3390/f14112194
Submission received: 4 September 2023 / Revised: 28 October 2023 / Accepted: 2 November 2023 / Published: 4 November 2023
(This article belongs to the Special Issue Spatial Distribution and Growth Dynamics of Tree Species)

Abstract

:
Taxus cuspidata is a rare and endangered plant species with an extremely small population which is endemic to China. This study focused on the natural T. cuspidata population in Jilin Province in China. Conventional population ecology survey methods were used to describe its population structure characteristics. Then, we chose diameter structure instead of temporal structure to establish a static population life table, draw a population survival curve, and quantify the future development trend by using population dynamic analysis and time sequence prediction. The results showed that: (1) the static life table suggested that the population of T. cuspidata was stable overall. The population survival curve tended to be Deevey Ⅱ, with a high early seedling mortality, and the later population growth tended to be stable; (2) the survival curve suggested that the population initially experienced higher mortality rates in the early stage. However, as time progressed and the population aged, the mortality rates decreased, resulting in a more stable population in the middle and late stages; (3) The diameter class structure of T. cuspidata was stable overall, and the dynamic indices showed that the population was fluctuating. The population was influenced by external disturbances and showed some resistance to human disturbance; (4) time sequence prediction analysis showed that the mortality rate of young individuals was high, natural renewal could be maintained, and the population size would remain at a certain amount in the future. The result shows that the Jilin region is a highly suitable area for the growth of Taxus cuspidata’s population in Northeast China. We recommend in situ conservation of remaining wild populations, relocation of germplasm resources, and reduction of human activities; these actions will be beneficial to Taxus cuspidata’s long-term survival.

1. Introduction

Taxus cuspidata Siebold et Zucc. is an arboreal species of Taxaceae. It is also a national first-level protected medicinal plant species. It is dioecious, with a height of up to 20 m and a DBH (diameter at breast height) up to 1 m [1]. It is a national first-level rare and endangered plant which is listed in the Red Book of China’s Rare and Endangered Plants and Plant Species with Extremely Small Populations (PSESP) [2]. Its natural distribution range is relatively narrow, as it is only distributed at an altitude of 600–1200 m. Due to excessive logging and human disturbance, the population of T. cuspidata has decreased rapidly. Taxus cuspidata have strict requirements for their growth environment: they grow slowly in shady places when they are young and in open and sunny places when they mature. This special ecological adaptability allows them to survive in habitats that are sparse and severely fragmented [1,2,3]. Seeds can only be collected where there is a mix of males and females, and fruiting is sparse. During the fruiting period, a large number of seeds are eaten by some animals due to the slightly sweet and edible aril of the seeds, and their seeds are physiologically dormant, requiring at least two winters and a summer to germinate under natural conditions. Additionally, the number of seeds is further reduced due to loss of vigor caused by rotting, drying out, and loss of water [1,4]. Therefore, it is difficult to obtain seedling renewal data for the population, and, due to the long-lived and slow-growing nature, we chose to investigate population dynamics by using diameter structure to represent age structure. In fact, population structure (age or size) of tree species is a well-known way to provide valuable information about population dynamics [5,6].
A population is the unit of reproduction and evolution of a species in nature, a collection of individuals of the same species capable of reproducing under certain spatial and temporal conditions. Population is not only a collection of individuals distributed within a certain geological period and geographic space [7], but also has its own unique structure. In most of the existing population dynamics studies, the future trend of population dynamics is judged by the magnitude of the population growth rate, which is determined by the vital rates such as survival probability, growth probability, and reproduction probability of individuals [8,9,10]. Due to the long-lived nature of T. cuspidata and seeds with notable dormancy, their natural reproduction probability and growth probability cannot be determined [1]. Since its extremely small populations are few in nature, each surviving individual is very precious. Harvesting the tree requires time and human and material resources and is not conducive to the ecological balance of the forest and restoration. So we chose to use diameter class structure to investigate the population structure and dynamics of T. cuspidata. We used diameter class structure to represent a time sequence for the woody plants to construct a static life table. This is particularly appropriate for endangered species. The static life table reflects the allocation of individuals with different sizes in a population to reflect the population dynamics and evolution [11]. Through the analysis of the static life table, we can see the population’s diameter structure, and, by quantifying the dynamics, it is possible to grasp the status of the population, predict its development, and provide a scientific reference for the management of the population. Constructing a life table is another important way to understand the characteristics of population structure. The compilation of a static life table can measure the current status of the population and infer the past structure and possible historical structure [12] so as to predict the future trend of the population and the possibility of survival and reproduction under specific conditions. Demographic parameters are a function of the individual’s age, size, and developmental state, or a combination of any of those. Knowledge about the contributions of different stages of the life cycle to population growth rate enhances our understanding of the life histories of species [13]. Population dynamics are the historical results of the interaction between population viability and environmental factors.
The endangered situation of T. cuspidata has attracted great attention from scholars, leading to studies of its genetic diversity [14], habitat adaptability evaluation [14], introductory suitability [15], and related nursery technology [16,17,18]. Studies on the ecological aspects of T. cuspidata populations have focused on population reproductive characteristics, survival environment [2], interspecific competition [19], population survival community biodiversity, and interspecific associations [6]. The survival and growth of the remaining population have been seriously threatened and urgently need to be protected [3]. T. cuspidata is mainly distributed in the three provinces of Heilongjiang, Jilin, and Liaoning, most of which comprise unsuitable habitats. Of a total area of 702,200 km2, the area of suitable distribution is 104,100 km2, which accounts for only 12.9% of the total area of the three provinces. Most of the suitable habitat area is located in Jilin Province, with 49,500 km2 of low-suitability area and 33,800 km2 of high-suitability area. Heilongjiang Province includes 12,900 km2 of low-suitability area and 7500 km2 of high-suitability area [3]. There have been studies on the growth status of T. cuspidata populations in Heilongjiang [2,20], but there is a lack of studies on the population status in Jilin, which is the most suitable area for T. cuspidate.
This study is based on a survey of the structural characteristics and population dynamics, which have been declining in recent years, of T. cuspidata in Northeast China. In this paper, our focus is on revealing population dynamics and choosing appropriate mathematical analysis tools to reduce errors between age and diameter, including log-linear analysis [21,22] and algorithms to identify the number of size classes that minimize error [7,23]. In addition, the results are specific to the observed population dynamics pattern of variation [24]. Understanding the structure characteristics of the T. cuspidata population is a prerequisite for understanding population dynamics and survival and for constructing suitable habitats that are consistent with the species characteristics, providing a theoretical basis for in situ conservation, and promoting artificial population restoration and reconstruction [25]. The results of the analysis are presented in the following sections: (1) the current distribution of the population and the process of population formation; (2) predicting population growth and providing scientific advice for the conservation of the T. cuspidata population.

2. Materials and Methods

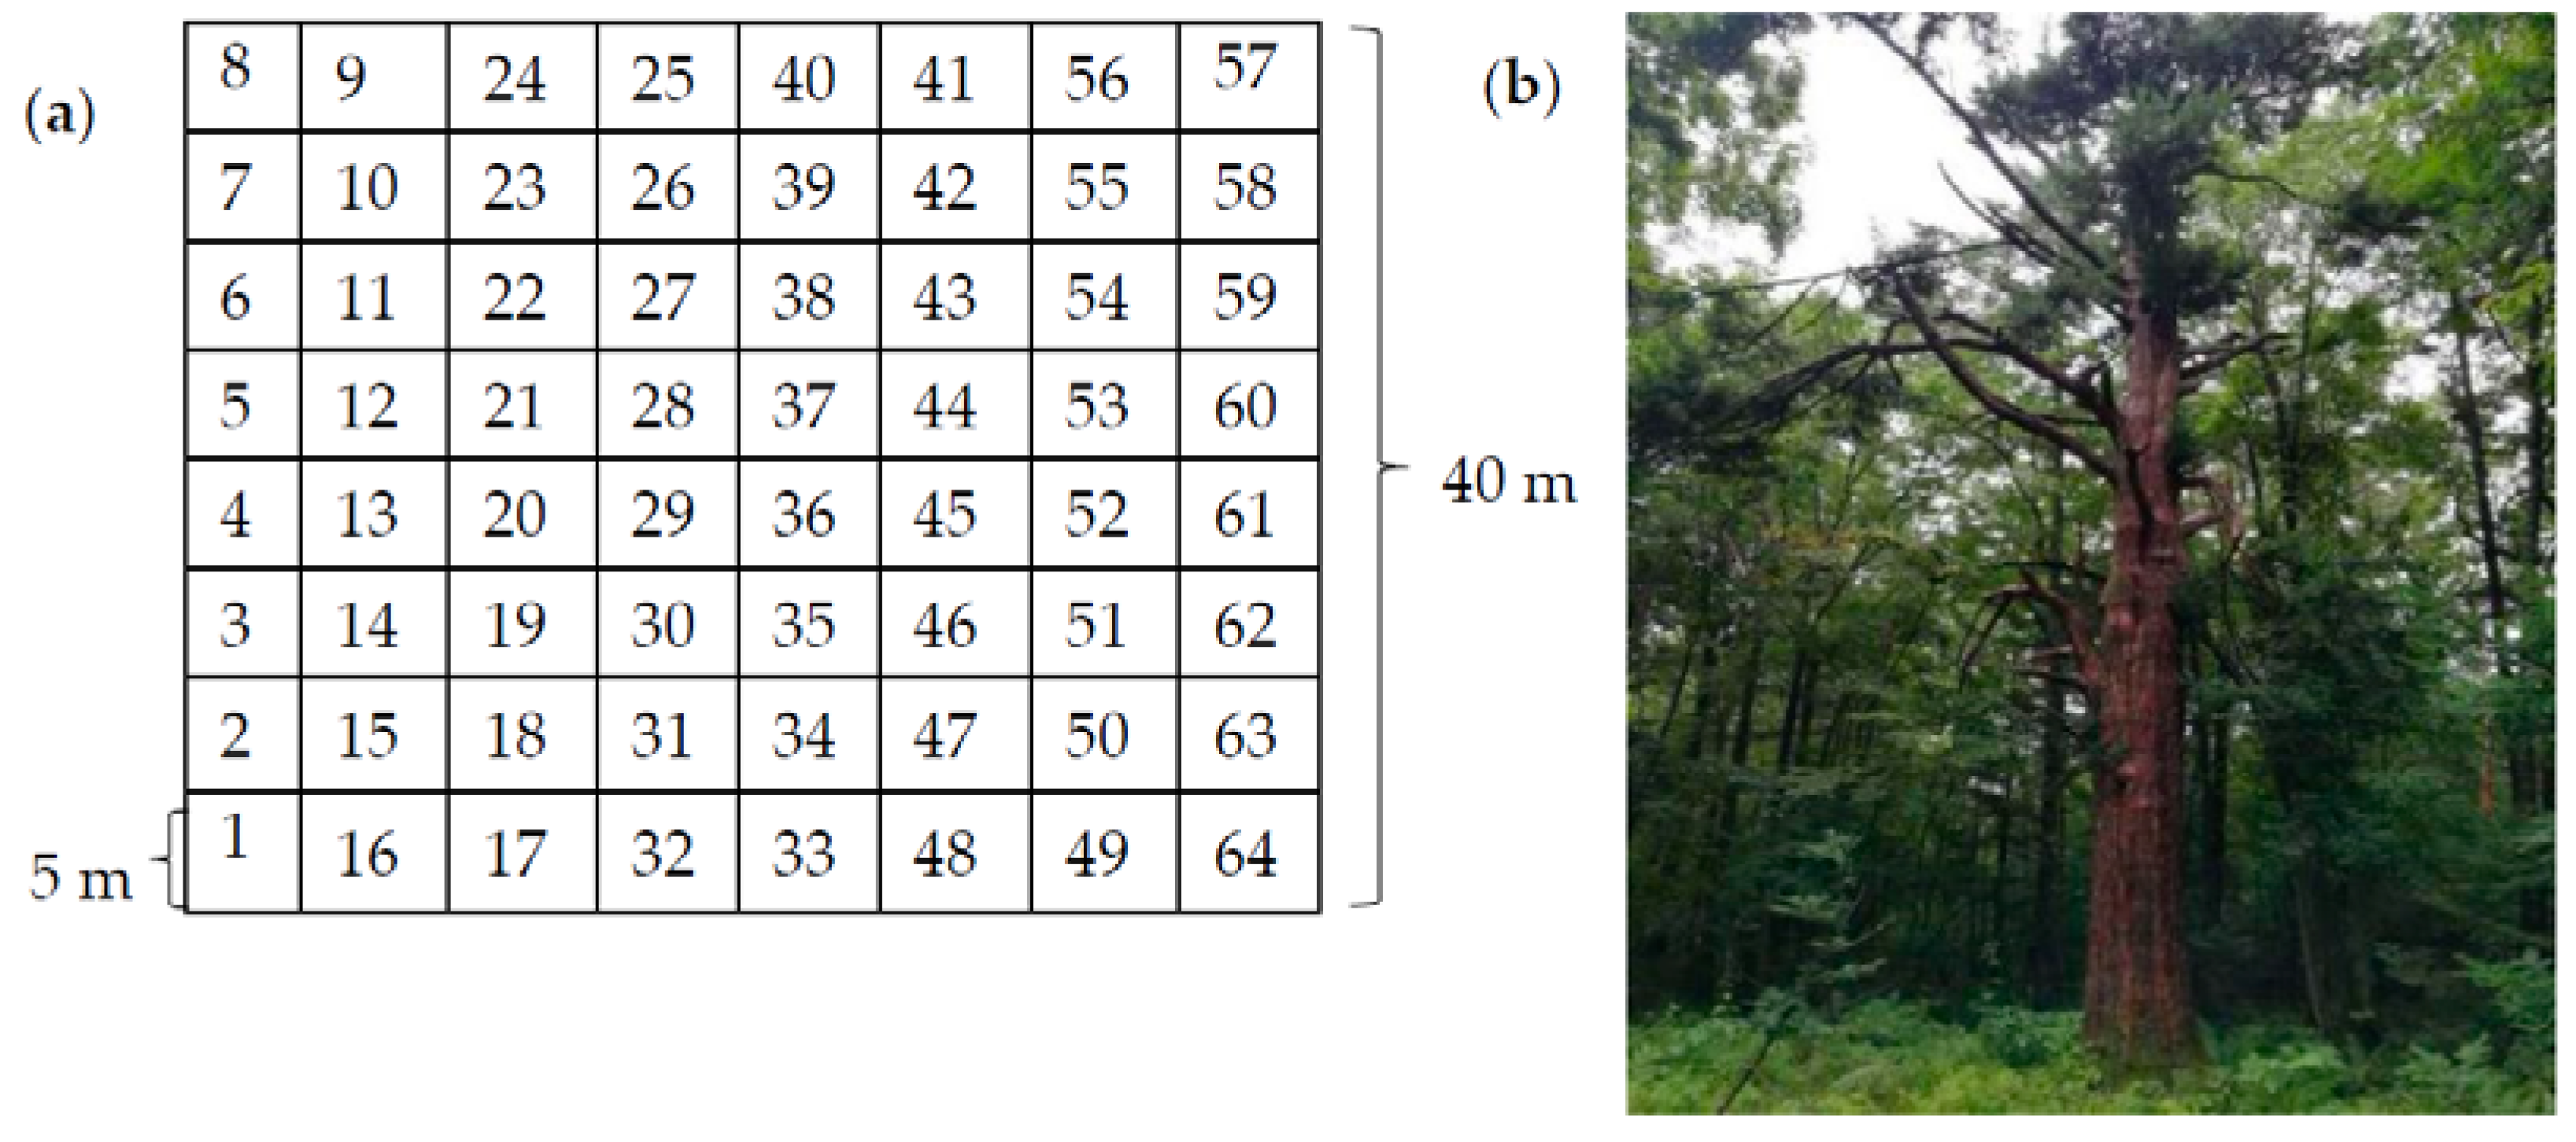
2.1. Sample Site Survey

On the basis of the recommendations of the Forestry Bureau and field surveys conducted in 2016 and 2017 in the distribution areas of T. cuspidata populations, the natural distribution of T. cuspidata was generally grasped, and representative sites in the protected areas of Helong Forestry Bureau and Wangqing Forestry Bureau were selected for community surveys. The region has a temperate continental monsoon climate with short summers and long winters. The average annual temperature is around 3.9 °C, the average annual rainfall is about 580 mm, the precipitation is mainly concentrated in May–August, the frost-free period is 110–141 days, and the annual sunshine hours are 2700 h. The soil is mainly dark brown loam with pH between 4.5 and 5.7, and the moisture content ranges from 10% to 40%. The types of forests are Pinus koraiensis, Pinus densiflora, Abies holophylla mixed forests, Pinus koraiensis mixed forests, Abies holophylla, Pinus koraiensis, and Pinus tabuliformis mixed forests [26].
The habitat factors of altitude and inclination were investigated by setting up 20 plots, each measuring 40 m × 40 m. To collect data on the tree species present in these plots, a 5 m × 5 m sample area was designated using the adjacent grid method (Figure 1). Within each sample plot, the following information was recorded for each individual tree: species name, tree height, and diameter at breast height (DBH). Additionally, the number of seedlings and saplings below 4 cm in diameter at breast height was also noted. Details of the sample plots can be found in Table 1.

2.2. Diameter Classification

Age structure is an important characteristic of population, and many scholars have used size structure analysis [27,28,29] in their studies of population structure and dynamics; sometimes, size may be a better predictor of reproductive output than age under similar forest growth conditions of compared trees [30]. As an endangered species, due to the lack of data on wood analysis and the difficulty of drilling cores to obtain tree age, the age and diameter response of the same species in the same environment is characterized by the consistency of age and diameter [31]. Considering the life history characteristics and survey data of T. cuspidata and referring to other classification methods [32,33,34,35], we chose diameter to represent age in order to study the population dynamics in practical research. The distribution of diameter classes can provide valuable insights into the competitive dynamics and overall growth potential of a forest stand [36], according to one of the basic rules of stand structure [37,38]. Based on the life cycle characteristics and the R2 between the smoothing curve and survival curve [10], we categorized a diameter class of 6 cm to compile static life table, draw survival curves, and analyze dynamic changes. Based on the life history features of T. cuspidata, those with DBH < 2.5 cm were classified as seedlings, those with 2.5 cm ≤ DBH < 4 cm as saplings, and those with DBH ≥ 4 cm as mature trees. The number of plants in each diameter class was counted in 6 cm diameter classes (upper limit exclusion method) to determine the diameter class structure (Table 2).

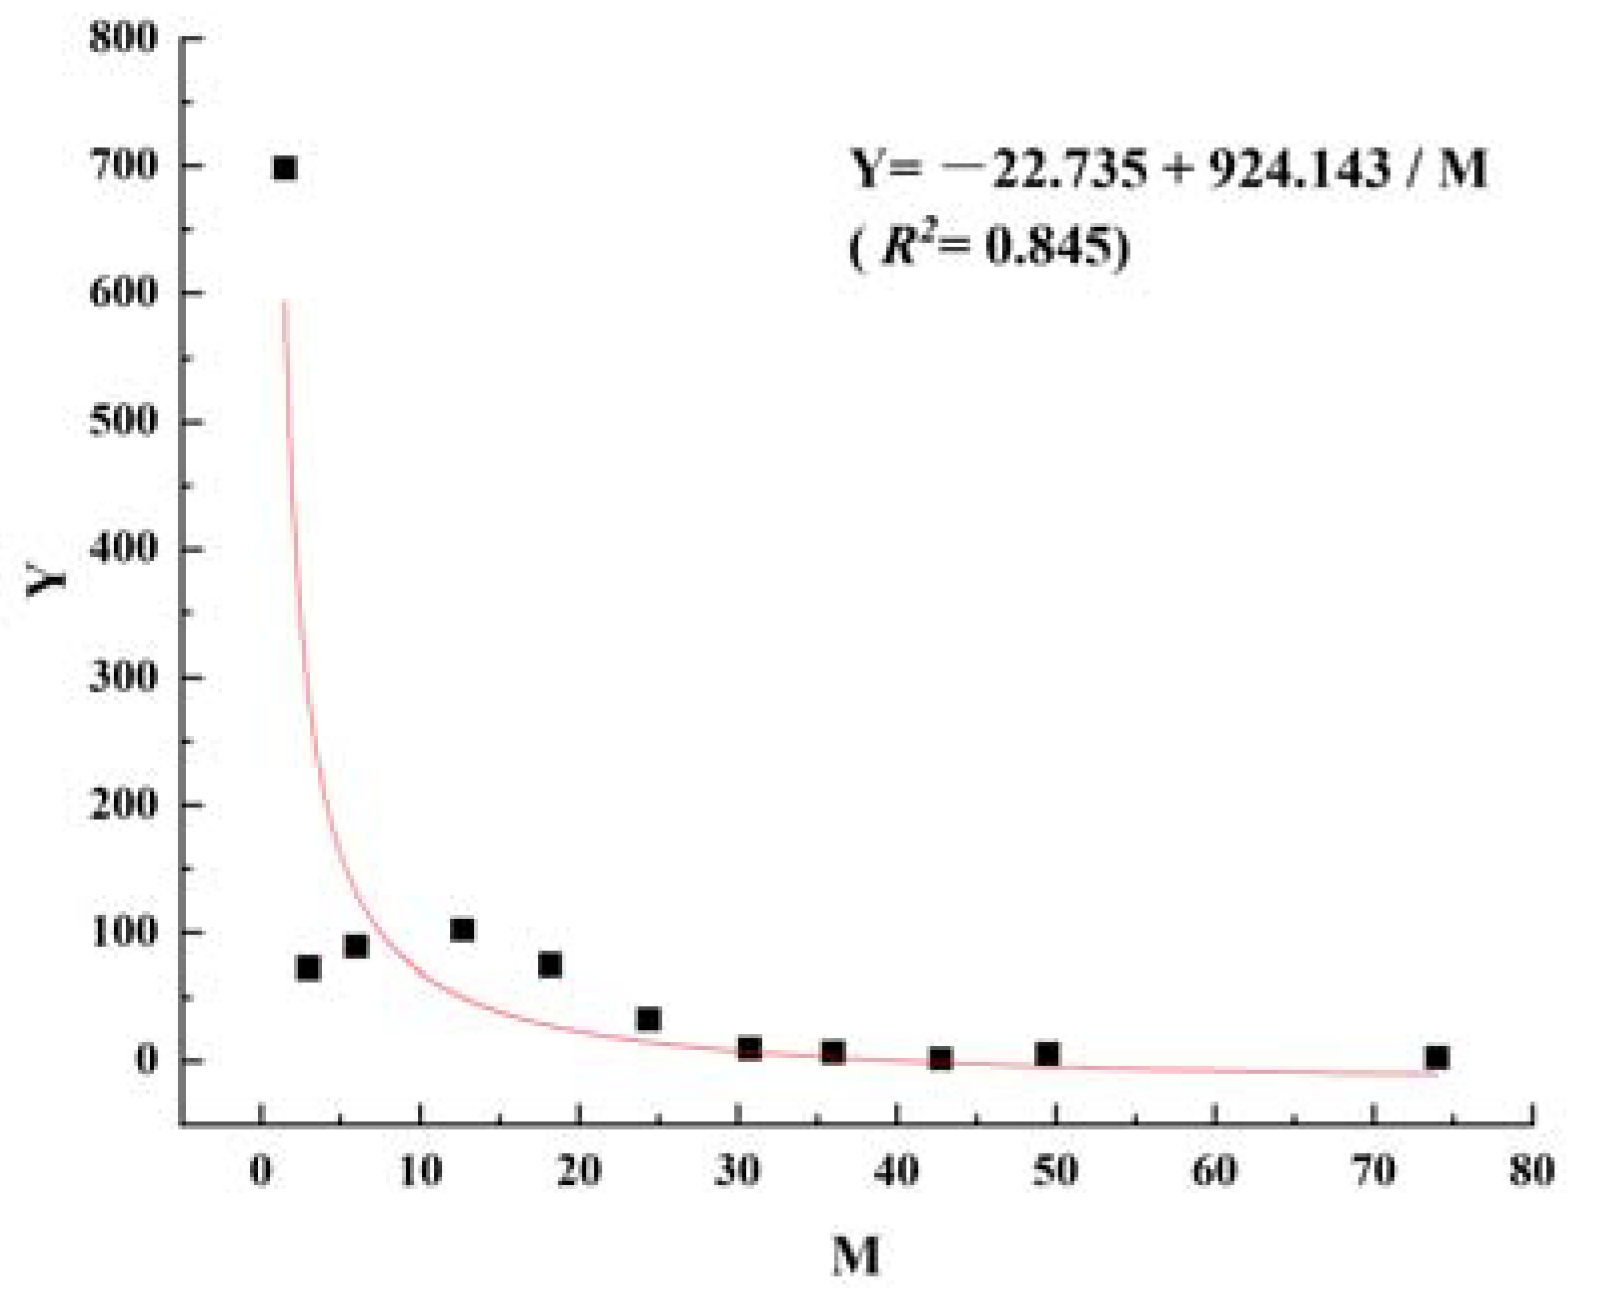
2.3. Smoothing Curve

The wild population in the study is distributed in natural forest. Additionally, the survey method used to collect data may have introduced systematic errors, meaning that the results may be skewed or biased. Furthermore, the data may not fully satisfy the three assumptions necessary for constructing a life table. A life table is a tool used to analyze mortality and survival rates in different age groups of a population. The three assumptions are that the population is closed, that mortality rates are constant over time, and that each individual has an equal chance of dying. If these assumptions are not fully met, the data may show a higher number of individuals in a certain age group than expected and may even indicate a negative mortality rate, which is not possible in reality [38]. Therefore, we used the even-slip technique [39,40] to deal with the relationship between diameter class and median in diameter class to compile a static life table (Figure 2):
Y = −22.735 + 924.143/M (R2 = 0.845)
In the formula: M is the median in diameter class; Y is the number of plants.

2.4. Static Life Table Compilation

We used diameter class structure to represent time sequence for the woody plants to construct static life table. Static life table illustrates the patterns of population change in birth and death rates and explains the survival strategies of population. The static life table, which is also known as the specific time life table, refers to the sampling within a specific time in the dynamic aging history of multiple generations overlapping in a specific population [38], which actually reflects the population profile at a specific moment. The statistical methods of related indicators in the table are as follows [41,42]:
l x = a x / a 0 × 1000
d x = l x l x + 1
q x = d x / l x
L x = ( l x + l x + 1 ) / 2
T x = L x
e x = T x l x
K x = ln l x ln l x + 1
where a0 is the actual number of survivors, and ax is the actual number of surviving individuals in diameter class x after smoothing treatment. lx is the number of survivors standardized to diameter class x, and the number of survivors of the largest survivors in each diameter class is standardized to 1000. Then, in turn, we obtained the standardized survival numbers of other diameter groups in. dx is the standardized number of dead individuals during the two adjacent diameter groups; qx is the mortality rate; Lx refers to the average number of surviving individuals (from x to x + 1); Tx is the total number of individuals; ex represents the life expectancy of an individual entering diameter class x; and Kx represents the vanishing rate.
Based on the life table, we also used four population survival analysis functions, including survival rate function S(t), cumulative mortality function F(t), death density function f(t), and hazard rate function λ(t) [43]:
S ( t ) = p 1 p 2 ...... p x
F ( t ) = 1 S ( t )
f ( t ) = ( S x 1 S x ) h x = S x 1 q x h x
λ ( t ) = 2 q x h x ( 1 + p x )
where px is the survival rate at diameter class x, and hx is the length of the interval.

2.5. Survival Curve Drawing

Survival curves describe the death rate at a specific age with the number of surviving individuals and reflects the survival status of individuals in the population at various diameters. According to Deevey’s theory [44], there are generally three basic types of survival curves. Type I is a convex curve with a high survival rate for young individuals and a high mortality rate for elderly individuals; Type II is a diagonal curve which has the same mortality rate throughout its life span. Type III is a concave curve which means the mortality rate in early years is high. In this paper, we adopted Hett and Loucks [45] exponential equation Nx = N0 e−bx (Nx is the value of lnlx, x is the diameter class, and N0 and b are constants) to describe the Deevey II curve, the power function Nx = N0 x−b (Nx is the value of lnlx, x is diameter class, N0 and b are constants) to describe the Deevey III curve. Then, the corresponding model was established after SPSS 19.0 fitting for comparative analysis.

2.6. Dynamic Analysis of Population Structure

Chen Xiaode [46] population and community structure dynamic quantitative analysis method is used to quantitatively describe the population structure: three dynamic indexes of Vx, Vpi, and Vpi. When the population diameter class structure dynamic change index Vn, Vpi, Vpi is a positive value, a negative value, and a zero value, it corresponds to the dynamic relationship of growth, decline, and structural stability, respectively. If, in the future, the interference of external k and Sn will cause dilution effect, the maximum probability value can be calculated based on the k and Sx conditional probability method as Vpi formula. Vpi can also be used as an index to measure the sensitivity of population structure changes to random interference [47]. These indexes indicate population growth when Vpi and Vpi are greater than 0; they indicate population decline when they are less than 0; and they indicate that the population is stable when they are equal to 0.
The specific calculation formula of each dynamic index is as follows:
V x = ( S x S x + 1 ) max ( S x , S x + 1 ) × 100 %
V pi = x 1 k 1 ( S x V x ) x = 1 k 1 S x
Dynamic index of population changes when considering external disturbance Vpi:
V p i = x = 1 k 1 ( S x V x ) K × min ( S 1 , S 2 , , S k ) x = 1 k 1 S x
In the formula, the dynamic index of population quantity change in the natural state, Vx, represents the individual dynamics from x to x + 1 diameter class; Vpi is the dynamic index of population quantity change, Sx and Sx+1 represent the the number of individuals in x and x + 1 diameter class, respectively, k is the largest diameter class, and max/min (…) uses the maximum/minimum value of the number sequence in parentheses.

2.7. Time Series Forecasting

In this study, based on the number of survivals in each diameter class, we use a moving average method of time series analysis [36,39] to predict the subsequent population future development trend in 2, 5, and 10 diameter class; the model is as follows:
M n = 1 n k = x n + 1 x D x
where x represents the diameter class; n represents predicted diameter classes; Mn is the moving average of the n-th cycle, which is the number of individuals in the x-diameter class group after n diameter class; and Dx represents a0 in the x-diameter level.

3. Results

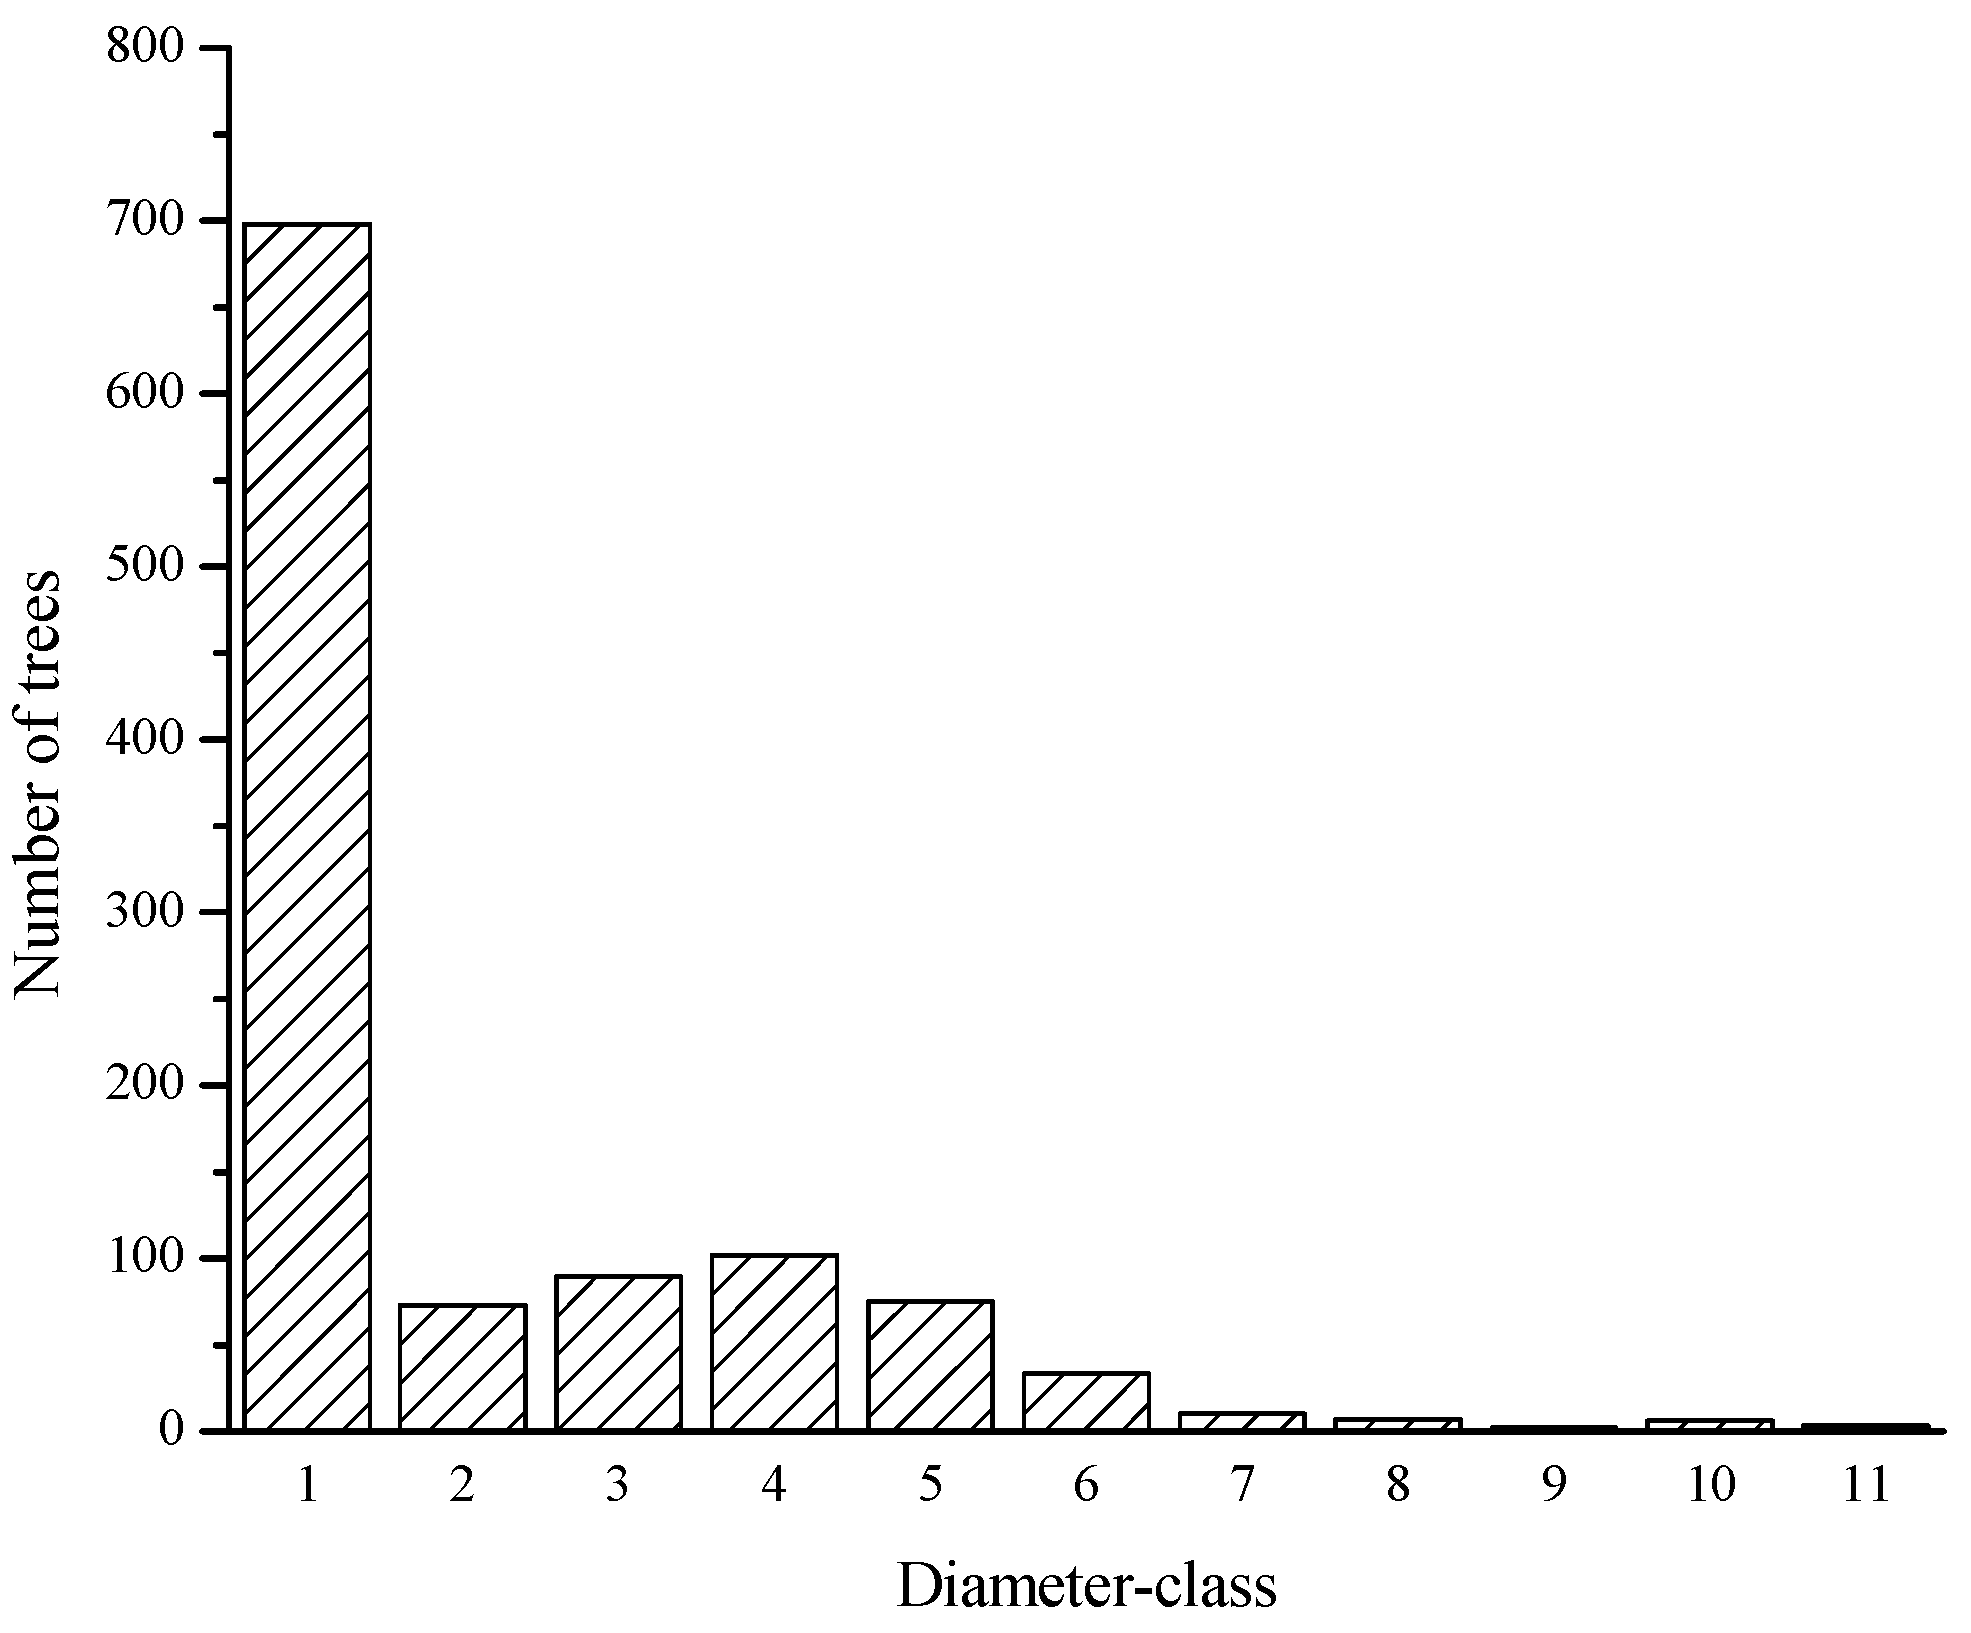
3.1. Population Size Structure of Taxus cuspidata

According to the analysis of the diameter class structure in this survey (Figure 3), the diameter class structure of T. cuspidata is relatively complete and the population diameter class structure is an inverted L-shape. The number of seedlings is the greatest among all diameter classes, which accounts for 63.57%. During the transition from seedling to saplings, there is a great decrease in the number of T. cuspidata (89.54%). The survival rate of seedlings is low, and the survival rate of saplings is considerable. The number of adults between diameter class 3 and diameter class 6 is stable, accounting for 27.23%, among which diameter class 4 is the largest, accounting for 9.29%. The proportion of individuals in the large-diameter class gradually decreases, and there are a certain number of large-diameter individuals in the population. Large-diameter plants, from diameter class 7 to 11, account for 2.55%. There is a phenomenon of missing individuals in the large-diameter class, and the number of individuals in the large-diameter class is sparse. On the whole, the diameter class structure shows a trend of the number of individuals gradually decreasing as the diameter class increases (Figure 3).

3.2. The Static Life Table of Taxus cuspidata

From the static life table (Table 3), we found that the number of surviving individuals lx after standardized smoothing treatment gradually slowed down and levelled off as the diameter class increased. The smoothly processed data may neglect certain ecological phenomena in population development [48]. When we compared ax with lx, the trend in the data showed consistency. And there are two small peaks in the death rate and vanishing rate (Figure 4). The maximum values of death rate qx and vanishing rate Kx appear when diameter class 3 transitions to diameter class 4. A greater mortality rate (61.89%) occurred in diameter class 3. The second largest mortality rate in qx and Kx all appeared when diameter class 7 transitioned to diameter class 8. With the increase in diameter class, a death peak (59.89%) appeared when entering diameter class 7. Compared with the mortality and vanishing rate of other diameter classes, this was more obvious. In addition, the individual life expectancy ex is less than 10 in diameter class 1, 2, and 3, which indicates that the population fluctuates greatly at low diameter.

3.3. Survival Curve of Taxus cuspidata

Population survival curves were plotted based on the logarithmic values of population survival numbers (lnlx) and their corresponding age classes from the static life table and simulated using the exponential and power function models (Figure 5) constructed by Deevey for type II and III survival curves, respectively [45,46]. The fitting results are as follows:
D ee v e y   II :   N x = 12.271 e 0.270 x   ( R 2 = 0.930 )
D eevey   III : N x = 13.136 x 1.062   ( R 2 = 0.725 )
where N is the lnlx, which is the logarithm of population survival; x is the diameter class.
According to formula fitting, the survival curve of the T. cuspidata population has a higher correlation with the Deevey II curve. The diameter class is used as the x-axis and lnlx as the y-axis to plot the survival curve of T. cuspidata (Figure 5). It can be seen that the survival curve is a significant Deevey II type which is diagonal, and the mortality rate is stable in all stages of population development.

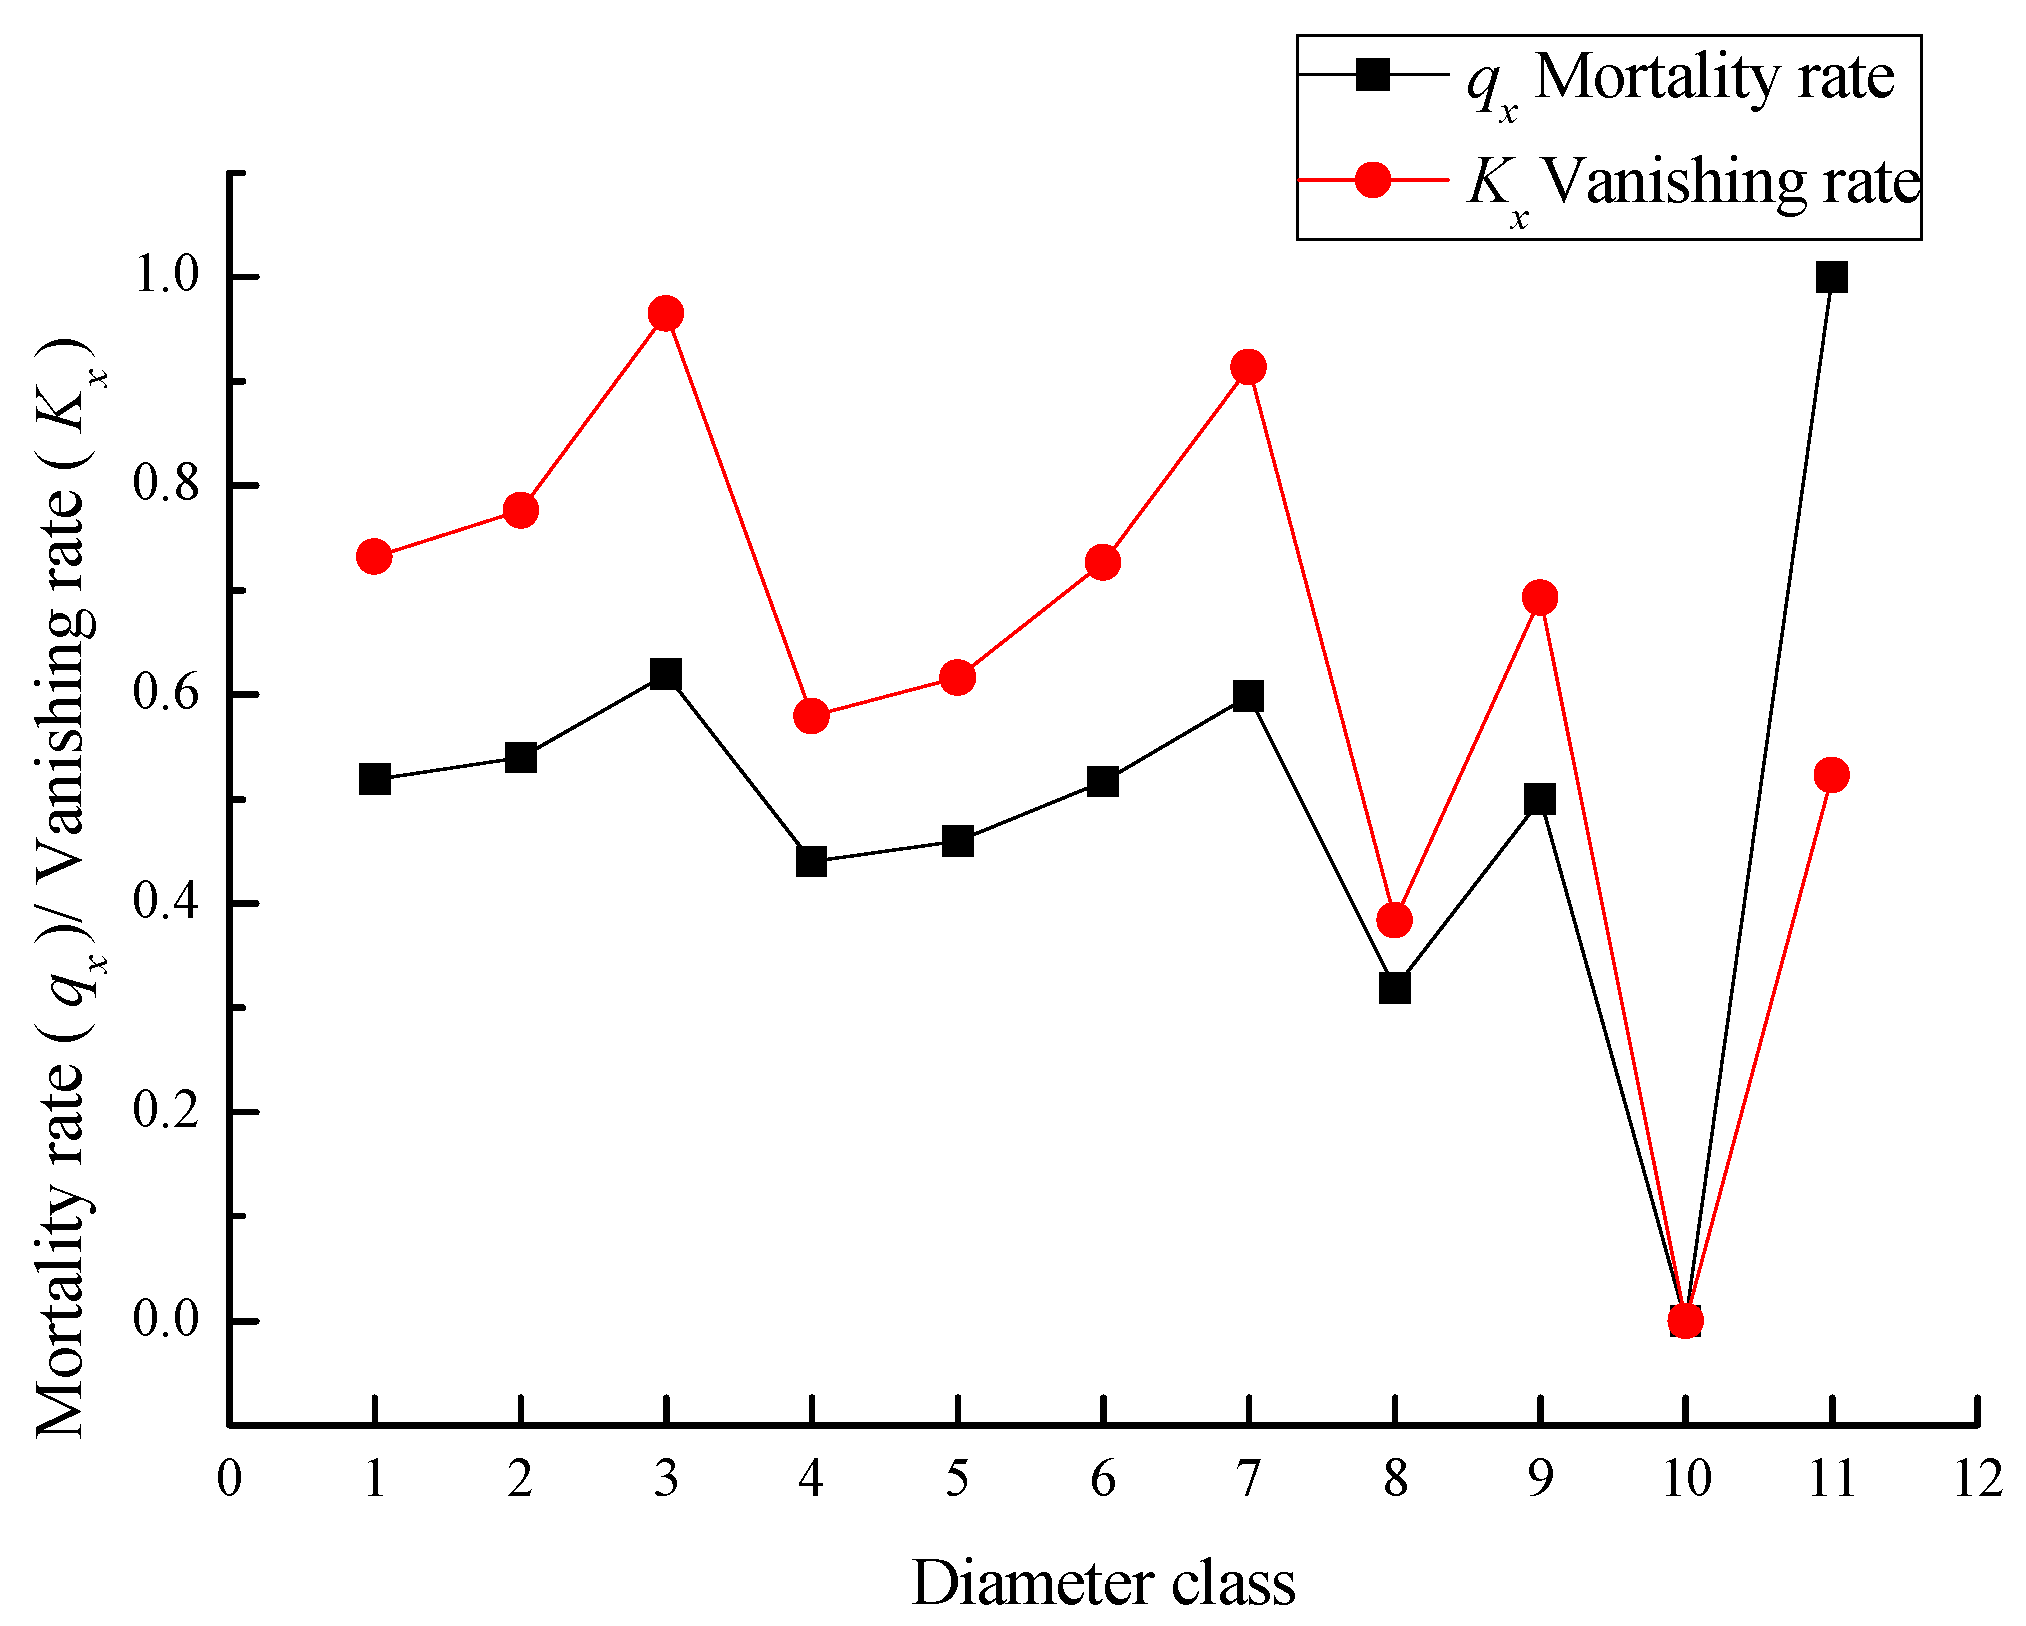
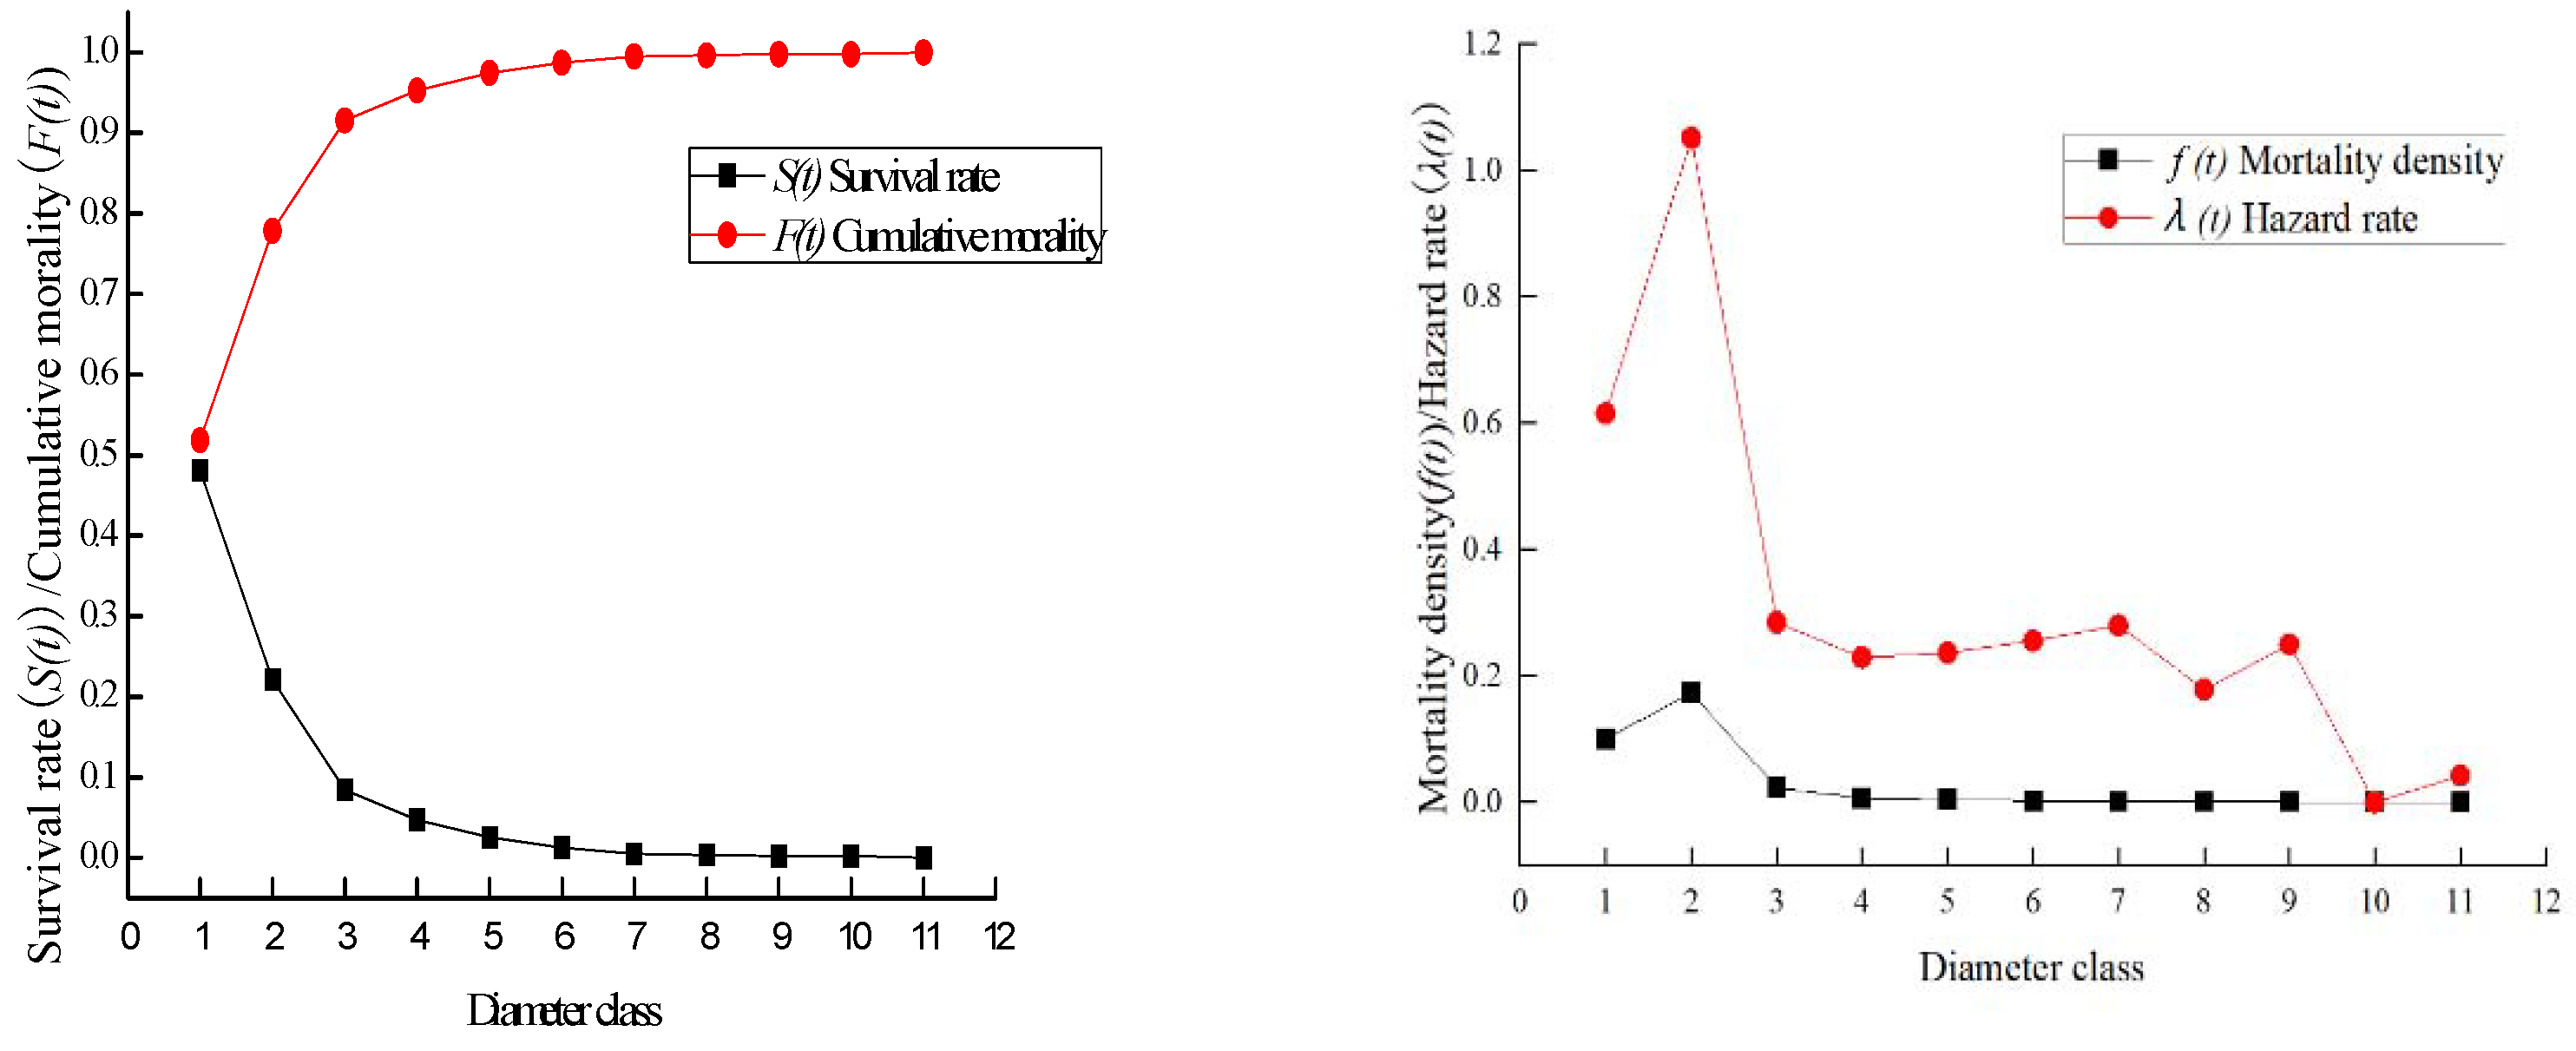
3.4. Population Survival Analysis of Taxus cuspidata

In order to explain the changing trend of T. cuspidata population dynamics, we drew a graph of the survival function based on the static life table (Figure 6). It can be seen that mortality has the same changing trend with vanishing rate (Figure 4), and there are certain fluctuations in diameter class 3 and 7 in the development of the population. The survival rate gradually decreases, the cumulative death rate gradually increases, and both of the changing trends were sharp in the early stage and flatter in the later stage. And the death density curve is basically smooth, less than 3.0%, which shows that the death density of the young and middle-aged is higher than that of the old-aged. The hazard rate curve fluctuates greatly, and it also shows that the risk rate in the low-diameter class is higher than in the large-diameter class. The four survival function curves show that the population dynamics demonstrate a rapid decline in the early stage and are relatively stable in the later stage.

3.5. Dynamic Analysis of Population Structure of Taxus cuspidata

According to the quantitative analysis results of the individual number in each diameter class (Table 4), there is a large fluctuation phenomenon in the contribution potential between diameter classes in population development. V2, V3, and V9 are all less than zero, indicating that the T. cuspidata population is in a trend of population decline when the diameter class is 2, 3, and 9. There is fluctuation in diameter class 9, which may be due to human interference. The population structure dynamic indexes in the other diameter stages are all greater than zero, indicating that the population of T. cuspidata is growing at most diameter stages. The dynamic index of the population structure Vpi = 0.6395 when ignoring external environmental interference. When considering external environmental interference, the index is Vpi = 0.0291, which is close to 0, suggesting that the population structure is less likely to be growth-oriented and tends to be stable. In terms of the overall dynamic index, Vpi is positive, indicating that the population structure is a growth-type. Vpi is much less than the Vpi value, indicating that the population is highly sensitive to external environmental disturbances. Or it indicates that the population is highly influenced by external disturbances, but the population is highly resistant to disturbances. In summary, the population is a growth-stable population with a declining trend at young ages and a relatively stable state overall.

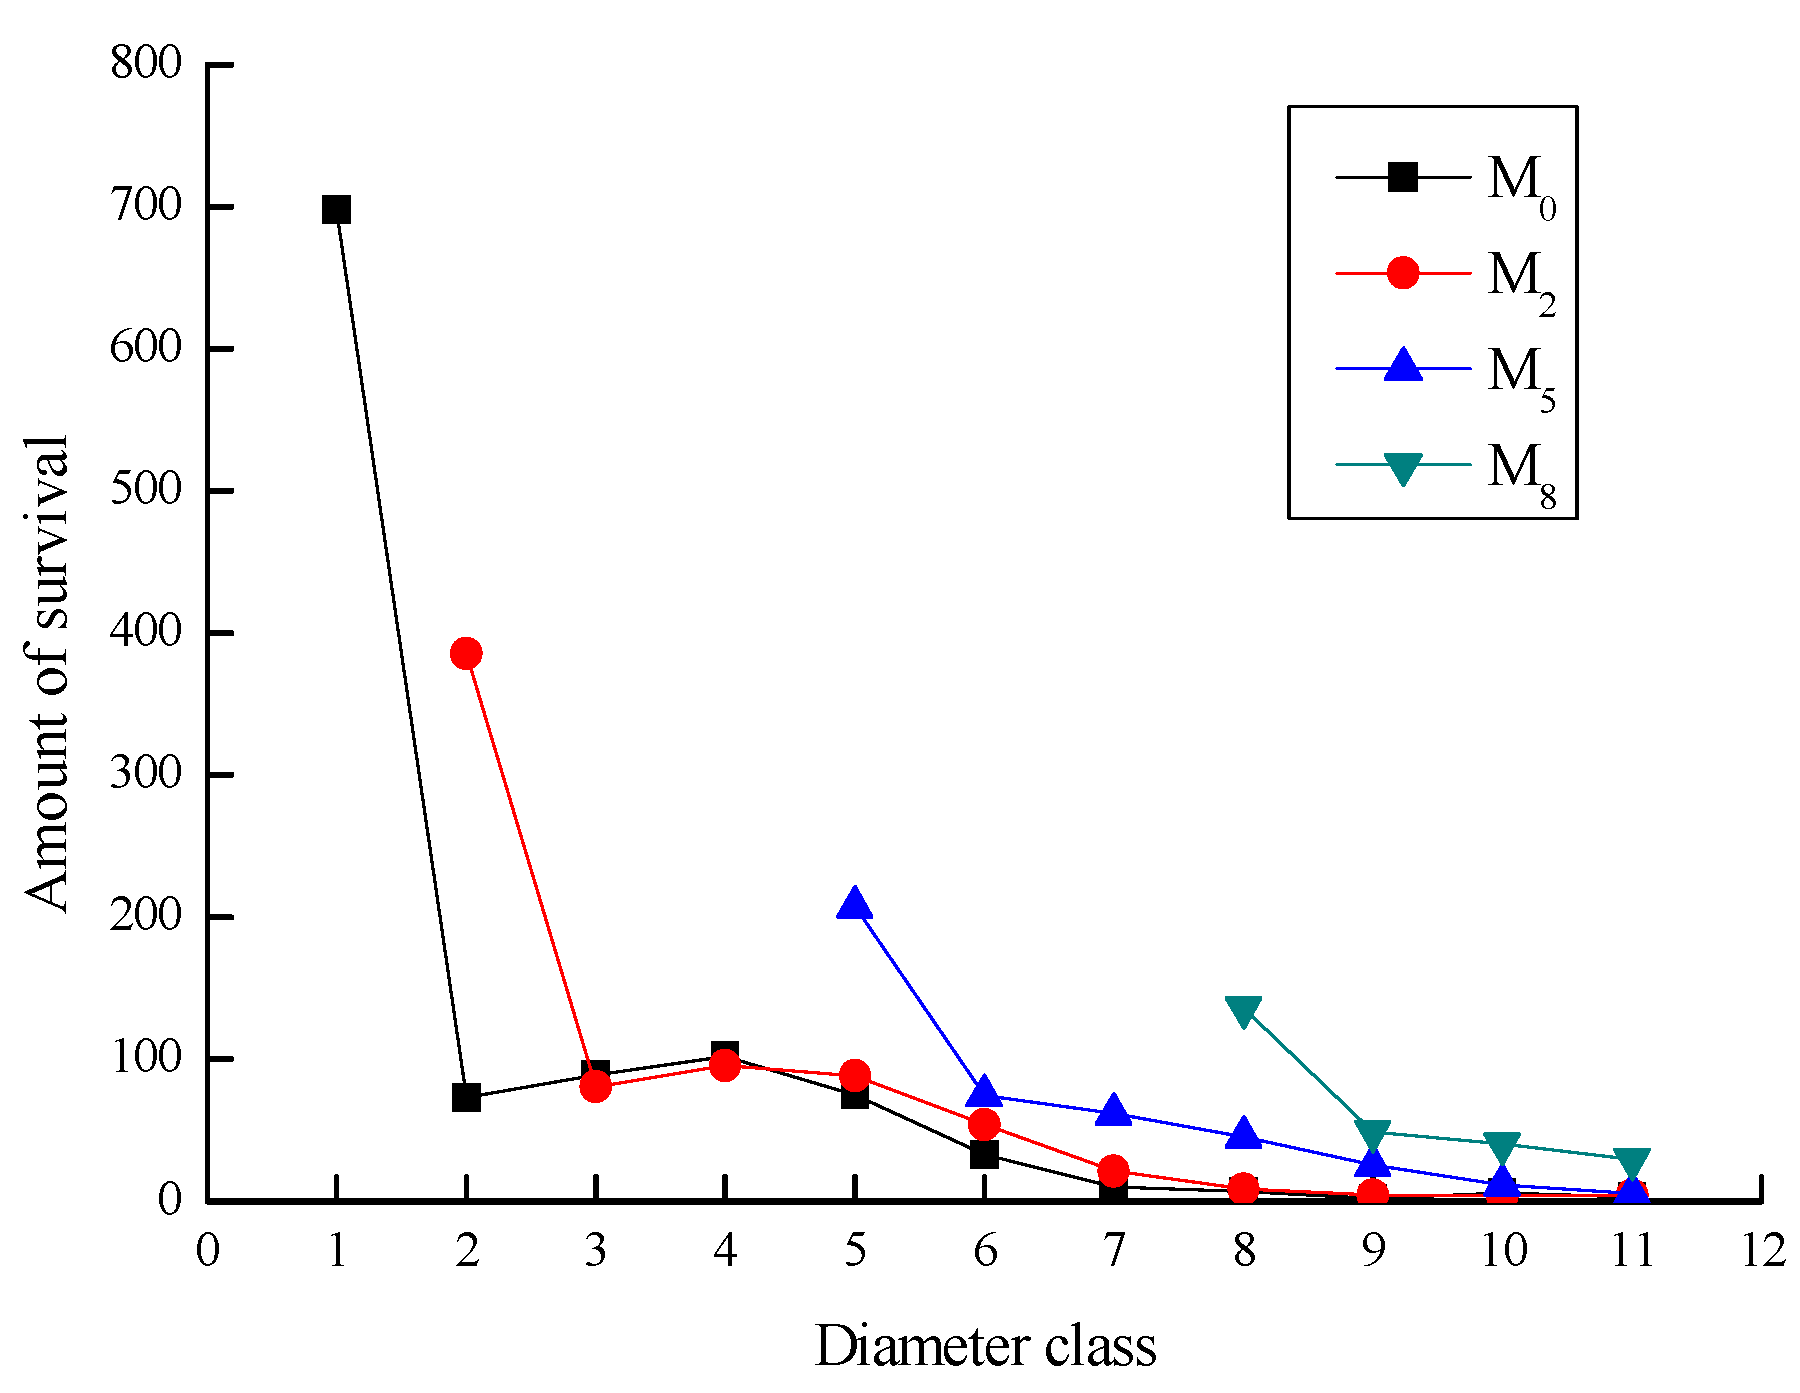
3.6. Dynamic Prediction of Taxus cuspidata Population

The stability of T. cuspidata was analyzed and the possible changes of population were simulated based on the population pattern of plants at each diameter level (Figure 7). After two diameter classes of time, the individual number in diameter class 2 and diameter classes 5–7 was increased; after five diameter classes of time, the number of individuals in diameter class 5 increased significantly and the number of individuals in diameter classes 6–10 increased slightly; after eight diameter classes of time, the number of individuals in diameter class 9 increased significantly and the number of individuals in diameter classes 9–11 increased slightly. The overall variation is that the number of individuals in large-diameter classes increases, and the population stabilizes, with an increase in diameter class.

4. Discussion

4.1. Population Structure Analysis

The number of seedlings was significantly higher than the number of individuals in the larger-diameter classes, and a large number of young individuals in the population in diameter classes 1, 2, and 3 (0 cm ≤ DBH < 10 cm) were able to survive under the main forest layer occupied by various dominant trees in the community, indicating that germination and seedling growth were adapted to be completed in a shaded environment. And we found that it was difficult for its seedlings to grow into young and small trees, due to the fact that other tree species occupied the upper layer for a long time. When the population reached a certain threshold, with the increase in individuals’ demand for nutrients and living space, the overlap with neighboring individuals and upper trees increased and the competition for living space among individuals intensified. But the environmental loading capacity reached its limit, resulting in self-thinning and combing due to density constraints. In this study, the first peak of population mortality may be attributed to the increase in intraspecific and interspecific competition. The population of T. cuspidata showed a rapid decline with increasing age, making it more difficult to enter the succession layer through strong environmental filtering. Most seedlings either grow slowly and wait to enter the main forest layer or gradually die while waiting. It is difficult for these seedlings to grow into small- and medium-sized trees, which is related to the competition for light and nutrients within and among species. To overcome these obstacles, a suitable balance between light availability, nutrient availability, and competition management is crucial for the successful growth and development of T. cuspidata.
The population size fluctuated in diameter class 9 (40 cm ≤ DBH < 46 cm), and it is speculated that the population suffered from strong anthropogenic disturbance and deviated from a stable population structure. During the period from the 1950s to 1990s, there was a significant increase in unlawful logging, particularly targeting large-diameter plants. This had detrimental effects on the stand type and structure of forests. The logging activities resulted in the destruction of mature and old trees that held higher economic value [13]. Luckly, the forests were left with a substantial soil seed bank, which played a crucial role in the subsequent regeneration of the forests. Furthermore, the logging activities had a profound impact on the distribution of habitats, leading to habitat fragmentation. This fragmentation posed a major challenge for the development of the population. Therefore, logging is considered the primary culprit behind habitat fragmentation, which has had significant implications for the population dynamics of the species in question. The study by Diao Y.F [20] on the structural characteristics of T. cuspidata in Muling of Heilongjiang concluded that the middle-aged, mature, and old trees in Murong are relatively stable and abundant, which is also consistent with the findings of our paper, indicating that T. cuspidata can form a large number of large-diameter populations and maintain population stability. And the survival curves did not show the complete Deevey’s classification because there were only three individuals with 8 cm ≤ DBH < 16 cm in the Muling area. In addition, the results of Liu T. [2] showed that the natural population of T. cuspidata in the nature reserve had a large population size and relatively concentrated distribution, but the population structure was unreasonable, with a large number of seedlings and large-diameter individuals in the renewal layer and few individuals in the succession layer. In this paper, the dynamics of the natural populations in Jilin were studied to remedy this deficiency and to describe the structural characteristics of the population in a more comprehensive diameter structure. It can also be further proved that the environment in Jilin is indeed a highly suitable area for T. cuspidata [14].

4.2. Population Dynamics Analysis and Conservation Recommendations

The dynamic index showed that there were large fluctuations in the contribution potential between diameter classes in the process of population development, and V2, V3, and V9 were all less than 0. Regarding the analysis of the overall dynamic index, Vpi was positive, which indicated that the population structure of T. cuspidata was growth-oriented. The fact that Vpi was much less than Vpi indicated that the population was more sensitive to external environmental disturbances. And when the external environmental disturbances were considered, Vpi= 0.0291, the dynamic index (Vpi) was greater than 0, but close to 0, which indicated that the population is more sensitive to external environmental disturbances—even moderately intense human activities. Further, under external disturbances, the T. cuspidata population tends to be stable and shows some resistance to disturbance. So, the establishment of in situ reserves is a key measure to maintain T. cuspidata habitat integrity, prevent or slow down the decline of the population structure, and protect this rare and endangered species effectively.
The choice of appropriate measures will depend on the causes of the decline [12]. According to the results of the static life table and dynamic indices, the T. cuspidata population undergoes a total of two fluctuations in its growth and developmental stages, one during juvenile age and the other in diameter class 9. The first fluctuation is related to the competition for light and nutrients within and among species. Based on our analysis, we conclude that the second fluctuation observed, in diameter class 9, is likely attributable to human disturbance. This conclusion is drawn from two main pieces of evidence. Firstly, the survival curve for this diameter class follows a significant Deevey II pattern, which is characterized by a diagonal curve, indicating stable mortality rates across all stages of population development. This suggests that the mortality rate for trees in diameter class 9 remains consistent over time, indicating external factors influencing the population. Secondly, the existence of a large number of large diameter trees is consistent with the hypothesis of unlawful logging. Typically, a healthy forest population would display a more balanced distribution of tree diameters, with a gradual decrease in numbers as diameters increase, just like our time series prediction. However, an abrupt increase in the number of large diameter trees suggests that selective logging or illegal activities targeting specific tree sizes have occurred. So, it is important to take into account the specific local environmental conditions and to strengthen the protection of mature trees from felling and logging. The temporal prediction curves indicate that the proportion of large-diameter individuals increases after the population has passed through the seedling and juvenile stages. The population in Jilin is a stable population with a low growth rate, and the conservation of this population should take into account the local environmental conditions. Different conservation measures should be adopted for the population with different diameter structures under anthropogenic disturbance. We need to reduce anthropogenic disturbance and enhance the population of saplings and seedlings at the same time. As the large-diameter populations are rare and few in the wild, we recommend allowing them to grow naturally through enclosure protection. But this may lead to a further decline in population after the mature mother tree has reached its fruiting peak. And random simulation studies have shown that even large existing populations in nutrient-rich areas are unlikely to survive in the long term unless favorable conditions for establishing young plants are restored [49]. According to Su [50], both natural T. cuspidata and transplants of T. cuspidata are characterized by high genetic diversity, no apparent genetic structure, and abundant gene flow, suggesting that this population is recently endangered. In addition, integration analyses conducted by Aguilar et al. [51] and Vranckx et al. [52] showed that the longer widespread species, recently endangered allopatric species, and forest tree species persist in fragmented habitats—which is more detrimental to the recovery of their genetic diversity and the maintenance of their allopatric breeding systems—and they are highly susceptible to the loss of genetic diversity in future generations. The adverse effects of severe habitat fragmentation may be partially offset by frequent gene exchange [53]. These measures can be crucial in ensuring the long-term conservation of species in fragmented habitats. Let us examine each measure in detail: 1. Conservation and expansion of the mother tree population: by conserving and expanding the population of mother trees, we ensure that there are enough individuals producing viable seeds or other reproductive structures. This allows for gene exchange to occur through sexual reproduction, increasing genetic diversity within the population. 2. Preservation of germplasm resources: germplasm refers to the genetic material of plants, including seeds, pollen, and tissue cultures. By preserving a diverse range of germplasm resources, we maintain a bank of genetic diversity that can be used for future gene exchange. This involves collecting and storing seeds, pollen, or tissue samples from different individuals or populations. 3. Establishment of pollen banks: pollen is the male reproductive structure of plants, and it plays a crucial role in gene exchange. By establishing pollen banks, we can collect and store pollen from a variety of individuals or populations. This ensures that specific genetic traits can be introduced or maintained through artificial pollination, even if individuals or populations are not geographically close to each other. Moreover, measures such as artificially assisted pollination, lifting seed dormancy, and timely replenishment of the seed bank can also be carried out among fragmented habitats to maintain genetic connectivity among populations and population stability during long-term conservation of the species [50,54]. Therefore, this study suggests that while conserving wild populations, in situ conservation of remaining populations, relocation of germplasm resources, and reduction of human activities will be beneficial to the long-term survival of these endangered species and that natural habitat restoration and relocation of conservation efforts should be carried out in order to increase the size of the population and genetic diversity. Furthermore, it is necessary to take further effective conservation measures for T. cuspidata and other dominant species in the community to protect the seed stock and ecological balance of the community and ensure the development and survival of the seed bank of other dominant species in the absence of large-diameter T. cuspidata [55]. Conservation actions for this threatened plant should focus on protecting seedlings so that they grow into mature trees and on the existing population; this strategy is the key element to increasing the population size and to ensuring the persistence of the population [56].

5. Conclusions

The static life table suggested that the population of T. cuspidata was of a stable type overall, and the population survival curve tended to be Deevey Ⅱ in Jilin. The diameter-class structure of T. cuspidata was stable overall, and the dynamic indices showed that the mortality rate of young individuals was high and the population was influenced by external disturbances and showed some resistance to human disturbance. Time sequence prediction analysis showed that natural renewal could be maintained and the population size would remain at a certain amount in the future. The result can prove that the Jilin region is a highly suitable area for the growth of T. cuspidata in Northeast China. In situ conservation of remaining wild populations, relocation of germplasm resources, and reduction of human activities are recommended as actions that will be beneficial to the long-term survival of T. cuspidata.

Author Contributions

Writing—riginal draft, D.L.; Writing—review & editing, Z.G.; Visualization, X.C. and C.F. All authors have read and agreed to the published version of the manuscript.

Funding

This research was funded by National Key Research and Development Program grant number 2022YFF1300502-02 and Key R&D Projects of the Ministry of Science and Technology grant number 2016YFC0503100.

Data Availability Statement

Not applicable.

Conflicts of Interest

The authors declare no conflict of interest.

References

  1. Zang, R.G.; Cheng, K.W.; Li, J.Q.; Zhang, W.Y.; Chen, X.F.; Tao, J.P. Natural Forest Biodiversity Conservation and Restoration; Science and Technology Press: Beijing, China, 2005; pp. 464–480. (In Chinese) [Google Scholar]
  2. Liu, T. Population Ecology of Natural Japanese Yew; Northeast Forestry University: Harebin, China, 2007; pp. 1–2, (In Chinese with English abstract). [Google Scholar]
  3. Chen, J.; Long, T.; Yang, L.; Wang, Y.; Xu, C.; Li, J.W. Habitat suitability assessment of Taxus cuspidata. J. Beijing For. Univ. 2019, 41, 51–59, (In Chinese with English abstract). [Google Scholar]
  4. Menges, E.S. Population viability analyses in plants: Challenges and opportunities. Trends Ecol. Evol. 2000, 15, 51–56. [Google Scholar] [CrossRef]
  5. Dang, H.; Zhang, Y.; Zhang, K.; Jiang, M.; Zhang, Q. Age structure and regeneration of subalpine fir (Abies fargesii) forests across an altitudinal range in the Qinling Mountains, China. For. Ecol. Manag. 2010, 259, 547–554. [Google Scholar] [CrossRef]
  6. Dolanc, C.R.; Thorne, J.H.; Safford, H.D. Widespread shifts in the demographic structure of subalpine forests in the Sierra Nevada, California, 1934 to 2007. Glob. Ecol. Biogeogr. 2013, 22, 264–276. [Google Scholar] [CrossRef]
  7. Diao, Y.F.; Jin, G.Z.; Tian, S.Y.; Liu, Y.K.; Liu, Y.L.; Han, L.D.; Li, Y.H. Species composition and community structure of a Taxus cuspidata forest in Muling nature reserve of Heilongjiang province, China. Sci. Silvae Sin. 2016, 52, 26–36, (In Chinese with English abstract). [Google Scholar]
  8. Easterling, M.R.; Ellner, S.P.; Dixon, P. Size specific sensitivity: A new structured population model. Ecology 2000, 81, 694–708. [Google Scholar] [CrossRef]
  9. Ramula, S.; Kerr, N.Z.; Crone, E.E. Using statistics to design and estimate vital rates inmatrix population models for a perennial herb. Popul. Ecol. 2019, 62, 53–63. [Google Scholar] [CrossRef]
  10. Werner, P.A.; Peacock, S.J. Savanna canopy trees under fire: Long-term persistence and transient dynamics from a stage-based matrix population mode. Ecosphere 2019, 10, e02706. [Google Scholar] [CrossRef]
  11. Gao, W.Q.; Ni, Y.Y.; Xue, Z.M.; Wand, X.F.; Kang, F.F.; Hu, J.; Gao, Z.H.; Jiang, Z.P.; Liu, J.F. Population structure and regeneration dynamics of Quercus variabilis along latitudinal and longitudinal gradients. Ecosphere 2017, 8, 1–15, (In Chinese with English abstract). [Google Scholar] [CrossRef]
  12. Jin, H.; Zhao, Y.; Yin, H.; Qin, L.W.; Liu, L.J.; Wang, C.; Jia, X.; Li, B.Y. Quantitative characteristics and dynamic analysis of the endangered species Rhododendron chrysanthum population in Changbai Mountain. Chin. J. Ecol. 2017, 36, 3123–3130, (In Chinese with English abstract). [Google Scholar]
  13. Kroon, H.D.; Groenendael, J.V.; Ehrlen, J. Elasticities: A review of methods and model limitations. Ecology 2000, 81, 607–618. [Google Scholar] [CrossRef]
  14. Wang, D.D.; Zhang, Y.W. Identification and genetic diversity analysis of Taxus cuspidata hybrid. J. Northeast Norm. Univ. 2019, 51, 113–118, (In Chinese with English abstract). [Google Scholar]
  15. Wu, S.X.; Liu, Y.H.; Zhang, L.M.; Shang, F.Q.; Tan, C.Q. Growth stability analysis of ex situ conservation of Taxus cuspidata seedling from different sources. J. Northeast Norm. Univ. 2018, 40, 27–37, (In Chinese with English abstract). [Google Scholar]
  16. Wang, T. Study on Taxus cuspidata var Seeding Raising Technology; Northeast Normal University: Harebin, China, 2017; pp. 11–22, (In Chinese with English abstract). [Google Scholar]
  17. Liu, T.; Xu, H.Y.; Jin, H.Y.; Zhang, Y.H.; Zhou, Z.Q. Diurnal changes of chlorphyll fluorescence characteristics of Japanese Yew seedlings under different light conditions. Bull. Bot. Res. 2015, 35, 848–853, (In Chinese with English abstract). [Google Scholar]
  18. Liu, T.; Jin, H.Y.; Xu, H.Y.; Zhou, Z.Q.; Zhang, Y.H. Diurnal changes od photosynthetic characteristics of Taxus cuspidata seedlings under different light conditions. J. Northeast Norm. Univ. 2015, 37, 67–72, (In Chinese with English abstract). [Google Scholar]
  19. Li, Y.L. Interspecific Relationship of the Taxus cuspidata; Northeast Forestry University: Harebin, China, 2008; pp. 17–35, (In Chinese with English abstract). [Google Scholar]
  20. Diao, Y.F.; Liu, Y.K.; Liu, Y.L.; Tian, S.Y. Population structure characteristics of Taxus cuspidata. Sci. Sin. Vitae 2020, 50, 391–397, (In Chinese with English abstract). [Google Scholar]
  21. Caswell, H. Matrix Population Models: Construction, Analysis and Interpretation; Sinauer: Sunderland, MA, USA, 1989. [Google Scholar]
  22. Caswell, H. Life cycle models for plants. Lect. Math. Life Sci. 1986, 18, 171–233. [Google Scholar]
  23. Vandermeer, J. Choosing category size in a stage projection matrix. Oecologia 1978, 32, 79–84. [Google Scholar] [CrossRef]
  24. Caswell, H. Prospective and retrospective perturbation analyses: Their roles in conservation biology. Ecology 2000, 81, 619–627. [Google Scholar] [CrossRef]
  25. Dong, M.Z.; Wang, L.T.; Lv, M.J.; Meng, D.; Yang, C.Y.; Zhao, C.J.; Fu, Y.J.; Yang, Q. Communities and protection strategy of endangered species wild Taxus cuspidata. Bull. Bot. Res. 2020, 40, 416–423, (In Chinese with English abstract). [Google Scholar]
  26. Zhang, X.S. Vegetation Map of China and Its Geographic Pattern: Illustration of the Vegetation Map of the People ’s Republic of China (1:1 000 000); Geological Publishing House: Beijing, China, 2007. (In Chinese) [Google Scholar]
  27. Bridie, C.; Fortin, H.M.J. Development of a Populus Balsamifera Clone in subarctic Quebec reconstructed from spatial analyses. J. Ecol. 1995, 83, 309–320. [Google Scholar] [CrossRef]
  28. Johnson, J.B. Stand structure and vegetation dynamics of a subalpine treed fen in Rocky Mountain National Park, Colorado. J. Veg. Sci. 1997, 8, 337–342. [Google Scholar] [CrossRef]
  29. Rebertus, A.J.; Veblen, T.T. Structure and tree fall gap dynamics of old-growth Nothofagus forests in Tierra del Fuego, Argentina. J. Veg. Sci. 1993, 4, 641–654. [Google Scholar] [CrossRef]
  30. Harper, J.L. Population Biology of Plants; Academic Press: London, UK, 1977. [Google Scholar]
  31. Frost, I.; Rydin, H. Spatial pattern and size distribution of the animal-dispersed tree Quercus robur in two spruce- dominated forests. Ecoscience 2000, 7, 38–44. [Google Scholar] [CrossRef]
  32. Harcombe, P.A.; Marks, P.L. Tree diameter distributions and replacement processes and replacement processes in southeast Texas forests. For. Sci. 1978, 24, 153–166. [Google Scholar]
  33. Lorimer, C.G. Age structure and disturbance history of a southern Appalachian virgin forest. Ecology 1980, 61, 1169–1184. [Google Scholar] [CrossRef]
  34. Gao, H.Z.; Huang, X.; Su, H.; Qiao, P.F.; Jiang, Z.M.; Shen, Y.R.; Cai, J. Structure and dynamic characteristics of Betula albo-sinensis populations in teo regions in the Qinling Mountains of northwestern China. J. Beijing For. Univ. 2022, 44, 12–20, (In Chinese with English abstract). [Google Scholar]
  35. Zhang, J.; Pan, Z.L.; Tian, Y.H.; Hou, J.L.; Peng, M.C.; Duan, H.; Li, Y.F.; Li, Y.P. Age structure and dynamics of Pinus yunnanensis population in Yunlong Tianchi Nature Reserve. Acta Ecol. Sin. 2022, 42, 9091–9099, (In Chinese with English abstract). [Google Scholar]
  36. LI, F.R. Study on diameter distribution and models prediction yields for natural Dahurian larch stands. J. North-East For. Univ. 1987, 15, 8–16, (In Chinese with English abstract). [Google Scholar]
  37. Ding, G.M.; Liu, X.M.; Ni, Z.Y.; Peng, J.Y. A preliminary study of population dynamics of Picea crassifolia in Qilian Mountains Gansu Province. J. Plant Resour. Environ. 2005, 14, 36–41, (In Chinese with English abstract). [Google Scholar]
  38. Begon, M.; Mortimer, M.; Thompson, D.J. Population Ecology: A Unified Study of Animal and Plants; Blackwell Science Ltd.: London, UK, 1981; pp. 1–1088. [Google Scholar]
  39. Jiang, H. Population Ecology of Spruce; Chinese Forestry Press: Beijing, China, 1992; pp. 1–26. (In Chinese) [Google Scholar]
  40. Liu, J.H.; Hong, W. A study on forecast of population dynamics of Castanopsis kawakamii. Chin J. Appl. Environ. Biol. 1999, 5, 247–253, (In Chinese with English abstract). [Google Scholar]
  41. Wratten, S.D.; Fry, G.I.A. Field and Laboratory Exercises in Ecology; Edward Arnad: London, UK, 1996; pp. 98–103. [Google Scholar]
  42. Wang, M. The Study on Population Dynamics and Spatial Distribution Pattern of Main Plants in Xiaolingshan of Gansu Province; Northwest Normal University: Lanzhou, Gansu, 2012; pp. 7–10, (In Chinese with English abstract). [Google Scholar]
  43. Yang, F.X.; Wang, S.Y.; Xu, H.G.; Li, B.Q. The theory of survival analysis and its application to life table. Acta Ecol. Sin. 1991, 11, 153–158, (In Chinese with English abstract). [Google Scholar]
  44. Deevey, E.S. Life tables for natural populations of animals. Q. Rev. Biol. 1947, 22, 283–314. [Google Scholar] [CrossRef] [PubMed]
  45. Hett, J.M.; Loucks, O.L. Age structure models of balsam fir and eastern hemlock. J. Ecol. 1976, 64, 1029–1044. [Google Scholar] [CrossRef]
  46. Chen, X.D. A study on the method of quantitative analysis for plant population and community structural dynamics. Acta Ecol. Sin. 1998, 18, 104–107, (In Chinese with English abstract). [Google Scholar]
  47. Liu, G.J.; Zhang, X.M.; Zhu, J.T.; Lv, C.Y.; Lu, Y. Structure and dynamics of Haloxy ammodendron population along the southeastern margin of the Zhunger basin. Acta Bot. Boreal.-Occident. Sin. 2011, 31, 1250–1256, (In Chinese with English abstract). [Google Scholar]
  48. Yang, L.; Zhang, Z.L.; Yun, Y.; Yan, W.P.; Chen, X.; Zhang, L.; Zheng, D.J.; Chen, J.L. The population structure and dynamics of Dracaena cambodiana, en endangered tree on Hainan island. Acta Ecol. Sin. 2018, 38, 201–214, (In Chinese with English abstract). [Google Scholar]
  49. Colling, G.; Matthies, D. Effects of habitat deterioration on population dynamics and extinction risk of an endangered, long-lived perennial herb (Scorzonera humilis). J. Ecol. 2006, 94, 959–972. [Google Scholar] [CrossRef]
  50. Su, J.Y.; Yan, Y.; Li, C.; Li, D.; Du, F. Informing conservation strategies with genetic diversity in wild plant with extremely small populations: A review on gymnosperms. Biodivers. Sci. 2020, 28, 376–384, (In Chinese with English abstract). [Google Scholar]
  51. Aguilar, R.; Quesada, M.; Ashworth, L.; Herrera’s-Diego, Y.; Lobo, J. Genetic consequences of habitat fragmentation in plant populations: Susceptible signals in plant traits and met-hodological approaches. Mol. Ecol. 2008, 17, 5177–5188. [Google Scholar] [CrossRef]
  52. Vranckx, G.U.Y.; Jacquemyn, H.; Muys, B.; Honnay, O. Meta-analysis of susceptibility of woody plants to loss of genetic diversity through habitat fragmentation. Conserv. Biol. 2012, 26, 228–237. [Google Scholar] [CrossRef] [PubMed]
  53. Kramer, A.T.; Ison, J.L.; Ashley, M.V.; Howe, H.F. The paradox of forest fragmentation genetics. Conserv. Biol. 2008, 22, 878–885. [Google Scholar] [CrossRef] [PubMed]
  54. Ellstrand, N.C.; Elam, D.R. Population genetic conseque-nces of small population size: Implications for plant conservation. Annu. Rev. Ecol. Syst. 1993, 24, 217–242. [Google Scholar] [CrossRef]
  55. Jiang, Y.H.; Shen, W.H.; Tan, C.Q.; Xiang, W.H.; Peng, Y.H.; Pan, G.B. The population structure and dynamics analysis and protection strategy of Vatica guangxiensis extremely small population. Ecol. Sci. 2016, 35, 67–72. [Google Scholar]
  56. Cogoni, D.; Sulis, E.; Bacchetta, G.; Fenu, G. The unpredictable fate of the single population of a threatened narrow endemic Mediterranean plant. Biodivers. Conserv. 2019, 28, 1799–1813. [Google Scholar] [CrossRef]
Figure 1. Spots-setting method (a) and photo of Taxus cuspidata (b).
Forests 14 02194 g001
Figure 2. Smoothing curve (note: M is the median in diameter class; Y is the number of plants).
Forests 14 02194 g002
Figure 3. Number of Taxus cuspidata in diameter classes.
Forests 14 02194 g003
Figure 4. Mortality rate and vanishing rate curves of Taxus cuspidata population (note: qx is the mortality rate; Kx is the vanishing rate).
Forests 14 02194 g004
Figure 5. Survival curve of Taxus cuspidata population (note: lnlx is the logarithm of population survival).
Forests 14 02194 g005
Figure 6. Survival functional rate of Taxus cuspidata population. (S(t) is the utilization survival function, F(t) is the cumulative mortality function, f(t) is the mortality density function, and λ(t) is the hazard rate function).
Forests 14 02194 g006
Figure 7. The time series prediction of Taxus cuspidata population (note: M0 is the current number distribution curve of Taxus cuspidata in various diameter classes; M2 is the predicted 2-diameter classes curve; M5 is the predicted 5-diameter classes curve; M8 is the predicted 8-diameter classes curve).
Forests 14 02194 g007
Table 1. Basic information in the plots of the communities in which Taxus cuspidata populations are located.
PlotElevation (m)InclinationLocationLatitude and LongitudeDominant TreePopulation Density (/ha)
NE
186626°Huanggou, Helong42°24′23″128°38′4″Abies nephrolepis, Picea jezoensis, Tilia amurensis, Pinus koraiensis2.5
281330°Huanggou, Helong42°24′24.9″128°40′5.9″Tilia amurensis, Acer pseudosieboldianum, Abies nephrolepis, Acer ukurunduense1.94
3102130°Huanggou, Helong42°24′27.9″128°40′7.8″Acer ukurunduense, Abies nephrolepis, Acer tegmentosum, Tilia amurensis1.25
499829°Huanggou, Helong42°24′28.5″128°40′10.8″Acer ukurunduense, Abies nephrolepis, Pinus koraiensis, Tilia amurensis, Taxus cuspidata1.69
597932°Huanggou, Helong42°24′06.7″128°39′54.0″Tilia amurensis, Acer pseudosieboldianum, Abies nephrolepis, Acer ukurunduense3.56
6113012°Huanggou, Helong42°23′58.8″128°40′0.9″Pinus koraiensis, Acer ukurunduense, Abies nephrolepis, Tilia amurensis, Abies holophylla1.81
7103023°Huanggou, Helong42°23′45″128°39′56″Acer ukurunduense, Pinus koraiensis, Abies nephrolepis, Acer pseudosieboldianum, Tilia amurensis3.38
887313°Jingouling, Wangqing43°22′29″130°9′33.9″Abies nephrolepis, Taxus cuspidata, Tilia amurensis, Pinus koraiensis, Betula costata17.56
969417°Jingouling, Wangqing43°21′37″130°10′12.8″Abies nephrolepis, Acer pseudosieboldianum, Taxus cuspidata,, Acer mono, Pinus koraiensis6.38
1091014°Duhuangzi, Wangqing43°12′24″130°36′35.3″Abies nephrolepis, Acer ukurunduense, Tilia amurensis, Pinus koraiensis, Acer tegmentosum2.06
1190713°Duhuangzi, Wangqing43°12′22.7″130°36′35.7″Abies nephrolepis, Tilia amurensis, Acer tegmentosum, Acer barbinerve, Acer ukurunduense1.5
1285621°Duhuangzi, Wangqing43°12′27.7″130°36′36.7″Abies nephrolepis, Acer barbinerve, Pinus koraiensis, Tilia amurensis, Abies holophylla2.38
1380818°Duhuangzi, Wangqing43°12′23.0″130°36′25.8″Abies nephrolepis, Acer barbinerve, Tilia amurensis, Acer tegmentosum, Acer ukurunduense0.81
1481818°Duhuangzi, Wangqing43°12′28.6″130°36′25.3″Abies nephrolepis, Acer barbinerve, Tilia amurensis, Acer ukurunduense, Acer tegmentosum1.19
1593624°Duhuangzi, Wangqing43°11′51.3″130°36′25.7″Abies nephrolepis, Tilia amurensis, Acer barbinerve, Acer ukurunduense, Acer tegmentosum1.75
16900Huanggou, Wangqing43°18′45.8″130°19′31″Abies nephrolepis, Acer barbinerve, Acer ukurunduense, Tilia amurensis, Taxus cuspidata4.94
1770012°Lanjia, Wangqing43°26′19″130°57′25″Acer barbinerve, Abies nephrolepis, Pinus koraiensis, Acer ukurunduense, Acer tegmentosum4
18789Lanjia, Wangqing43°26′19.4″130°57′15.8″Acer barbinerve, Tilia amurensis, Abies nephrolepis, Acer ukurunduense, Pinus koraiensis0.75
1976627°Lanjia, Wangqing43°27′11.6″130°56′12.4″Abies nephrolepis, Tilia amurensis, Acer tegmentosum, Acer barbinerve, Abies holophylla3.25
2074520°Madida, Wangqing43°9″35.5′130°41′23.5″Abies nephrolepis, Acer tegmentosum, Tilia amurensis, Acer ukurunduense, Abies holophylla2.31
Table 2. The diameter classification table of Taxus cuspidata (upper limit exclusion method).
Breast Diameter (cm)0–2.52.5–44–1010–1616–2222–2828–3434–4040–4646–5252+
Diameter class1234567891011
Table 3. The static life table of Taxus cuspidata population.
xa0axMlxlnlxdxqxLxTxexKx
1698593 1.51000 6.9078 519 0.5189 741 741 0.74 0.7316
273285 3481 6.1761 260 0.5398 351 1092 2.27 0.7762
389131 6221 5.4000 137 0.6189 153 1245 5.62 0.9647
410250 12.784 4.4352 37 0.4395 66 1311 15.53 0.5790
57528 18.247 3.8563 22 0.4601 36 1347 28.48 0.6164
63315 24.426 3.2399 13 0.5166 19 1366 53.50 0.7269
7107 30.7512 2.5130 7 0.5989 9 1375 111.38 0.9135
873 365 1.5995 2 0.3187 4 1379 278.50 0.3838
922 42.753 1.2157 2 0.5000 3 1381 409.53 0.6931
1061 49.52 0.5226 0 0.0000 2 1383 820.07 0.0000
1131 742 0.5226 2 1.0000 1 1384 820.57 0.5226
Note: a0 is the actual number of survivors in diameter class x; ax is the number of survivors at x after smoothing treatment; M is the median value at x; lx is the standardized number of survivors at x; dx is the standardized number of dead individuals during two adjacent diameter classes; qx is the mortality rate at each diameter class; Lx refers to the average number of surviving individuals (from x to x + 1 class); Tx is the total number of individuals or total life span (x class to over x class); ex is the life expectancy of an individual at x; and Kx indicates the vanishing rate.
Table 4. The dynamic index (Vx) of the individual number in the Taxus cuspidata population in two adjacent diameter classes and the dynamic index of the population structure (Vpi).
ItemV1V2V3V4V5V6V7V8V9V10V11VpiVpi
Dynamic index (%)0.9−0.18−0.130.260.560.70.30.71−0.670.5_0.63950.0291
Note: Vx represents the dynamic index of the individual number in population from x to x + 1; Vpi represents the dynamic index of the entire population structure; Vpi represents the dynamic index of the population’s diameter structure when external disturbances are taken into account.
Disclaimer/Publisher’s Note: The statements, opinions and data contained in all publications are solely those of the individual author(s) and contributor(s) and not of MDPI and/or the editor(s). MDPI and/or the editor(s) disclaim responsibility for any injury to people or property resulting from any ideas, methods, instructions or products referred to in the content.

