
Predicting Mangrove Distributions in the Beibu Gulf, Guangxi, China, Using the MaxEnt Model: Determining Tree Species Selection
Abstract
:1. Introduction
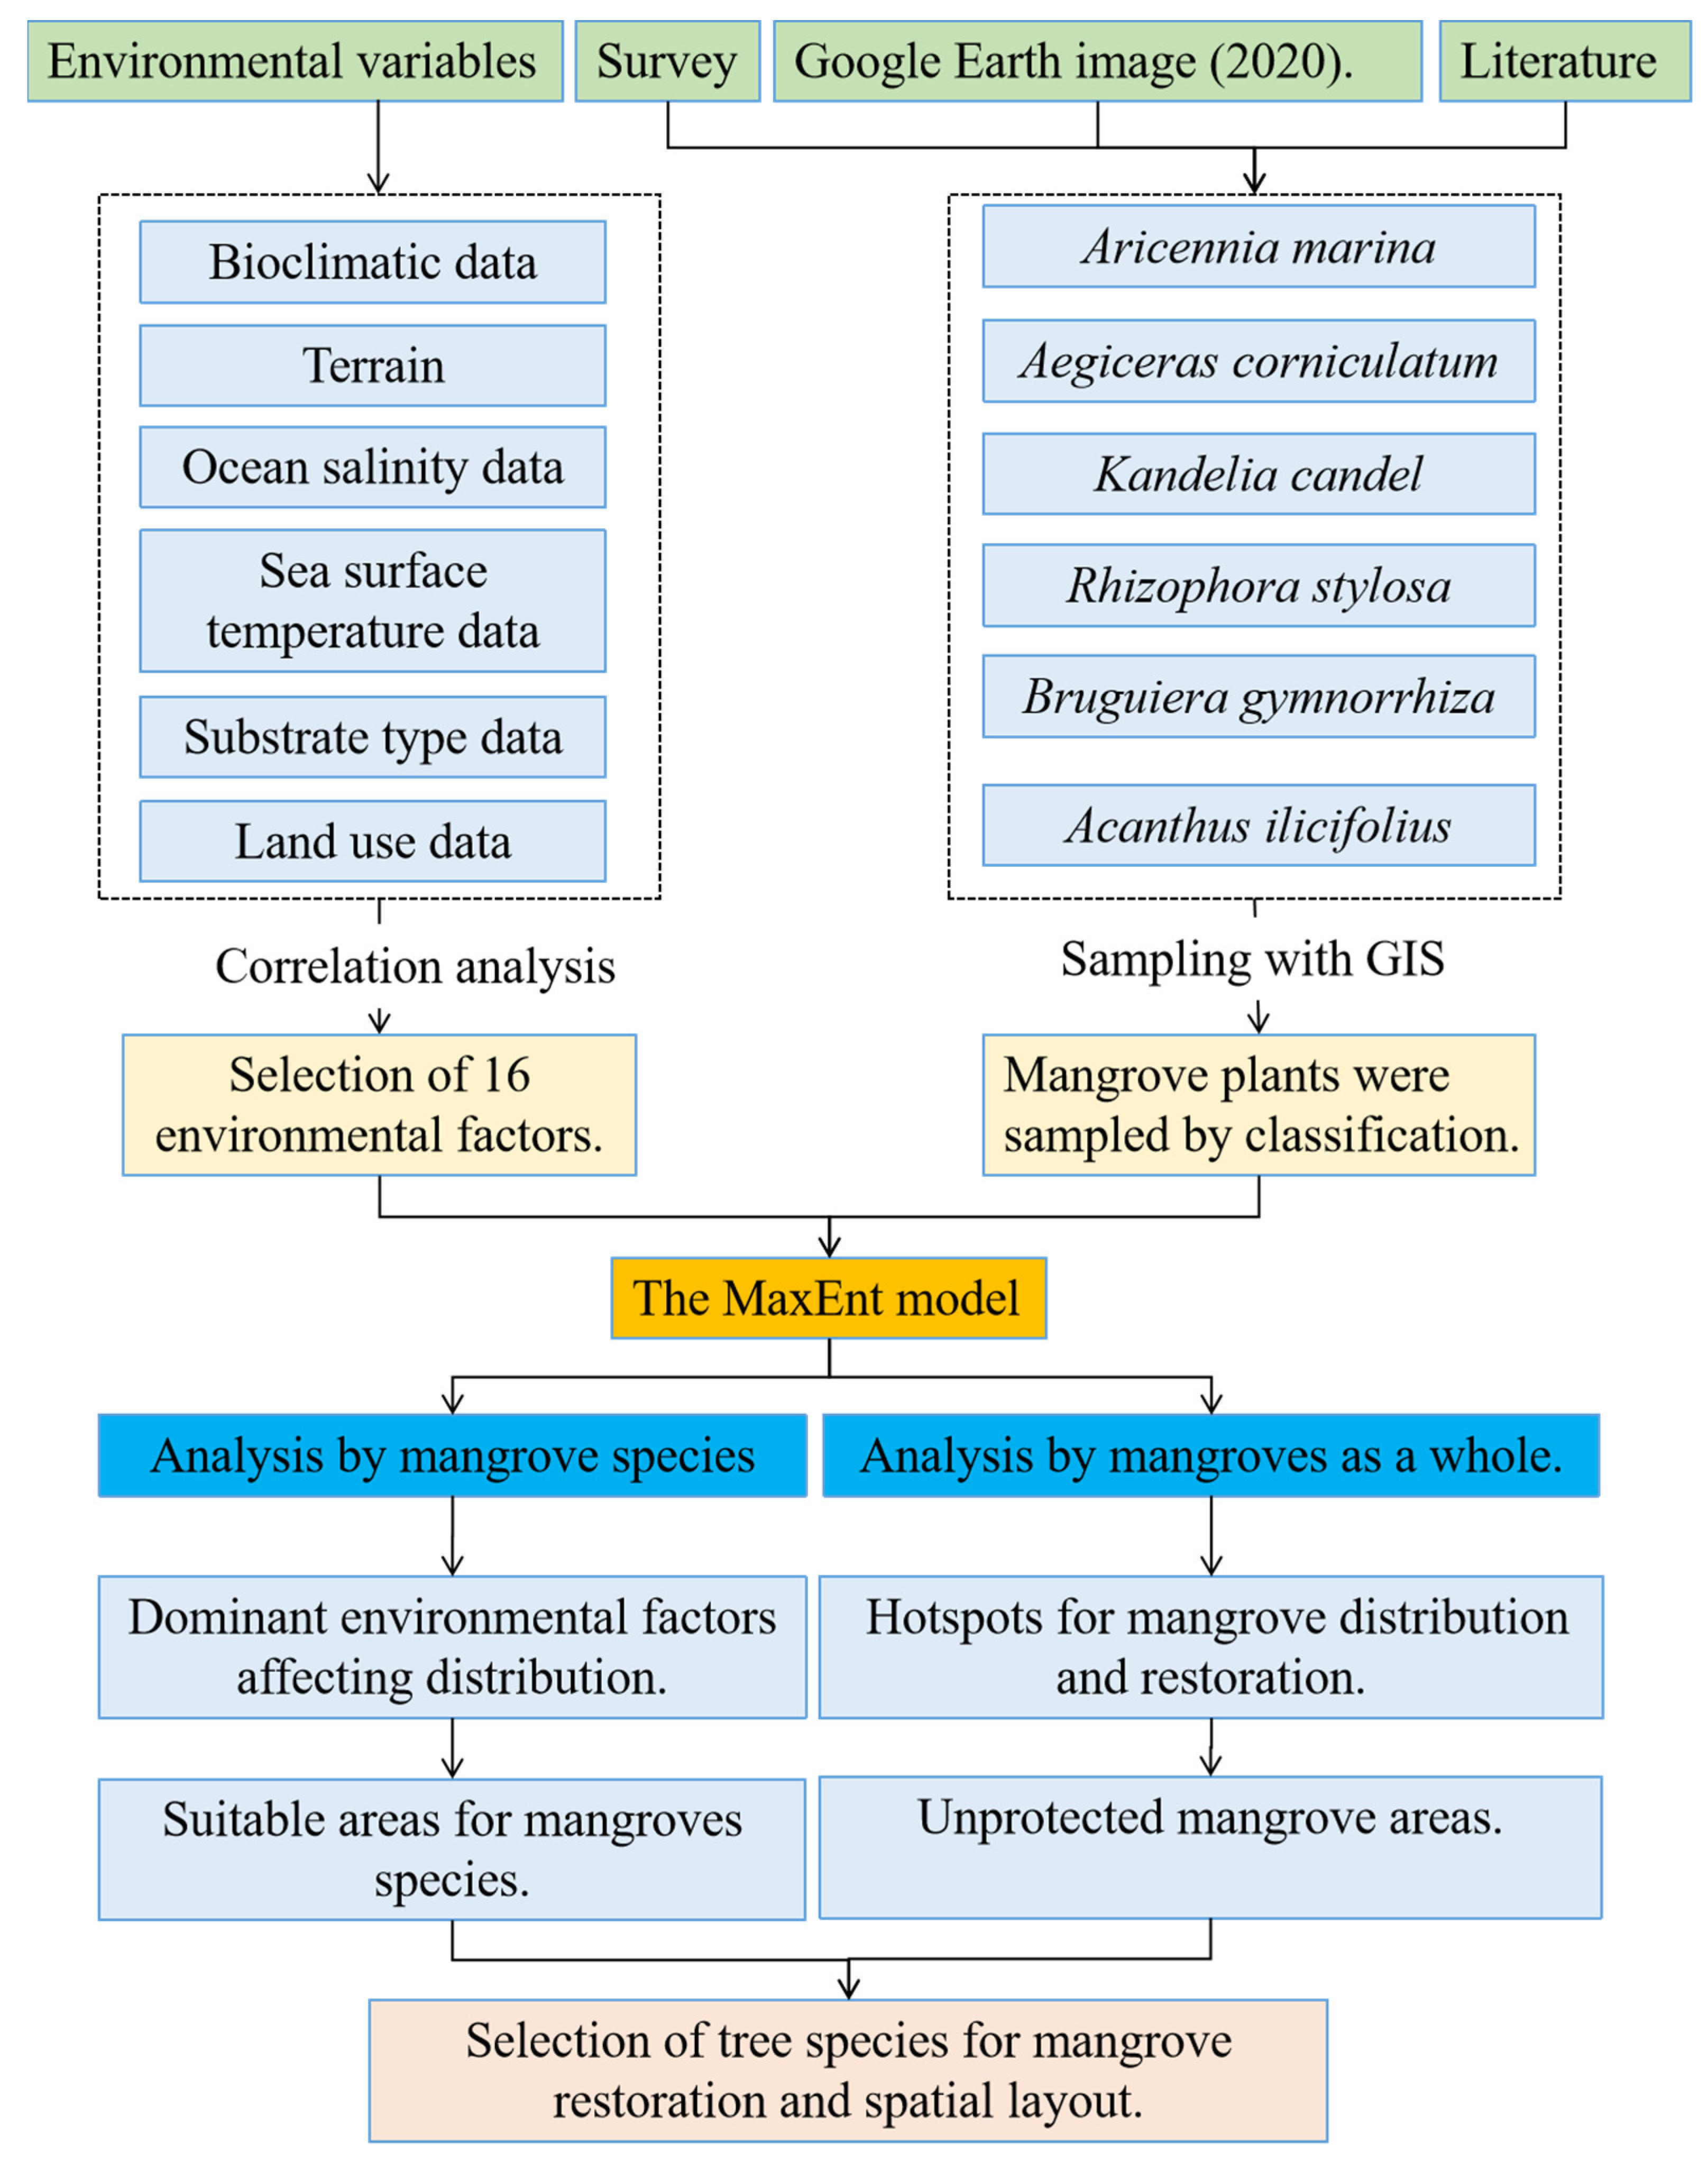
2. Methodology
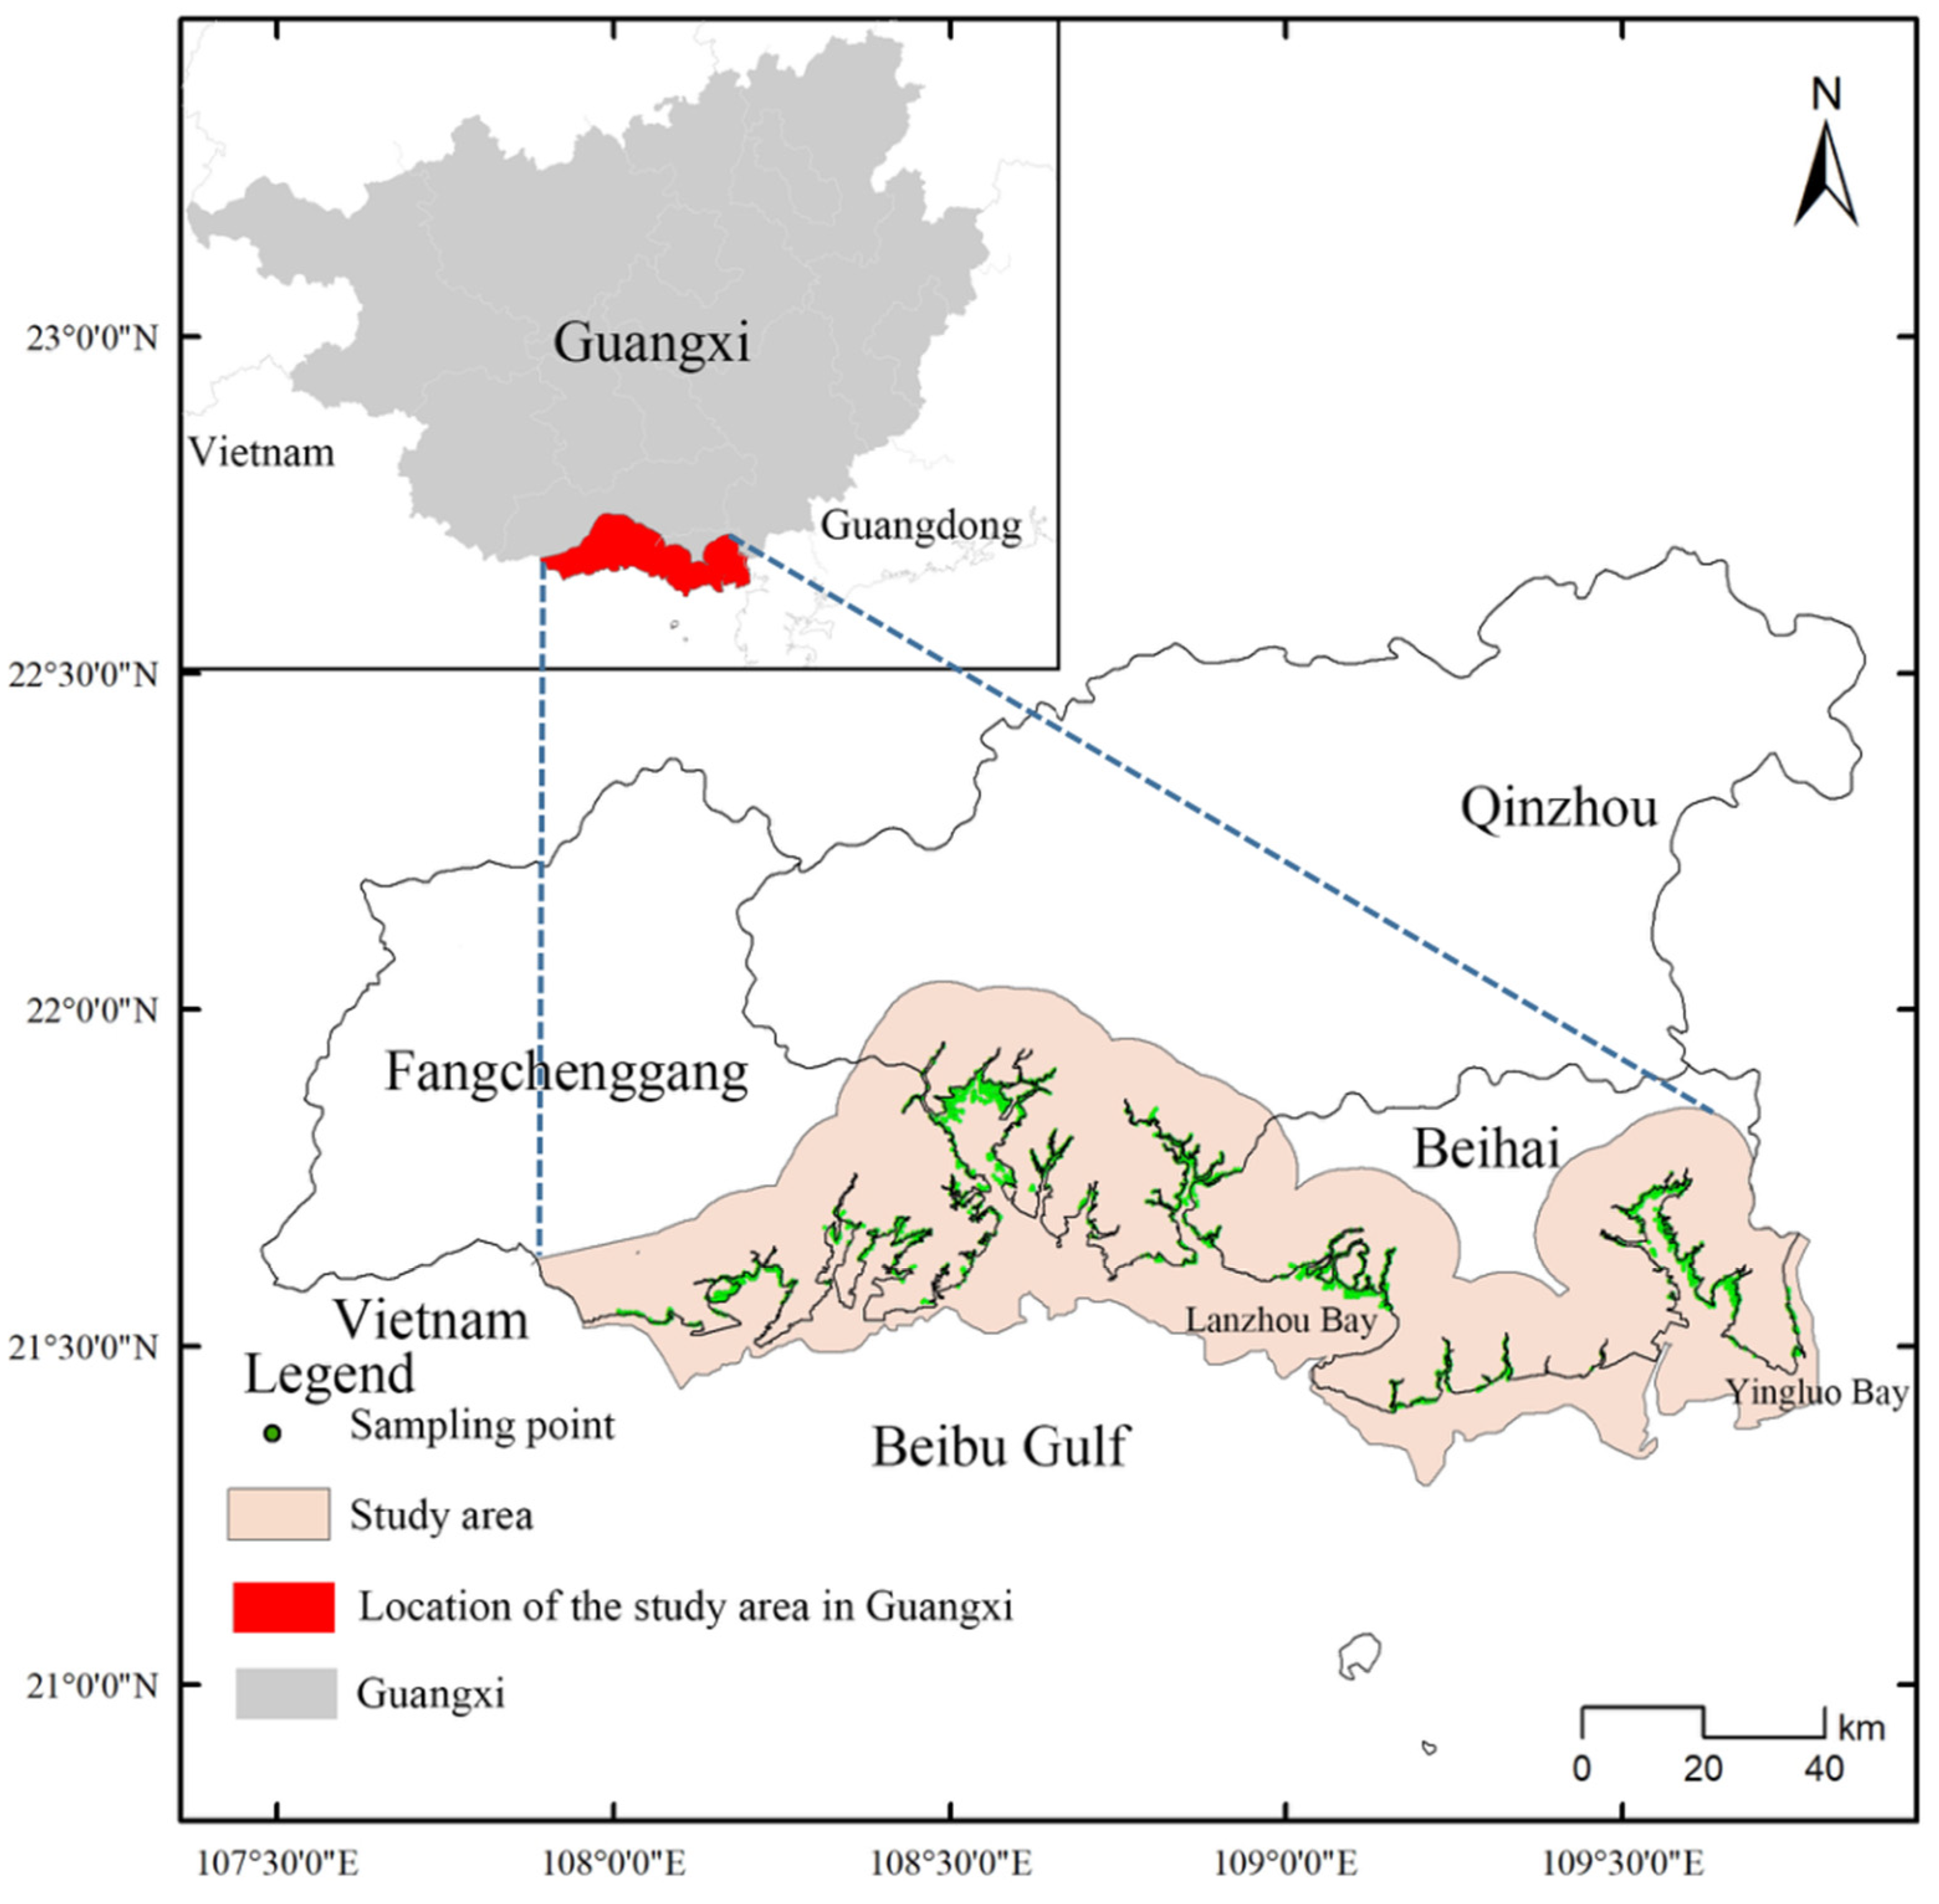
2.1. The Study Area
2.2. Mangrove Distributions
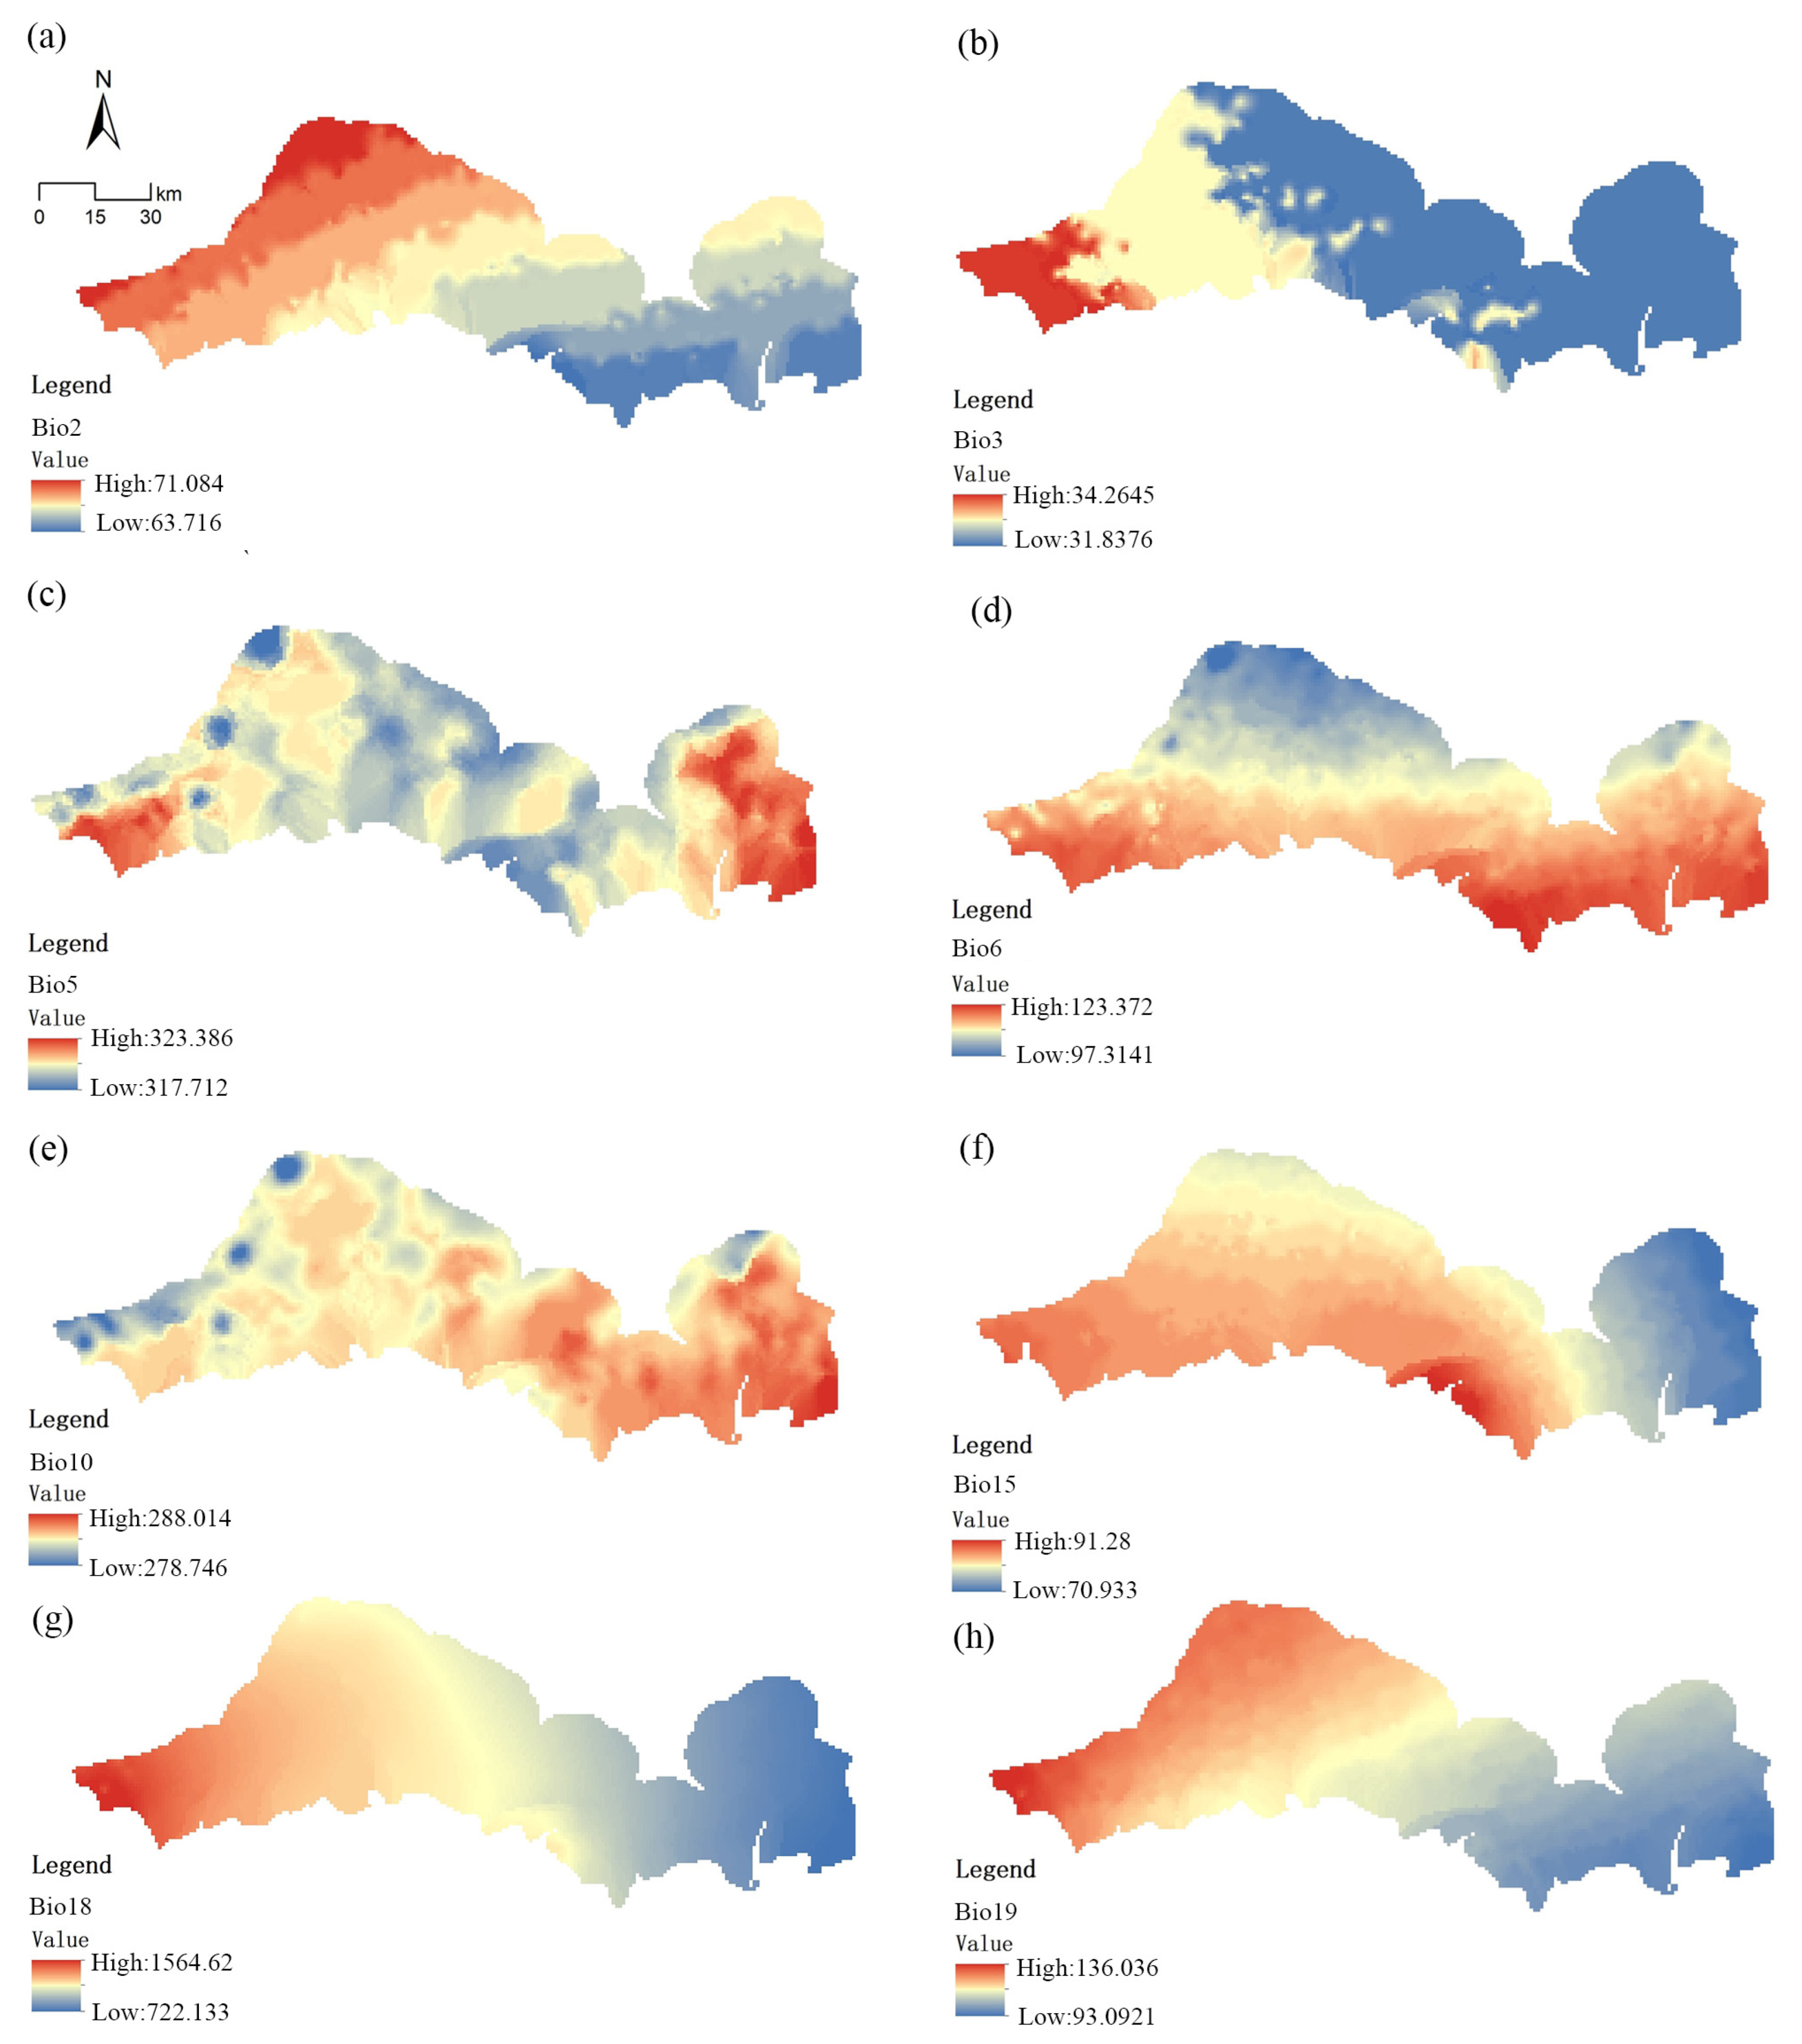
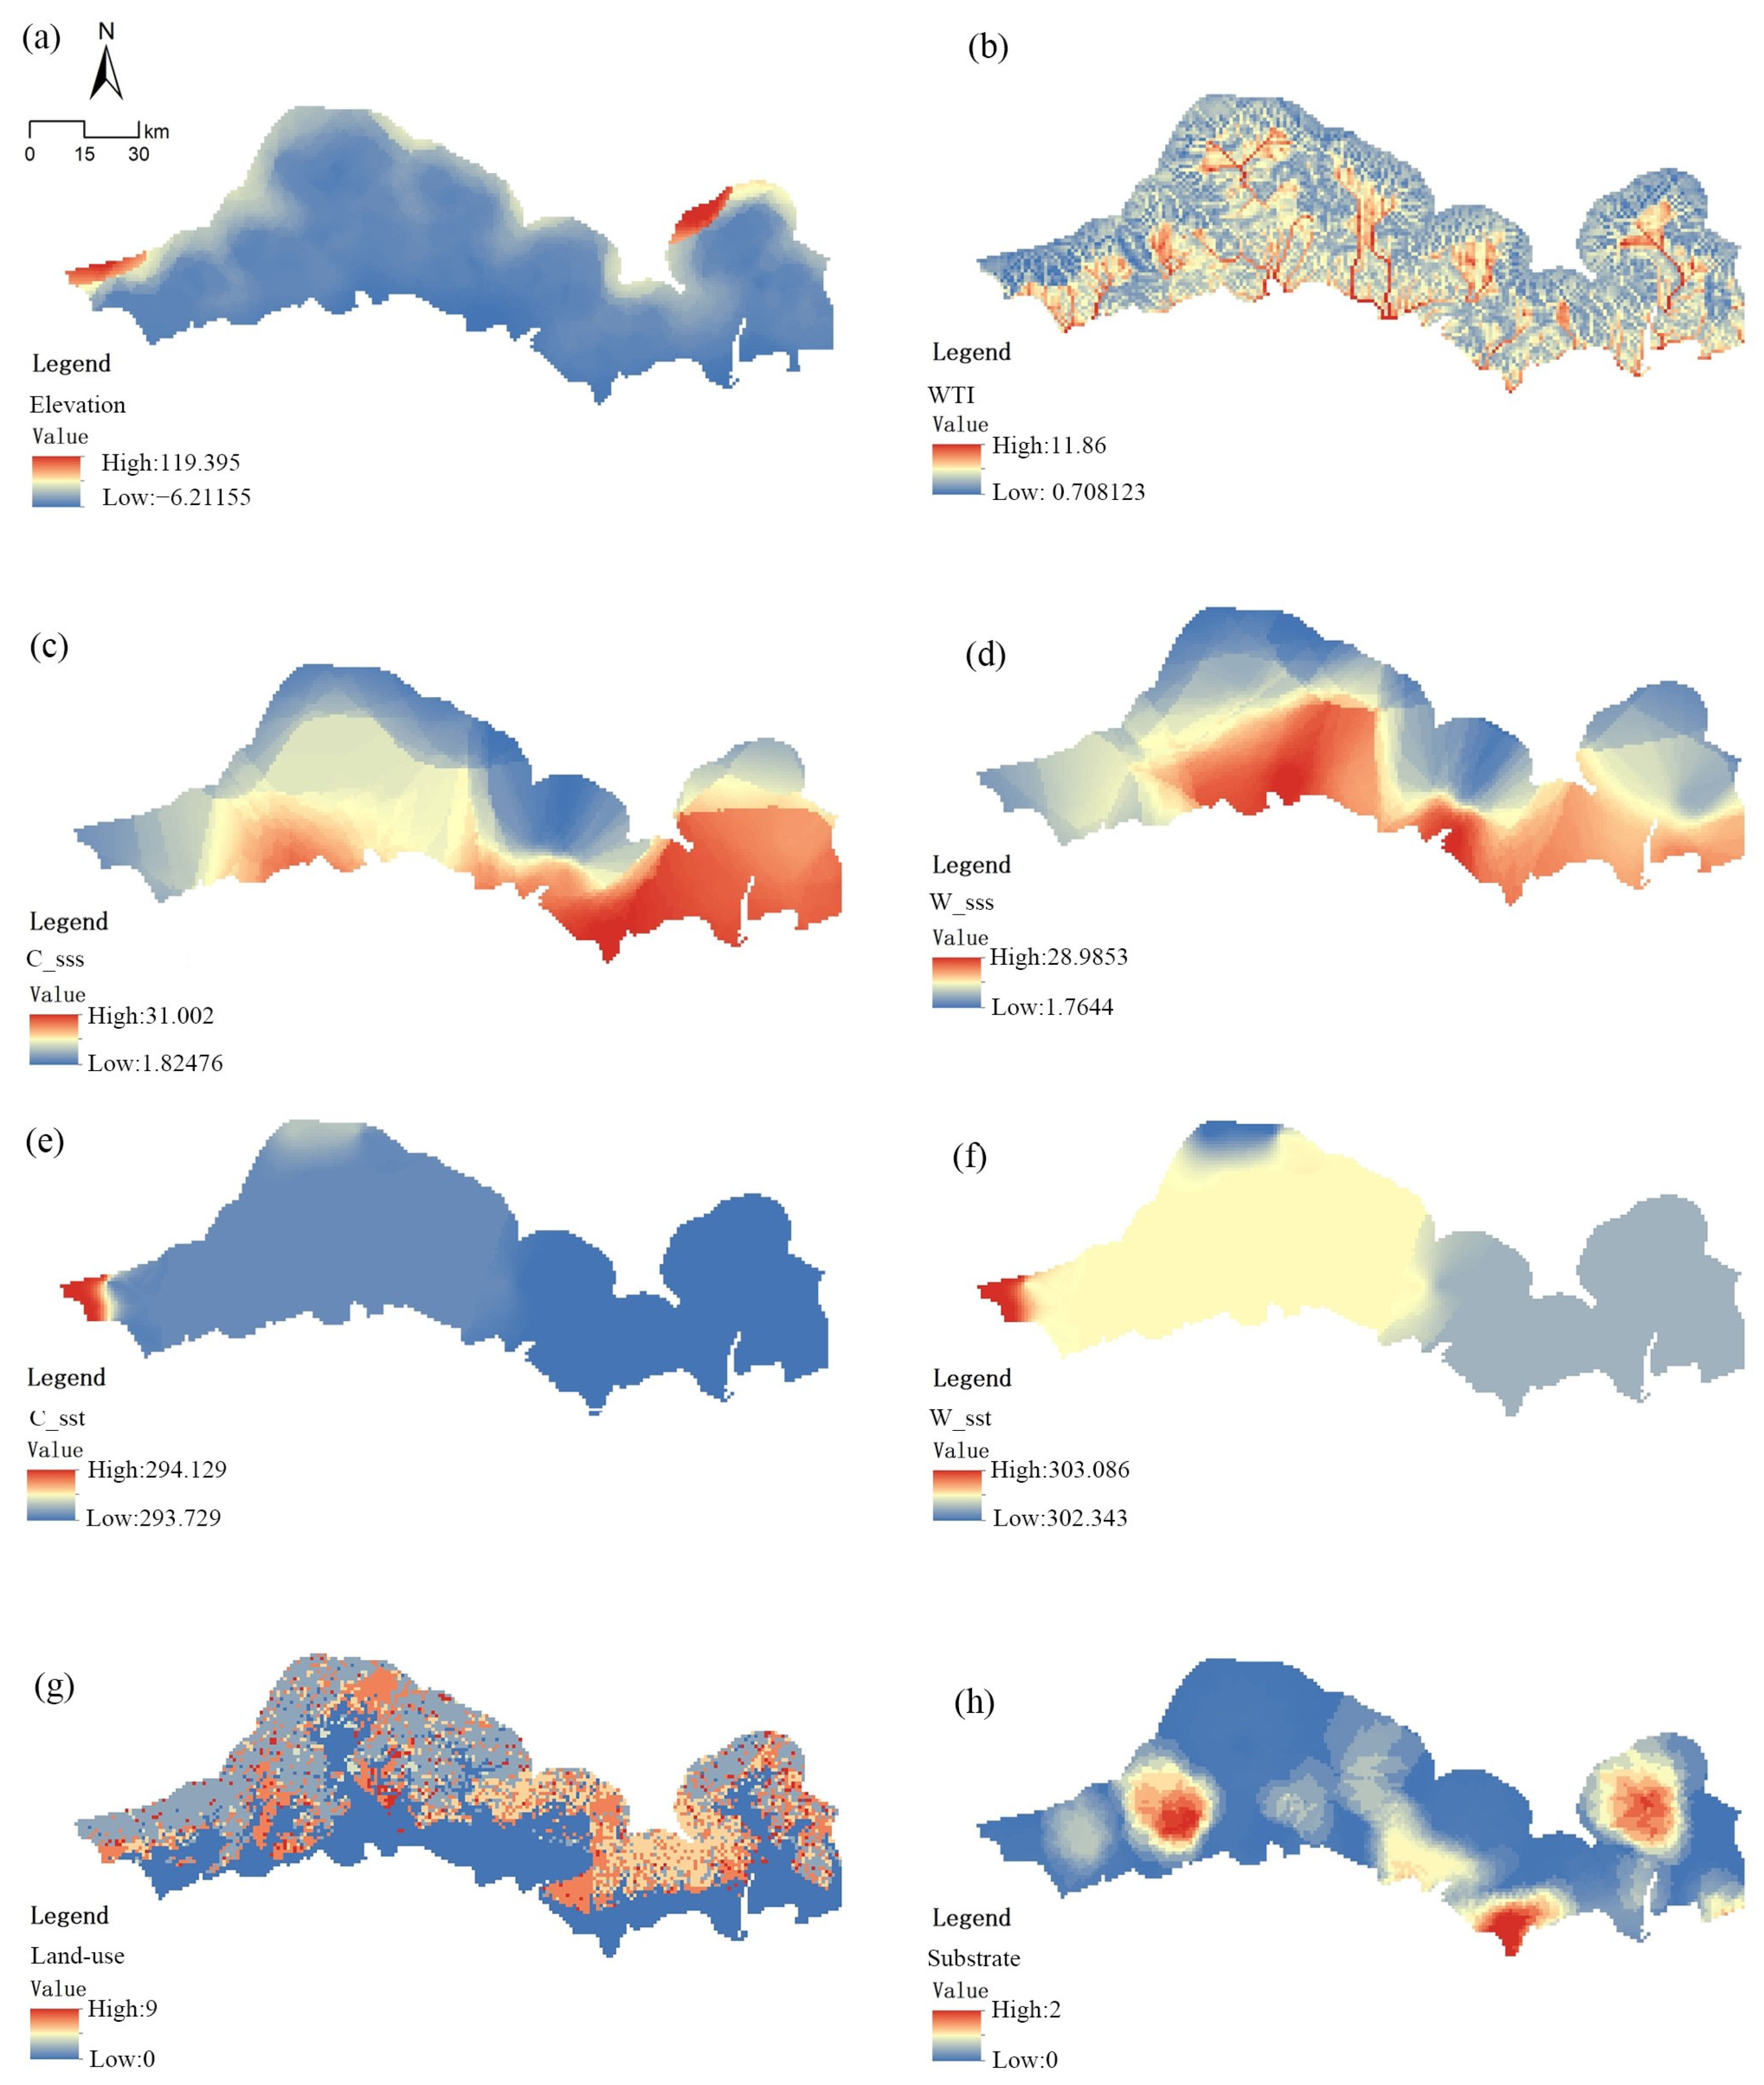
2.3. Environmental Data
2.4. Model Parameters
2.5. Model Testing
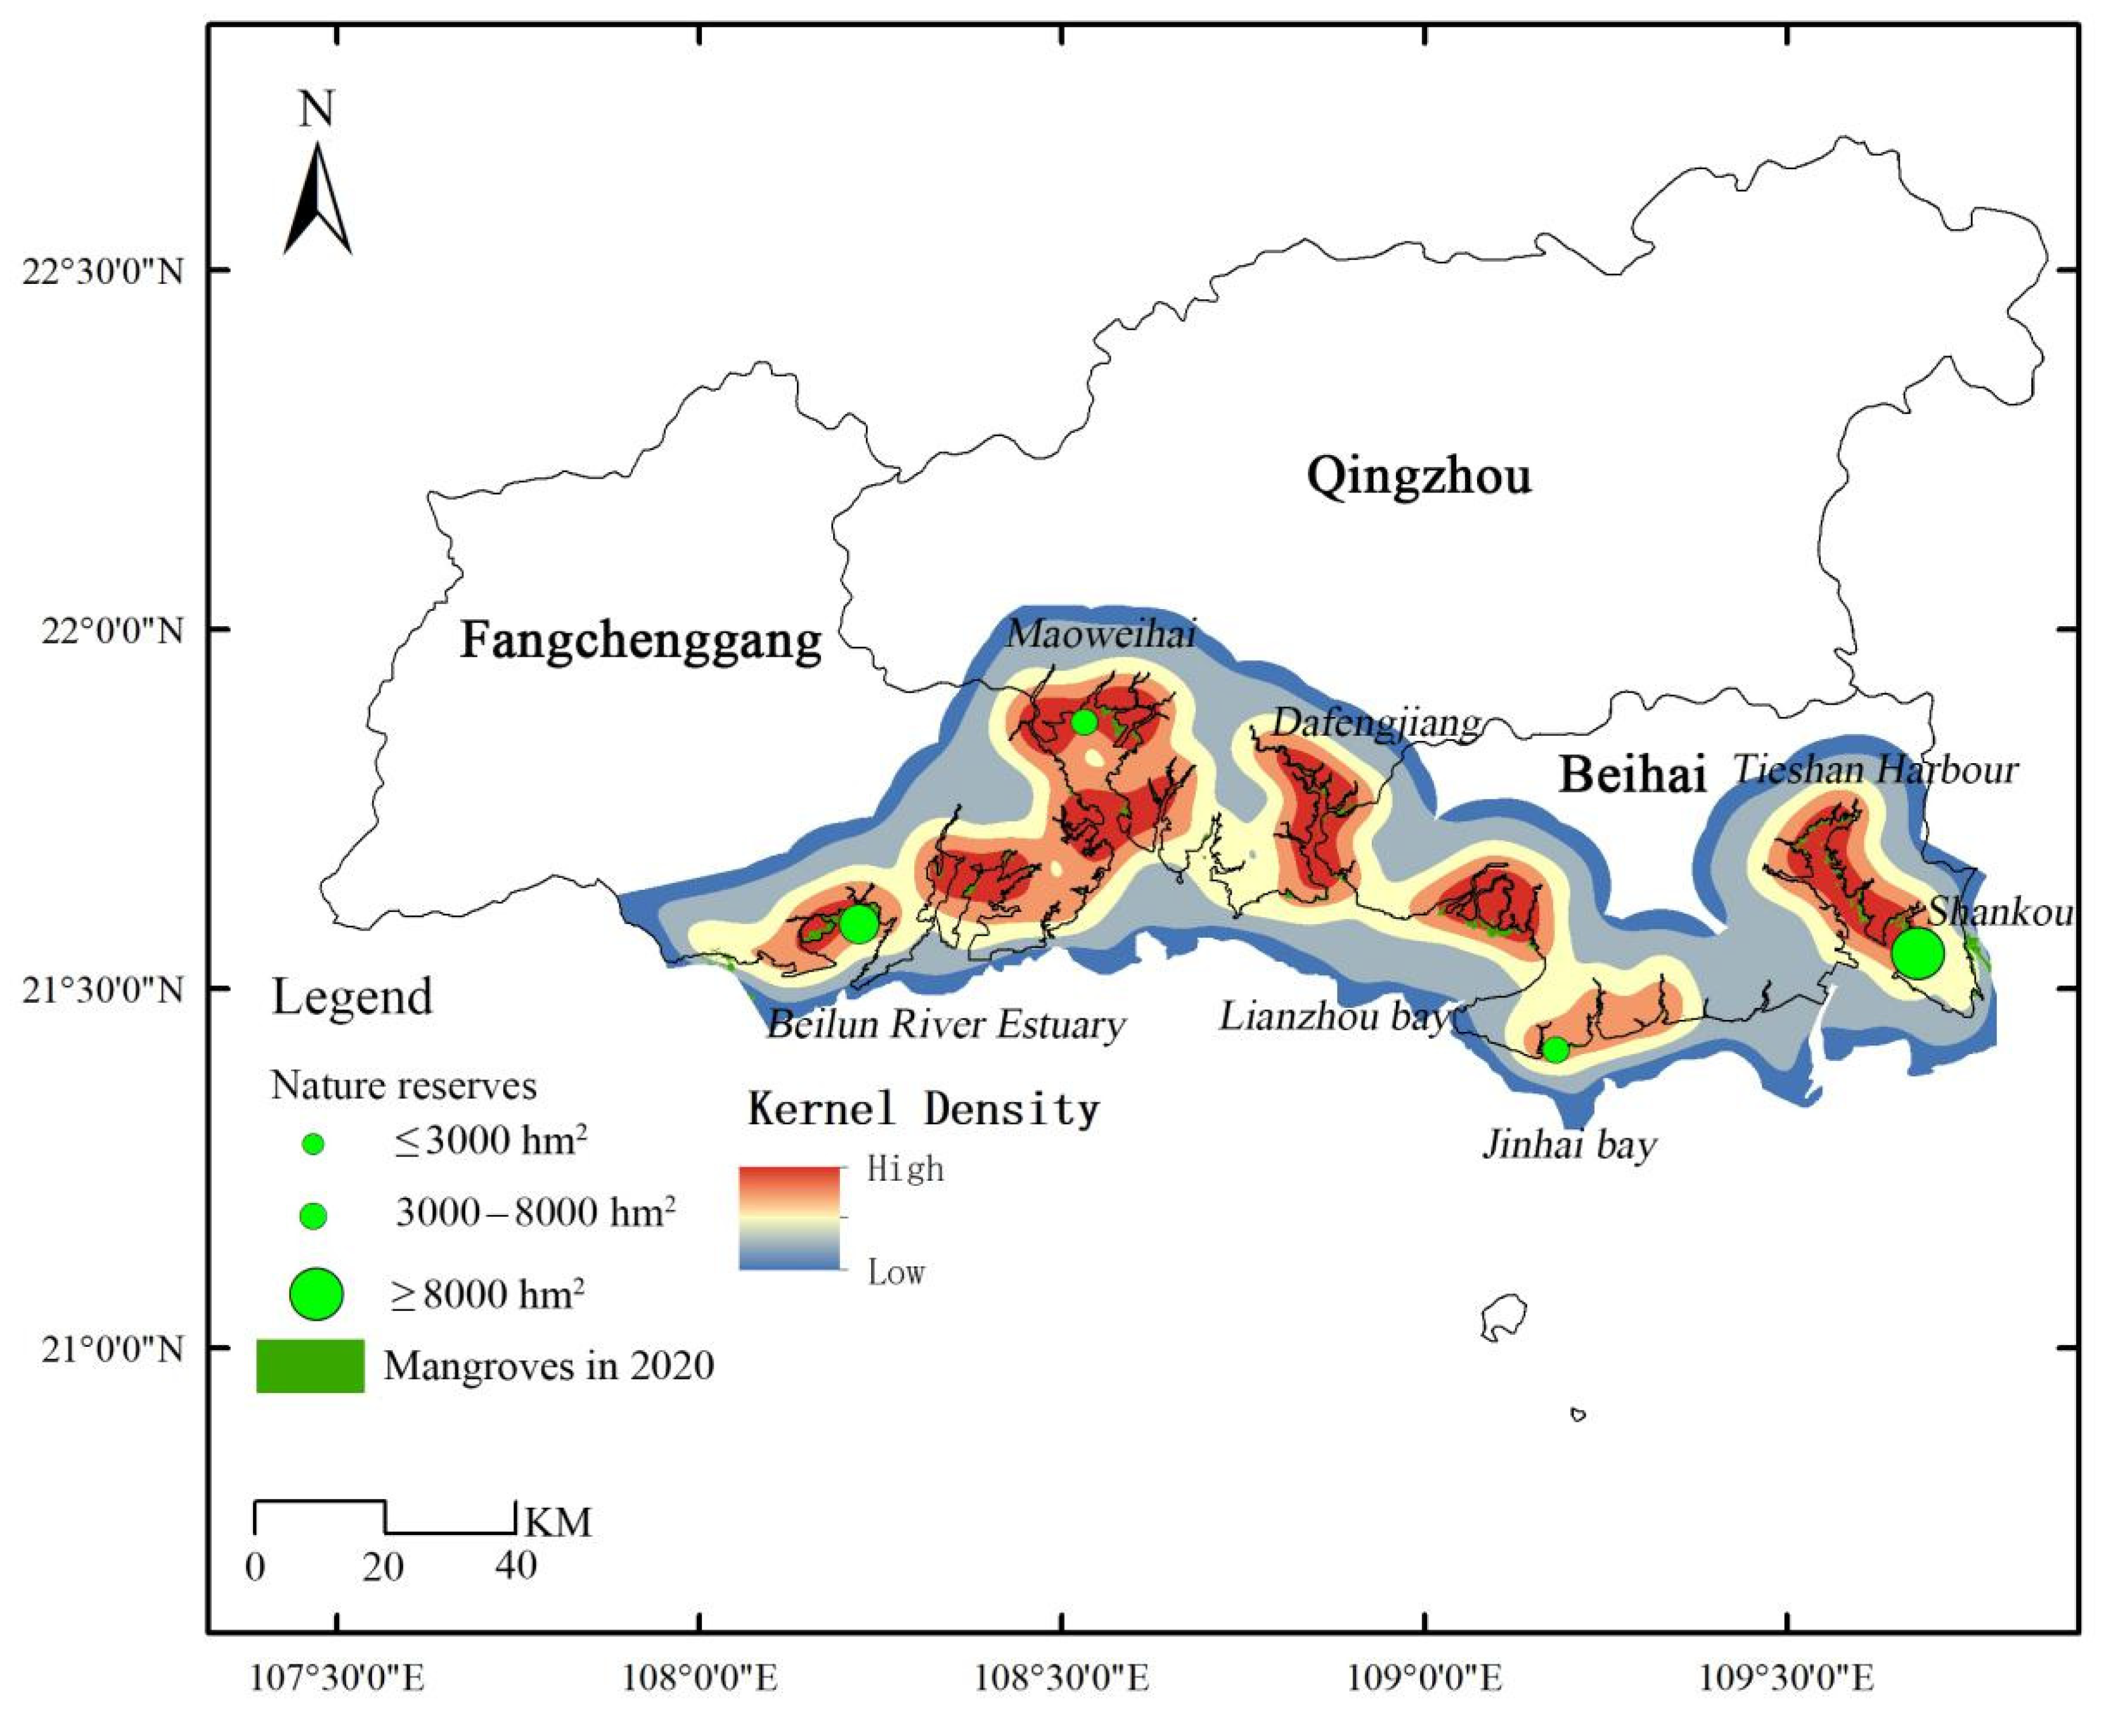
2.6. Vacancy Analysis of Mangrove Protection and Restoration
3. Results
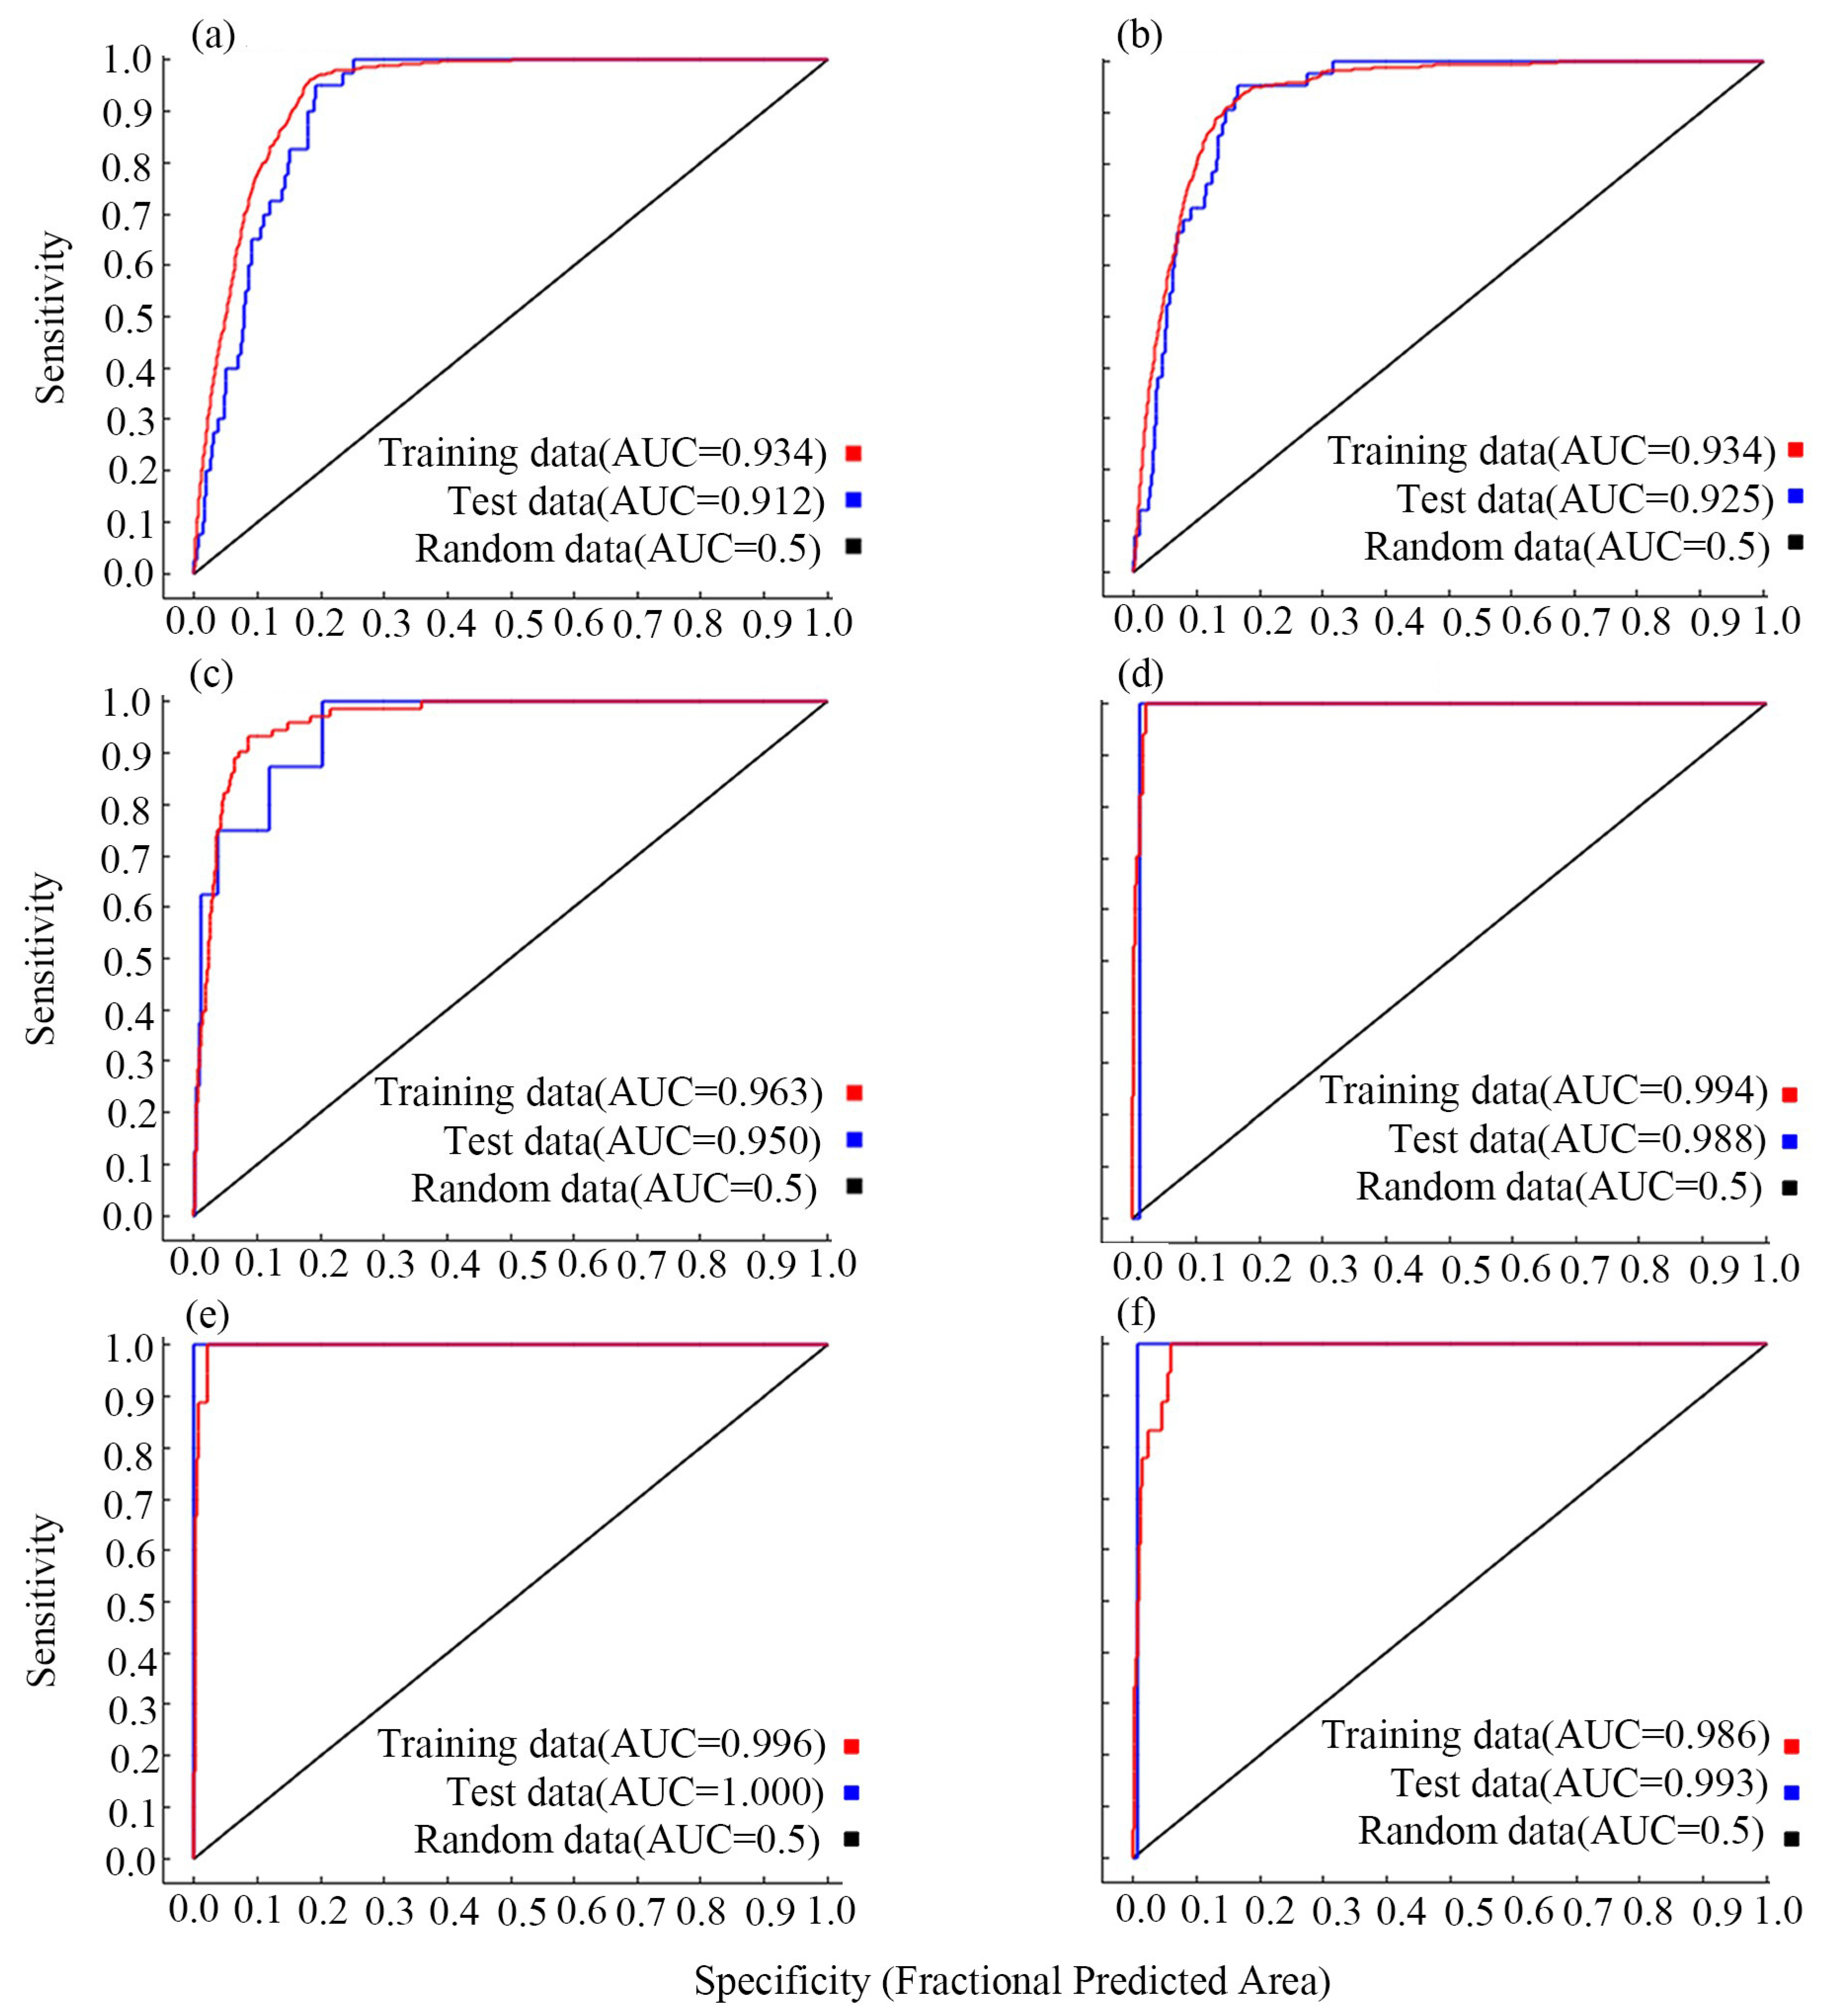
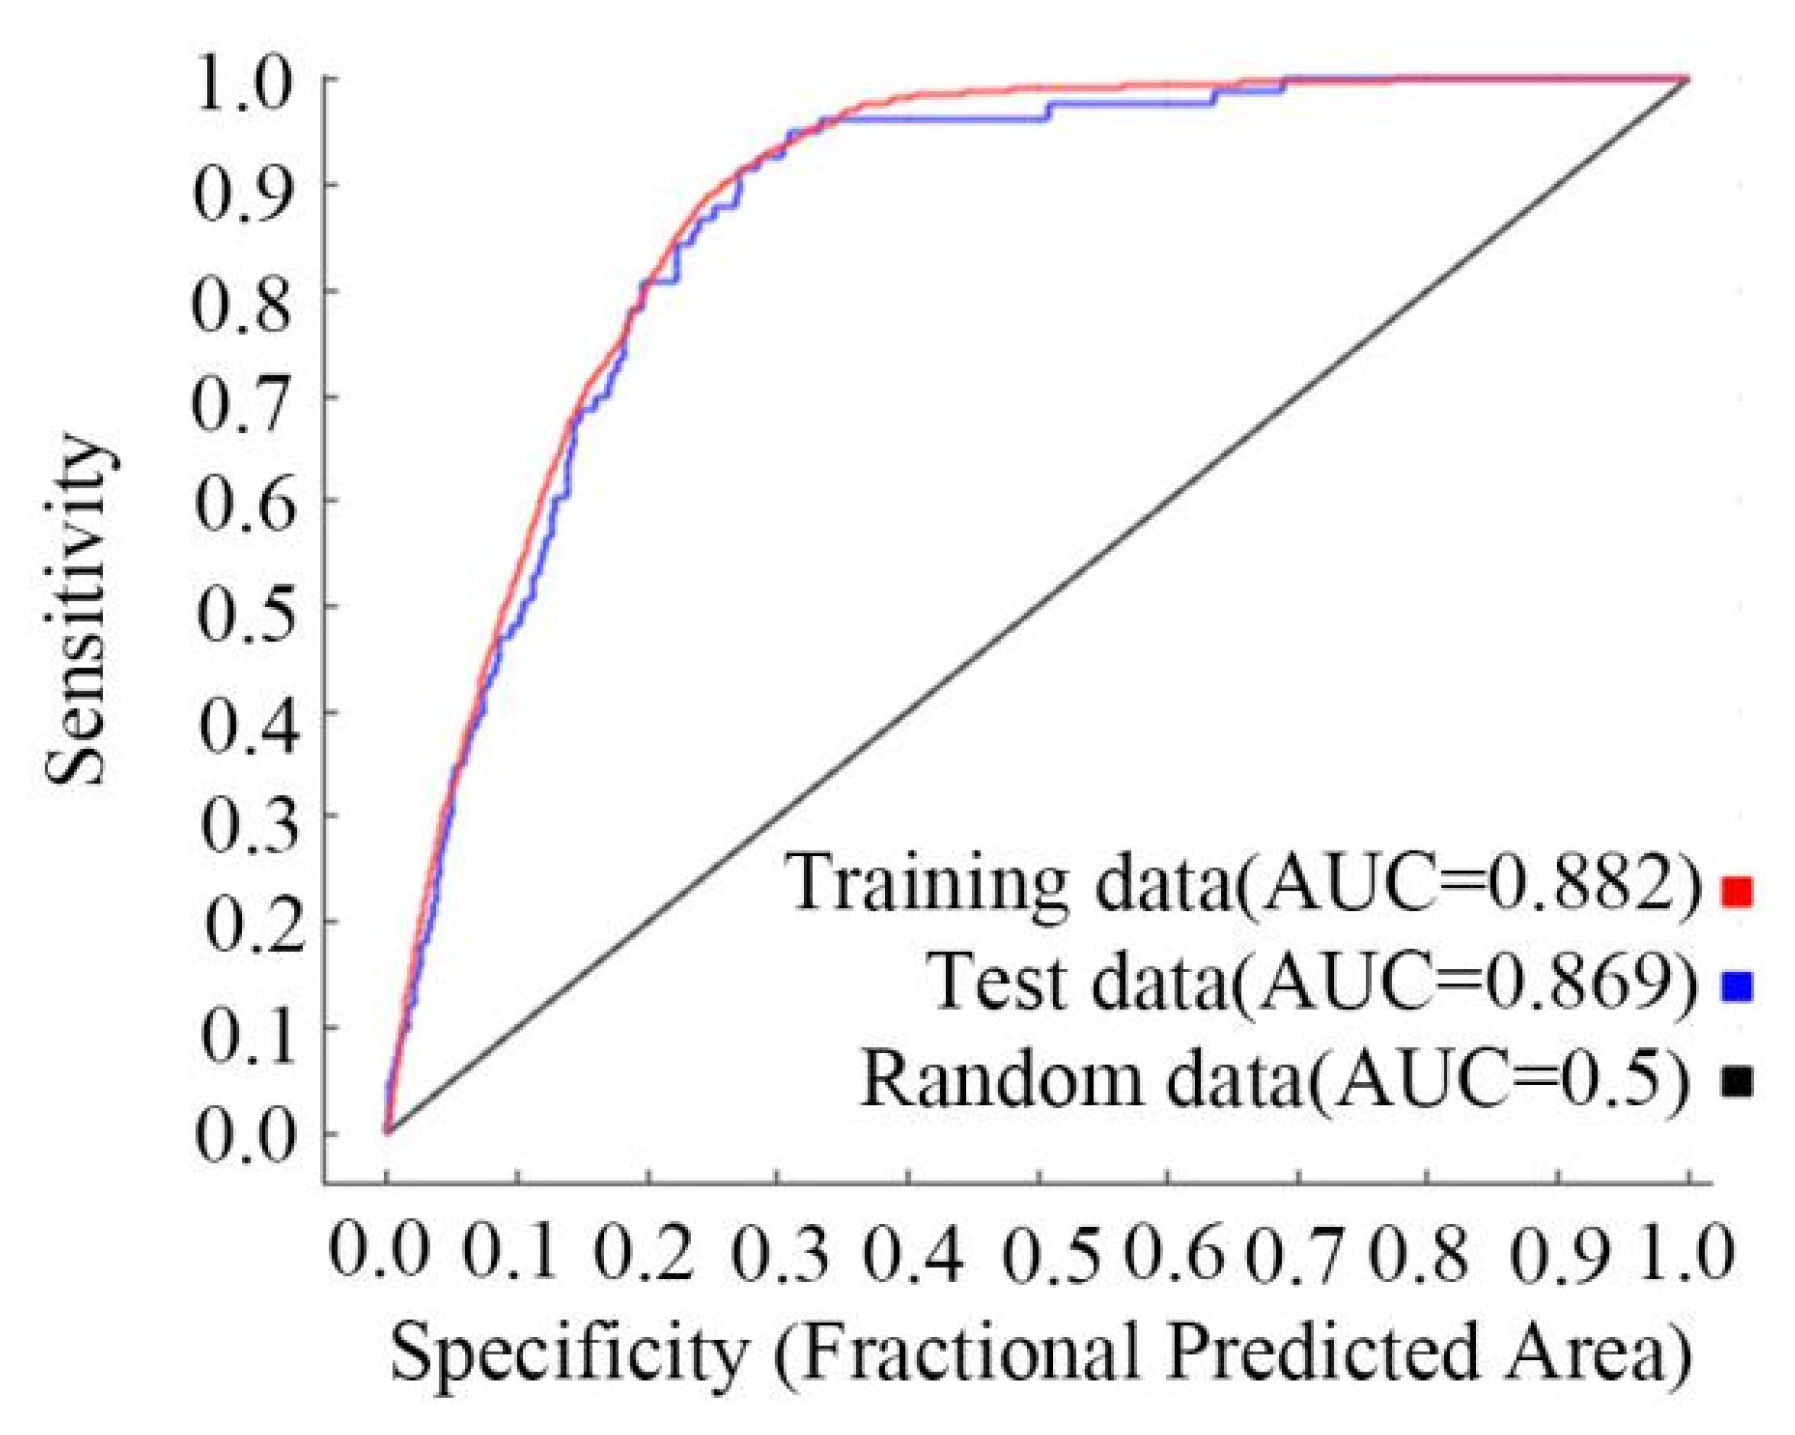
3.1. The AUC Values
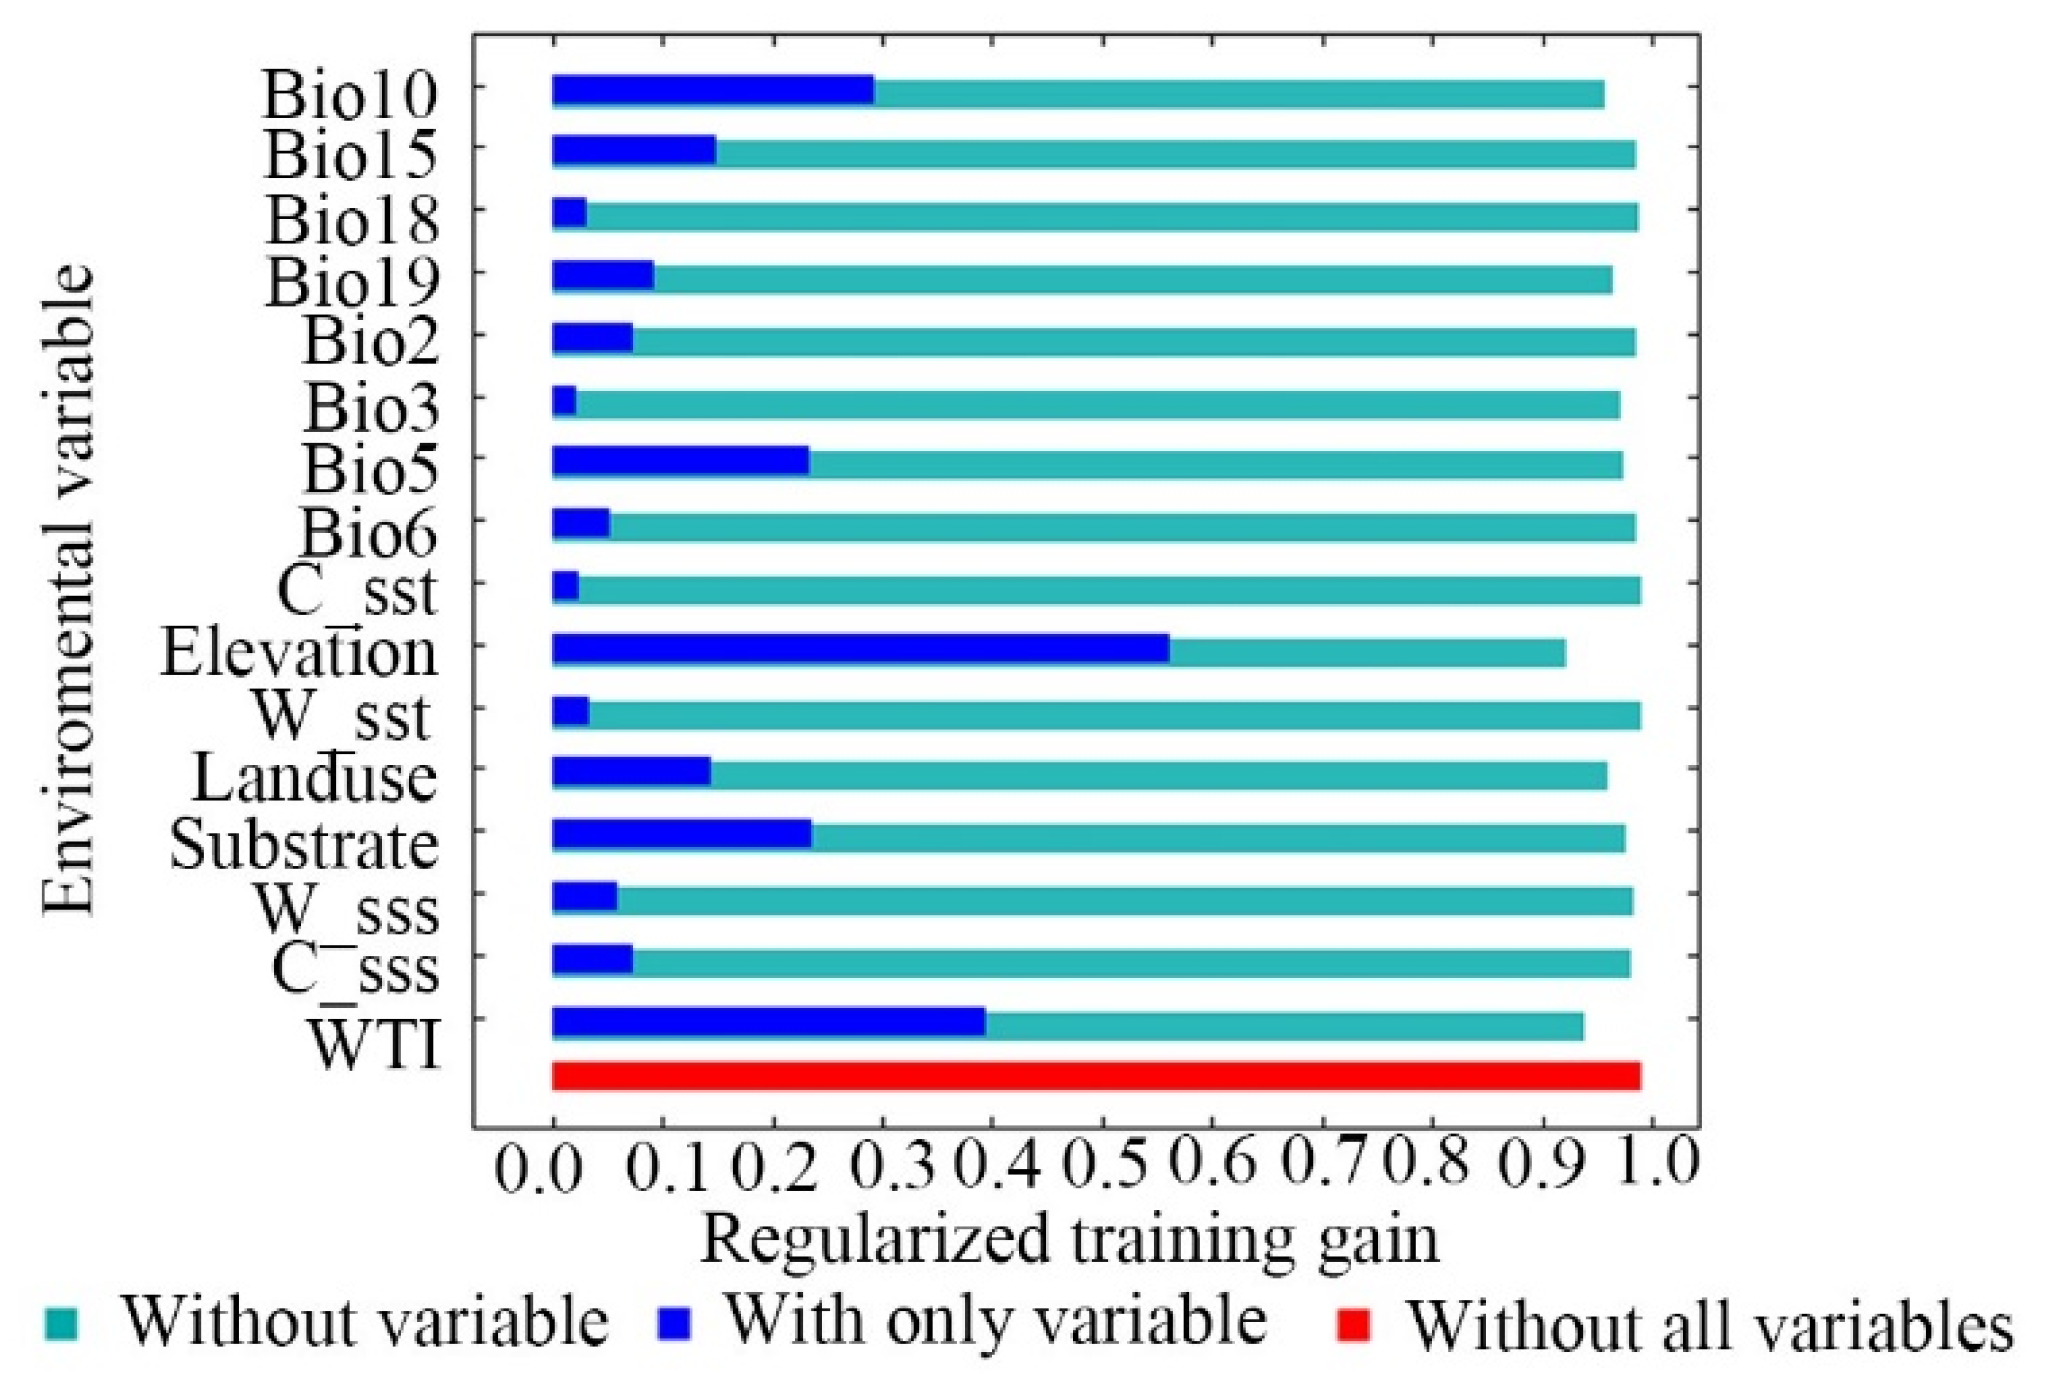
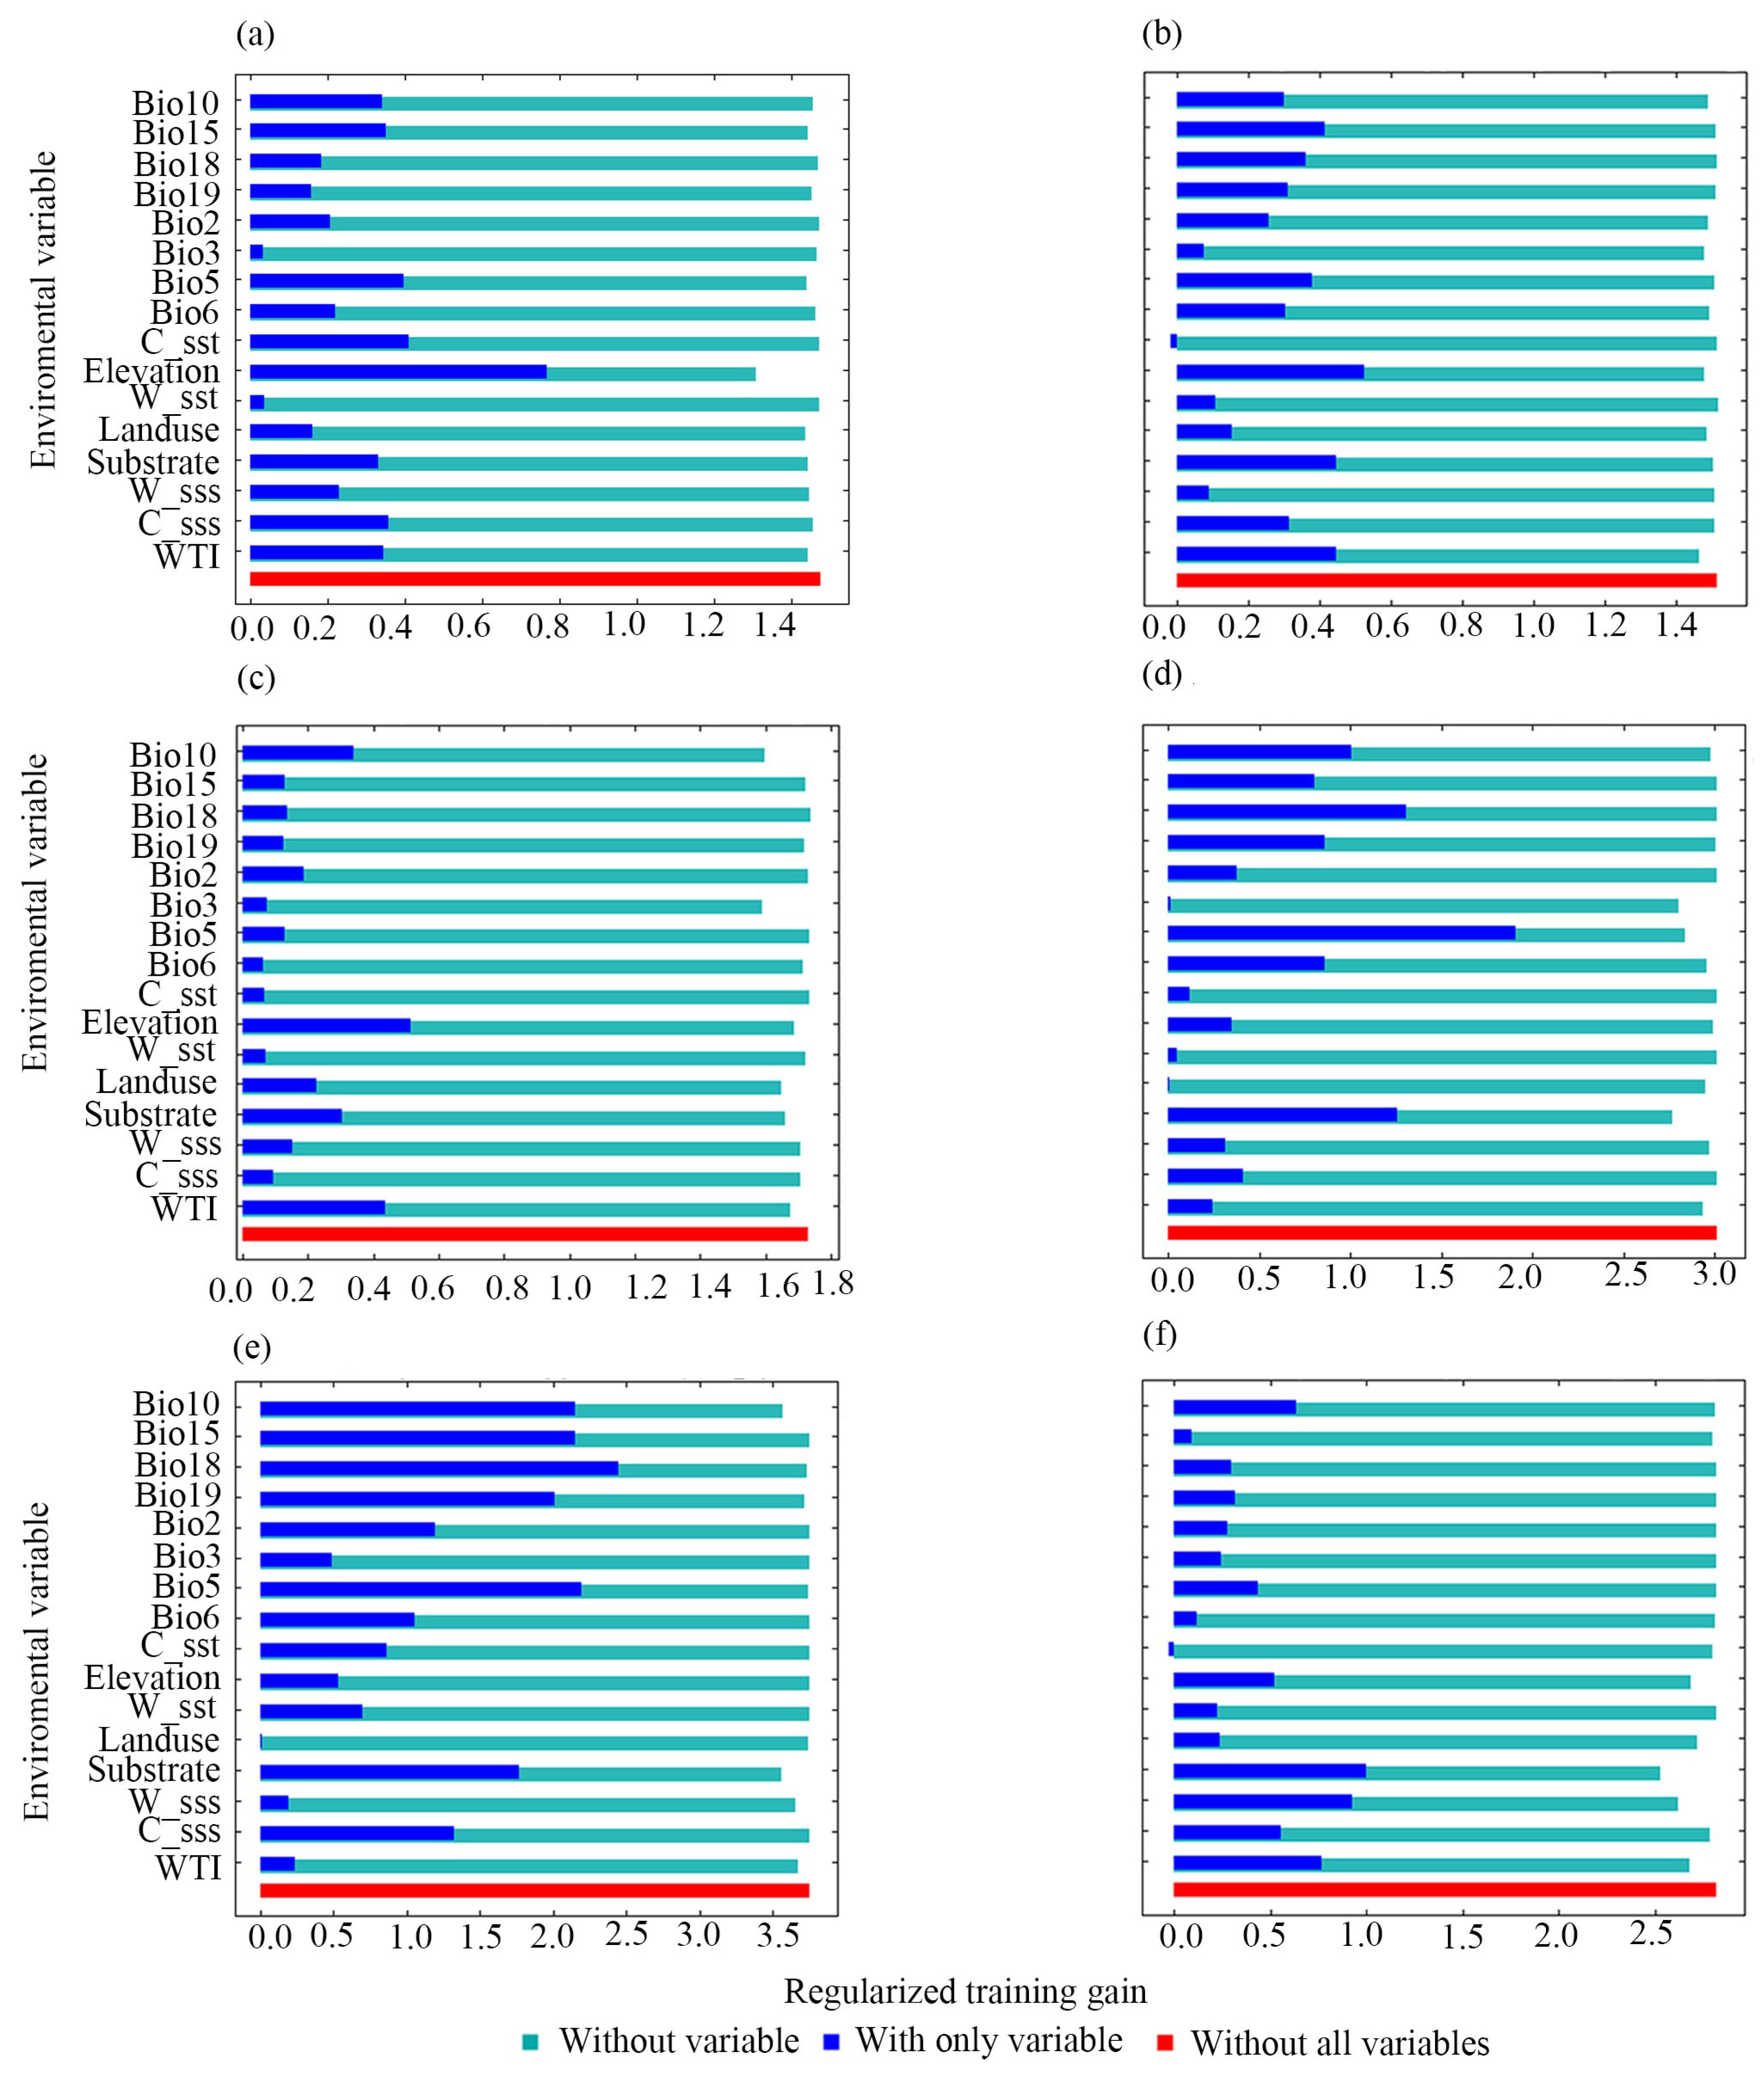
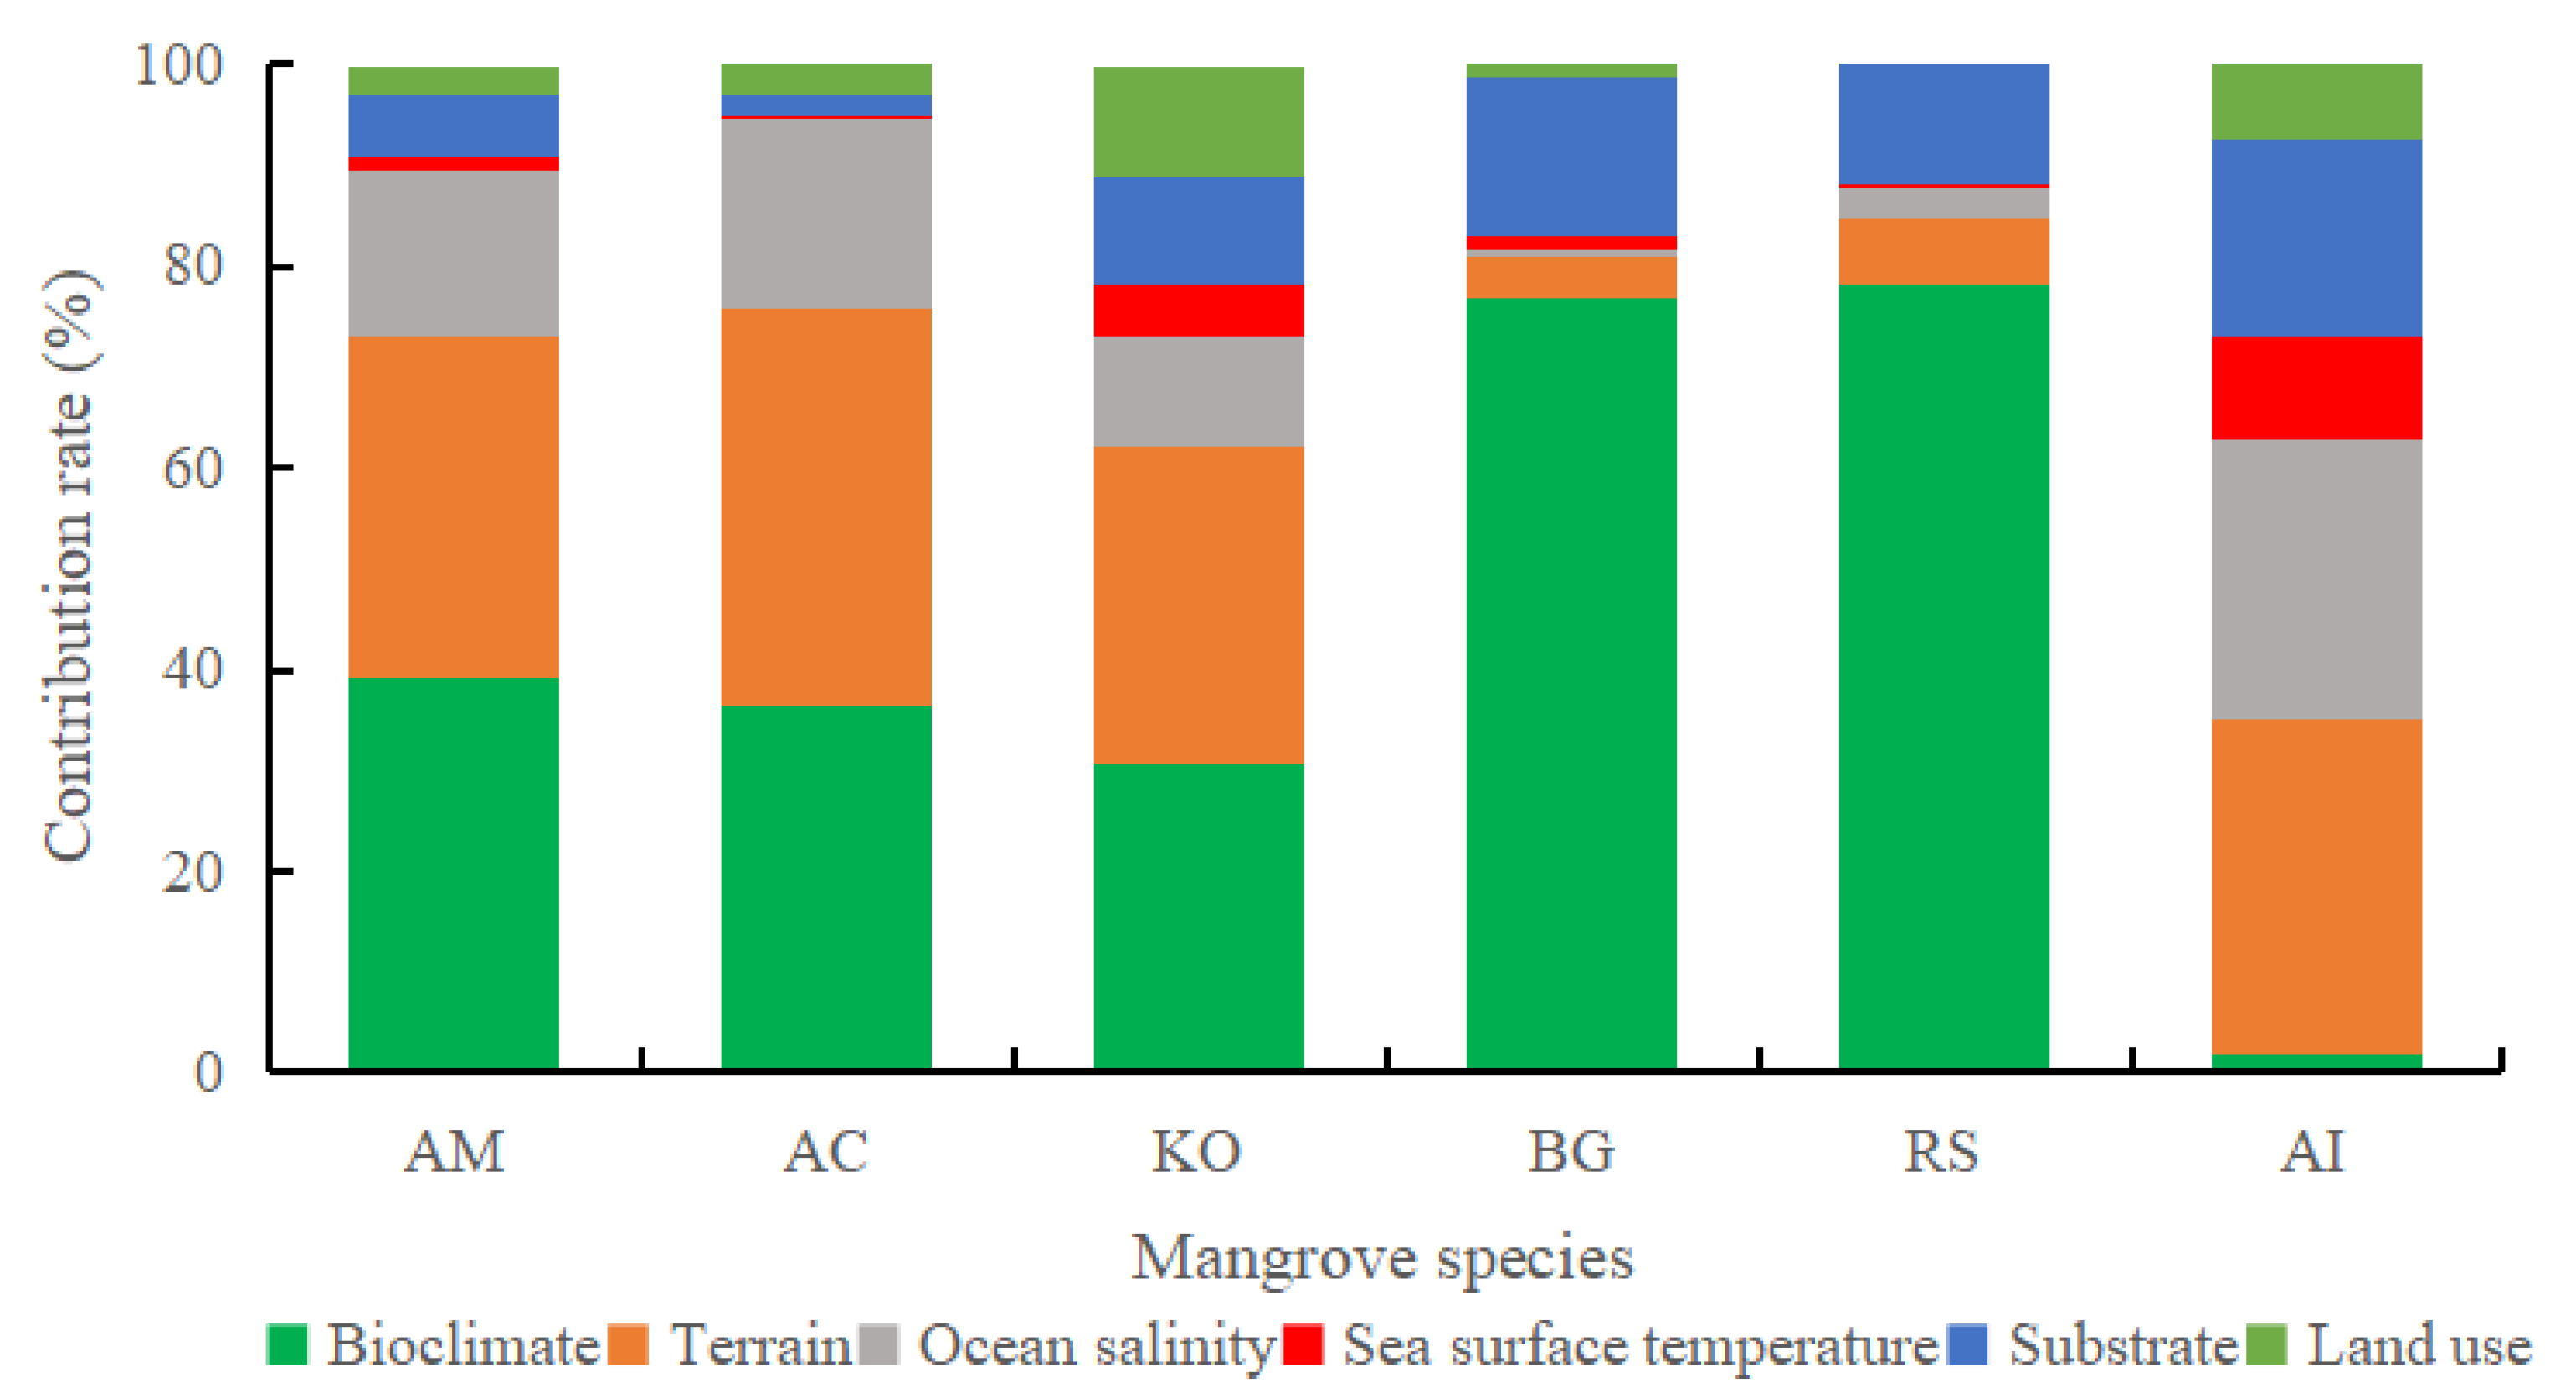
3.2. Analysis of Dominant Environmental Factors
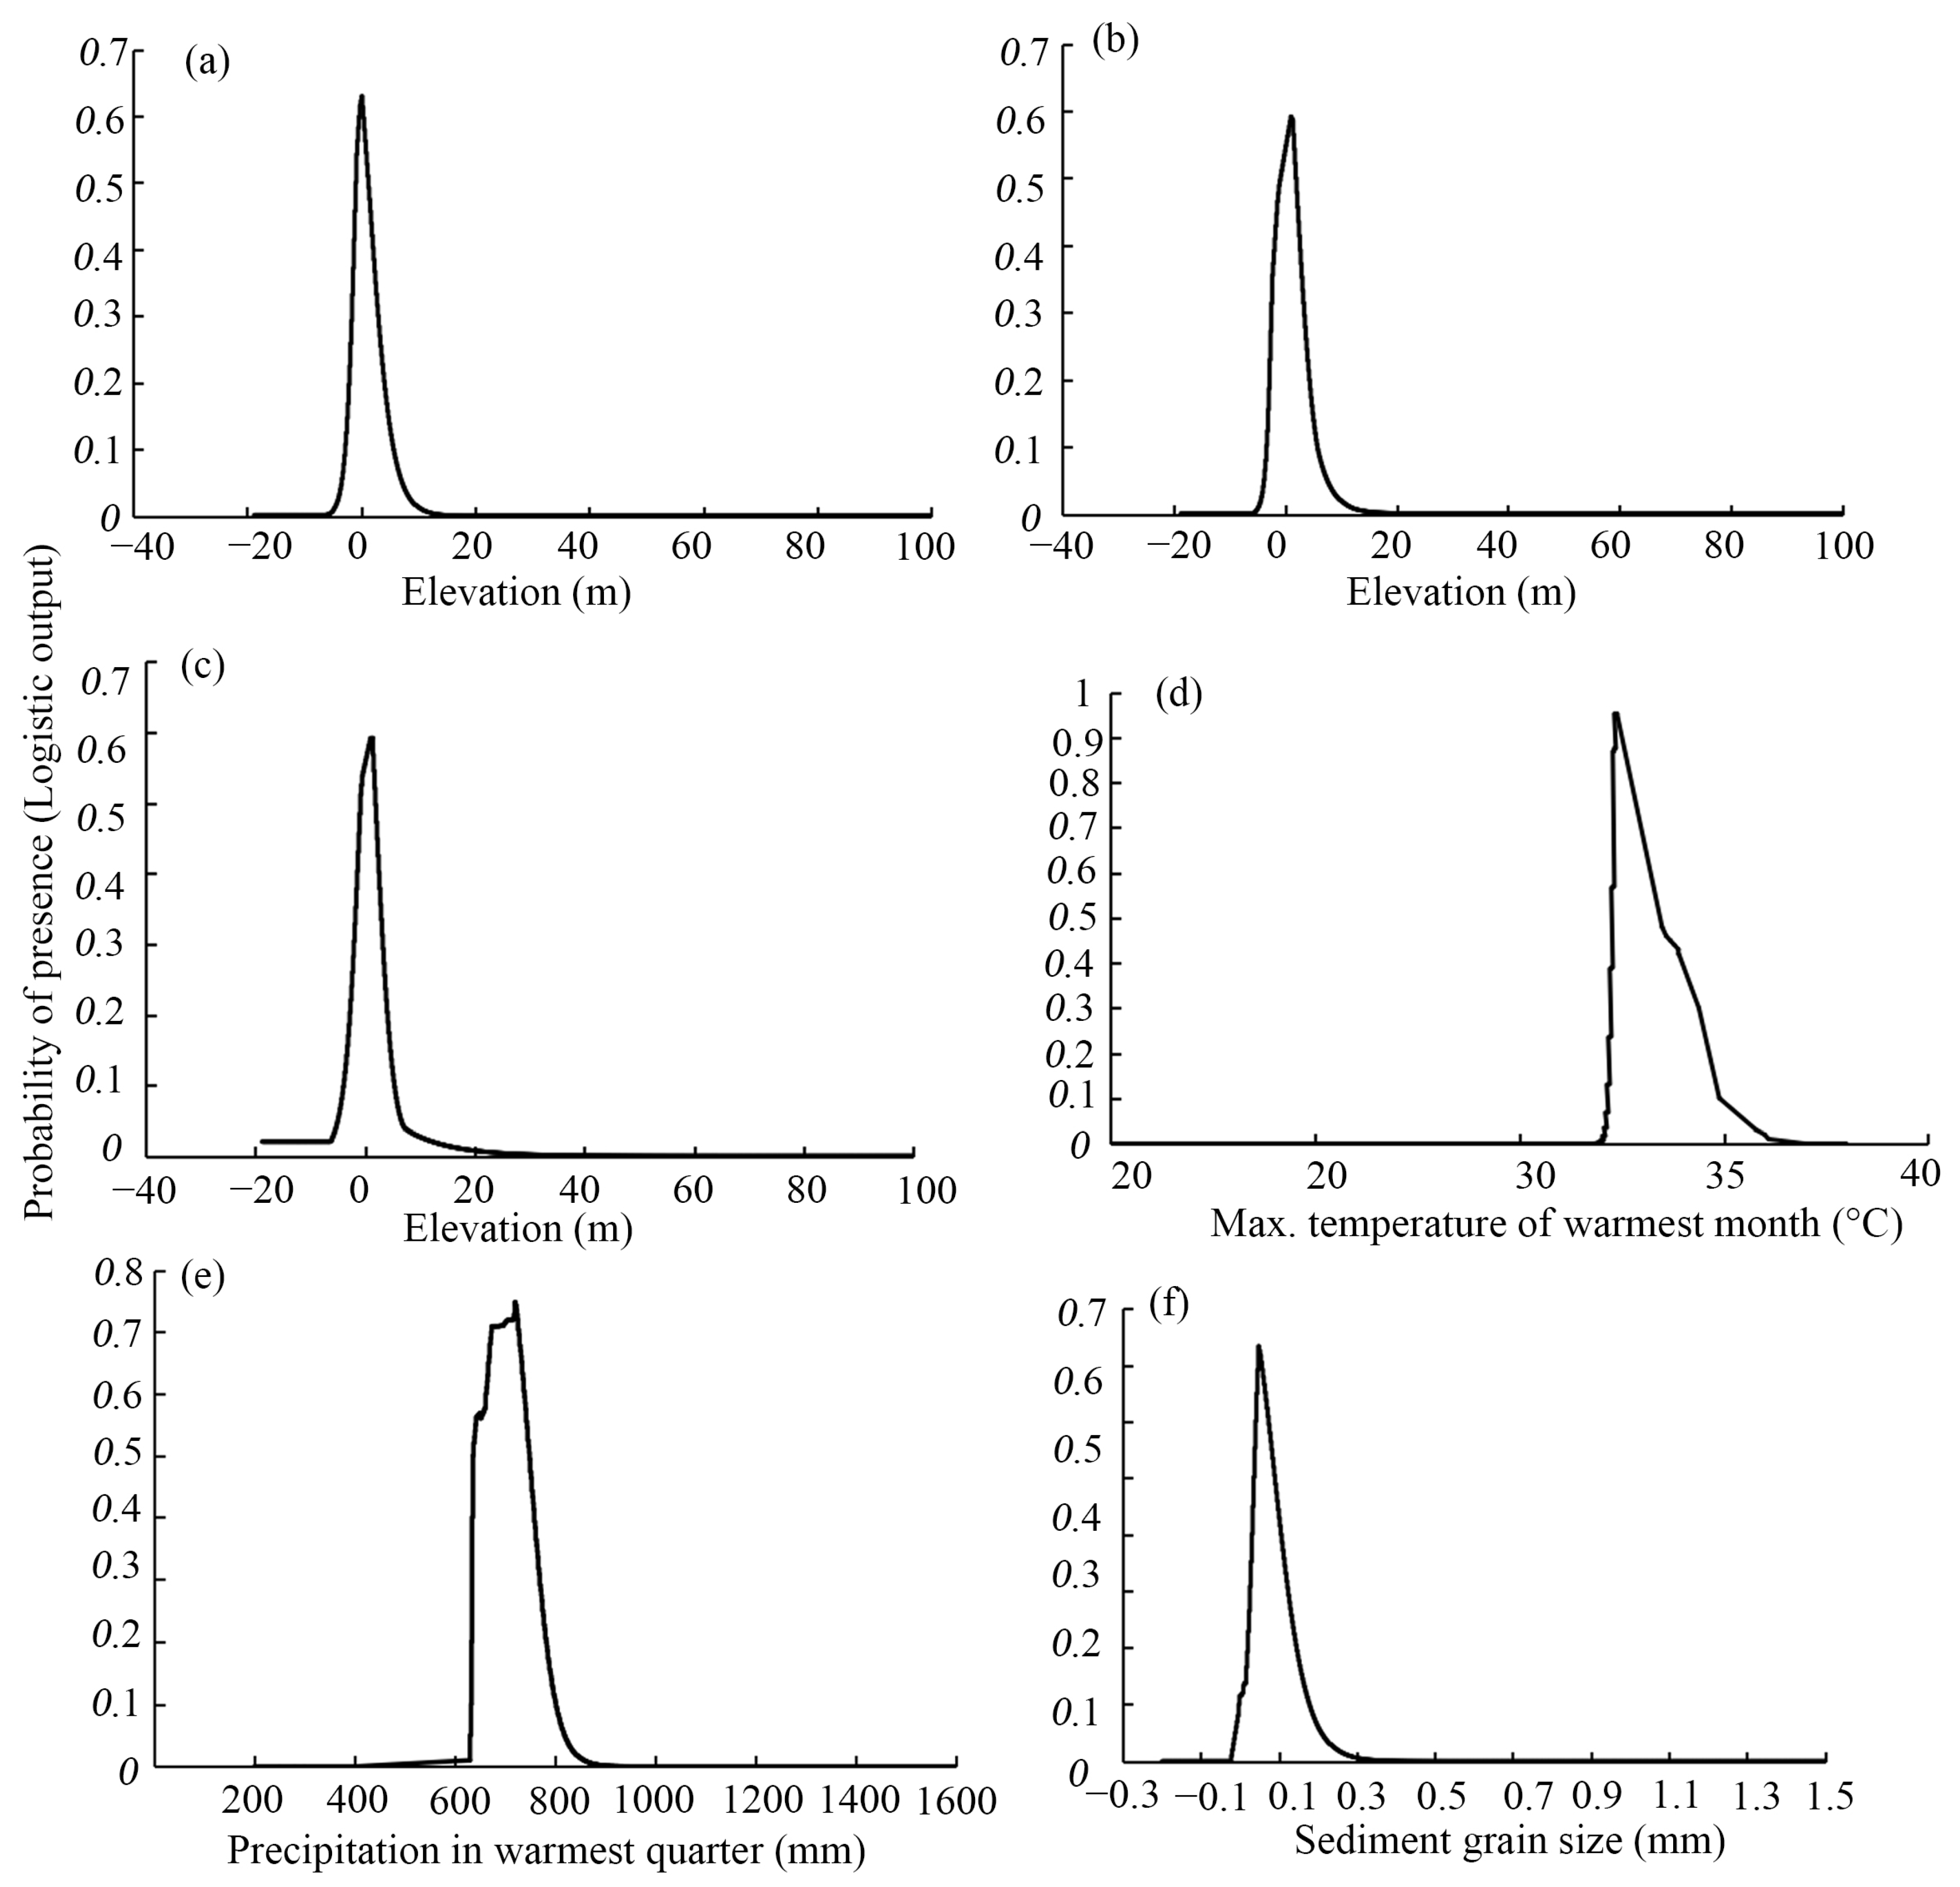
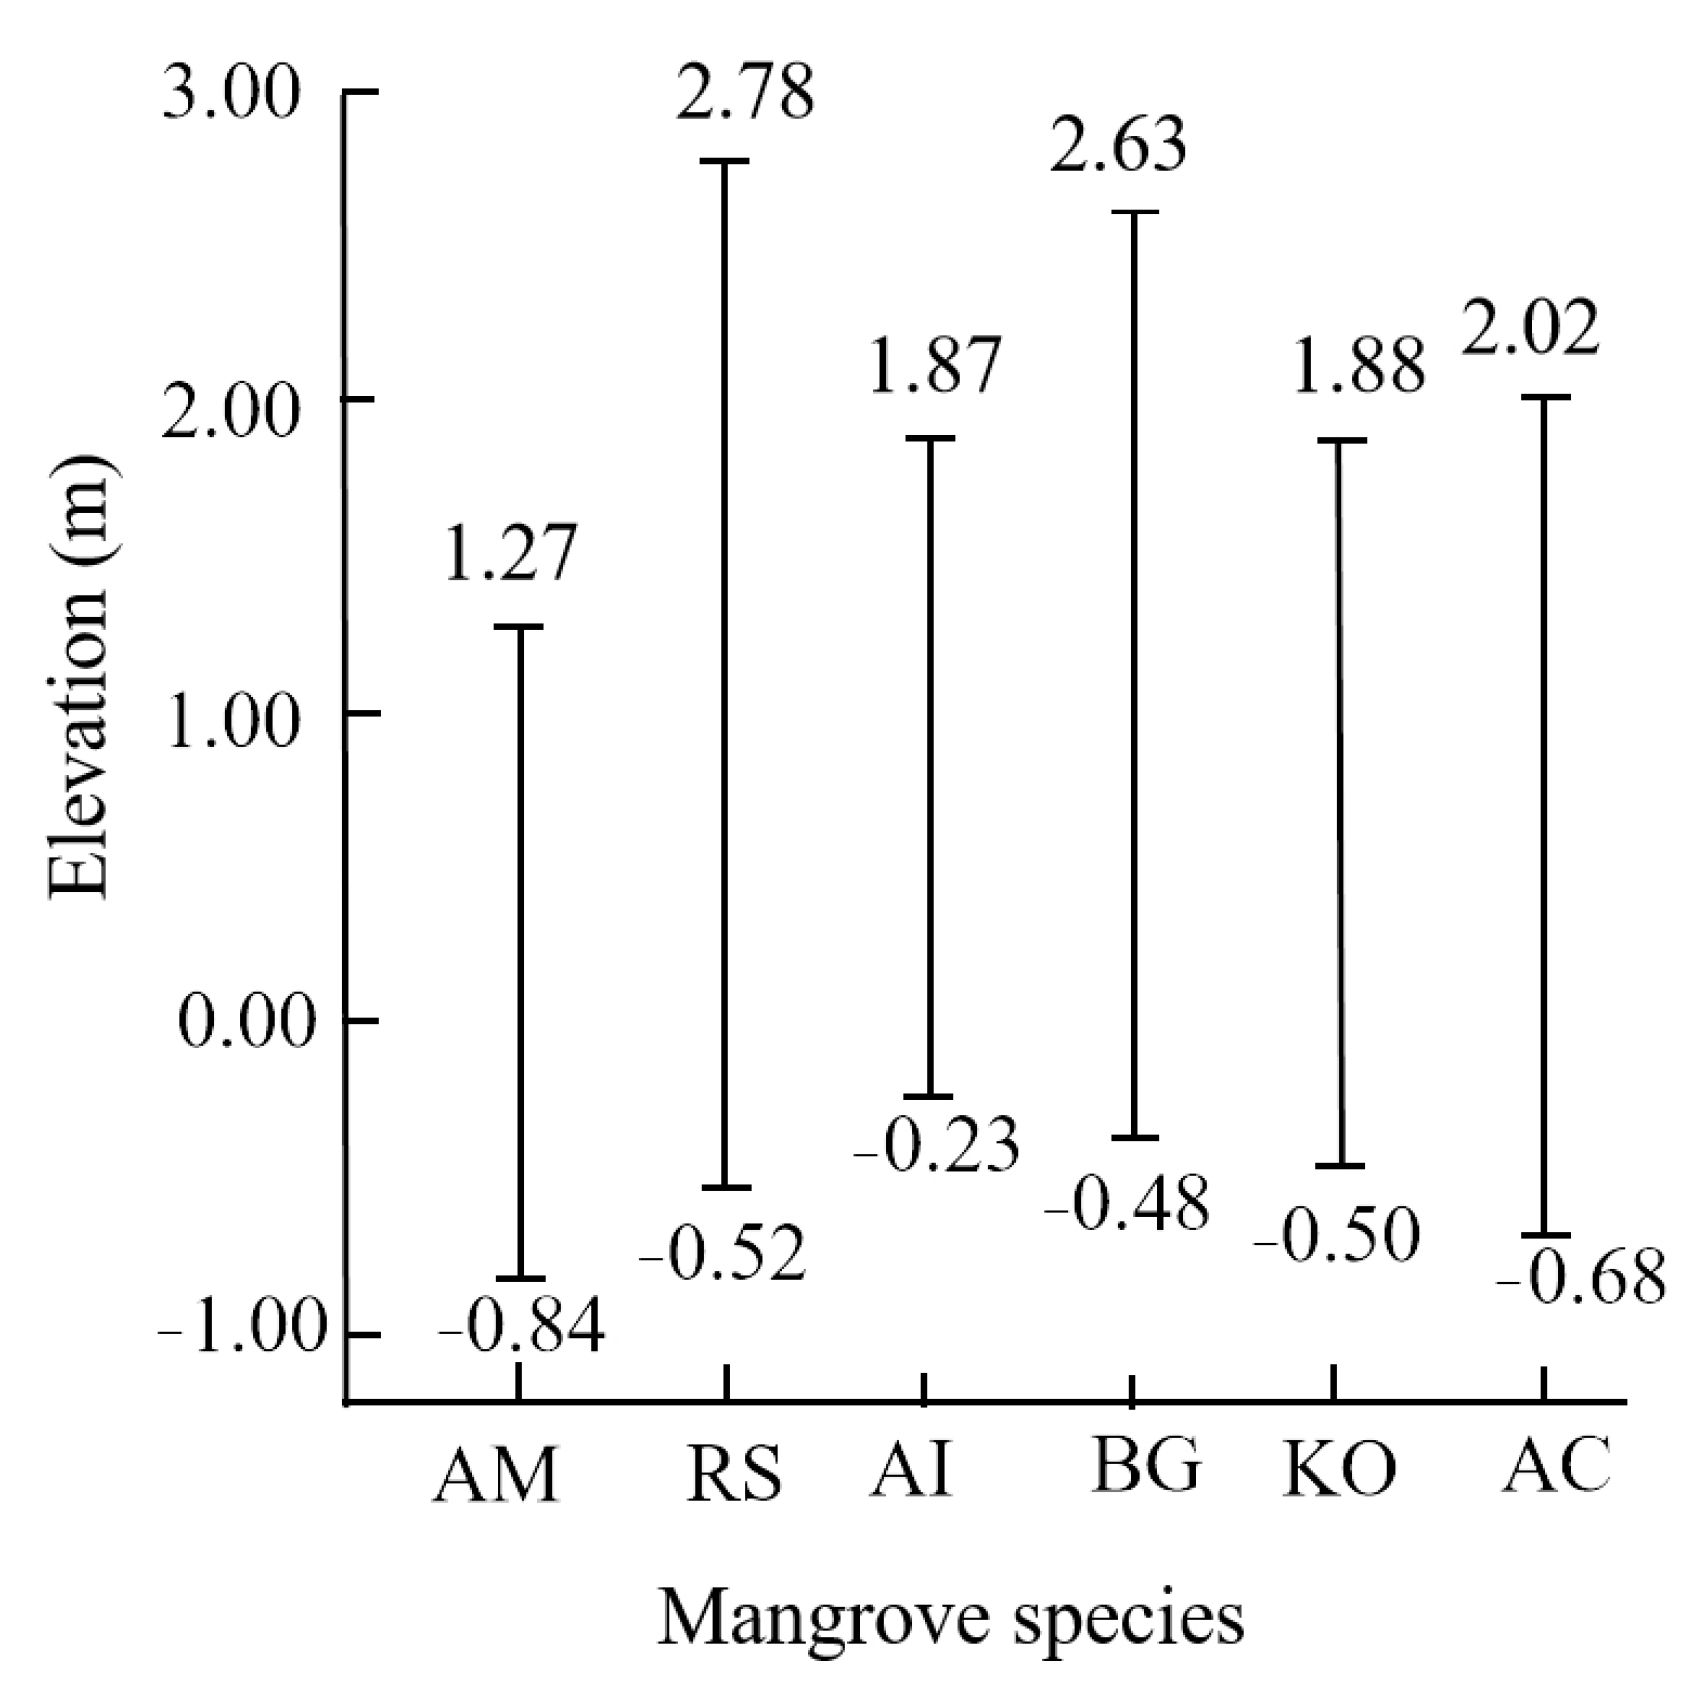
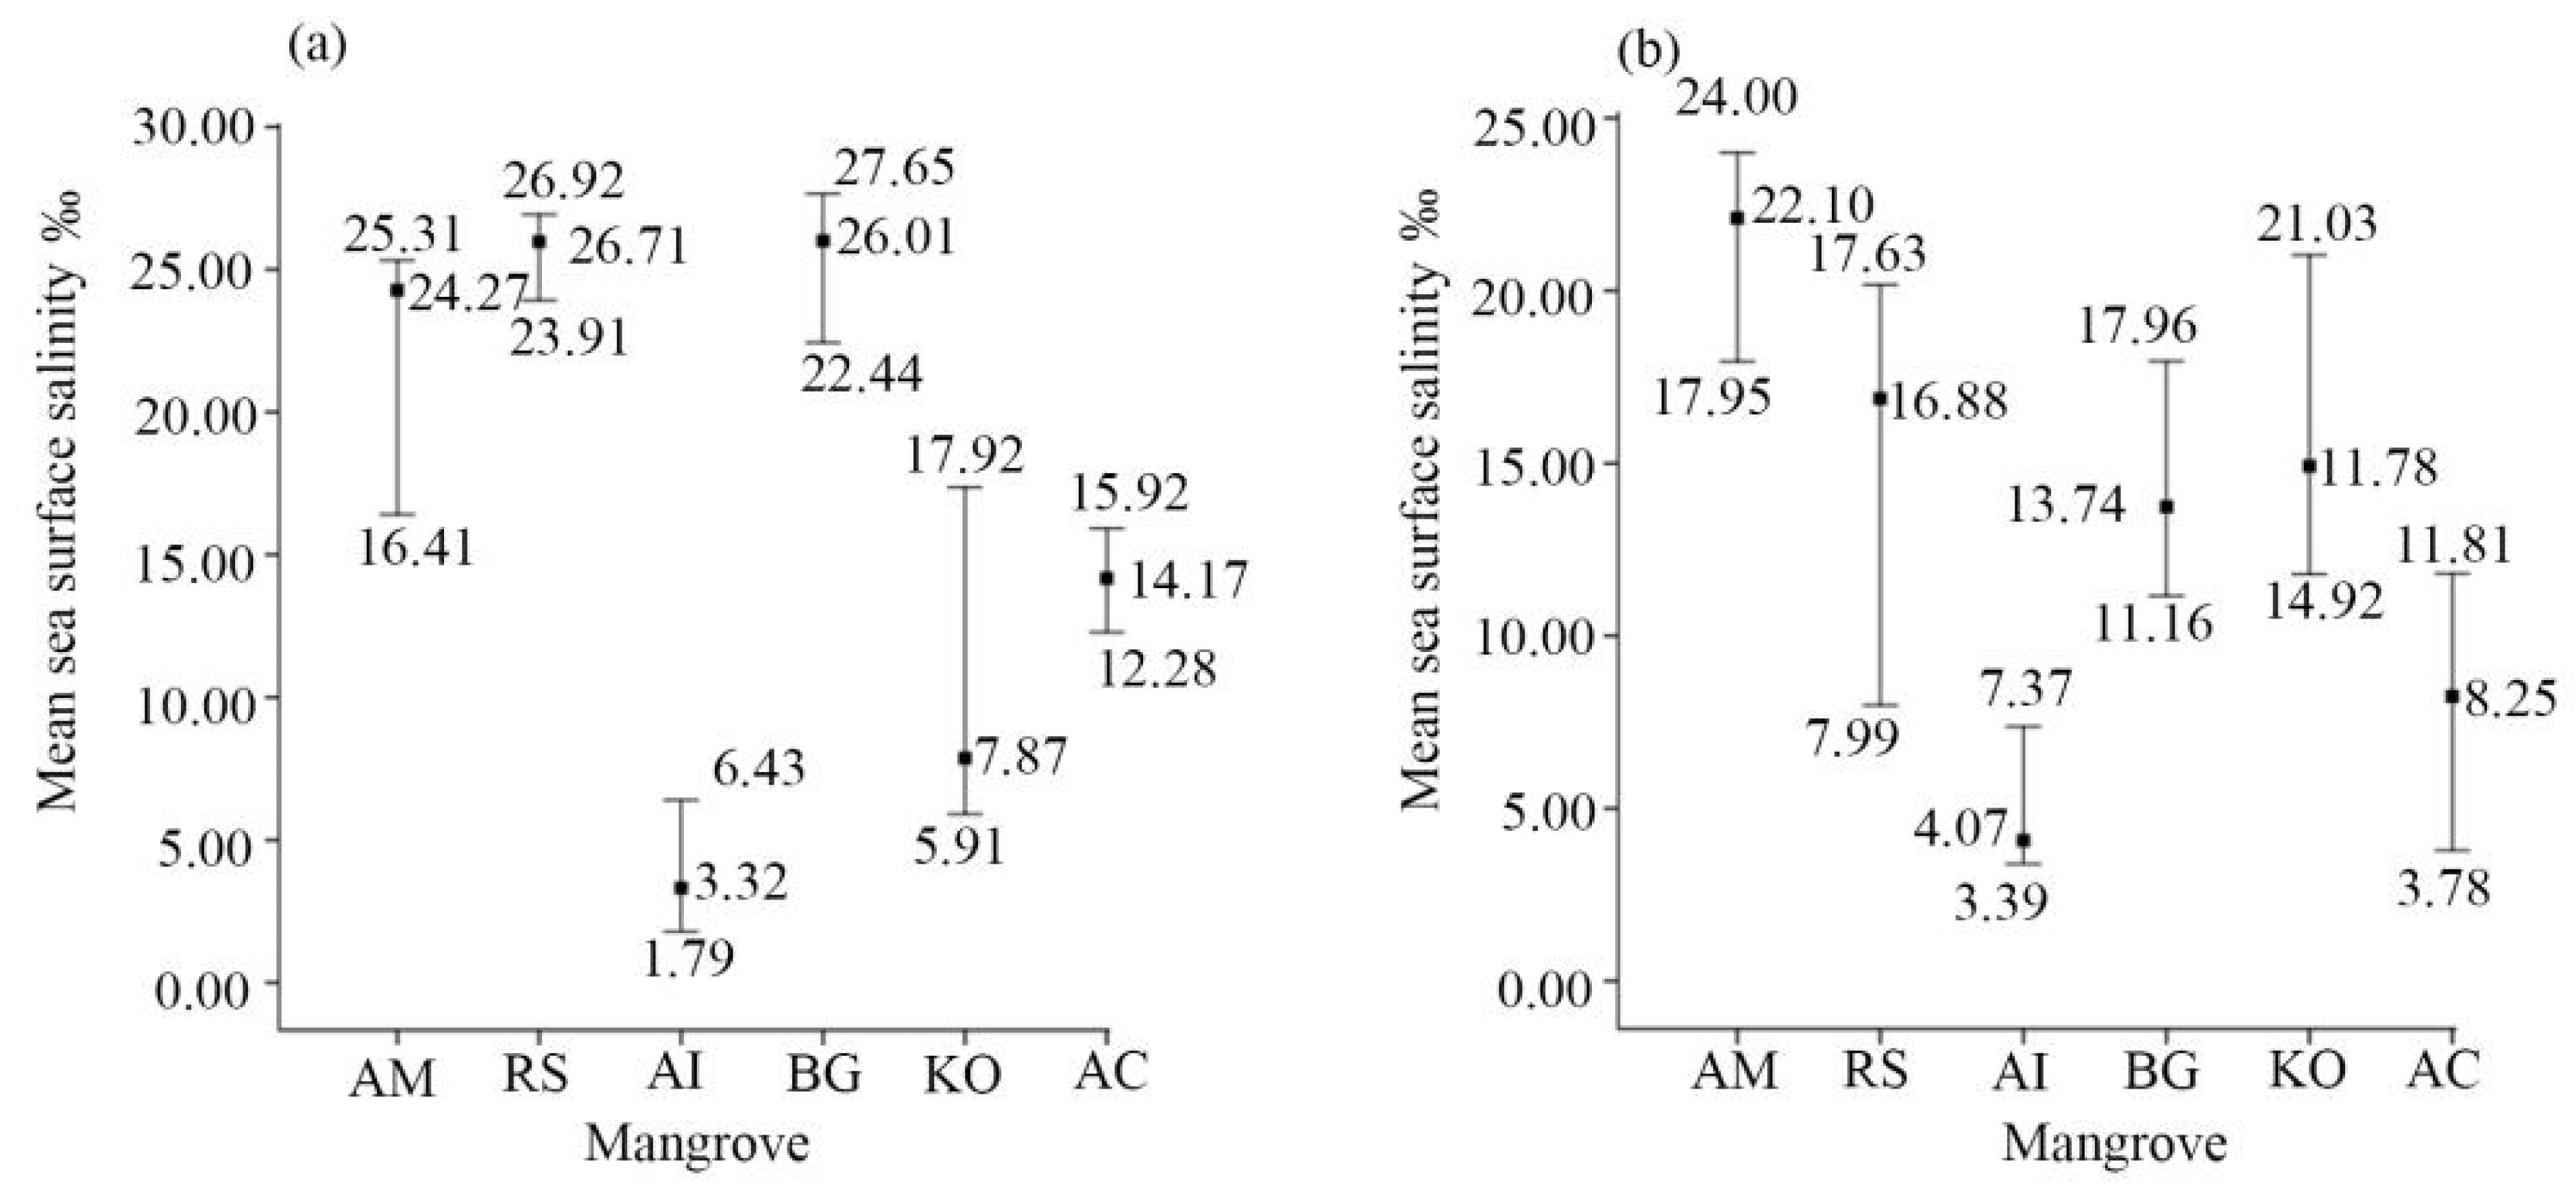
3.3. Ranges of Environmental Factors That Affect Mangrove Habitat Suitability
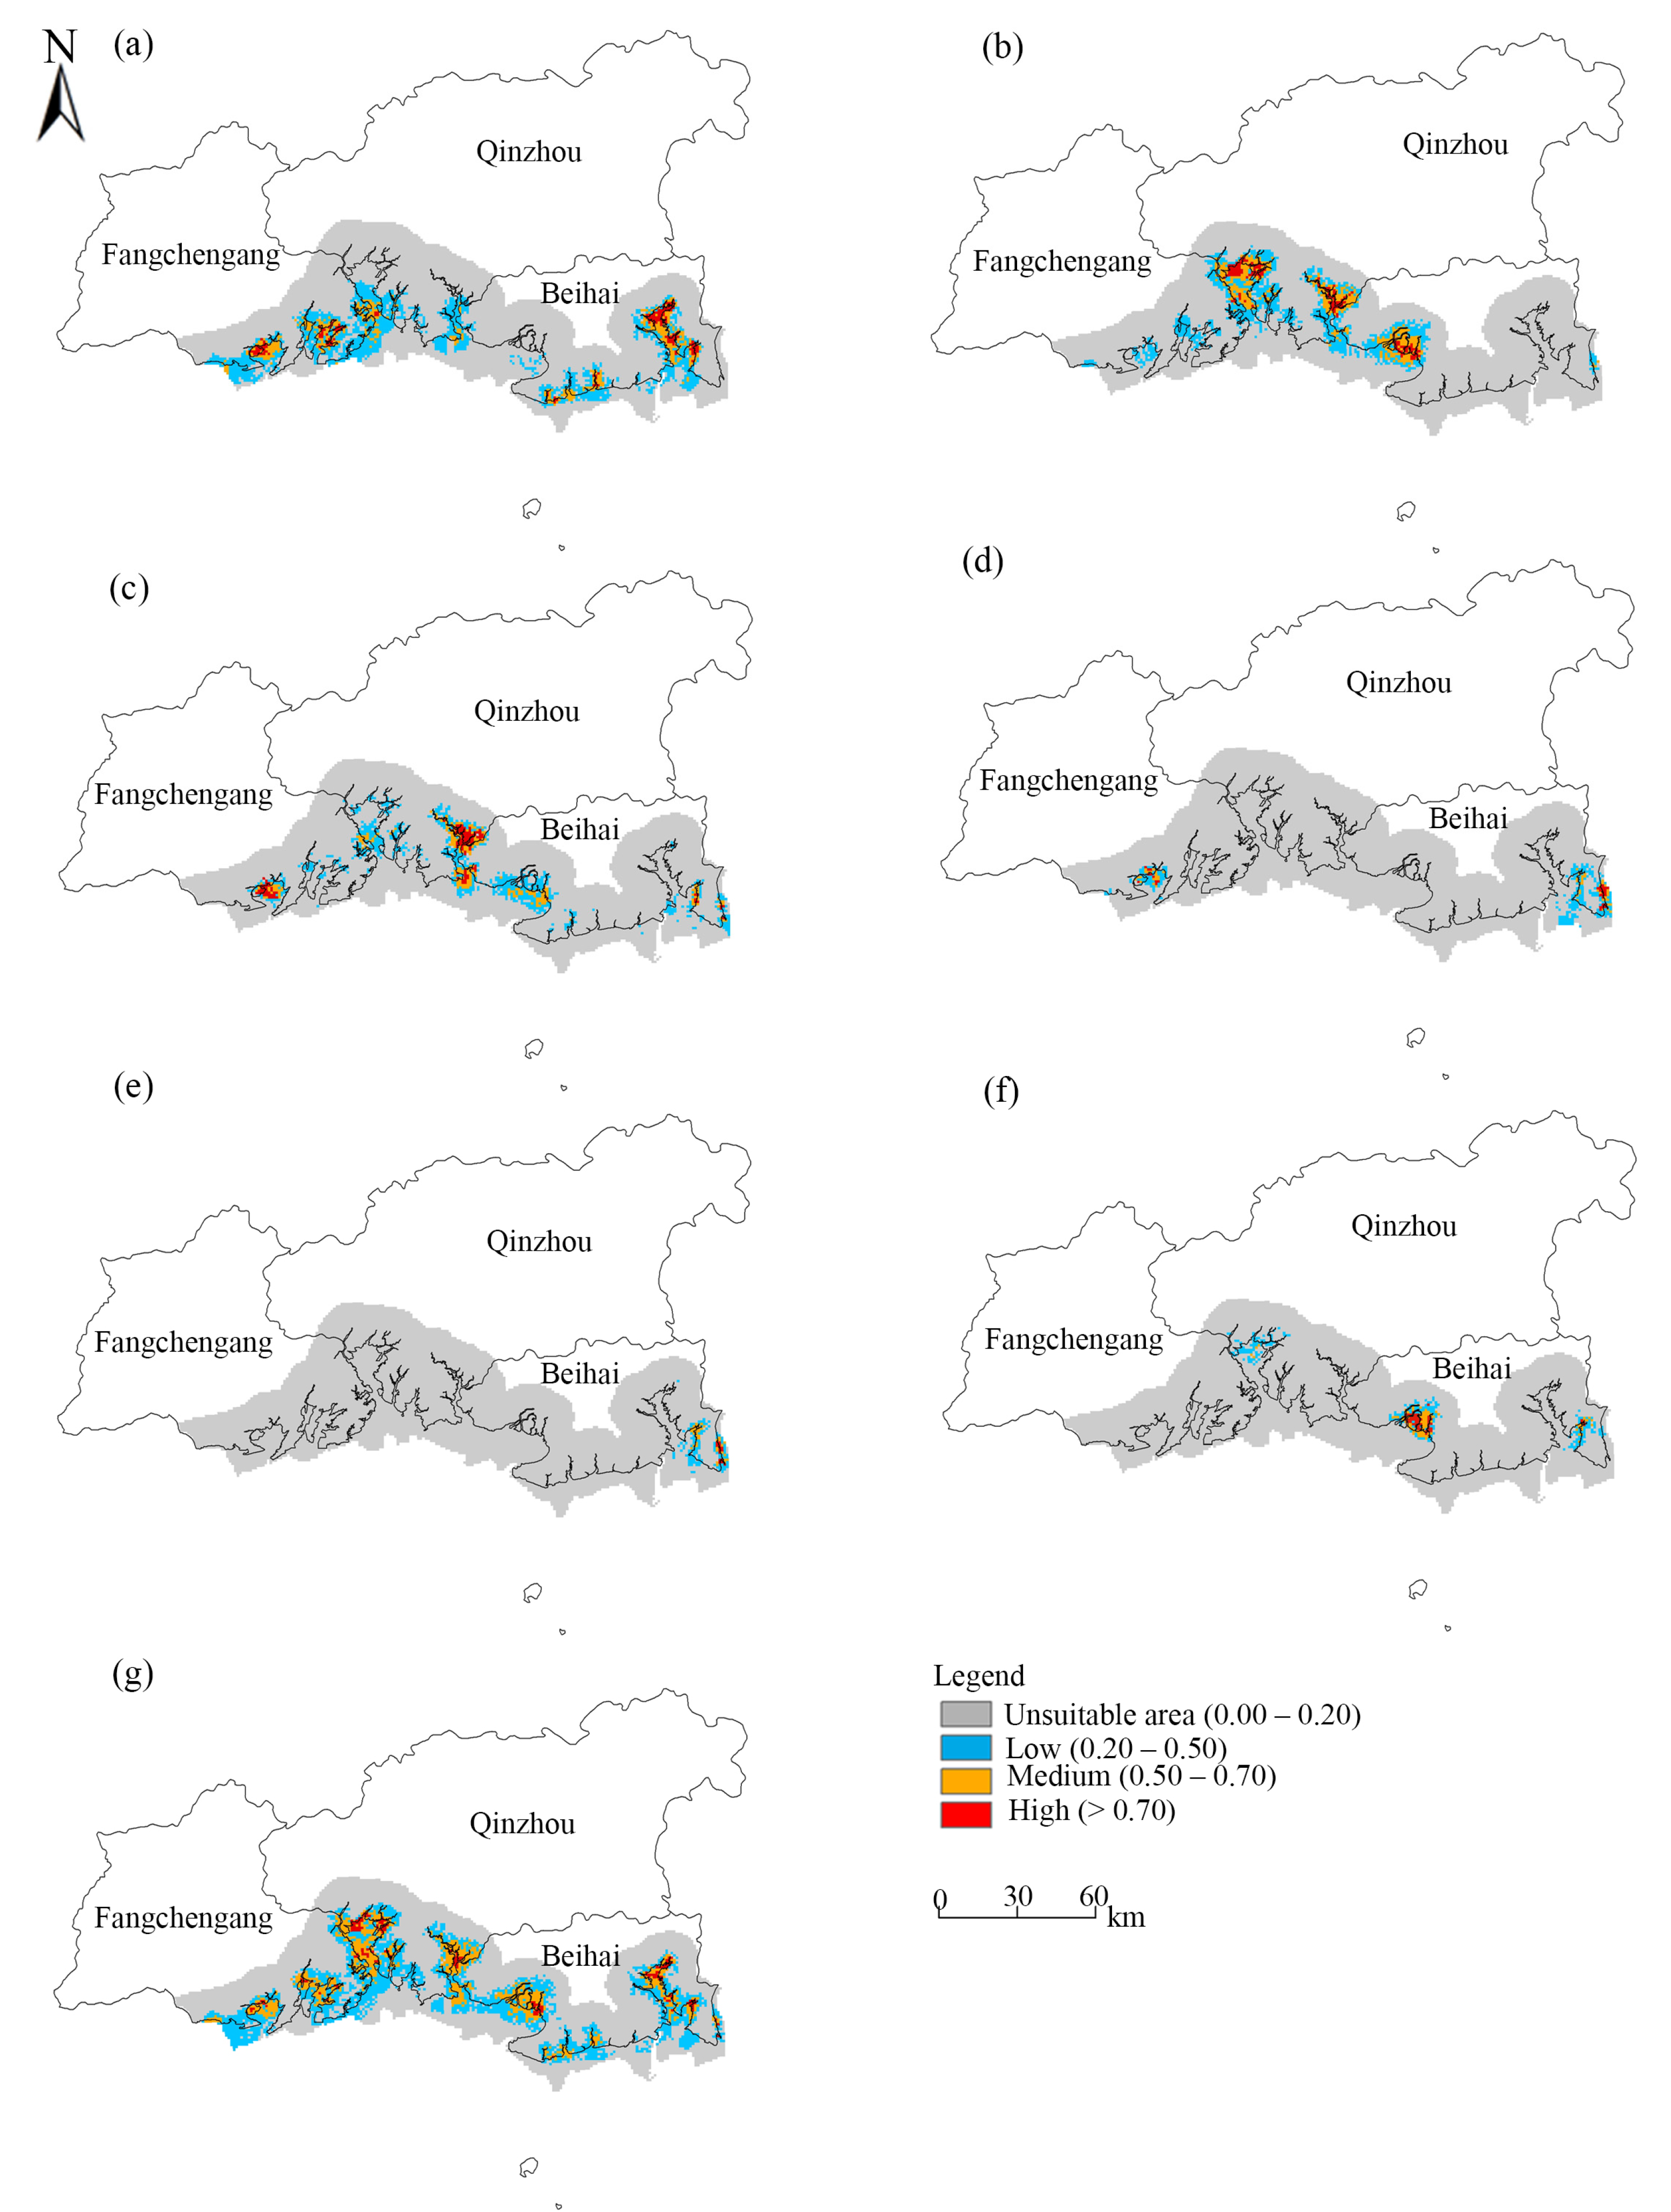
3.4. Suitable Mangrove Areas in the Beibu Gulf
4. Discussion
4.1. Dominant Environmental Factors Affecting Mangrove Suitability
4.2. Mangrove Restoration Recommendations
5. Conclusions
Author Contributions
Funding
Data Availability Statement
Acknowledgments
Conflicts of Interest
References
- Li, C.G.; Dai, H.B. Mechanism Analysis of Temporal Dynamics in Mangrove Spatial Distribution in Guangxi, China: 1960–2010. Acta Ecol. Sin. 2015, 35, 5992–6006. [Google Scholar] [CrossRef]
- Valiela, I.; Bowen, J.L.; York, J.K. Mangrove Forests: One of the World’s Threatened Major Tropical Environments. BioScience 2001, 51, 807–815. [Google Scholar] [CrossRef] [Green Version]
- Curnick, D.J.; Pettorelli, N.; Amir, A.A.; Balke, T.; Barbier, E.B.; Crooks, S.; Dahdouh-Guebas, F.; Duncan, C.; Endsor, C.; Friess, D.A.; et al. The Value of Small Mangrove Patches. Science 2019, 363, 239. [Google Scholar] [CrossRef] [Green Version]
- Hai, N.T.; Dell, B.; Phuong, V.T.; Harper, R.J. Towards a More Robust Approach for the Restoration of Mangroves in Vietnam. Ann. Forest Sci. 2020, 77, 18. [Google Scholar] [CrossRef] [Green Version]
- Thomas, N.; Lucas, R.; Bunting, P.; Hardy, A.; Rosenqvist, A.; Simard, M. Distribution and Drivers of Global Mangrove Forest Change, 1996–2010. PLoS ONE 2017, 12, e0179302. [Google Scholar] [CrossRef] [Green Version]
- Tao, Y.C.; Ge, W.B.; Liu, W.A.; Pan, L.H.; Qiu, G.L.; Wang, X.; Fan, H.Q. A Survey on the Spatial Distribution and Community Types of Mangroves in Guangxi Based on High—Resolution Satellite Imageries. J. Nat. Resour. 2017, 32, 1602–1614. [Google Scholar] [CrossRef]
- Fan, H.Q.; Mo, Z.C. The History, Achievements and Lessons Learnt for Mangrove Restoration in Guangxi, China. Guangxi Sci. 2018, 25, 363–371+387. [Google Scholar] [CrossRef]
- Balke, T.; Friess, D.A. Geomorphic Knowledge for Mangrove Restoration: A Pan-tropical Categorization. Earth Surf. Process Landforms. 2016, 41, 231–239. [Google Scholar] [CrossRef]
- Lin, P. The Characteristics of Mangrove Wetlands and Some Ecological Engineering Questions in China. Eng. Sci. 2003, 5, 33–38. [Google Scholar]
- Bell, G. Ecology-Neutral Macroecology. Science 2001, 293, 2413–2418. [Google Scholar] [CrossRef]
- Sobek-Swant, S.; Kluza, D.A.; Cuddington, K.; Lyons, D.B. Potential Distribution of Emerald Ash Borer: What Can We Learn From Ecological Niche Models Using Maxent and GARP? Forest Ecol. Manag. 2012, 281, 23–31. [Google Scholar] [CrossRef]
- Townsend Peterson, A.; Papeş, M.; Eaton, M. Transferability and Model Evaluation in Ecological Niche Modeling: A Comparison of GARP and Maxent. Ecography 2007, 30, 550–560. [Google Scholar] [CrossRef]
- Bao, R.; Li, X.L.; Zheng, J.H. Feature Tuning Improves MAXENT Predictions of the Potential Distribution of Pedicularis longiflora Rudolph and Its Variant. PeerJ. 2022, 10, e13337. [Google Scholar] [CrossRef] [PubMed]
- Cobben, M.M.P.; van Treuren, R.; Castañeda-Álvarez, N.P.; Khoury, C.K.; Kik, C.; van Hintum, T.J.L. Robustness and Accuracy of Maxent Niche Modelling for Lactuca species Distributions in Light of Collecting Expeditions. Plant Genet. Resour. 2015, 13, 153–161. [Google Scholar] [CrossRef] [Green Version]
- Liu, H.; Hui, Y.X.; Qi, H.; Gong, H.B.; Li, L.H.; Zhang, M.Y.; Li, Y.F.; Lin, Z.S. Combined Effects of Global Climate Suitability and Regional Environmental Variables on the Distribution of an Invasive Marsh Species Spartina alterniflora. Estuaries Coast. 2019, 42, 99–111. [Google Scholar] [CrossRef]
- West, A.M.; Kumar, S.; Brown, C.S.; Stohlgren, T.J.; Bromberg, J. Field Validation of an Invasive Species Maxent Model. Ecol. Inform. 2016, 36, 126–134. [Google Scholar] [CrossRef] [Green Version]
- Mukul, S.A.; Alamgir, M.; Sohel, M.S.I.; Pert, P.L.; Herbohn, J.; Turton, S.M.; Khan, M.S.I.; Munim, S.A.; Reza, A.H.M.A.; Laurance, W.F. Combined Effects of Climate Change and Sea-Level Rise Project Dramatic Habitat Loss of the Globally Endangered Bengal Tiger in the Bangladesh Sundarbans. Sci. Total Environ. 2019, 663, 830–840. [Google Scholar] [CrossRef]
- Wan, J.; Wang, C.; Yu, F. Effects of Occurrence Record Number, Environmental Variable Number, and Spatial Scales on MaxEnt Distribution Modelling for Invasive Plants. Biologia 2019, 74, 757–766. [Google Scholar] [CrossRef]
- Liu, X.; Liu, H.; Gong, H.; Lin, Z.; Lv, S.C. Appling the One-Class Classification Method of Maxent to Detect an Invasive Plant Spartina alterniflora With Time-Series Analysis. Remote Sens. 2017, 9, 1120. [Google Scholar] [CrossRef] [Green Version]
- Bai, R.; Li, N.; Liu, S.J.; Tong, J.H.; Chen, X.M.; Chu, H.P. Prediction of Global Suitable Area for White Root Disease of Rubber Tree Under Climate Change. Plant Prot. 2021, 47, 66–72. [Google Scholar] [CrossRef]
- Jayathilake, D.R.M.; Costello, M.J. A Modelled Global Distribution of the Seagrass Biome. Biol. Conserv. 2018, 226, 120–126. [Google Scholar] [CrossRef]
- Yan, M.Y.; Li, Q.Z.; Song, J.; Wang, Z.H.; Wang, Y.J.; Hu, M.H. Prediction of Potential Distribution Areas of Chinese Horseshoe Crab and Mangrove Horseshoe Crab in the Beibu Gulf of Guangxi Based on MAXENT Model and Their Population Conservation Strategies. Acta Ecol. Sin. 2019, 39, 3100–3109. [Google Scholar] [CrossRef]
- Zellmer, A.J.; Claisse, J.T.; Williams, C.M.; Schwab, S.; Pondella, D.J. Predicting Optimal Sites for Ecosystem Restoration Using Stacked-Species Distribution Modeling. Front. Mar. Sci. 2019, 6, 6. [Google Scholar] [CrossRef] [Green Version]
- Charrua, A.B.; Bandeira, S.O.; Catarino, S.; Cabral, P.; Romeiras, M.M. Assessment of the Vulnerability of Coastal Mangrove Ecosystems in Mozambique. Ocean Coast Manag. 2020, 189, 105145. [Google Scholar] [CrossRef]
- Rodríguez-Medina, K.; Yañez-Arenas, C.; Peterson, A.T.; Euán Ávila, J.; Herrera-Silveira, J. Evaluating the Capacity of Species Distribution Modeling to Predict the Geographic Distribution of the Mangrove Community in Mexico. PLoS ONE 2020, 15, e0237701. [Google Scholar] [CrossRef] [PubMed]
- Wang, Y.Y.; Chao, B.X.; Dong, P.; Zhang, D.A.; Yu, W.W.; Hu, W.J.; Ma, Z.Y.; Chen, G.C.; Liu, Z.H.; Chen, B. Simulating Spatial Change of Mangrove Habitat Under the Impact of Coastal Land Use: Coupling MaxEnt and Dyna-CLUE Models. Sci. Total Environ. 2021, 788, 147914. [Google Scholar] [CrossRef]
- Chao, B.X.; Hu, W.J.; Chen, B.; Zhang, D.; Chen, G.C.; Yu, W.W.; Ma, Z.Y.; Lei, G.C.; Wang, Y.Y. Potential suitable habitat of mangroves and conservation gap analysis in Guangdong Province with MaxEnt Modeling. Chin. J. Ecol. 2020, 39, 3785–3794. [Google Scholar] [CrossRef]
- Hu, W.J.; Cao, B.X.; Wang, Y.Y.; Dong, P.; Zhang, D.; Yu, W.W.; Chen, G.C.; Chen, B. Assessing the Potential Distributions of Mangrove Forests in Fujian Province Using MaxEnt Model. China Environ. Sci. 2020, 40, 4029–4038. [Google Scholar] [CrossRef]
- Hu, W.J.; Wang, Y.; Dong, P.; Zhang, D.; Yu, W.; Ma, Z.; Chen, G.; Liu, Z.; Du, J.; Chen, B.; et al. Predicting Potential Mangrove Distributions at the Global Northern Distribution Margin Using an Ecological Niche Model: Determining Conservation and Reforestation Involvement. Forest Ecol. Manag. 2020, 478, 118517. [Google Scholar] [CrossRef]
- Hu, W.J.; Wang, Y.; Zhang, D.; Yu, W.; Chen, G.; Xie, T.; Liu, Z.; Ma, Z.; Du, J.; Chao, B.; et al. Mapping the Potential of Mangrove Forest Restoration Based on Species Distribution Models: A Case Study in China. Sci. Total Environ. 2020, 748, 142321. [Google Scholar] [CrossRef]
- Chao, B.X.; Wang, Y.Y.; Yu, W.W.; Ma, Z.Y.; Chen, G.C.; Chen, B.; Hu, W.J. Predicting Mangrove Forest Distribution Driven by Land Uses in Guangdong Province. China Environ. Sci. 2021, 41, 5282–5291. [Google Scholar]
- Liu, W.A.; Li, L.F.; Xue, Y.H.; Tao, Y.C. Study on the Population Size and Distribution of Rhizophora stylosa in Lan’gen Village of Beihai City Based on Google Earth High Resolution Image. J. Guangxi Acad. Sci. 2021, 37, 264–269. [Google Scholar] [CrossRef]
- Chen, X.M.; Lei, Y.C.; Zhang, X.Q.; Jia, H.Y. Effects of Sample Sizes on Accuracy and Stability of Maximum Entropy Model in Predicting Species Distribution. Sci. Silvae Sin. 2012, 48, 53–59. [Google Scholar] [CrossRef]
- Peng, Y.; Zheng, M.; Zheng, Z.; Wu, G.; Chen, Y.; Xu, H.; Tian, G.; Peng, S.; Chen, G.; Lee, S.Y. Virtual Increase or Latent Loss? A Reassessment of Mangrove Populations and Their Conservation in Guangdong, Southern China. Mar. Pollut. Bull. 2016, 109, 691–699. [Google Scholar] [CrossRef] [PubMed]
- Lan, W.L.; Li, T.S.; Han, L.J. Distribution and Seasonal Variation of Nutrition in the Adjacent Waters of Tieshan Harbor in Guangxi. Mar. Sci. 2014, 38, 63–69. [Google Scholar] [CrossRef]
- Wei, M.X.; He, B.M.; Tong, W.P. Frontal Characteristic of the Salinity and Its Relations to Environmental Factors in Nanliujiang Estuary, Guangxi. J. Oceanogr. Taiwan Strait. 2006, 25, 526–532. [Google Scholar] [CrossRef]
- Xiao, X.; Shi, Y.H.; Feng, X.L.; Xu, Y.Q. Surface Sediment Characteristics and Dynamics in Beibu Gulf. Period. Ocean Univ. China 2016, 46, 083–089. [Google Scholar] [CrossRef]
- Ta, Q.; Li, Y.K.; Fan, W.Q.; Shan, J.H.; Tu, X.B.; Ying, Q.; Liao, L.J.; Shao, R.Q.; Shen, J. Predicting the Potential Distribution of Chinese Pangolin Using the MaxEnt Model. Acta Ecol. Sin. 2021, 41, 9941–9952. [Google Scholar] [CrossRef]
- Cai, X.J.; Wu, Z.F.; Cheng, J. Analysis of Road Network Pattern and Landscape Fragmentation Based on Kernel Density Estimation. Chin. J. Ecol. 2012, 31, 160–166. [Google Scholar] [CrossRef]
- Swets, J.A. Measuring the Accuracy of Diagnostic Systems. Science 1988, 240, 1285–1293. [Google Scholar] [CrossRef] [Green Version]
- Chen, L.; Lin, Q.; Krauss, K.W.; Zhang, Y.; Cormier, N.; Yang, Q. Forest Thinning in the Seaward Fringe Speeds up Surface Elevation Increment and Carbon Accumulation in Managed Mangrove Forests. J. Appl. Ecol. 2021, 58, 1899–1909. [Google Scholar] [CrossRef]
- Liu, L.; Fan, H.Q.; Li, C.G. Tide elevations for four mangrove species along western coast of Guangxi, China. Acta Ecol. Sin. 2012, 32, 690–698. [Google Scholar] [CrossRef]
- Liao, Y.X.; Pan, L.H.; Yan, B.; Shi, X.F. Analysis of Distribution Characteristics and Species Diversity of Mangrove Communities in Lianzhou Bay, Guangxi. J. Guangxi Acad. Sci. 2020, 36, 361–370. [Google Scholar] [CrossRef]
- He, B.Y.; Lai, T.H.; Chen, J.F.; Qiu, G.L. Studies of the Tolerance of Avicennia marina and Aegiceras Corniculatum to Seawater Immersion in Guangxi, China. Acta Ecol. Sin. 2007, 27, 1130–1138. [Google Scholar]
- Mo, Z.C. A Preliminary Study on the Site Conditions of Mangroves in Guangxi. Guangxi For. Sci. 2002, 31, 122–127. [Google Scholar]
- Barik, J.; Mukhopadhyay, A.; Ghosh, T.; Mukhopadhyay, S.K.; Chowdhury, S.M.; Hazra, S. Mangrove Species Distribution and Water Salinity: An Indicator Species Approach to Sundarban. J. Coast. Conserv. 2018, 22, 361–368. [Google Scholar] [CrossRef]
- Meng, X.; Xia, P.; Li, Z.; Meng, D. Mangrove Development and Its Response to Asian Monsoon in the Yingluo Bay (SW China) Over the Last 2000 Years. Estuaries Coasts. 2017, 40, 540–552. [Google Scholar] [CrossRef]
- Sinsin, C.B.L.; Salako, K.V.; Fandohan, A.B.; Zanvo, M.G.S.; Kouassi, K.E.; Glèlè Kakaï, R.L.G. Pattern of Seedling Emergence and Early Growth in Avicennia germinans and Rhizophora racemosa Along an Experimental Salinity Gradient. Afr. J. Ecol. 2021, 59, 1013–1022. [Google Scholar] [CrossRef]
- Tang, M.; Li, K.; Xiang, H.Y.; Dong, X.; Jin, H.X.; Wang, Y.; Yang, H.J.; Zhang, Z.X. Research on Ecological, Physiological and Morphological Adaptability of Two Mangrove Species to Salt Stress. Ecol. Sci. 2014, 33, 513–519. [Google Scholar]
- Biber, P.D. Measuring the Effects of Salinity Stress in the Red Mangrove, Rhizophora mangle L. Afr. J. Agric. Res. 2006, 1, 1–4. [Google Scholar] [CrossRef]
- Jayatissa, L.P.; Wickramasinghe, W.A.A.D.L.; Dahdouh-Guebas, F.; Huxham, M. Interspecific Variations in Responses of Mangrove Seedlings to Two Contrasting Salinities. Internat. Rev. Hydrobiol. 2008, 93, 700–710. [Google Scholar] [CrossRef] [Green Version]
- Ye, Y.; Lu, C.Y.; Hu, H.Y.; Tang, F.Y. Comparisons of Tolerances to Salt Stress Among Three Salt-Secreting Mangrove Species. Acta Ecol. Sin. 2004, 24, 2444–2450. [Google Scholar] [CrossRef]
- Zhang, Q.M.; Sui, S.Z.; Zhang, Y.H.; Yu, H.B.; Shun, Z.X.; Wen, X.S. Marine environmental indexes related to mangrove growth. Acta Ecol. Sin. 2001, 21, 1427–1436. [Google Scholar] [CrossRef]


| Mangrove Species | Image Diagram | RGB | Characteristic Description |
|---|---|---|---|
| A. marina |  | R: 43 G: 67 B: 68 | Distributed in sheets with a blue-green crown |
| A. corniculatum |  | R: 60 G: 68 B: 60 | Distributed in sheets with a yellow-green crown |
| K. obovata |  | R: 24 G: 47 B: 34 | Distributed in sheets with a dark green crown |
| B. gymnorrhiza |  | R: 45 G: 76 B: 70 | Distributed as a single plant with a nearly round or round blue-green crown |
| R. stylosa |  | R: 31 G: 61 B: 33 | Distributed as a single plant with a nearly round or round dark green crown |
| A. ilicifolius |  | R: 26 G: 57 B: 35 | Distributed in sheets with a green tree crown |
| Data Type | Variable | Description | Unit |
|---|---|---|---|
| Bioclimatic | Bio2 | Mean diurnal range [mean of monthly (max. temp–min. temp)] | °C × 10 |
| Bio3 | Isothermality (BIO2/BIO7) (×100) | % | |
| Bio5 | Maximum temperature of warmest month | °C × 10 | |
| Bio6 | Minimum temperature of the coldest month | °C × 10 | |
| Bio10 | Mean temperature of the warmest quarter | °C × 10 | |
| Bio15 | Precipitation seasonality (coefficient of variation) | % | |
| Bio18 | Precipitation in the warmest quarter | mm | |
| Bio19 | Precipitation in the coldest quarter | mm | |
| Terrain | Elevation | Topographic elevation | m |
| WTI | Wetland index | -- | |
| Ocean salinity | C_sss | Mean sea surface salinity in the coldest season | ‰ |
| W_sss | Mean sea surface salinity in the warmest season | ‰ | |
| Sea surface temperature | C_sst | Mean sea surface temperature in the coldest season | °C |
| W_sst | Mean SST in the warmest season | °C | |
| Substrate type | Substrate | Substrate type | -- |
| Land-use data | Land-use | Land use type | -- |
| Order | Mangrove Species | Dominant Environmental Factors | Limitation |
|---|---|---|---|
| 1 | A. marina | Elevation | −0.84–1.27 m |
| Mean sea surface salinity in the coldest season | 16.41–25.31‰ | ||
| Maximum temperature of the warmest month | 32.1–32.3 °C | ||
| 2 | A. corniculatum | Elevation | −0.68–2.02 m |
| Wetland index | 4.11–9.81 | ||
| Substrate type | Mixed mud flat | ||
| 3 | K. obovata | Elevation | −0.50–1.88 m |
| Substrate type | Mixed mud flat | ||
| Wetland index | 4.49–8.33 | ||
| 4 | B. gymnorrhiza | Maximum temperature of the warmest month | 32.3–32.4 °C |
| Precipitation in the warmest quarter | 638–753 mm | ||
| Substrate type | Mixed mudflat | ||
| 5 | R. stylosa | Precipitation in the warmest quarter | 637–746 mm |
| Substrate type | Mixed mudflat | ||
| Mean temperature of the warmest quarter | 28.7–28.9 °C | ||
| 6 | A. ilicifolius | Substrate type | Mixed mudflat |
| Mean sea surface salinity in the warmest season | 3.39–7.37‰ | ||
| Wetland index | >5.28 |
| Mangrove Species | Best Suitable Area (hm2) | Medium Suitable Area (hm2) |
|---|---|---|
| A. marina | 10,341 | 39,875 |
| A. corniculatum | 13,154 | 37,063 |
| K. obovata | 10,672 | 20,682 |
| B. gymnorrhiza | 2565 | 4385 |
| R. stylosa | 1158 | 3226 |
| A. ilicifolius | 4054 | 6949 |
Disclaimer/Publisher’s Note: The statements, opinions and data contained in all publications are solely those of the individual author(s) and contributor(s) and not of MDPI and/or the editor(s). MDPI and/or the editor(s) disclaim responsibility for any injury to people or property resulting from any ideas, methods, instructions or products referred to in the content. |
© 2023 by the authors. Licensee MDPI, Basel, Switzerland. This article is an open access article distributed under the terms and conditions of the Creative Commons Attribution (CC BY) license (https://creativecommons.org/licenses/by/4.0/).
Share and Cite
Li, L.; Liu, W.; Ai, J.; Cai, S.; Dong, J. Predicting Mangrove Distributions in the Beibu Gulf, Guangxi, China, Using the MaxEnt Model: Determining Tree Species Selection. Forests 2023, 14, 149. https://doi.org/10.3390/f14010149
Li L, Liu W, Ai J, Cai S, Dong J. Predicting Mangrove Distributions in the Beibu Gulf, Guangxi, China, Using the MaxEnt Model: Determining Tree Species Selection. Forests. 2023; 14(1):149. https://doi.org/10.3390/f14010149
Chicago/Turabian StyleLi, Lifeng, Wenai Liu, Jingwen Ai, Shuangjiao Cai, and Jianwen Dong. 2023. "Predicting Mangrove Distributions in the Beibu Gulf, Guangxi, China, Using the MaxEnt Model: Determining Tree Species Selection" Forests 14, no. 1: 149. https://doi.org/10.3390/f14010149