
Detection of Growth Change of Young Forest Based on UAV RGB Images at Single-Tree Level

 , ,
, ,
Abstract
:1. Introduction
2. Data
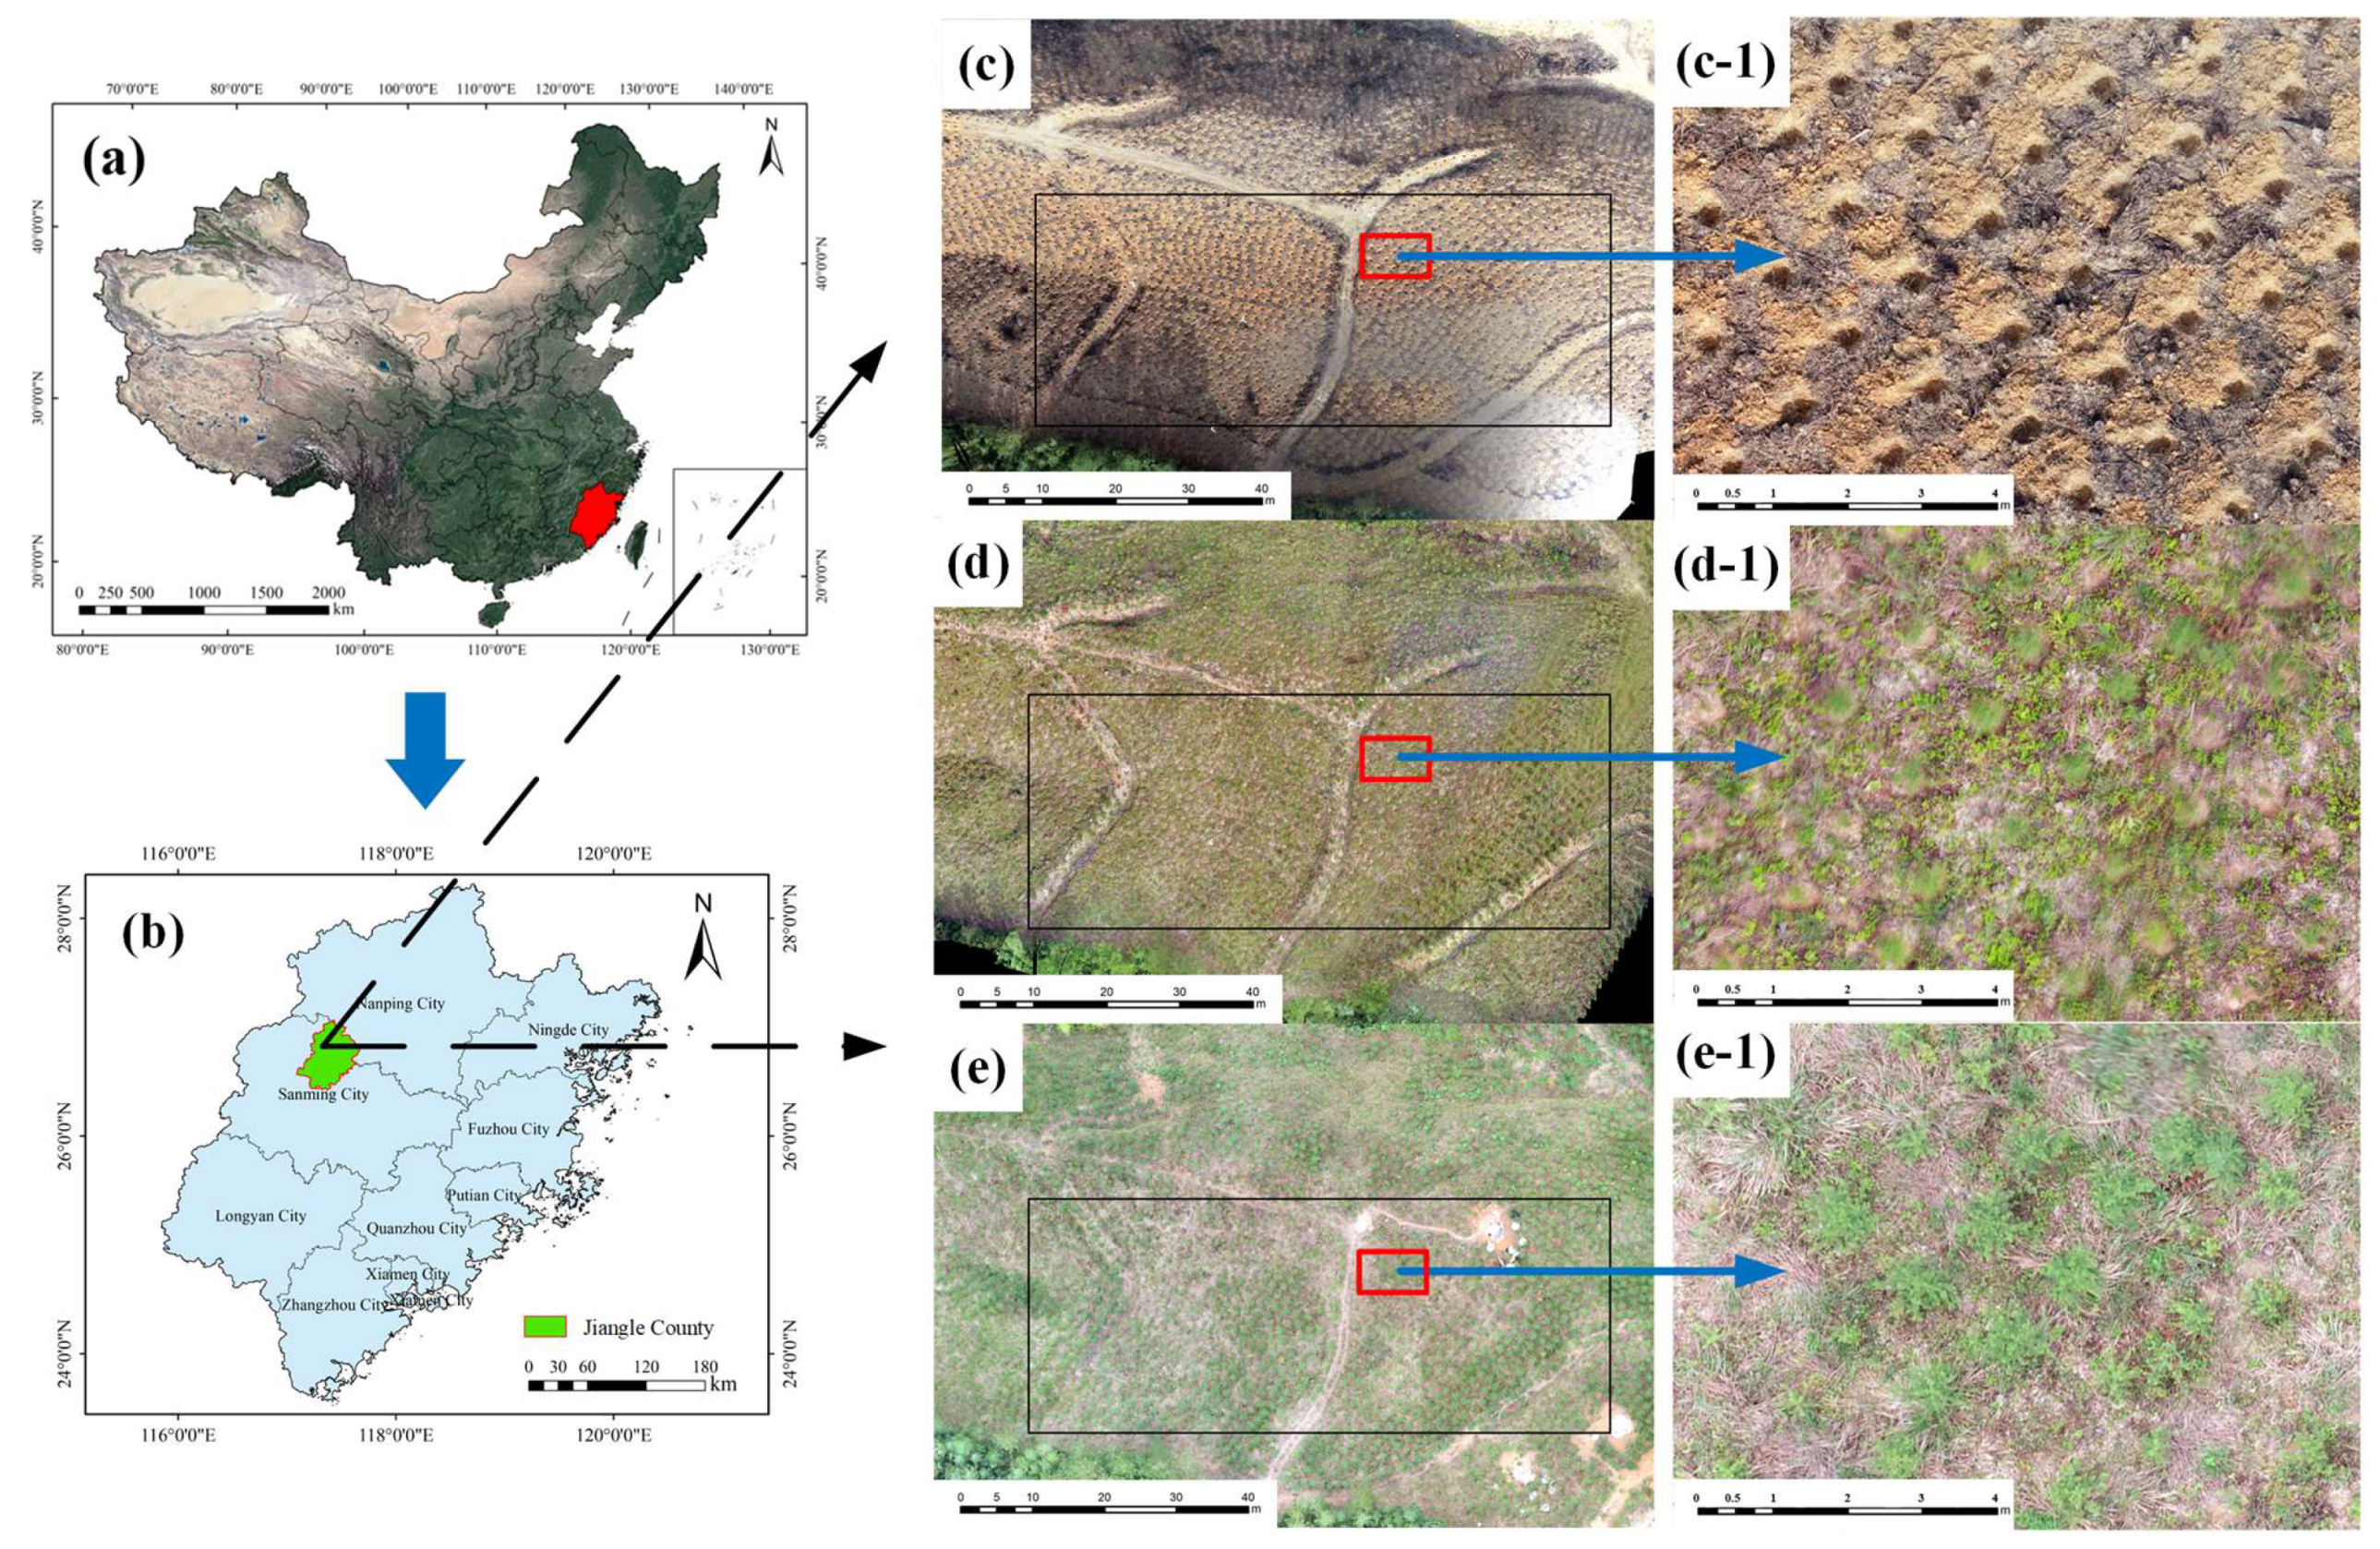
2.1. Study Region
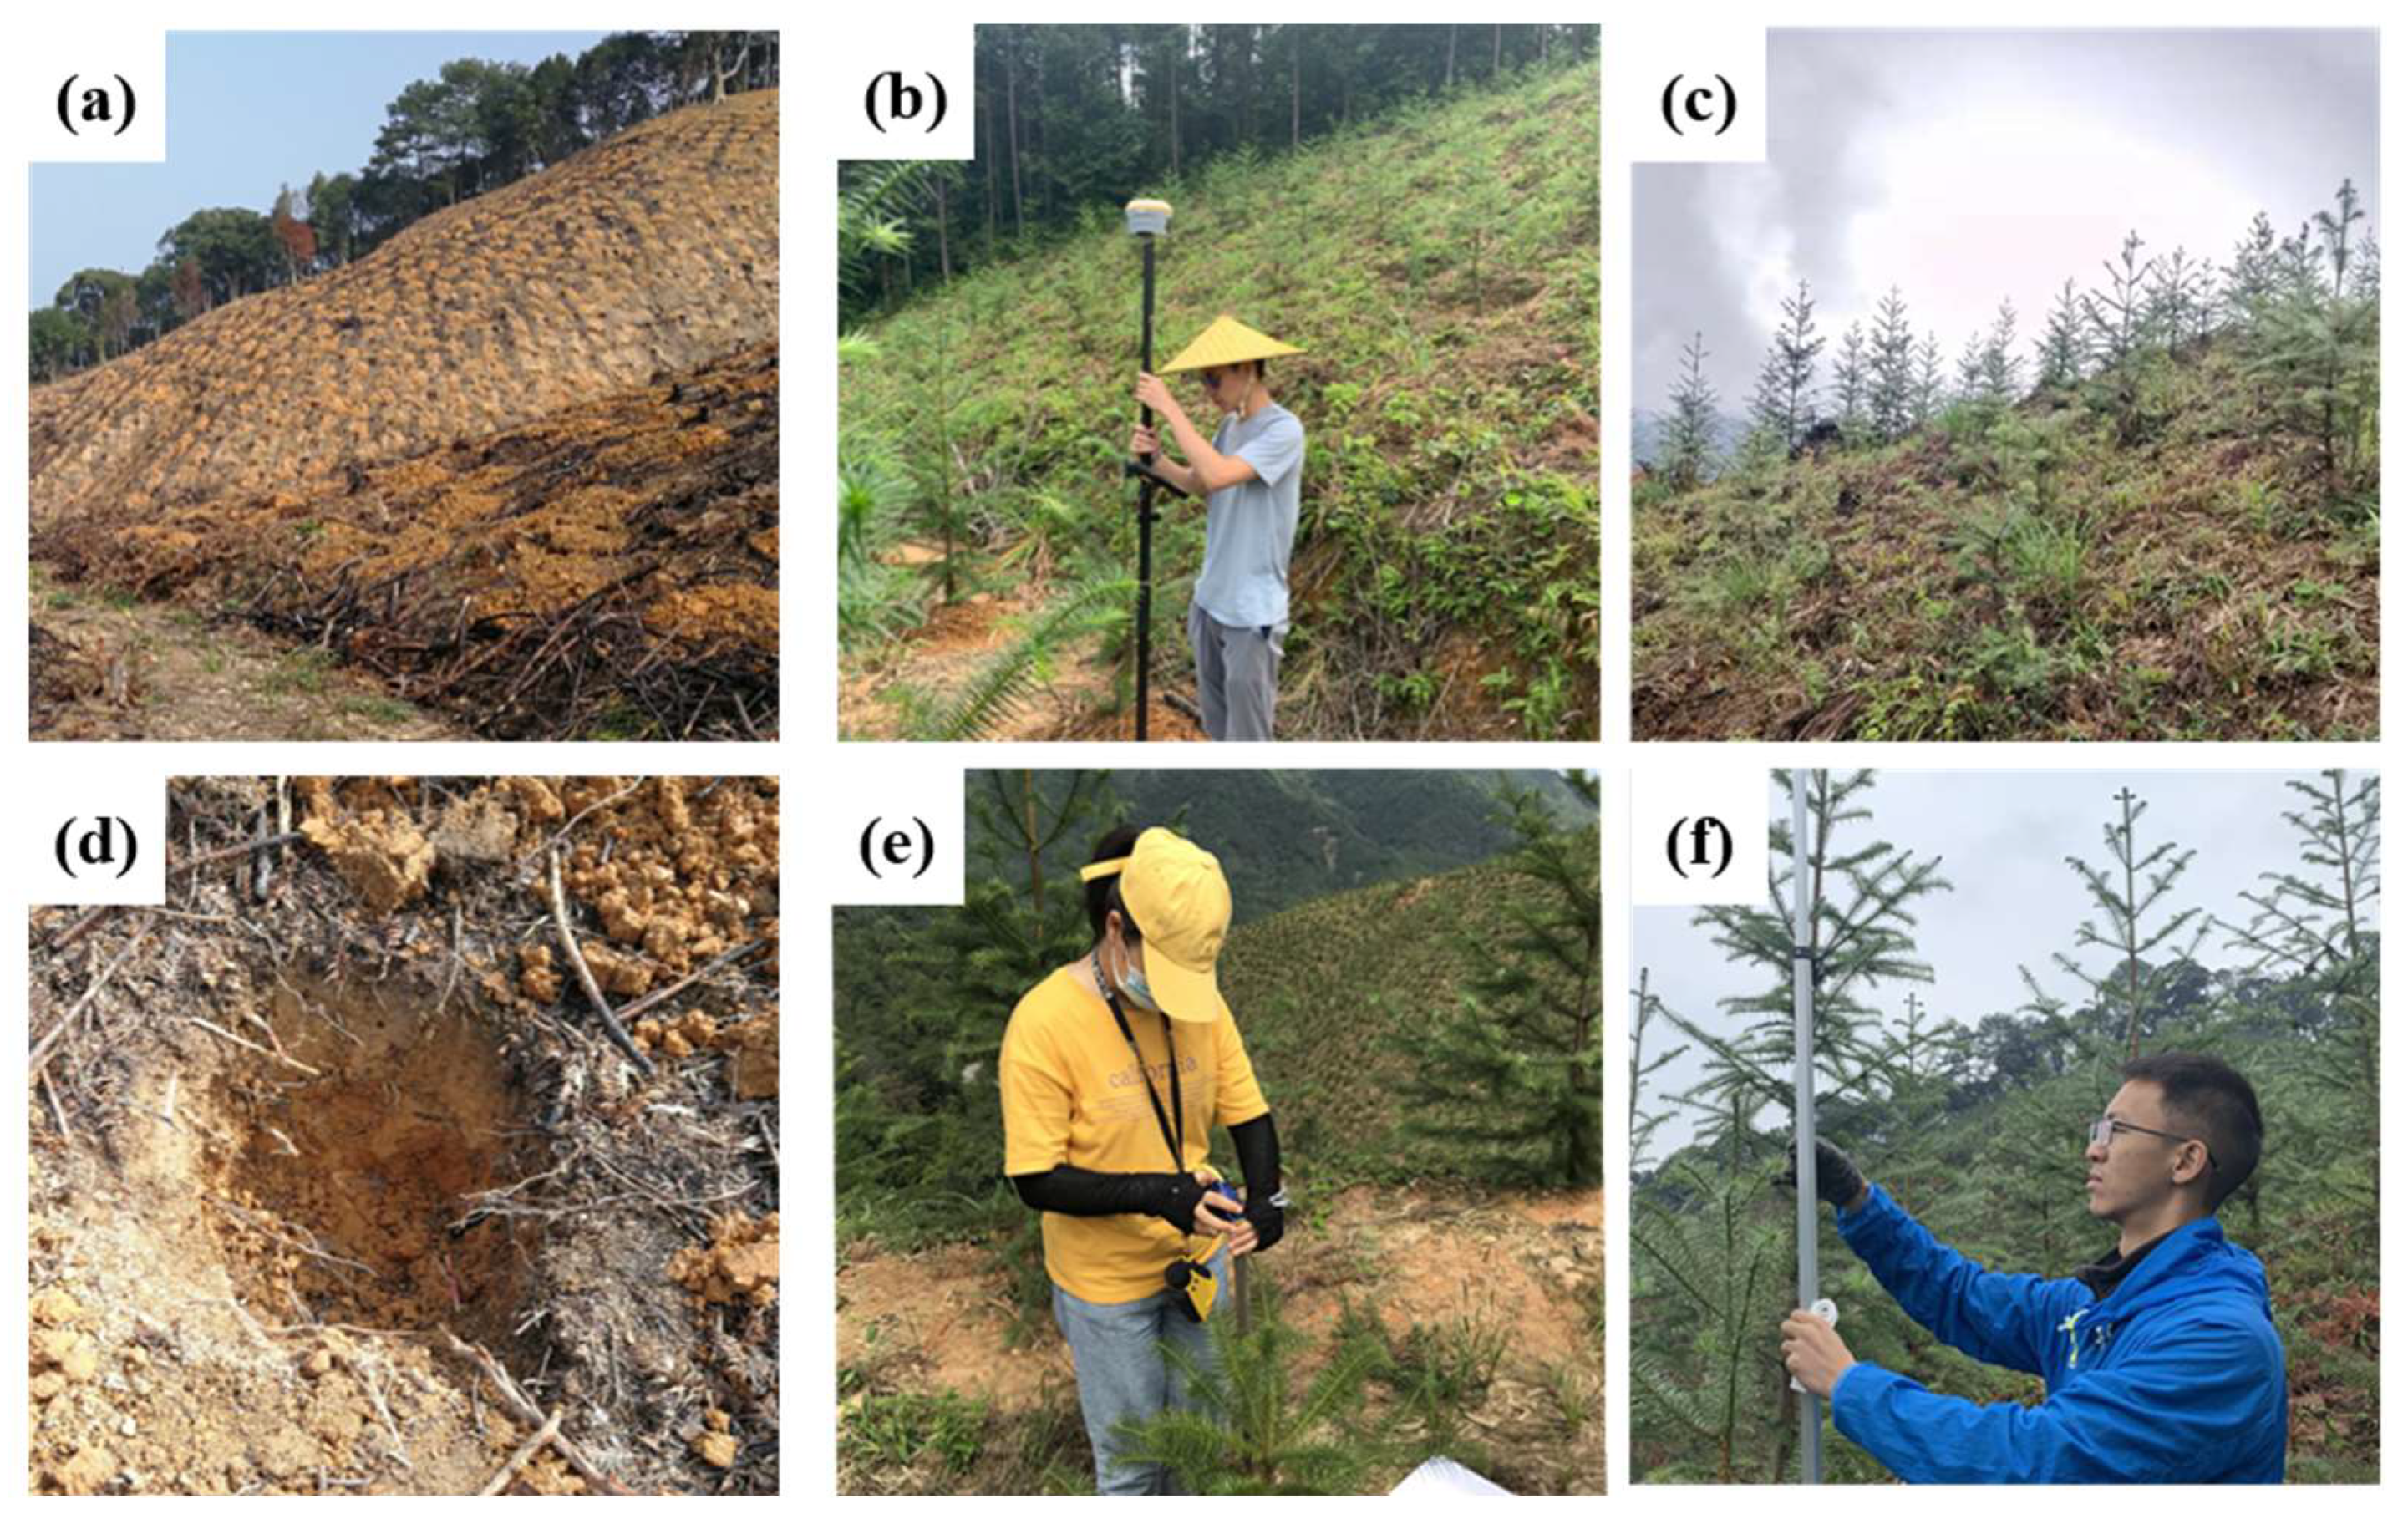
2.2. Field Survey
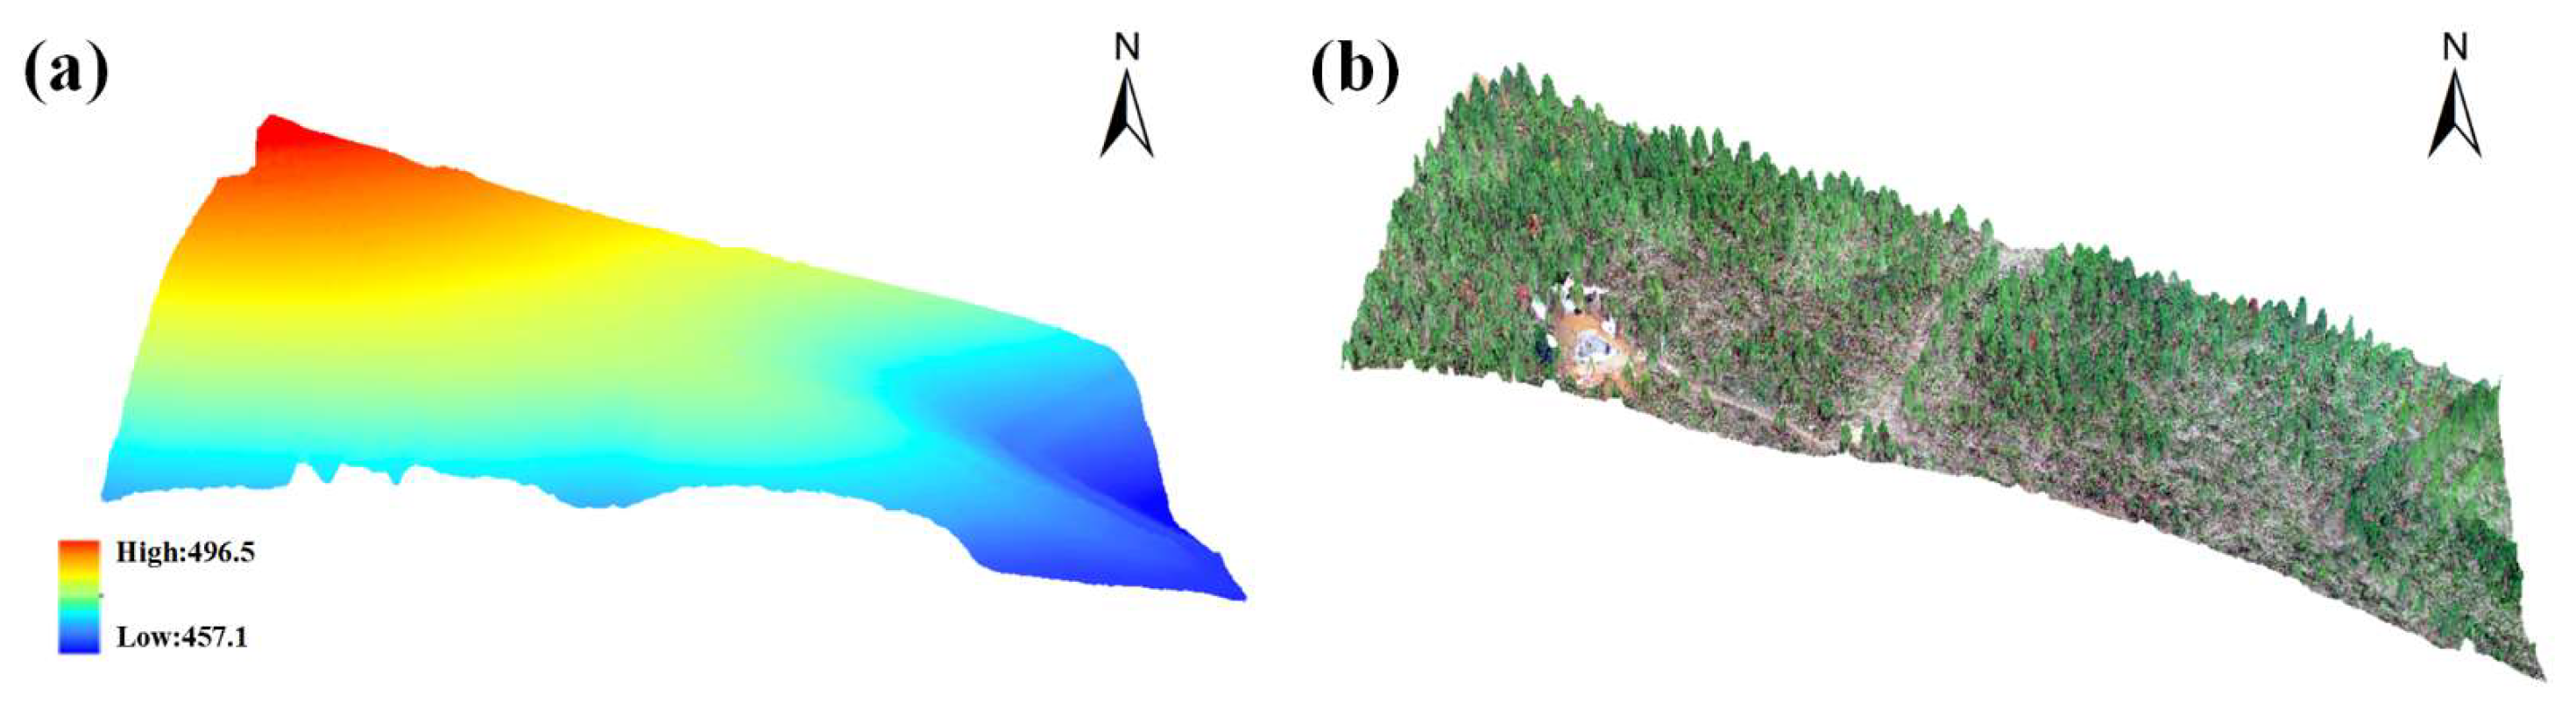
2.3. UAV Images
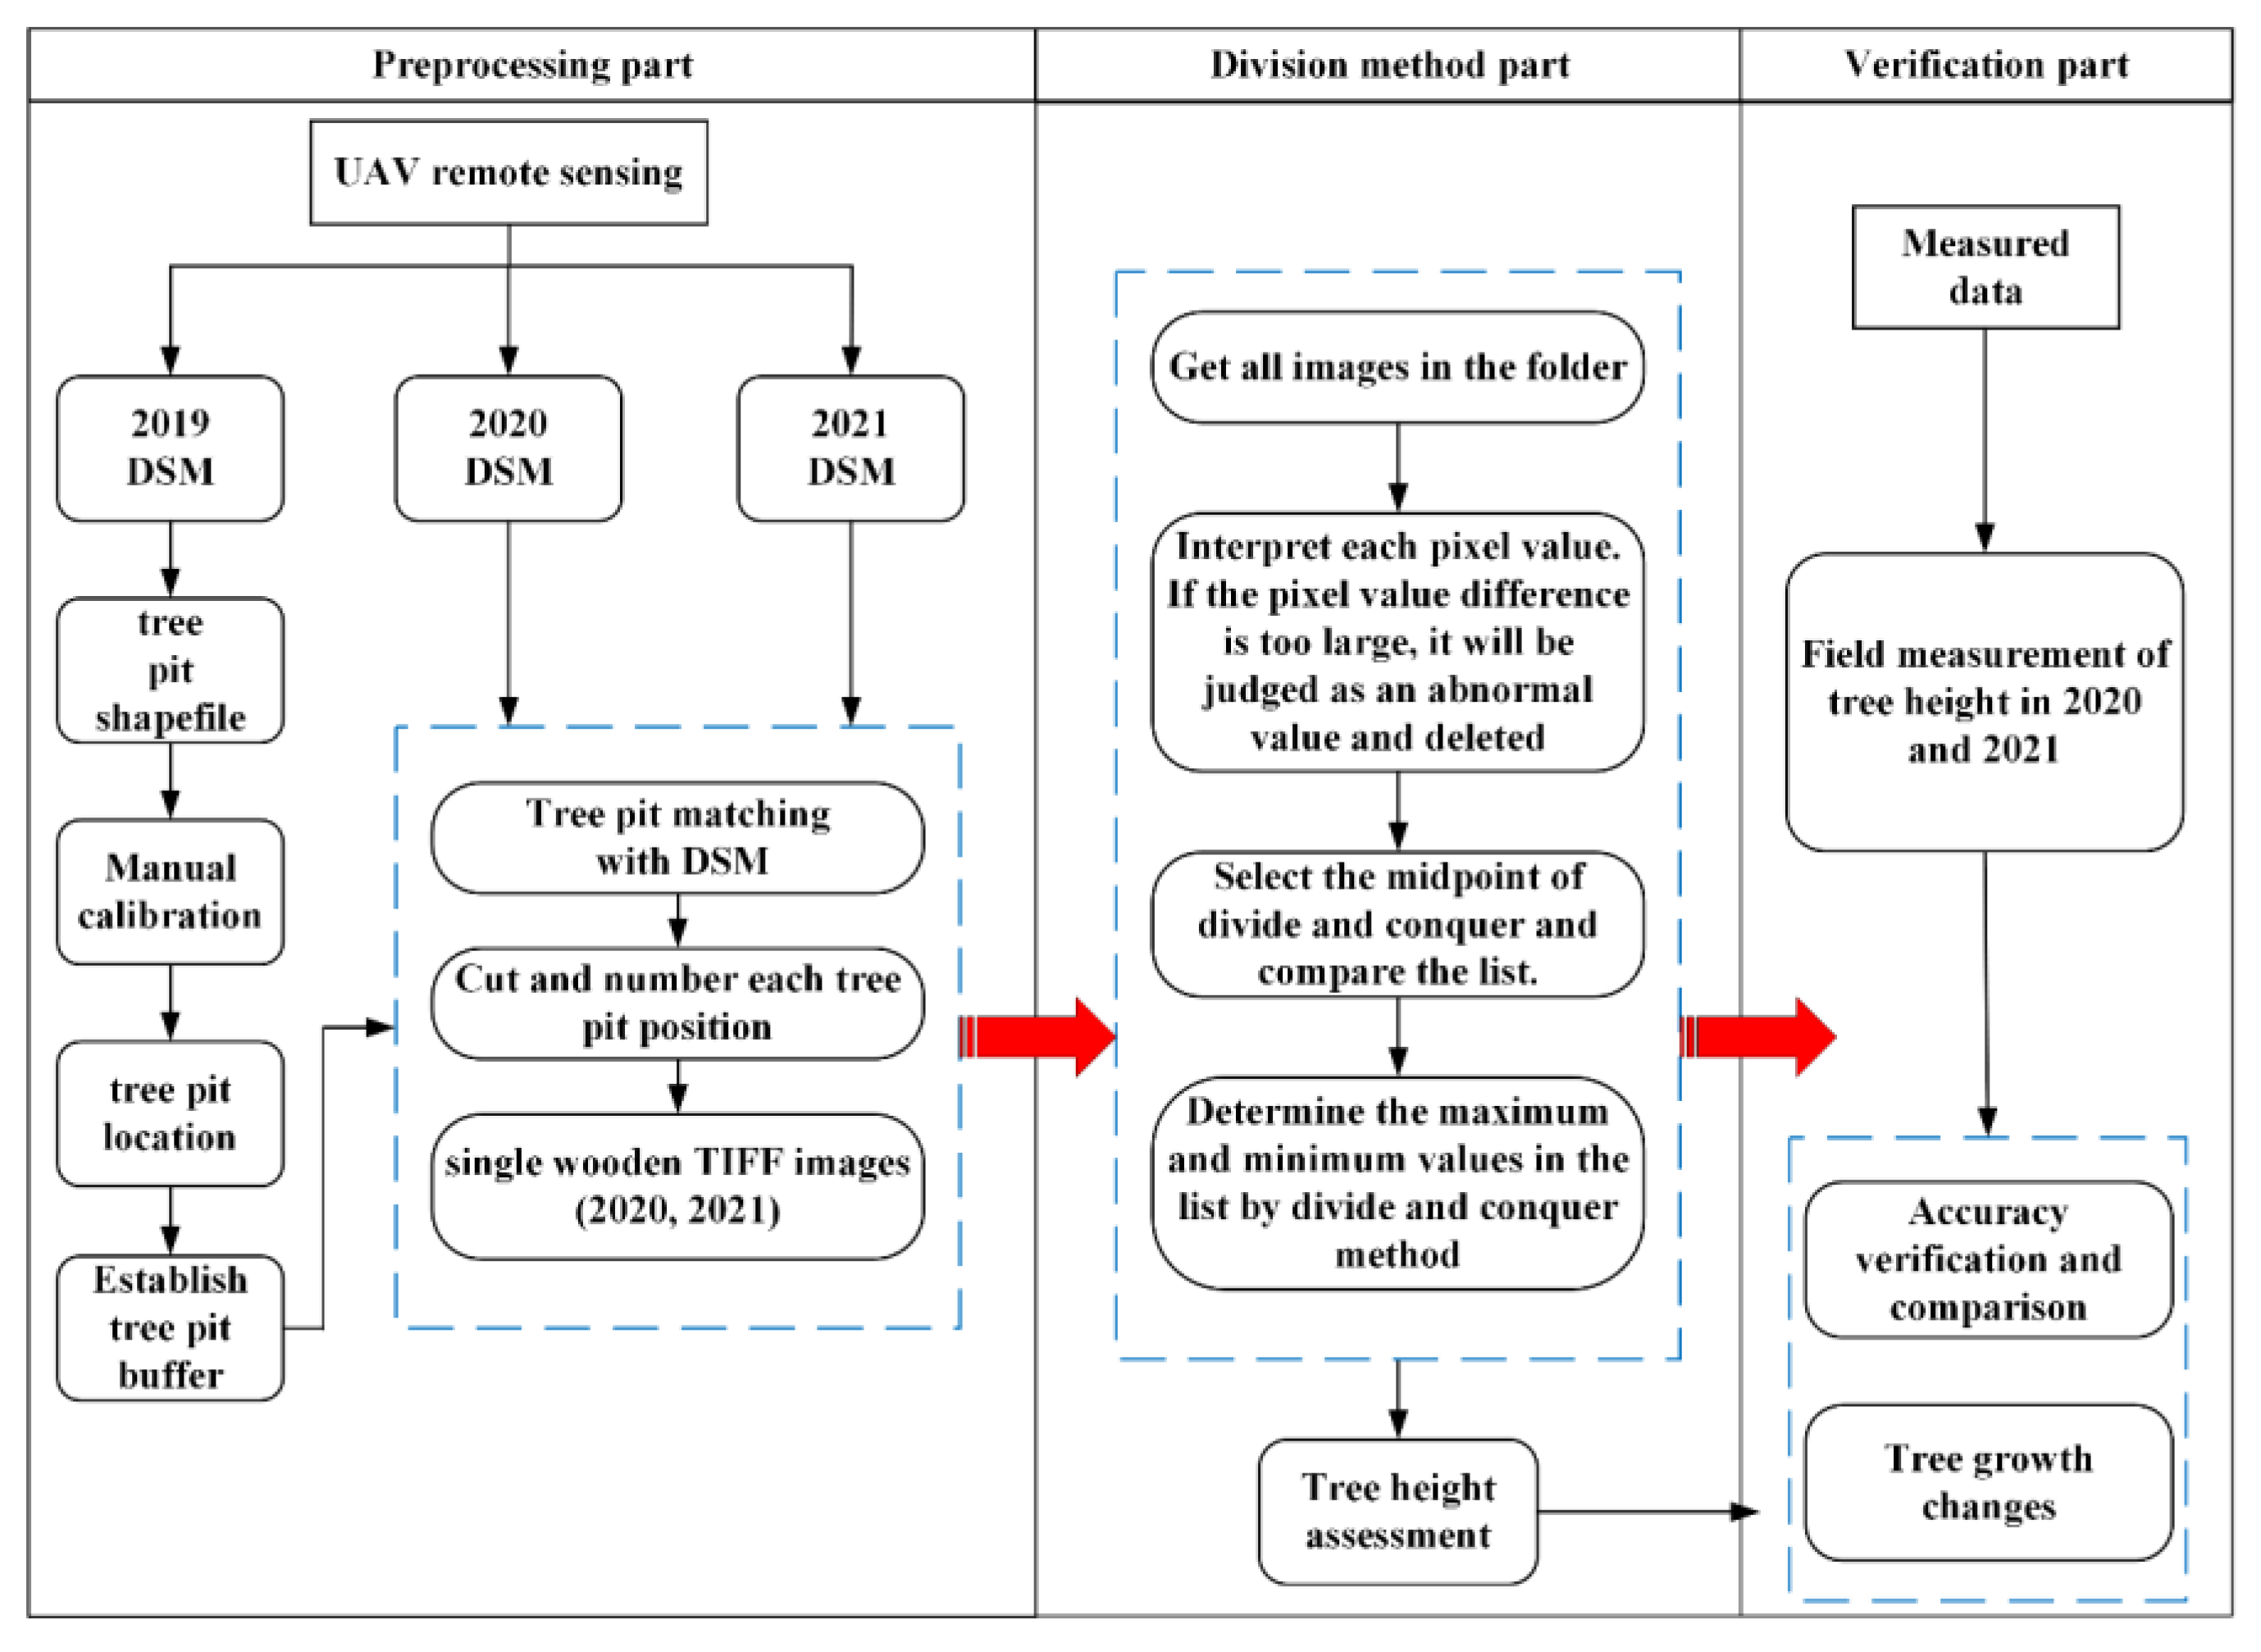
3. Methods
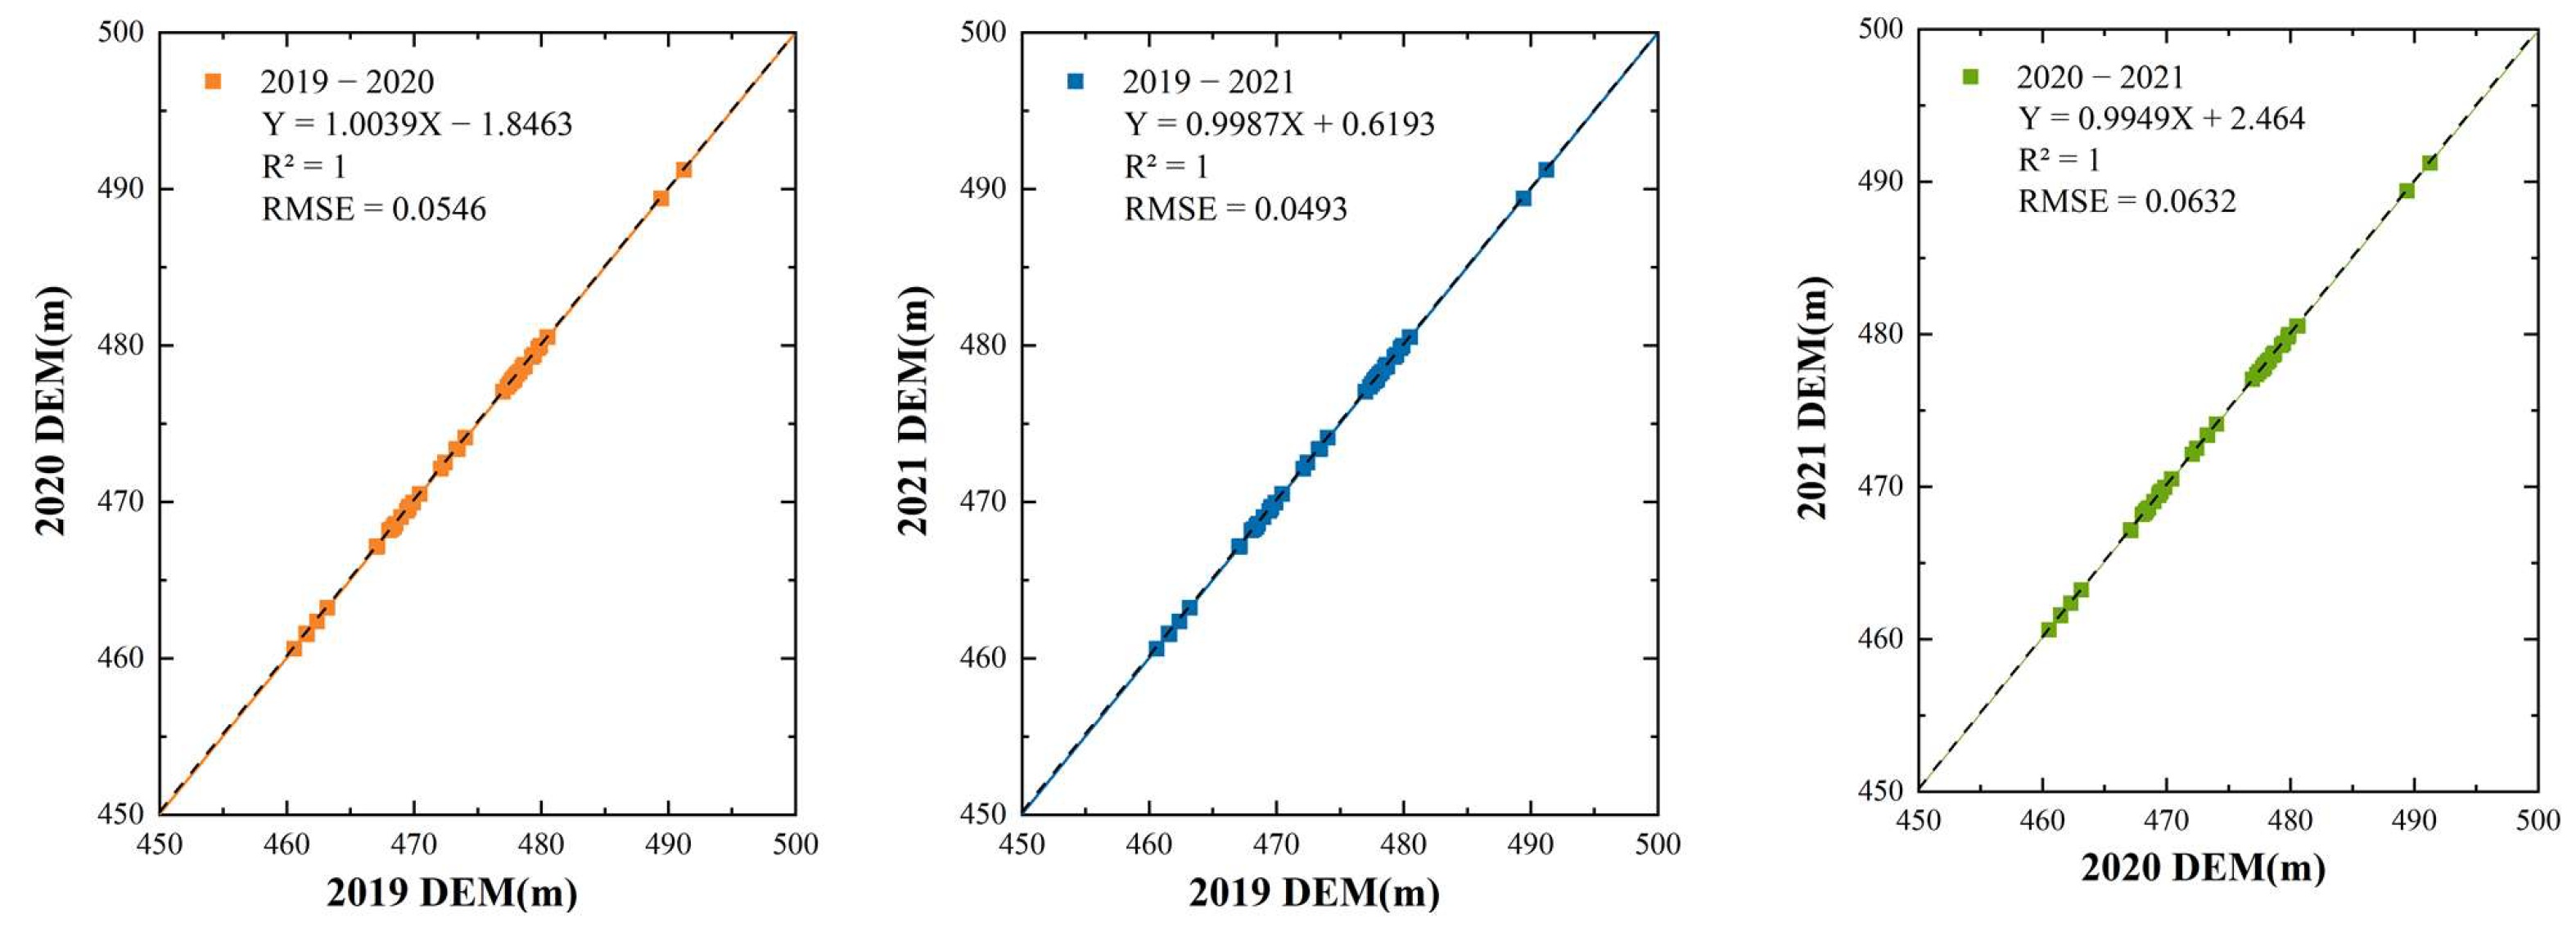
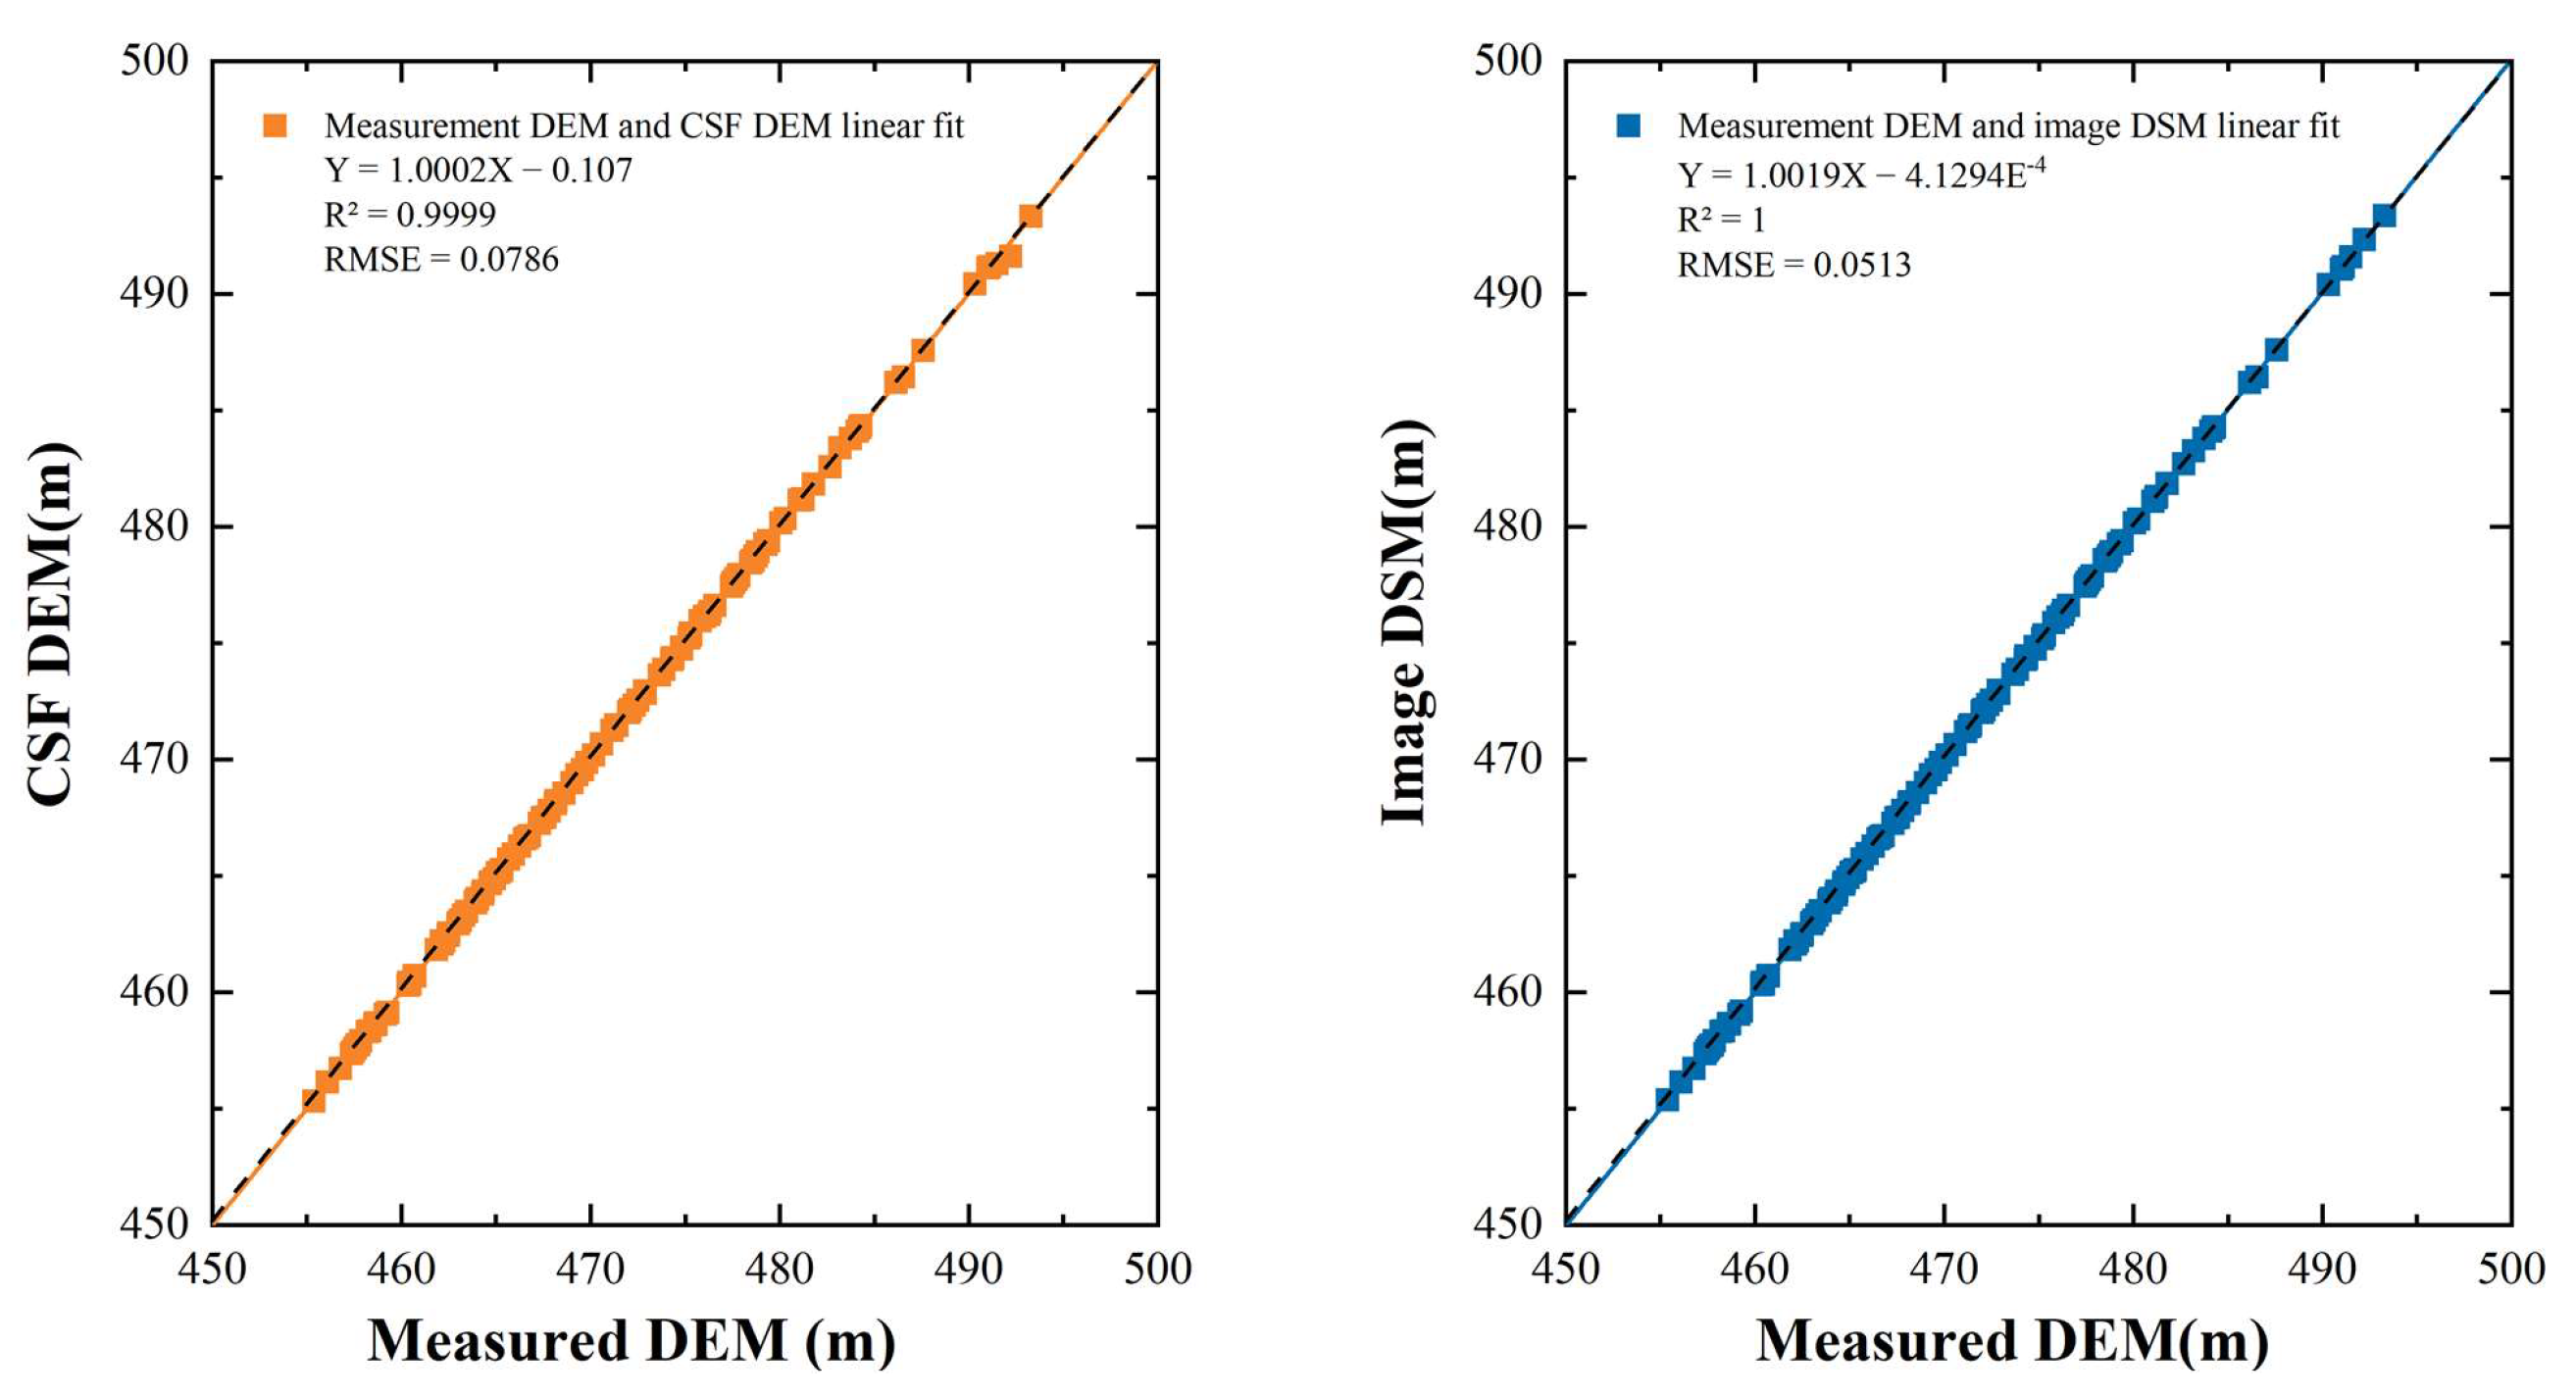
3.1. Image-Matching Accuracy and Ground Point Accuracy Verification
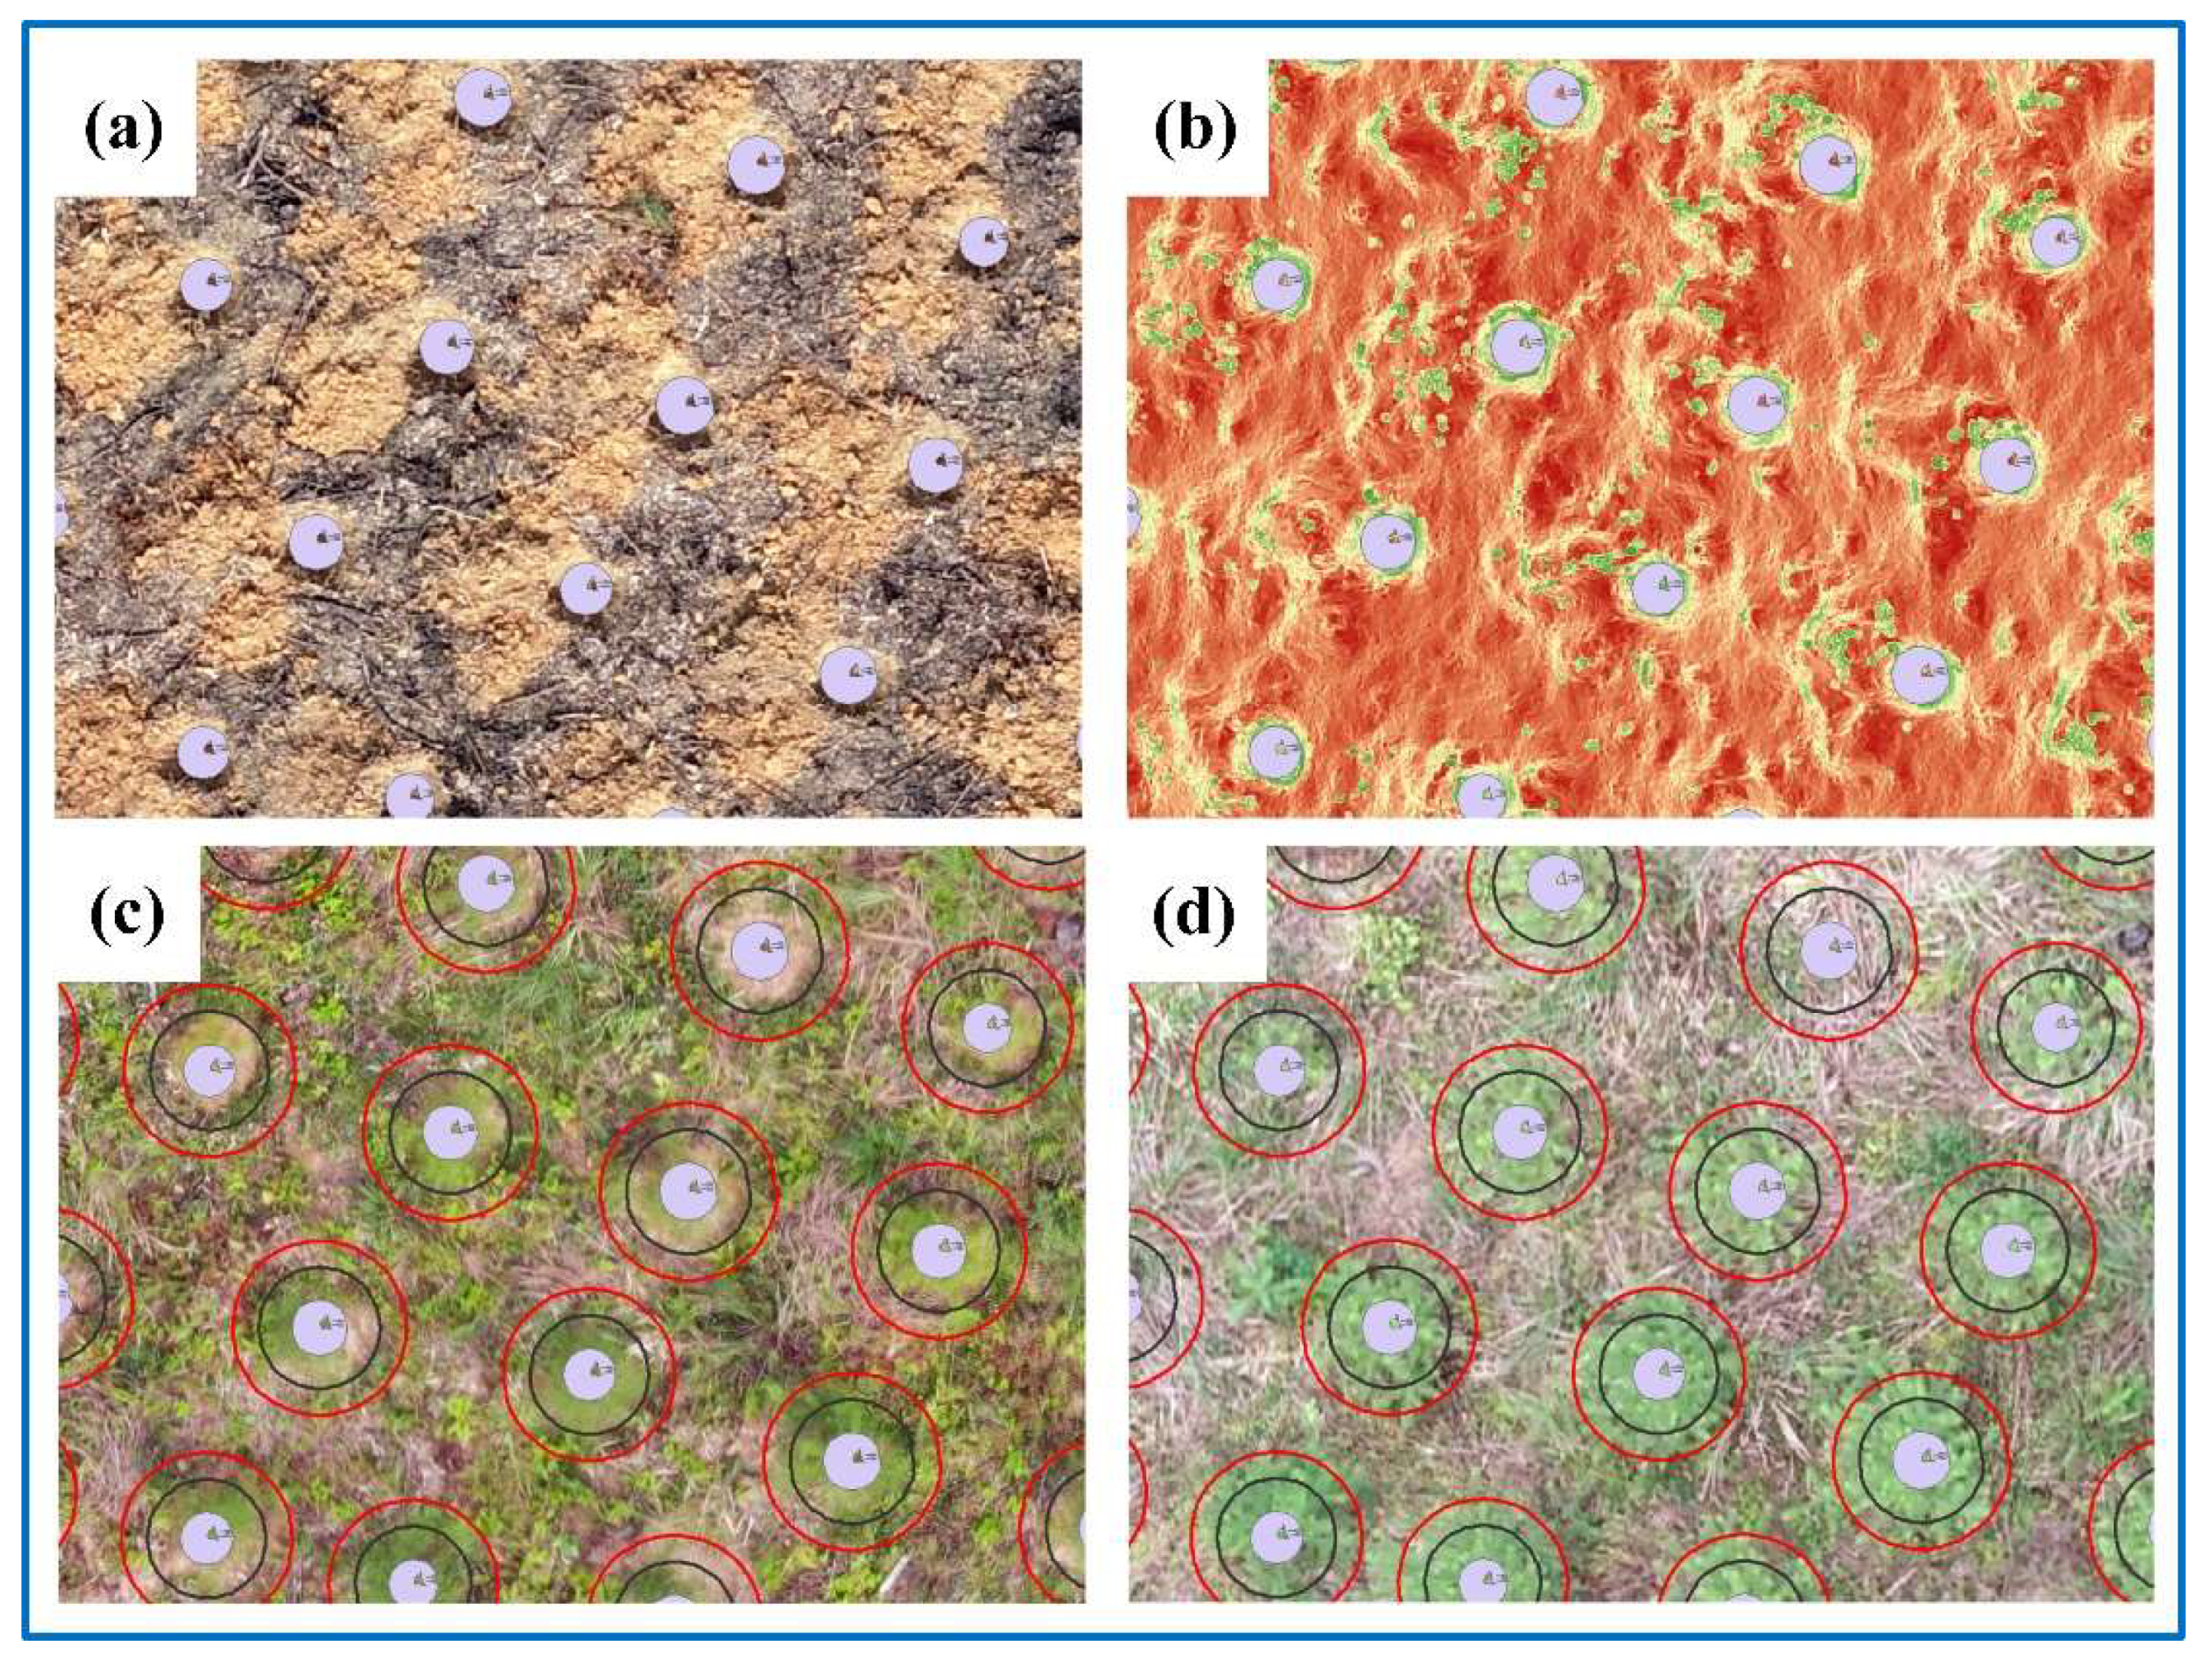
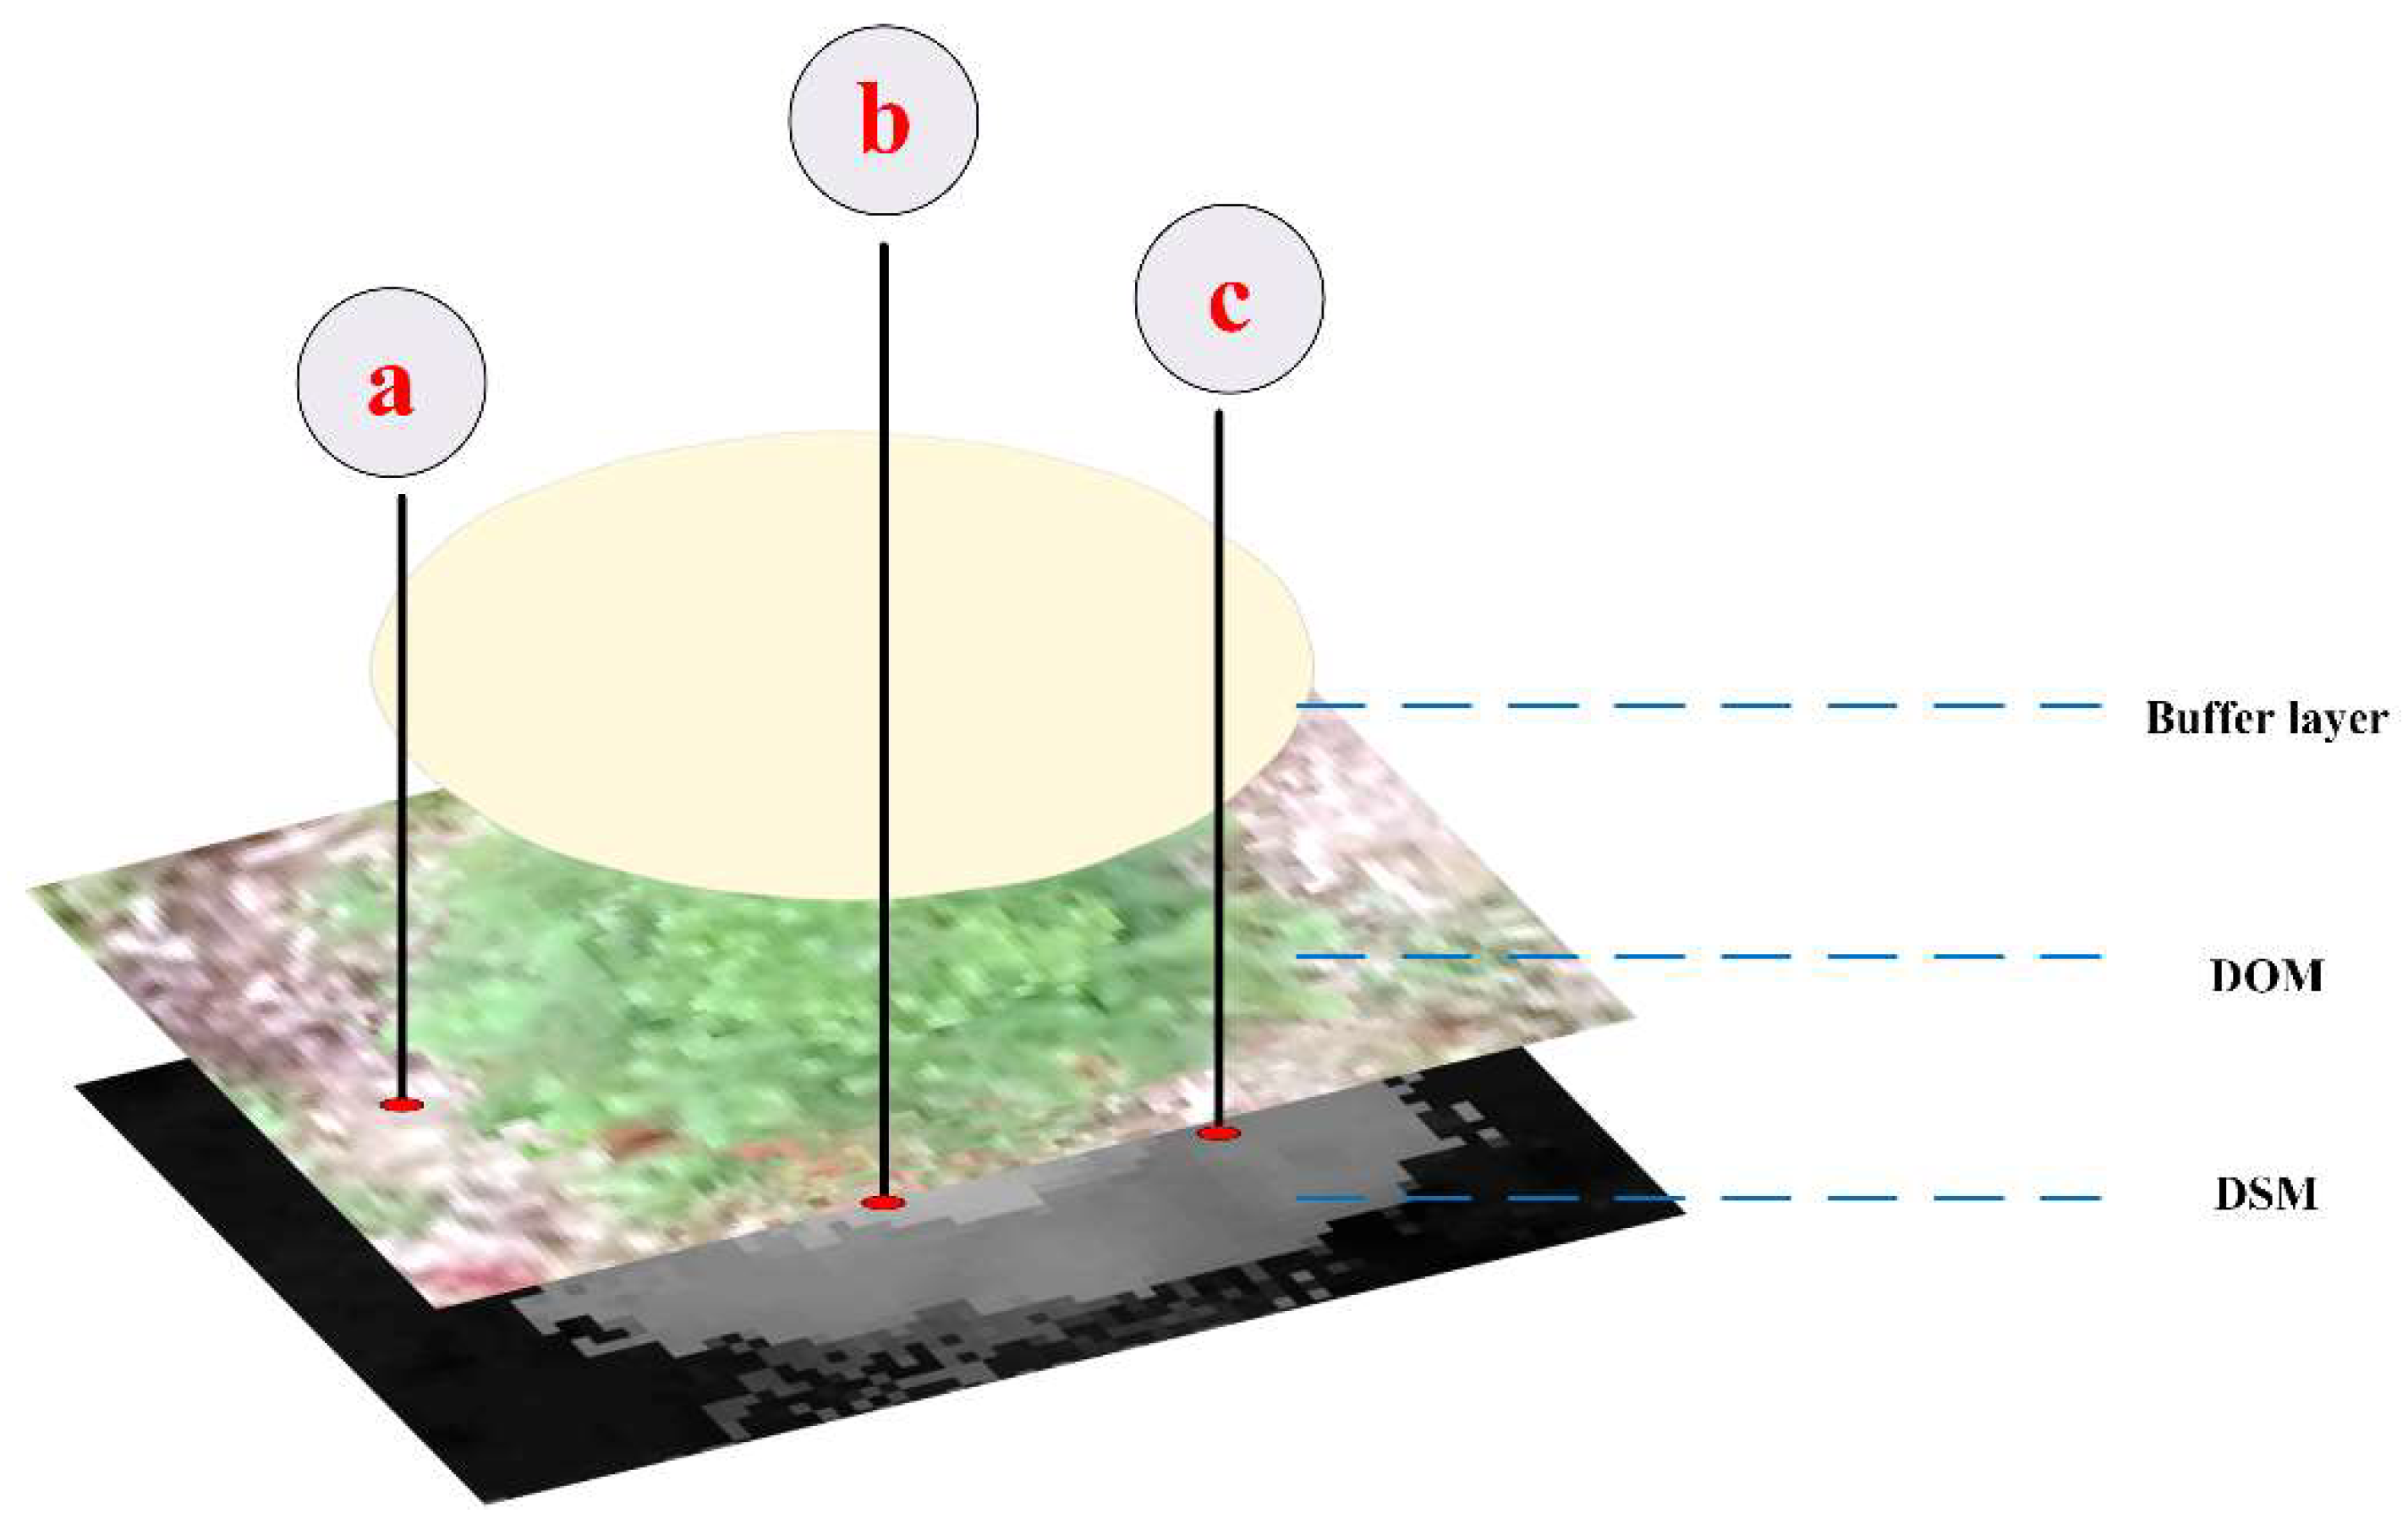
3.2. Tree Pits Extraction
3.3. Tree Height Extraction Based on Divide and Conquer Algorithm
3.4. Tree Height Extraction Based on Local Maximum Algorithm
3.5. Tree Height Extraction Based on Divide and Conquer Algorithm
4. Results
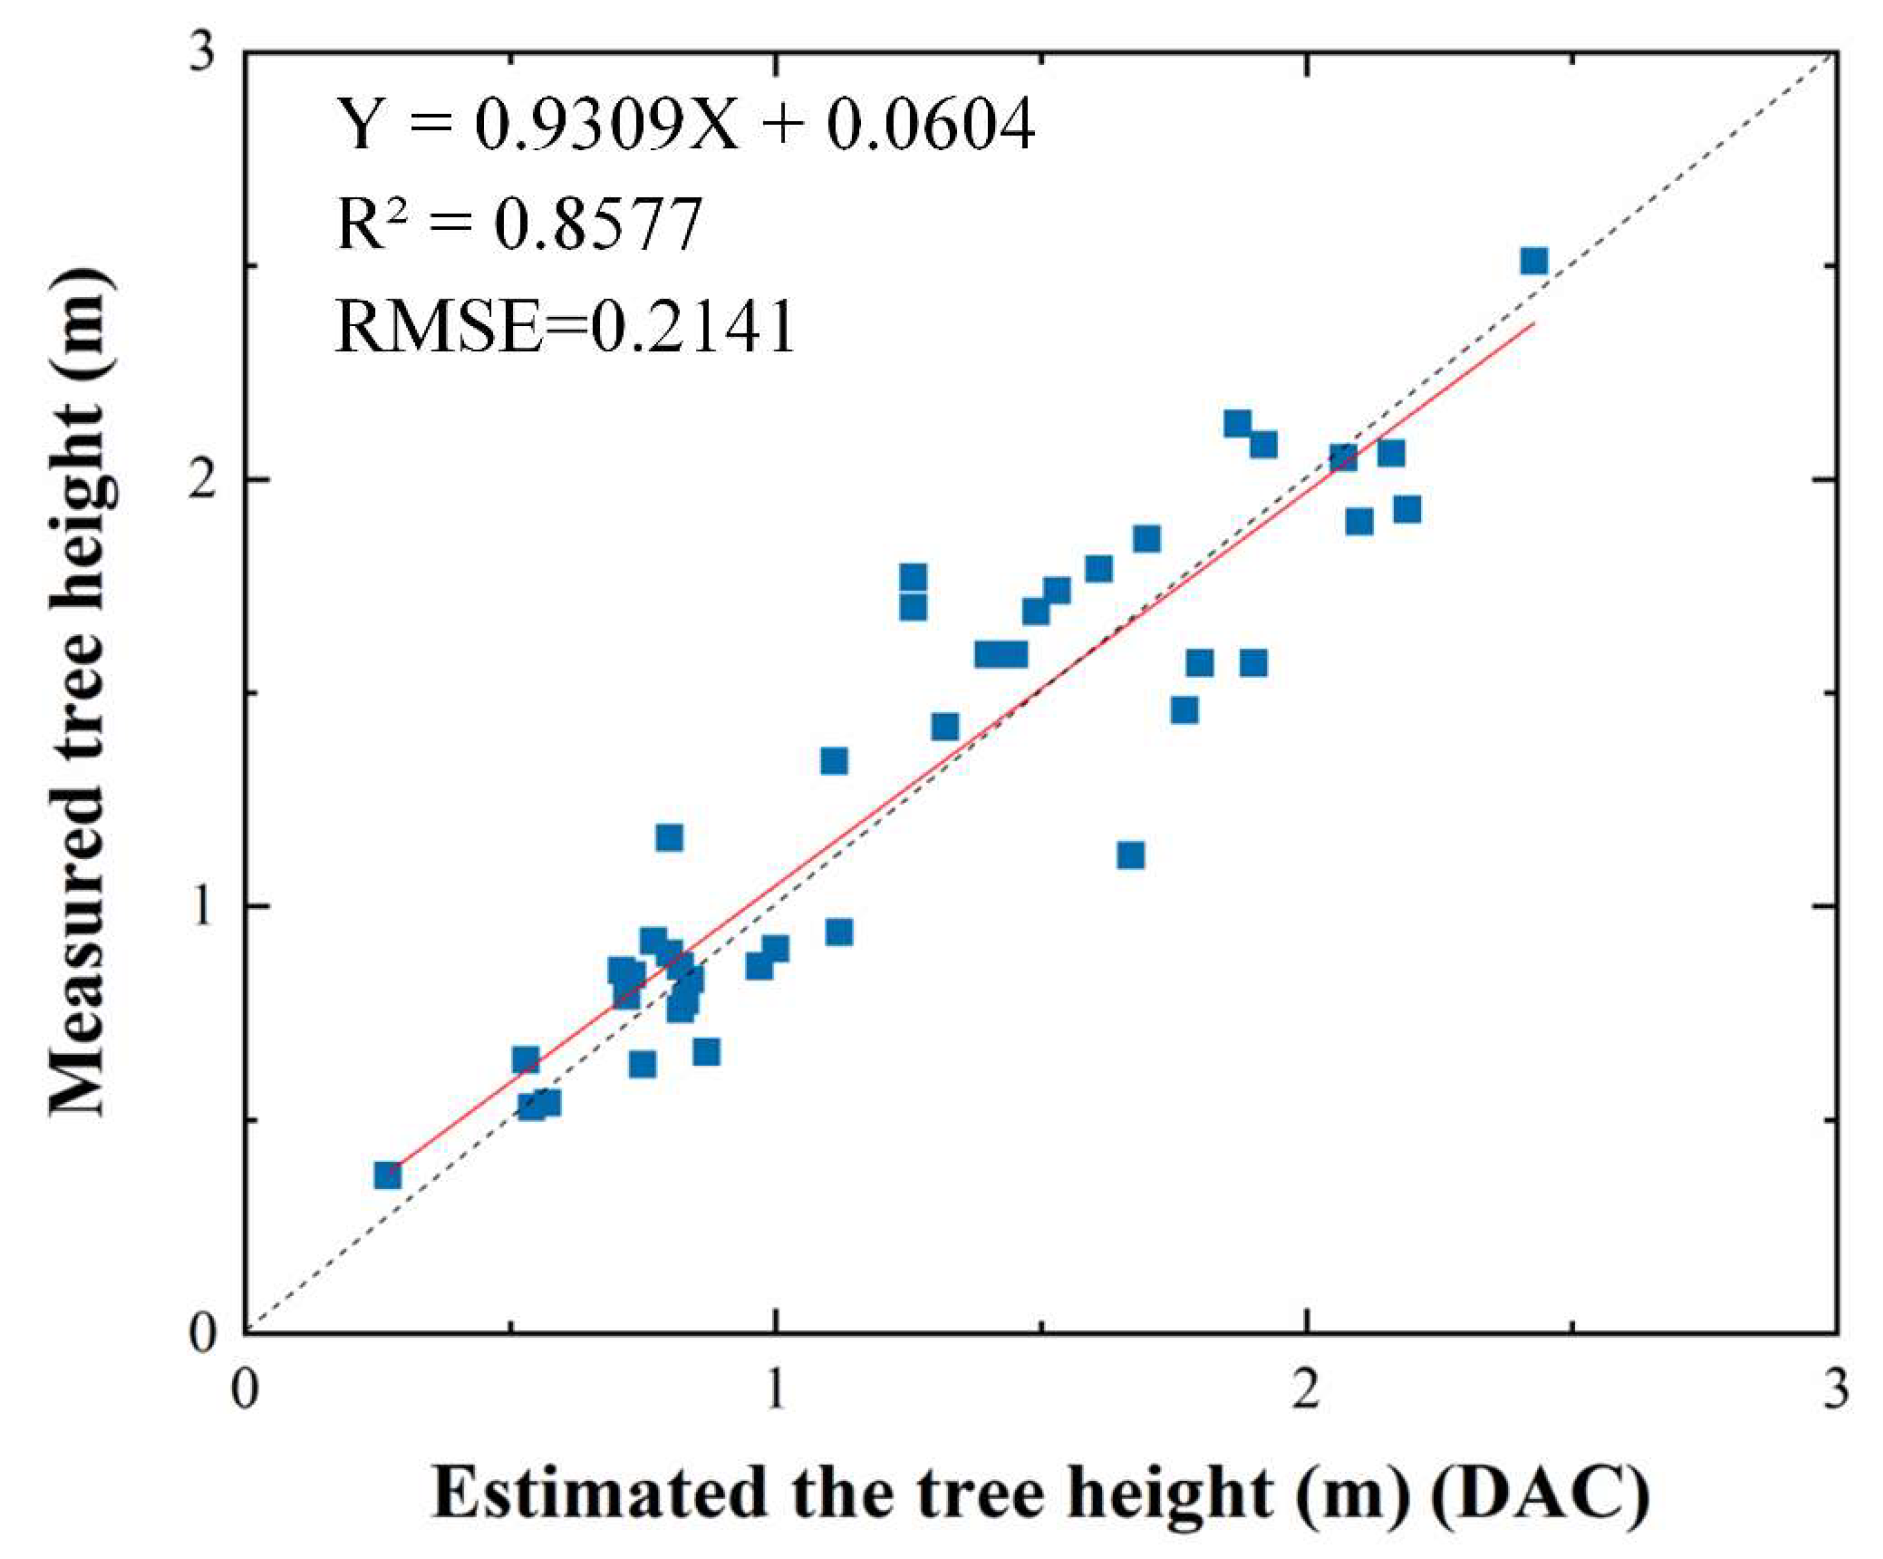
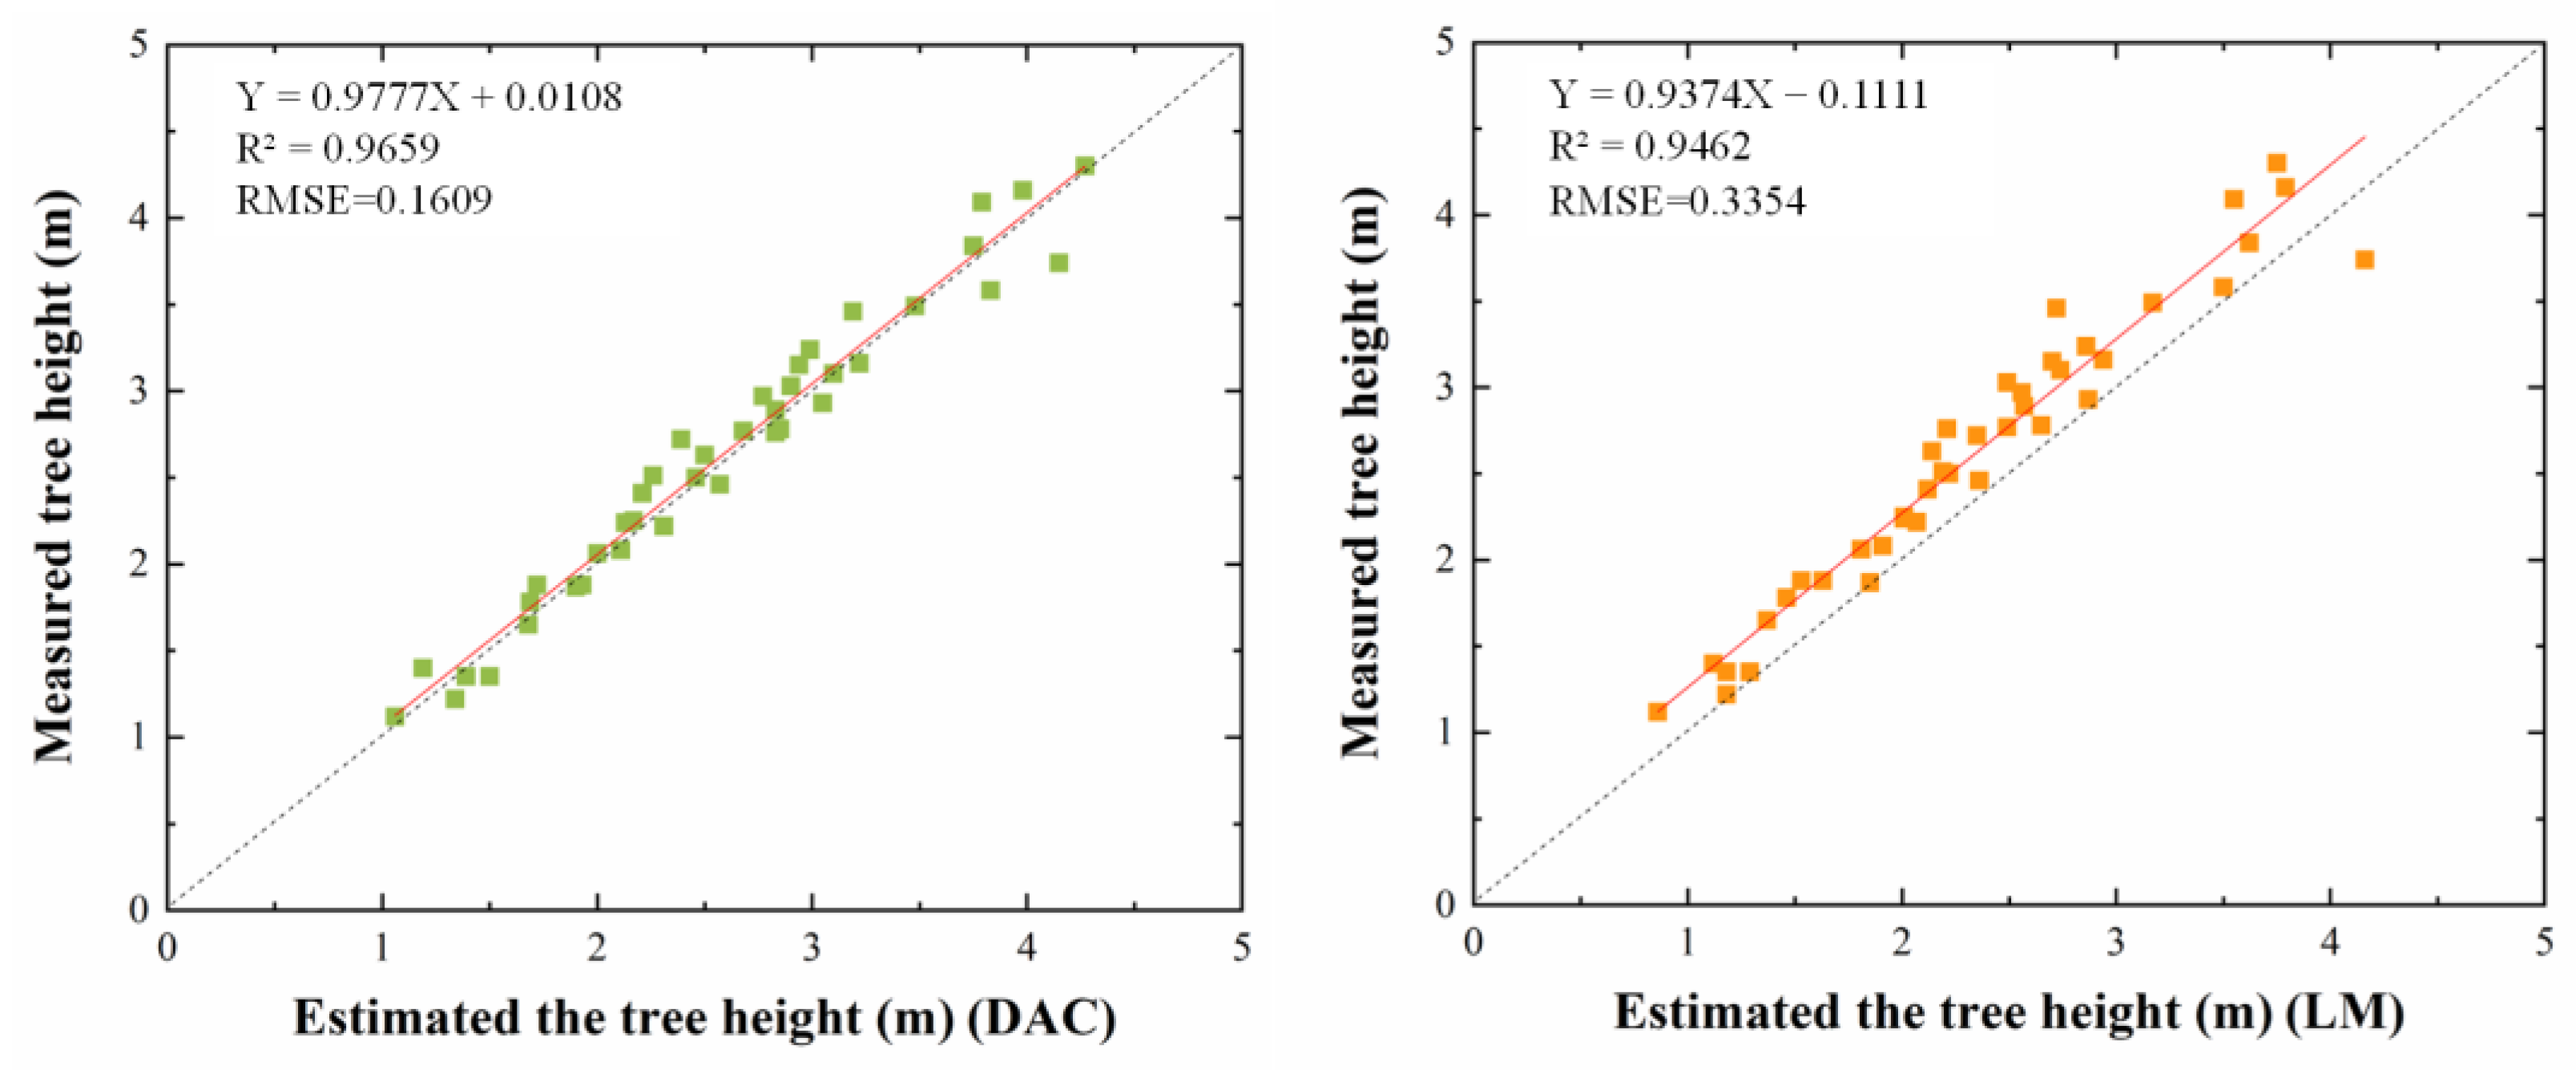
4.1. Extraction Results of Tree Heights and Accuracy Evaluation
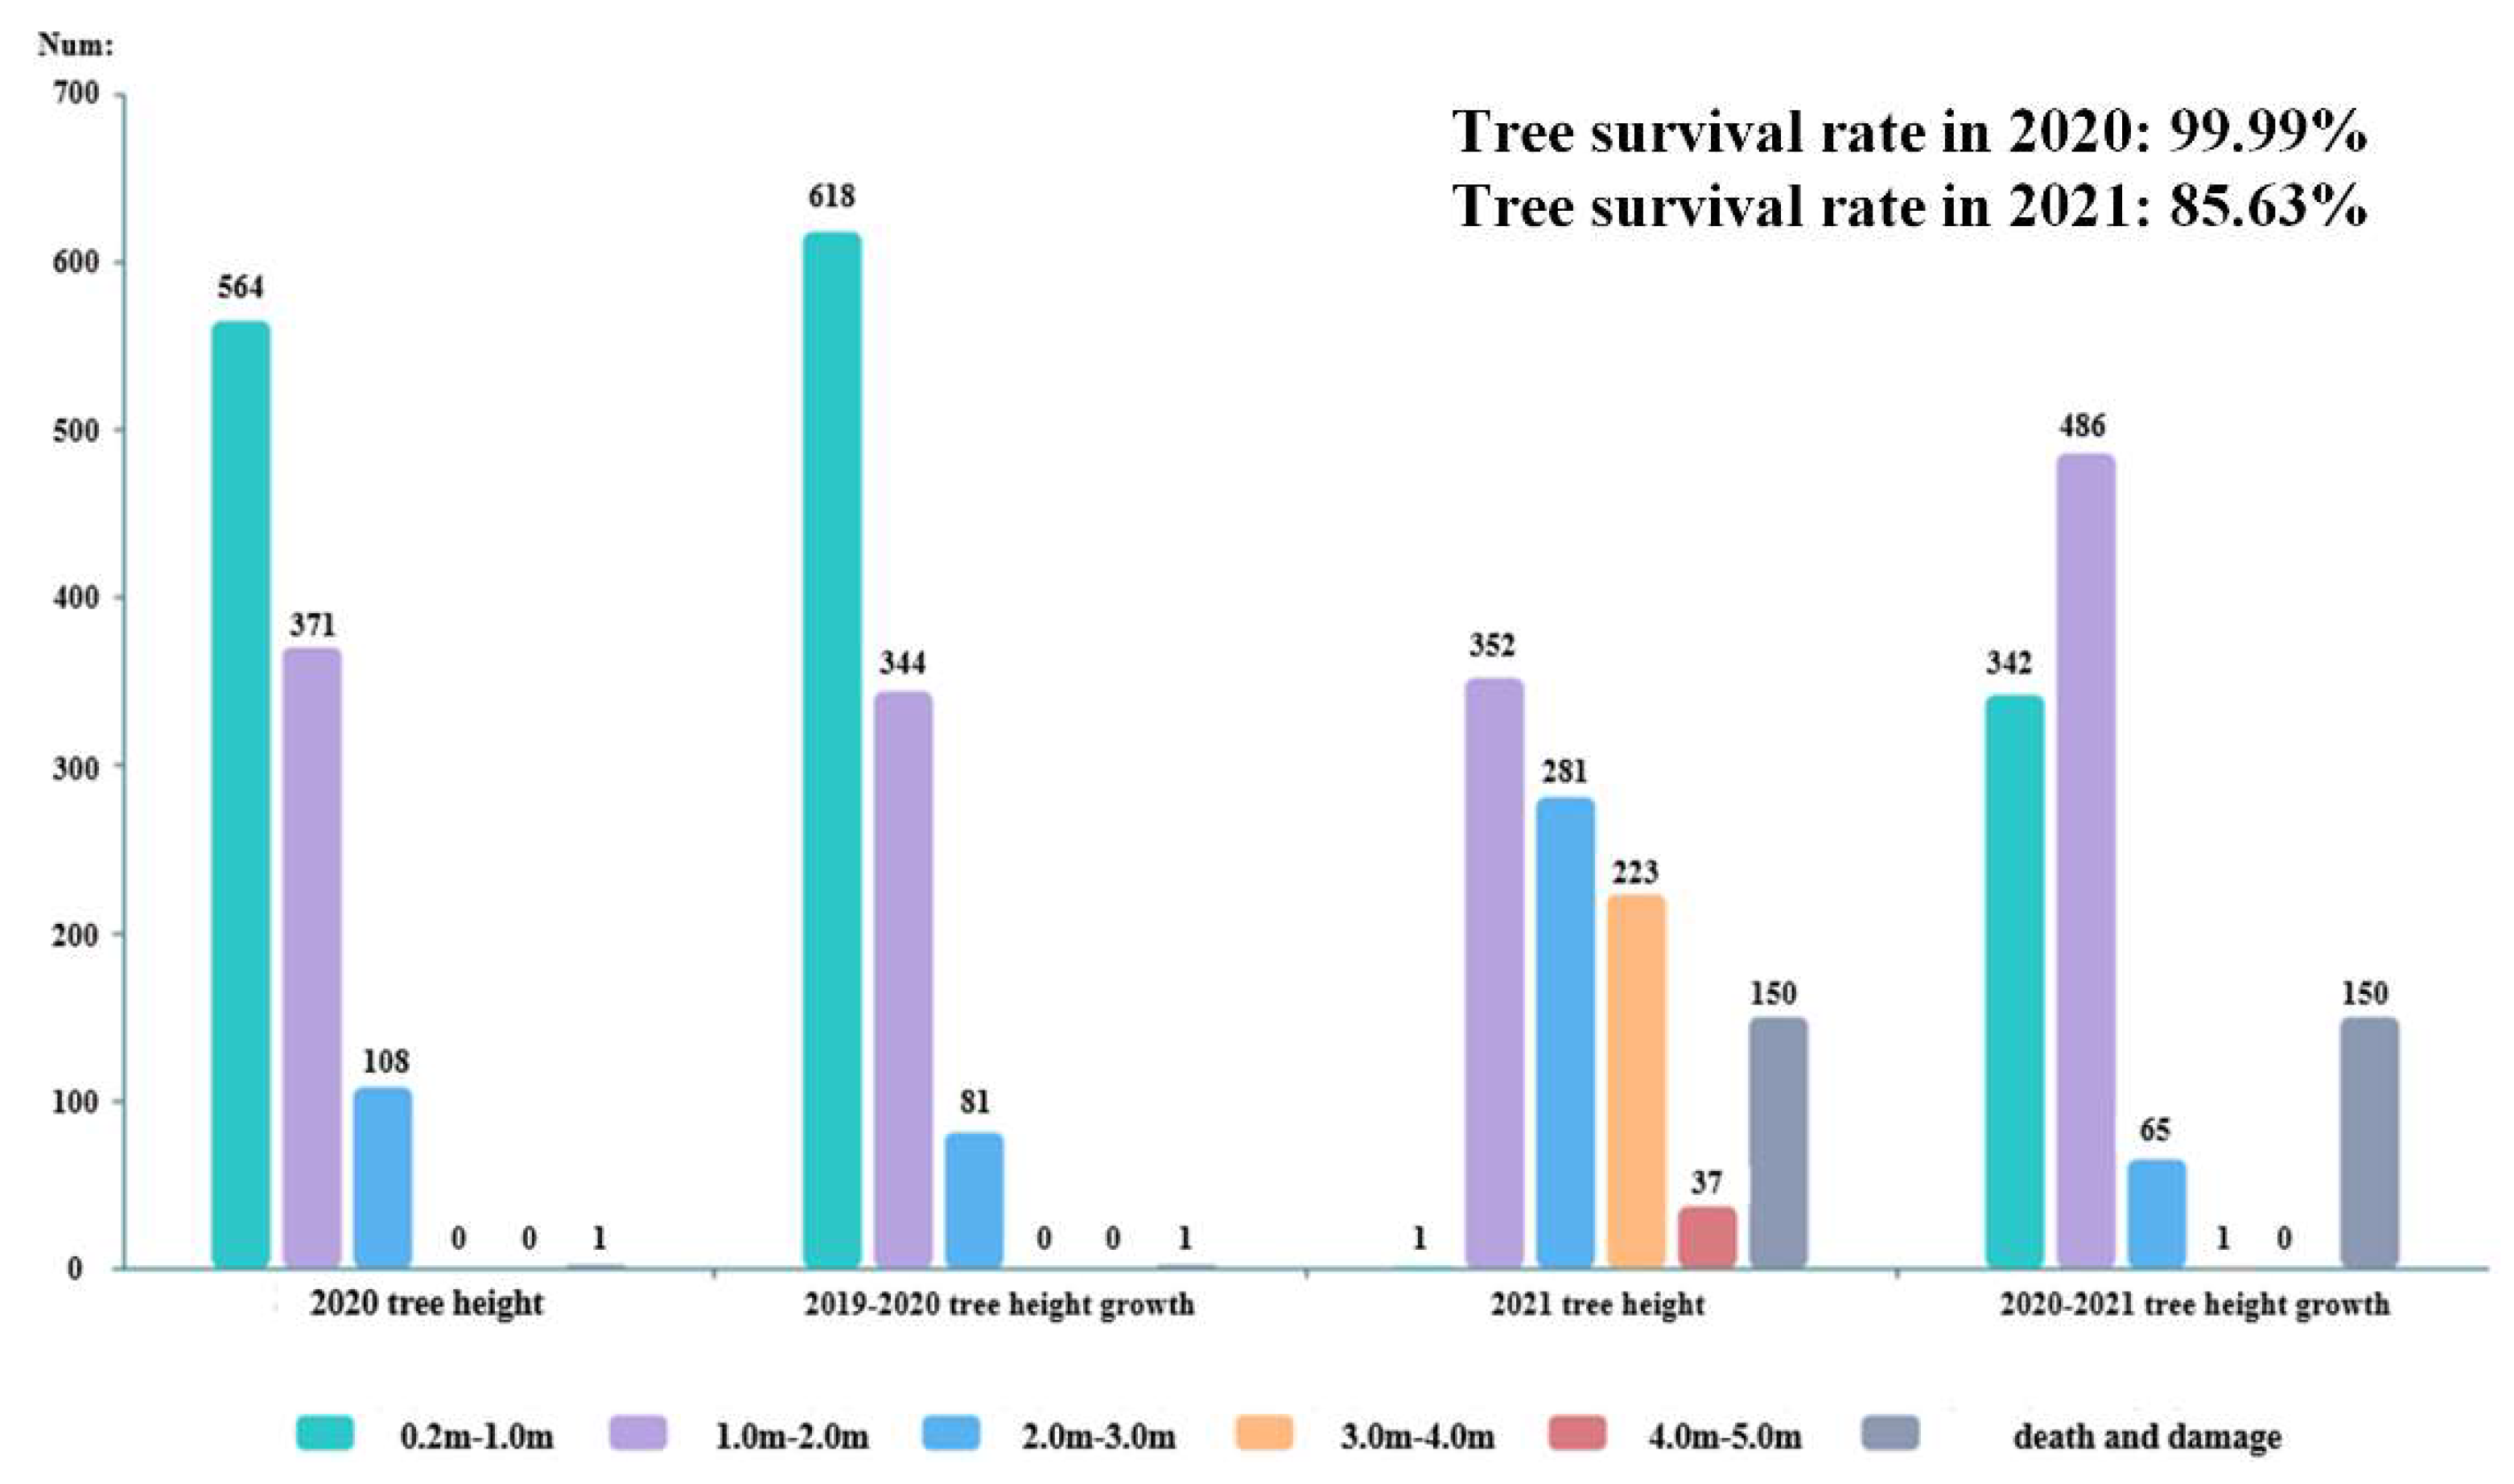
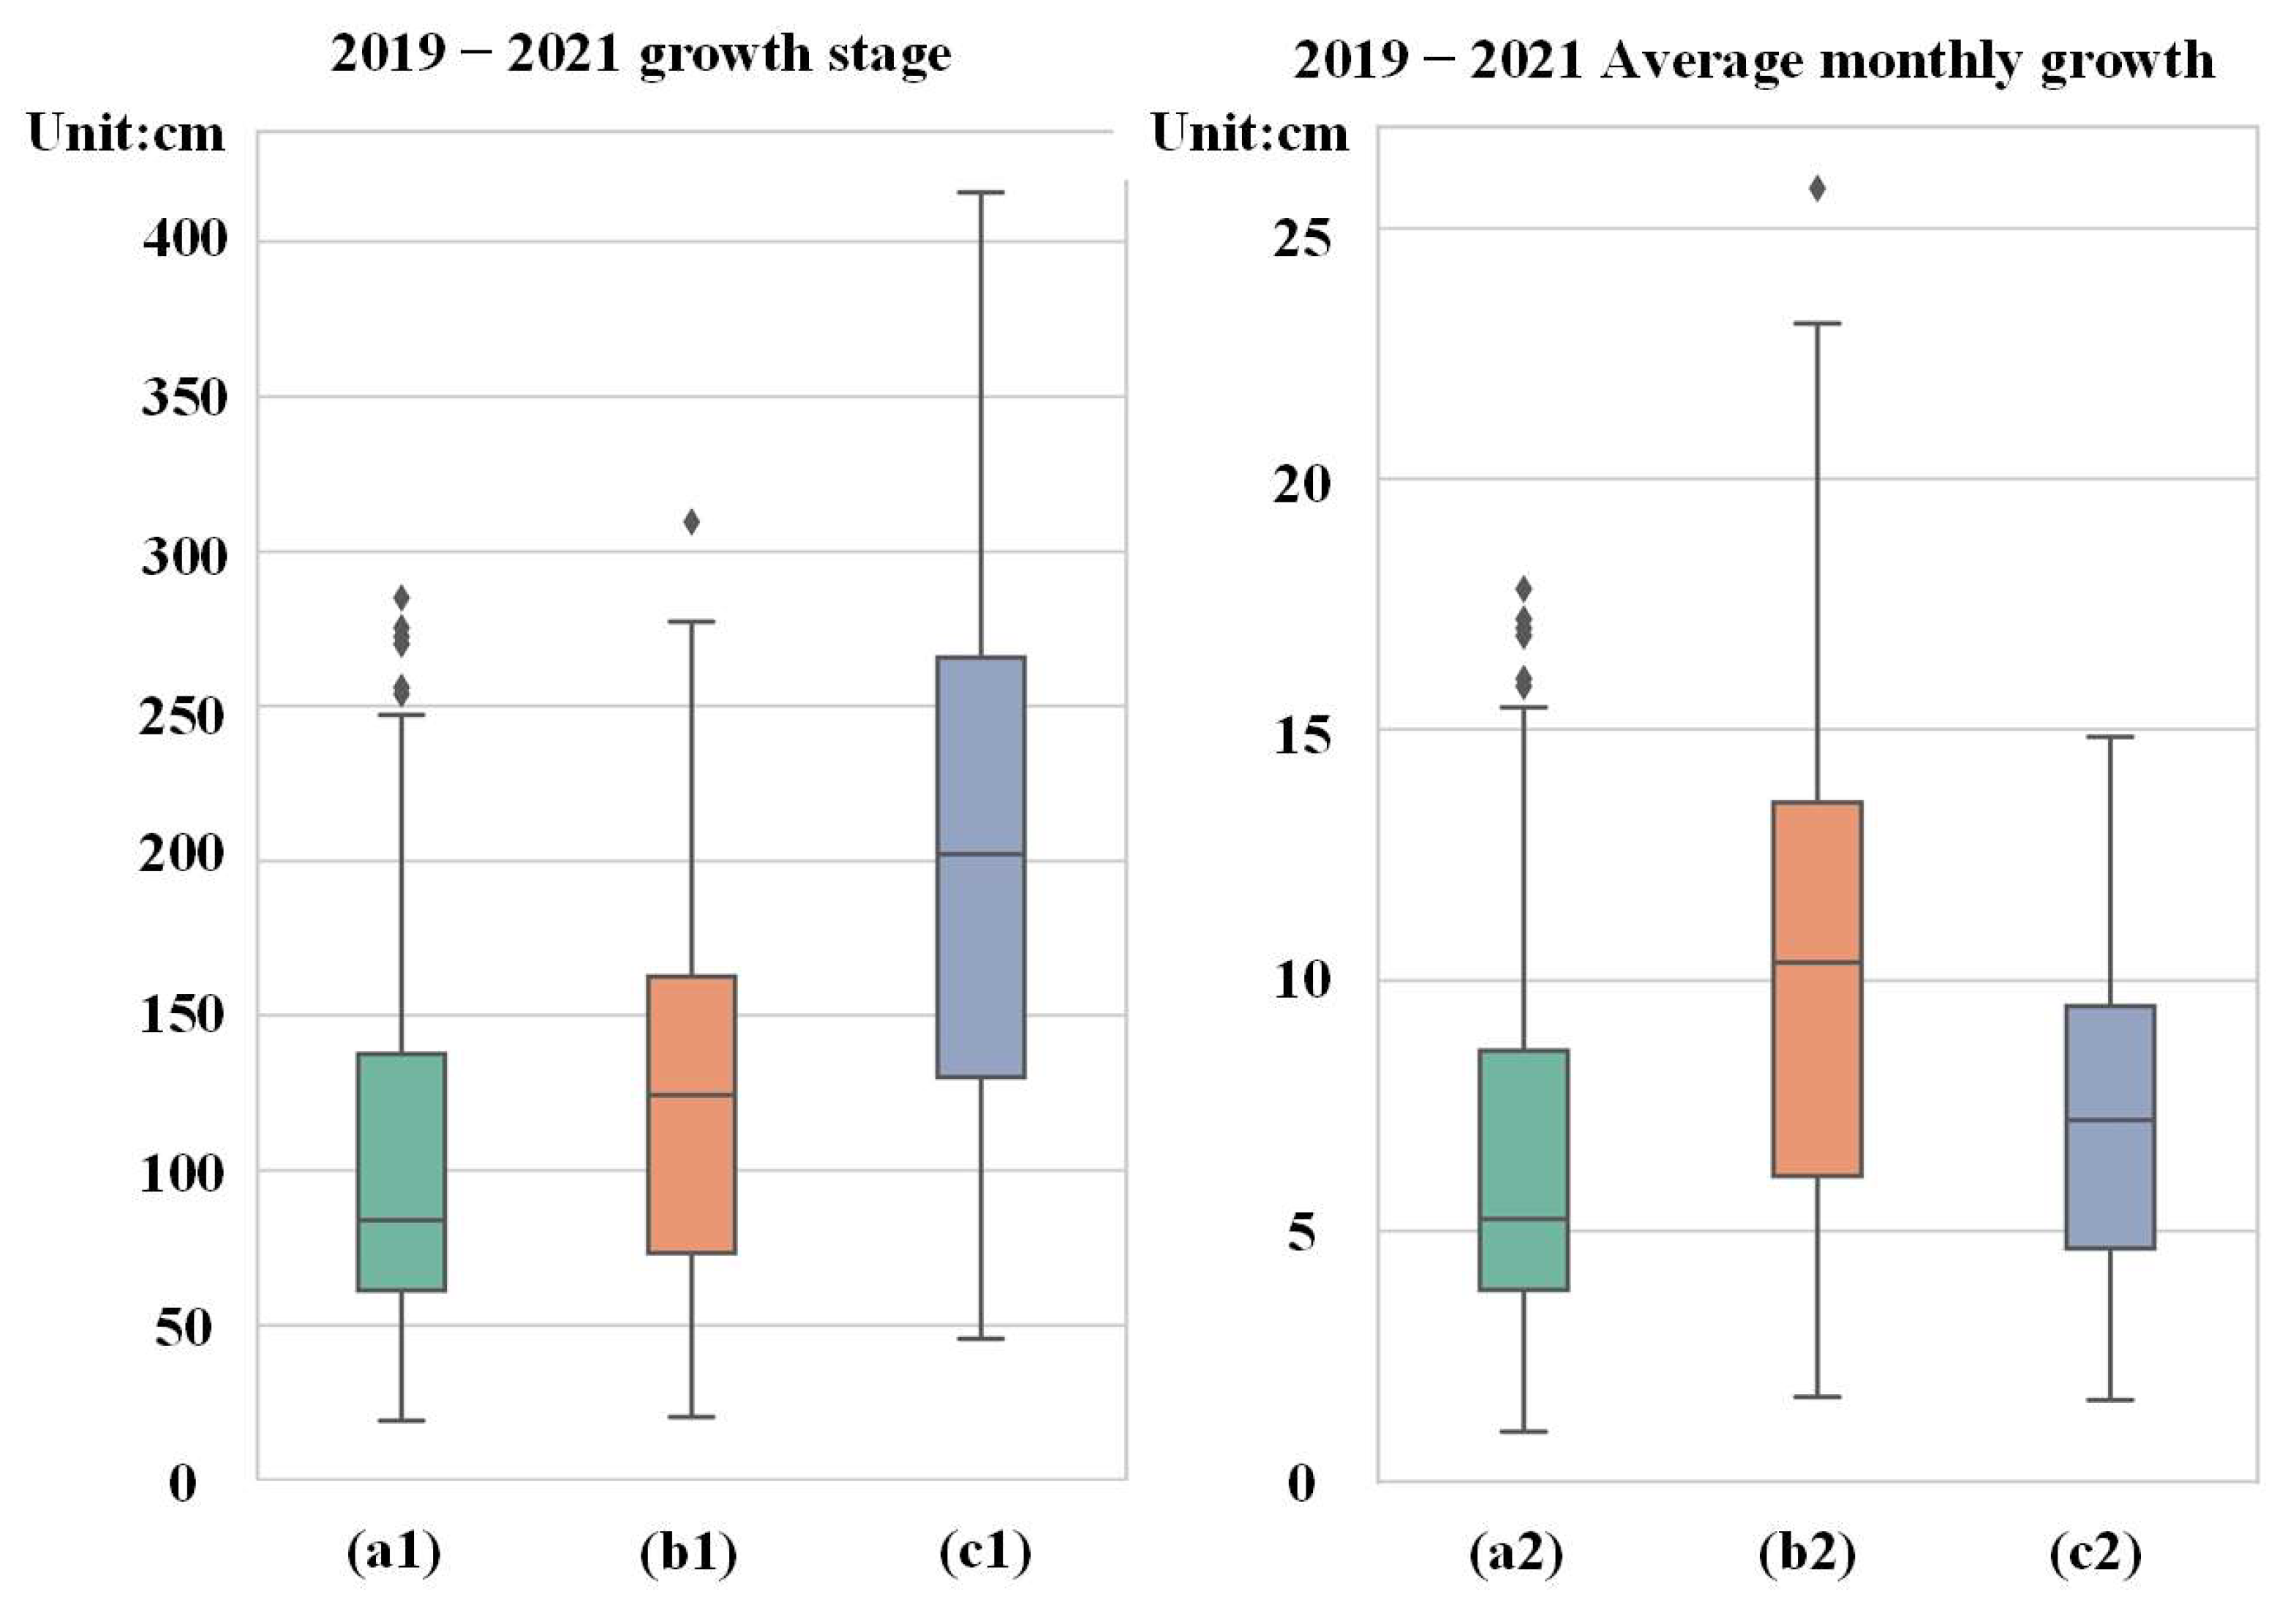
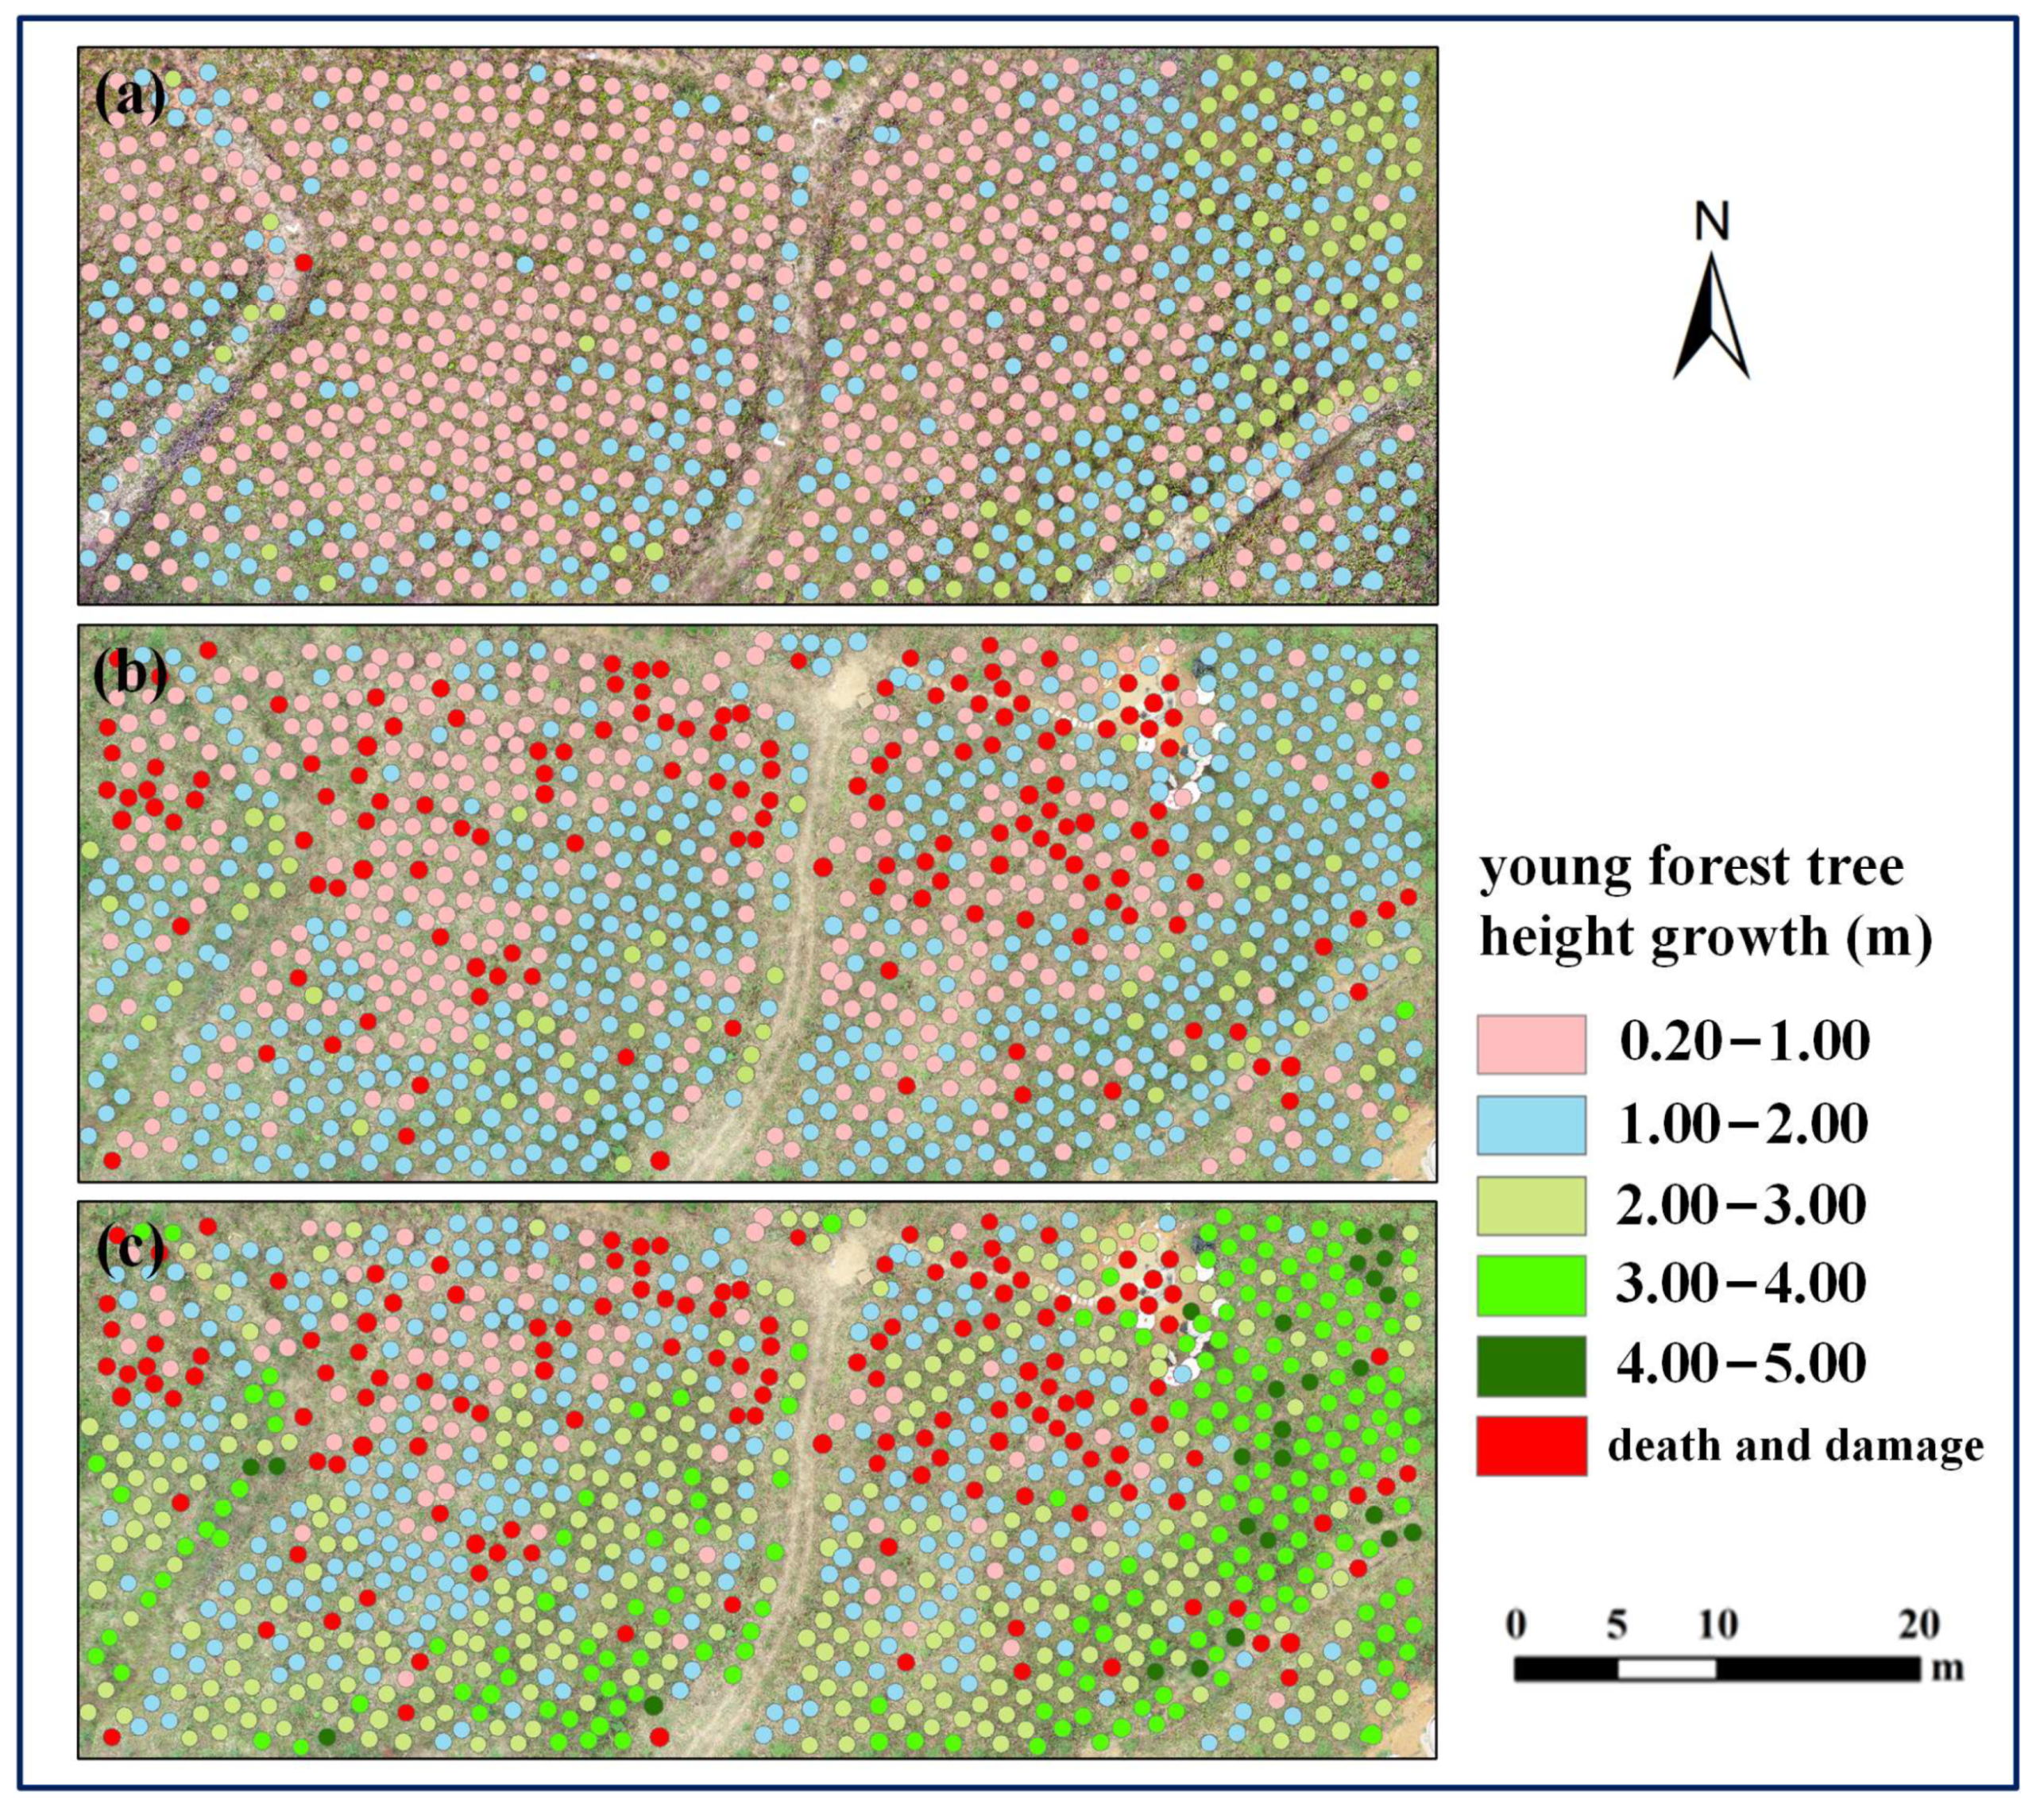
4.2. Annual Growth Change of Saplings
5. Discussion
5.1. Several Aspects in Data Processing
5.2. Uncertainty about Height Estimation for Young Single Trees
5.3. Different Methods of Young Forest Height Observation
5.4. Young Tree Height Variation at Single-Tree Level
5.5. Limitation and Future Perspectives
6. Conclusions
Author Contributions
Funding
Data Availability Statement
Acknowledgments
Conflicts of Interest
References
- Ko, C.; Lee, S.; Yim, J.; Kim, D.; Kang, J. Comparison of Forest Inventory Methods at Plot-Level between a Backpack Personal Laser Scanning (BPLS) and Conventional Equipment in Jeju Island, South Korea. Forests 2021, 12, 308. [Google Scholar] [CrossRef]
- Fan, G.; Feng, W.; Chen, F.; Chen, D.; Dong, Y.; Wang, Z. Measurement of volume and accuracy analysis of standing trees using Forest Survey Intelligent Dendrometer. Comput. Electron. Agric. 2020, 169, 105211. [Google Scholar] [CrossRef]
- Lan, H.W.; Robert, A.C.; Mark, V.F. An Evaluation of Forest Health Insect and Disease Survey Data and Satellite-Based Remote Sensing Forest Change Detection Methods: Case Studies in the United States. Remote Sens. 2018, 10, 1184. [Google Scholar]
- Maqbool, A.; Mirza, A.; Afzal, F.; Shah, T.; Khan, W.Z.; Zikria, Y.B.; Kim, S.W. System-Level Performance Analysis of Cooperative Multiple Unmanned Aerial Vehicles for Wildfire Surveillance Using Agent-Based Modeling. Sustainability 2022, 14, 5927. [Google Scholar] [CrossRef]
- Wagner, F.H.; Ferreira, M.P.; Sanchez, A.; Hirye, M.C.; Zortea, M.; Gloor, E.; Phillips, O.L.; de Souza Filho, C.R.; Shimabukuro, Y.E.; Aragão, L.E.O.C. Individual tree crown delineation in a highly diverse tropical forest using very high resolution satellite images. ISPRS J. Photogramm. 2018, 145, 362–377. [Google Scholar]
- Mu, Y.; Fujii, Y.; Takata, D.; Zheng, B.; Noshita, K.; Honda, K.; Ninomiya, S.; Guo, W. Characterization of peach tree crown by using high-resolution images from an unmanned aerial vehicle. Hortic. Res. 2018, 5, 74. [Google Scholar] [CrossRef] [Green Version]
- Liu, G.; Wang, J.; Dong, P.; Chen, Y.; Liu, Z. Estimating Individual Tree Height and Diameter at Breast Height (DBH) from Terrestrial Laser Scanning (TLS) Data at Plot Level. Forests 2018, 9, 398. [Google Scholar] [CrossRef] [Green Version]
- Franceschi, S.; Antonello, A.; Floreancig, V.; Gianelle, D.; Comiti, F.; Tonon, G. Identifying treetops from aerial laser scanning data with particle swarming optimization. Eur. J. Remote Sens. 2018, 51, 945–964. [Google Scholar] [CrossRef] [Green Version]
- Mao, P.; Qin, L.; Hao, M.; Zhao, W.; Luo, J.; Qiu, X.; Xu, L.; Xiong, Y.; Ran, Y.; Yan, C.; et al. An improved approach to estimate above-ground volume and biomass of desert shrub communities based on UAV RGB images. Ecol. Indic. 2021, 125, 107494. [Google Scholar] [CrossRef]
- Chen, Q.; Gao, T.; Zhu, J.; Wu, F.; Li, X.; Lu, D.; Yu, F. Individual Tree Segmentation and Tree Height Estimation Using Leaf-Off and Leaf-On UAV-LiDAR Data in Dense Deciduous Forests. Remote Sens. 2022, 14, 2787. [Google Scholar] [CrossRef]
- Asier, R.L.; Lluis, B. Greenness Indices from a Low-Cost UAV Imagery as Tools for Monitoring Post-Fire Forest Recovery. Drones 2019, 3, 6. [Google Scholar]
- Socha, J.; Pierzchalski, M.; Bałazy, R.; Ciesielski, M. Modelling top height growth and site index using repeated laser scanning data. For. Ecol. Manag. 2017, 406, 307–317. [Google Scholar] [CrossRef]
- Wang, Y.; Matti, L.; Liang, X.; Jiri, P.; Antero, K.; Anttoni, J.; Liu, J.; Feng, Z. Is field-measured tree height as reliable as believed – A comparison study of tree height estimates from field measurement, airborne laser scanning and terrestrial laser scanning in a boreal forest. ISPRS J. Photogramm. 2019, 147, 132–145. [Google Scholar] [CrossRef]
- Shao, T.; Qu, Y.; Du, J. A low-cost integrated sensor for measuring tree diameter at breast height (DBH). Comput. Electron. Agric. 2022, 199, 107140. [Google Scholar] [CrossRef]
- Hao, Z.; Lin, L.; Post, C.J.; Jiang, Y.; Li, M.; Wei, N.; Yu, K.; Liu, J. Assessing tree height and density of a young forest using a consumer unmanned aerial vehicle (UAV). New For. 2021, 52, 843–862. [Google Scholar] [CrossRef]
- Jin, C.; Oh, C.-y.; Shin, S.; Wilfred Njungwi, N.; Choi, C. A Comparative Study to Evaluate Accuracy on Canopy Height and Density Using UAV, ALS, and Fieldwork. Forests 2020, 11, 241. [Google Scholar] [CrossRef] [Green Version]
- Chen, S.; Liang, D.; Ying, B.; Zhu, W.; Zhou, G.; Wang, Y. Assessment of an improved individual tree detection method based on local-maximum algorithm from unmanned aerial vehicle RGB imagery in overlapping canopy mountain forests. Int. J. Remote Sens. 2021, 42, 106–125. [Google Scholar] [CrossRef]
- Stuart, K.; Tanja, G.M.S.; Jan-Peter, M.; Klaus, G. UAV-Based Photogrammetric Tree Height Measurement for Intensive Forest Monitoring. Remote Sens. 2019, 11, 758. [Google Scholar]
- Mielcarek, M.; Stereńczak, K.; Khosravipour, A. Testing and evaluating different LiDAR-derived canopy height model generation methods for tree height estimation. Int. J. Appl. Earth Obs. Geoinf. 2018, 71, 132–143. [Google Scholar] [CrossRef]
- Hao, J.; Chen, S.; Li, D.; Wang, C.; Ji, Y. Papaya Tree Detection with UAV Images Using a GPU-Accelerated Scale-Space Filtering Method. Remote Sens. 2017, 9, 721. [Google Scholar]
- Guerra, H.J.; Cosenza, D.N.; Rodriguez, L.C.E.; Silva, M.; Tomé, M.; Díaz, V.R.A.; González, F.E. Comparison of ALS- and UAV(SfM)-derived high-density point clouds for individual tree detection in Eucalyptus plantations. Int. J. Remote Sens. 2018, 39, 5211–5235. [Google Scholar] [CrossRef]
- Grigorijs, G.; Stefan, W.M.; Shaun, R.L.; Andrew, E. Efficiency of Individual Tree Detection Approaches Based on Light-Weight and Low-Cost UAS Imagery in Australian Savannas. Remote Sens. 2018, 10, 161. [Google Scholar]
- Ramalho, D.; Lassiter, H.; Wilkinson, B.; Whitley, T.; Ifju, P.; Logan, S.; Peter, G.; Vogel, J.; Martin, T. Moving to Automated Tree Inventory: Comparison of UAS-Derived Lidar and Photogrammetric Data with Manual Ground Estimates. Remote Sens. 2020, 13, 72. [Google Scholar] [CrossRef]
- Shimizu, K.; Nishizono, T.; Kitahara, F.; Fukumoto, K.; Saito, H. Integrating terrestrial laser scanning and unmanned aerial vehicle photogrammetry to estimate individual tree attributes in managed coniferous forests in Japan. Int. J. Appl. Earth Obs. 2022, 106, 102658. [Google Scholar] [CrossRef]
- Yoshii, T.; Matsumura, N.; Lin, C. Integrating UAV-SfM and Airborne Lidar Point Cloud Data to Plantation Forest Feature Extraction. Remote Sens. 2022, 14, 1713. [Google Scholar] [CrossRef]
- Corey, F.; Gregory, J.M.; Guillermo, C. Detection of Coniferous Seedlings in UAV Imagery. Forests 2018, 9, 432. [Google Scholar]
- Hartley, R.J.L.; Leonardo, E.M.; Massam, P.; Watt, M.S.; Estarija, H.J.; Wright, L.; Melia, N.; Pearse, G.D. An Assessment of High-Density UAV Point Clouds for the Measurement of Young Forestry Trials. Remote Sens. 2020, 12, 4039. [Google Scholar] [CrossRef]
- Stefano, P.; Bruce, T.; Rasmus, A. Tree-Stump Detection, Segmentation, Classification, and Measurement Using Unmanned Aerial Vehicle (UAV) Imagery. Forests 2018, 9, 102. [Google Scholar]
- Stefano, P.; Svein, S.; Aksel, G. Use of UAV Photogrammetric Data for Estimation of Biophysical Properties in Forest Stands Under Regeneration. Remote Sens. 2019, 11, 233. [Google Scholar]
- Julian, M.N.; David, M.N. Herbivores equalize the seedling height growth of three dominant tree species in an African tropical rain forest. Forest Ecol. Manag. 2013, 310, 555–566. [Google Scholar]
- Zhang, W.; Qi, J.; Wan, P.; Wang, H.; Xie, D.; Wang, X.; Yan, G. An Easy-to-Use Airborne LiDAR Data Filtering Method Based on Cloth Simulation. Remote Sens. 2016, 8, 501. [Google Scholar] [CrossRef]
- Zhou, X.; Wang, F.; Huang, H.; Feng, Z.; Xiao, X.; Li, Y. Number and Parameters Extraction of Tree Well Based on UAV Remote Sensing in Cutting Area. Trans. Chin. Soc. Agric. Mach. 2021, 52, 201–206. [Google Scholar]
- Canny, J. A computational approach to edge detection. IEEE Trans. Pattern Anal. Mach. Intell. 1986, 8, 679–698. [Google Scholar] [CrossRef]
- Zhuang, P.; Fu, X.; Huang, Y.; Ding, X. Image Enhancement Using Divide-and-Conquer Strategy. J. Vis. Commun. Image R. 2017, 45, 137–146. [Google Scholar] [CrossRef]
- Xiangchu, F.; Liang, L.; Xixi, J.; Weiwei, W. A divide-and-conquer stochastic alterable direction image denoising method. Signal Process. 2015, 108, 90–101. [Google Scholar]
- Gu, J.; Grybas, H.; Congalton, R.G. Individual Tree Crown Delineation from UAS Imagery Based on Region Growing and Growth Space Considerations. Remote Sens. 2020, 12, 2363. [Google Scholar] [CrossRef]
- Chalmers, D.J.; Ende, B.V.D. Productivity of Peach Trees: Factors Affecting Dry-weight Distribution During Tree Growth. Ann. Bot. 1975, 39, 423–432. [Google Scholar] [CrossRef]
- Jan, D.; Jyoteshwar, N.; Sebastian, H.; Carsten, T.; Reiner, Z.; Peter, N.B.; Timothy, A.M. Measurement of Within-Season Tree Height Growth in a Mixed Forest Stand Using UAV Imagery. Forests 2017, 8, 231. [Google Scholar]
- Bourgoin, C.; Betbeder, J.; Couteron, P.; Blanc, L.; Dessard, H.; Oszwald, J.; Le Roux, R.; Cornu, G.; Reymondin, L.; Mazzei, L. UAV-based canopy textures assess changes in forest structure from long-term degradation. Ecol. Indic. 2020, 115, 106386. [Google Scholar] [CrossRef] [Green Version]
- Ferreira, M.P.; de Almeida, D.R.A.; de Almeida Papa, D.; Minervino, J.B.S.; Veras, H.F.P.; Formighieri, A.; Santos, C.A.N.; Ferreira, M.A.D.; Figueiredo, E.O.; Ferreira, E.J.L. Individual tree detection and species classification of Amazonian palms using UAV images and deep learning. For. Ecol. Manag. 2020, 475, 118397. [Google Scholar]
- Zarco-Tejada, P.J.; Diaz-Varela, R.; Angileri, V.; Loudjani, P. Tree height quantification using very high resolution imagery acquired from an unmanned aerial vehicle (UAV) and automatic 3D photo-reconstruction methods. Eur. J. Agron. 2014, 55, 89–99. [Google Scholar] [CrossRef]
- Panagiotidis, D.; Abdollahnejad, A.; Surový, M. Determining tree height and crown diameter from high-resolution UAV imagery. Int. J. Remote Sens. 2017, 38, 2392–2410. [Google Scholar] [CrossRef]
- Goodbody, T.; White, J.; Coops, N.; LeBoeuf, A. Benchmarking acquisition parameters for digital aerial photogrammetric data for forest inventory applications: Impacts of image overlap and resolution. Remote Sens. Environ. 2021, 265, 112677. [Google Scholar] [CrossRef]
- Wu, D.; Johansen, K.; Phinn, S.; Robson, A.; Tu, Y. Inter-comparison of remote sensing platforms for height estimation of mango and avocado tree crowns. Int. J. Appl. Earth Obs. 2020, 89, 102091. [Google Scholar] [CrossRef]
- Stovall, A.; Shugart, H.; Yang, X. Tree height explains mortality risk during an intense drought. Nat. Commun. 2019, 10, 4385. [Google Scholar] [CrossRef] [Green Version]
- Julián, T.; Martin, M.; Peter, S.; Alzbeta, G.; Ján, M. UAV RTK/PPK Method—An Optimal Solution for Mapping Inaccessible Forested Areas? Remote Sens. 2019, 11, 721. [Google Scholar]
- Bertacchi, A. UAVs Technology as a Complementary Tool in Post-Fire Vegetation Recovery Surveys in Mediterranean Fire-Prone Forests. Forests 2022, 13, 1009. [Google Scholar] [CrossRef]
- Krzysztof, S.; Miłosz, M.; Bogdan, W.; Karol, B.; Grzegorz, Z.; Andrzej, M.J.; Wojciech, O.; Maciej, S. Factors influencing the accuracy of ground-based tree-height measurements for major European tree species. J. Environ. Manag. 2018, 231, 1284–1292. [Google Scholar]
- Yu, H.T.; Kasper, J.; Stuart, P.; Andrew, R. Measuring Canopy Structure and Condition Using Multi-Spectral UAS Imagery in a Horticultural Environment. Remote Sens. 2019, 11, 269. [Google Scholar]
- Ma, Q.; Su, Y.; Tao, S.; Guo, Q. Quantifying individual tree growth and tree competition using bi-temporal airborne laser scanning data: A case study in the Sierra Nevada Mountains, California. Int. J. Digit. Earth 2018, 11, 485–503. [Google Scholar] [CrossRef]
- Ziliani, M.; Parkes, S.; Hoteit, I.; McCabe, M. Intra-Season Crop Height Variability at Commercial Farm Scales Using a Fixed-Wing UAV. Remote Sens. 2018, 10, 2007. [Google Scholar] [CrossRef] [Green Version]
- Juan, G.; Eduardo, G.; Vicente, J.M.; Sonia, P.F.; Margarida, T.; Ramón, A.D. Use of Multi-Temporal UAV-Derived Imagery for Estimating Individual Tree Growth in Pinus pinea Stands. Forests 2017, 8, 300. [Google Scholar]
- McDowell, N.G.; Allen, C.D.; AndersonTeixeira, K.; Aukema, B.H.; BondLamberty, B.; Chini, L.; Clark, J.S.; Dietze, M.; Grossiord, C.; HanburyBrown, A.; et al. Pervasive shifts in forest dynamics in a changing world. Science 2020, 368, 6494. [Google Scholar] [CrossRef] [PubMed]
- Flurin, B.; Olivier, B.; Benjamin, P.; Valerie, T.; Martin, P.G.; David, C.F. Twentieth century redistribution in climatic drivers of global tree growth. Sci. Adv. 2019, 5, eaat4313. [Google Scholar]
- Mizanur, R.; Mahmuda, I.; Aster, G.; Achim, B. Trends in tree growth and intrinsic water-use efficiency in the tropics under elevated CO2 and climate change. Trees 2019, 33, 623–640. [Google Scholar]
- Keiko, F.; Tetsuji, O.; Nobuya, M.; Shigejiro, Y.; Yukio, T. The effect of weeding frequency and timing on the height growth of young sugi (Cryptomeria japonica) in southwestern Japan. J. For. Res. 2017, 22, 1–4. [Google Scholar]


| Flight Time | UAV Model | Flight Height | Forward Overlap | Side Overlap | Number of UAV Photos |
|---|---|---|---|---|---|
| 20190122 | DJI Phantom 4 | 40 m | 90% | 80% | 335 |
| 20201002 | DJI Mavic 2 | 30 m | 90% | 80% | 1167 |
| 20211003 | DJI Phantom 4 RTK | 40 m | 90% | 80% | 574 |
| 2020 Tree NO. | Measured Tree Height (m) | DAC (m) | Error | Relative Accuracy (%) |
|---|---|---|---|---|
| 1 | 1.34 | 1.11 | 0.23 | 82.61 |
| 2 | 1.57 | 1.90 | −0.33 | 79.09 |
| 3 | 1.70 | 1.26 | 0.44 | 73.99 |
| 4 | 0.78 | 0.83 | −0.05 | 93.79 |
| … | … | … | … | … |
| 39 | 0.64 | 0.53 | 0.12 | 81.67 |
| 40 | 1.42 | 1.32 | 0.10 | 93.23 |
| average | 1.29 | 1.26 | 0.03 | 85.89 |
| R2 = 0.8577 RMSE = 0.2141 | ||||
| 2021 Tree NO. | Measured Tree Height (m) | DAC (m) | LM (m) | Error of DAC | Error of LM | Relative Accuracy of DAC (%) | Relative Accuracy of LM (%) |
|---|---|---|---|---|---|---|---|
| 1 | 3.15 | 2.94 | 2.70 | 0.21 | 0.45 | 93.19 | 85.76 |
| 2 | 2.97 | 2.77 | 2.56 | 0.20 | 0.41 | 93.43 | 86.16 |
| 3 | 1.35 | 1.39 | 1.18 | −0.04 | 0.17 | 96.93 | 87.16 |
| 4 | 3.46 | 3.19 | 2.72 | 0.27 | 0.74 | 92.10 | 78.67 |
| … | … | … | … | … | … | … | … |
| 39 | 3.49 | 3.48 | 3.17 | 0.01 | 0.32 | 99.70 | 90.88 |
| 40 | 4.16 | 3.98 | 3.79 | 0.18 | 0.37 | 95.67 | 91.18 |
| average | 2.63 | 2.58 | 2.35 | 0.05 | 0.28 | 94.87 | 88.49 |
| Divide and conquer: R2 = 0.9659 RMSE = 0.1609 | |||||||
| Local maximum: R2 = 0.9462 RMSE = 0.3354 | |||||||
Disclaimer/Publisher’s Note: The statements, opinions and data contained in all publications are solely those of the individual author(s) and contributor(s) and not of MDPI and/or the editor(s). MDPI and/or the editor(s) disclaim responsibility for any injury to people or property resulting from any ideas, methods, instructions or products referred to in the content. |
© 2023 by the authors. Licensee MDPI, Basel, Switzerland. This article is an open access article distributed under the terms and conditions of the Creative Commons Attribution (CC BY) license (https://creativecommons.org/licenses/by/4.0/).
Share and Cite
Zhou, X.; Wang, H.; Chen, C.; Nagy, G.; Jancso, T.; Huang, H. Detection of Growth Change of Young Forest Based on UAV RGB Images at Single-Tree Level. Forests 2023, 14, 141. https://doi.org/10.3390/f14010141
Zhou X, Wang H, Chen C, Nagy G, Jancso T, Huang H. Detection of Growth Change of Young Forest Based on UAV RGB Images at Single-Tree Level. Forests. 2023; 14(1):141. https://doi.org/10.3390/f14010141
Chicago/Turabian StyleZhou, Xiaocheng, Hongyu Wang, Chongcheng Chen, Gábor Nagy, Tamas Jancso, and Hongyu Huang. 2023. "Detection of Growth Change of Young Forest Based on UAV RGB Images at Single-Tree Level" Forests 14, no. 1: 141. https://doi.org/10.3390/f14010141