1. Introduction
Forests cover a productive area of over 400,000 km
2 and play an important role in Quebec’s economy [
1]. In 2020, there were 53,000 direct jobs in the forest industry and exports totaled CAD 9.4 bn. Forest product companies are aiming for optimal use of available resources at a time when markets are increasingly competitive, and the supply of wood with desired characteristics is limited. The current context of market competition highlights the importance of optimizing a company’s supply system. The growing complexity of factors to consider makes forest planning increasingly difficult. These factors include requirements for raw material, increasingly dispersed harvesting areas, the diversity of final products to be generated, wood harvesting methods to use, variety of transportation methods, several stakeholders to consider on the territory, environmental regulations, and silvicultural prescriptions to apply. In the literature, various studies have investigated wood supply network planning; many optimization models with beneficial impacts on network profitability have been developed.
Morneau-Pereira et al. [
2] noted that supply planning in the forest industry was carried out by managers using a trial-and-error method based on the latter’s experience and intuition. Heuristic approaches remain today’s standard. Numerous criteria must be considered, and many decisions must be made to plan forest actions efficiently, leaving little leeway for managers due to environmental requirements, social apprehension, available infrastructure, and raw material characteristics. In addition, managers must choose the type of transportation method and type of harvesting to use, decide the location and moment of harvesting, and decide to which mills harvested wood will go. All these criteria make the planners’ job difficult. Although optimization has been used to solve forest planning problems for several decades, the nature of problems has continued to develop, making the task of optimization increasingly complex and bringing with it a greater number of constraints [
3,
4]. While the literature has proposed many mathematical planning models, very few of these models are currently used in companies. We speculate that the complexity of the matter, a constantly changing natural environment, and the expertise necessary to use these models limit their application in an industrial context.
This project primarily aimed to analyze mathematical optimization’s potential to improve wood supply planning. To do this, a gap analysis was performed between current planning in companies and planning generated by optimization models. As both types of planning do not necessarily use the same resources and skills (for example, software, workforce, completion time, training, knowledge), costs and conditions necessary for using one or both approaches have been formally recognized and described. Three specific goals were established: (i) assess the potential of implementing mathematical optimization in companies; (ii) compare the benefits and advantages of using mathematical optimization versus the company’s current planning methods to support planning decisions; and (iii) analyze the impact of variation in forest inventory information used to prepare plans depending on one or the other planning methods under study.
This article is divided as follows.
Section 2 provides a literature review on procurement network planning, forest planning of the study area, and various models that have been developed in relation to the problem being addressed.
Section 3 presents the method used, case study, and decision-making tool used.
Section 4 presents the results, including the requirements for the implementation of the optimization approach, the comparison of the two planning methods under study, and the analysis of gaps between a set of planning scenarios.
Section 5 provides a conclusion that emphasizes the key components addressed in the research.
2. Literature Review
Mosconi [
5] defined the wood supply network as the “people, organizations and activities from procurement to deliveries at processing mills” [unofficial translation]. Supply serves as the point of departure for creating a value network. According to Lehoux et al. [
6], network performance essentially relies on alignment between supply steps and production tasks until final product sales. Planning operations within this network is carried out according to one of two main approaches used in network planning: centralized and distributed planning [
7]. The centralized planning approach is based on a global view of the supply chain where management is coordinated by one parent company that considers all circulating flows [
8]. Planning decisions are based on the entire supply chain in order to maximize global benefits [
9]. In contrast, distributed planning considers independent companies when making decisions. Interactions among various actors in the chain are based on direct client–supplier relationships to ensure that the upstream supplier can meet the demand of the downstream client [
10].
In network planning, numerous parameters can influence decision making. Planning supports decision making by developing scenarios the manager will analyze before choosing which option suits them best [
11]. The planning process in the forestry sector is usually based on trial and error through planners’ experience and intuition [
12]. Mosconi’s study [
5] establishes the planning method used by a forest product company operated in Quebec. Mosconi listed various tools used by the company, including Excel spreadsheets, the geographic information system ArcGIS, simulation software FPinterface, and internal software which were generally used to correct and analyze various planning scenarios. LeBel et al. [
13] state that the use of advanced technological planning tools would allow the rapid assessment of several scenarios in addition to visualizing impacts related to changes proposed by various stakeholders. However, according to study partners, the aforementioned initiatives were indeed attempted in the past and the use of tools was abandoned because of the models’ complexity, the time required, and the financial and human resources needed to use these tools.
Many studies have addressed computerized tools; in particular, in the 1990s [
14], the development of simulation and optimization models greatly expanded. Thereafter, increasingly efficient models were developed to support decision making in planning forest supply activities (see: [
2,
15,
16,
17,
18,
19,
20,
21].
Table 1 summarizes the characteristics of a selection of optimization models and lays out the potential benefits of their use. As noted previously, many models were developed but not used concretely in companies. Developed models often include variables that make model use complex. In reality, these variables are often inappropriate for the planning to be applied and are not adapted to the industrial context.
Given the study’s context and goals, the LogiOpt planning system first developed by Morneau-Pereira [
2] seems a useful foundation to develop new functionalities required for application in companies. This system can be used as a coupled approach with software currently used in companies and an optimization model. It could also promote the integration of supply to process, and process to market as suggested by [
22,
23]
Unlike previous studies that presented the same subject, this study establishes the conditions necessary to implement mathematical optimization, to improve and simplify the planning process based on planners’ experience and intuition. This study also quantifies the costs and benefits of implementing a planning approach using optimization.
3. Materials and Methods
The first component of our methodological approach is to compare an actual plan (as established by planners in a forest product company), with an optimal plan made by a decision-making tool. To assess the current planning approach, work carried out during the annual programming process (APP) was noted. Each step was observed and described to have an overall view of the method and requirements related to implementation. This documenting of the process used by companies made it possible to easily pinpoint implementation steps that could be optimized.
A case study was carried out featuring a large-scale Canadian forest product company supplying five sawmills in the same general area. These mills mostly transform three tree species into lumber of various sizes: black spruce (
Picea mariana M.), balsam fir (
Abies balsamea L.), and jack pine (
Pinus banksiana L.). Annually, the largest of the five mills can process 1 million m
3, and the smallest one, 0.48 million m
3. The average mill capacity is 0.8 million m
3. By-products such as shavings and sawdust were also considered, though they are less desirable because they reduce generated profits. Information about the network and products were used to model the problem. This case study used the LogiLab optimization platform [
24]. The latter is based on a linear programming mathematical optimization model (see
Appendix A) and can include many key factors to be considered. It also allows the consideration of transport, harvesting, heterogeneity of raw materials, and factors associated with sawmill performance when planning wood supply from the forest to in-plant processing. The goal is to maximize net value from the sale of finished products for the entire network. The solution may therefore generate a supply plan that is more costly to harvest and transport if it yields revenues that compensate for these extra costs.
A complete understanding of industry needs was required in order to apply an optimization model to the case study. We configured the generic mathematical model used in the LogiLab platform and considered the partner company’s specific context (for example, bucking rules, log assortments, and transportation modes). In so doing, we made changes to the generic model and added constraints to reflect the company’s context.
More specifically, we incorporated tree bucking patterns used depending on the forest harvesting area (two lengths are possible for logs: 500 cm and 560 cm–16′ and 18′, respectively, in local measurement units). Yet only two of five sawmills in the network were capable of transforming 560 cm logs [Equation (1)]. Forest harvest teams sorted harvested stems in three piles, based on species or diameter depending on procurement region; each pile could be sent to a maximum of two sawmills [Equation (3)]. Wood is procured from 66 harvesting units, generating 2.8 million m
3. Wood transport was performed by non-standard (oversized) trucks or four-axle trailers. Volume transported by non-standard trucks originated only from certain areas and could only be sent to three of the five sawmills by way of logging roads [Equation (2)]. We added the following components to the model:
| New Set | |
| Set of harvesting blocks |
| Set of the bucking process in 18’ logs (560 cm) |
| Set of piles |
| Set of products on the pile |
| Set of harvesting blocks on an area to harvest |
| New Constant | |
| Total transformation capacities at mills accepting 18’ logs (560 cm) |
| New variable | |
| Binary variable indicating whether products from are sent to |
| Mathematical formulation | |
| (1) |
|
(2) |
|
(3) |
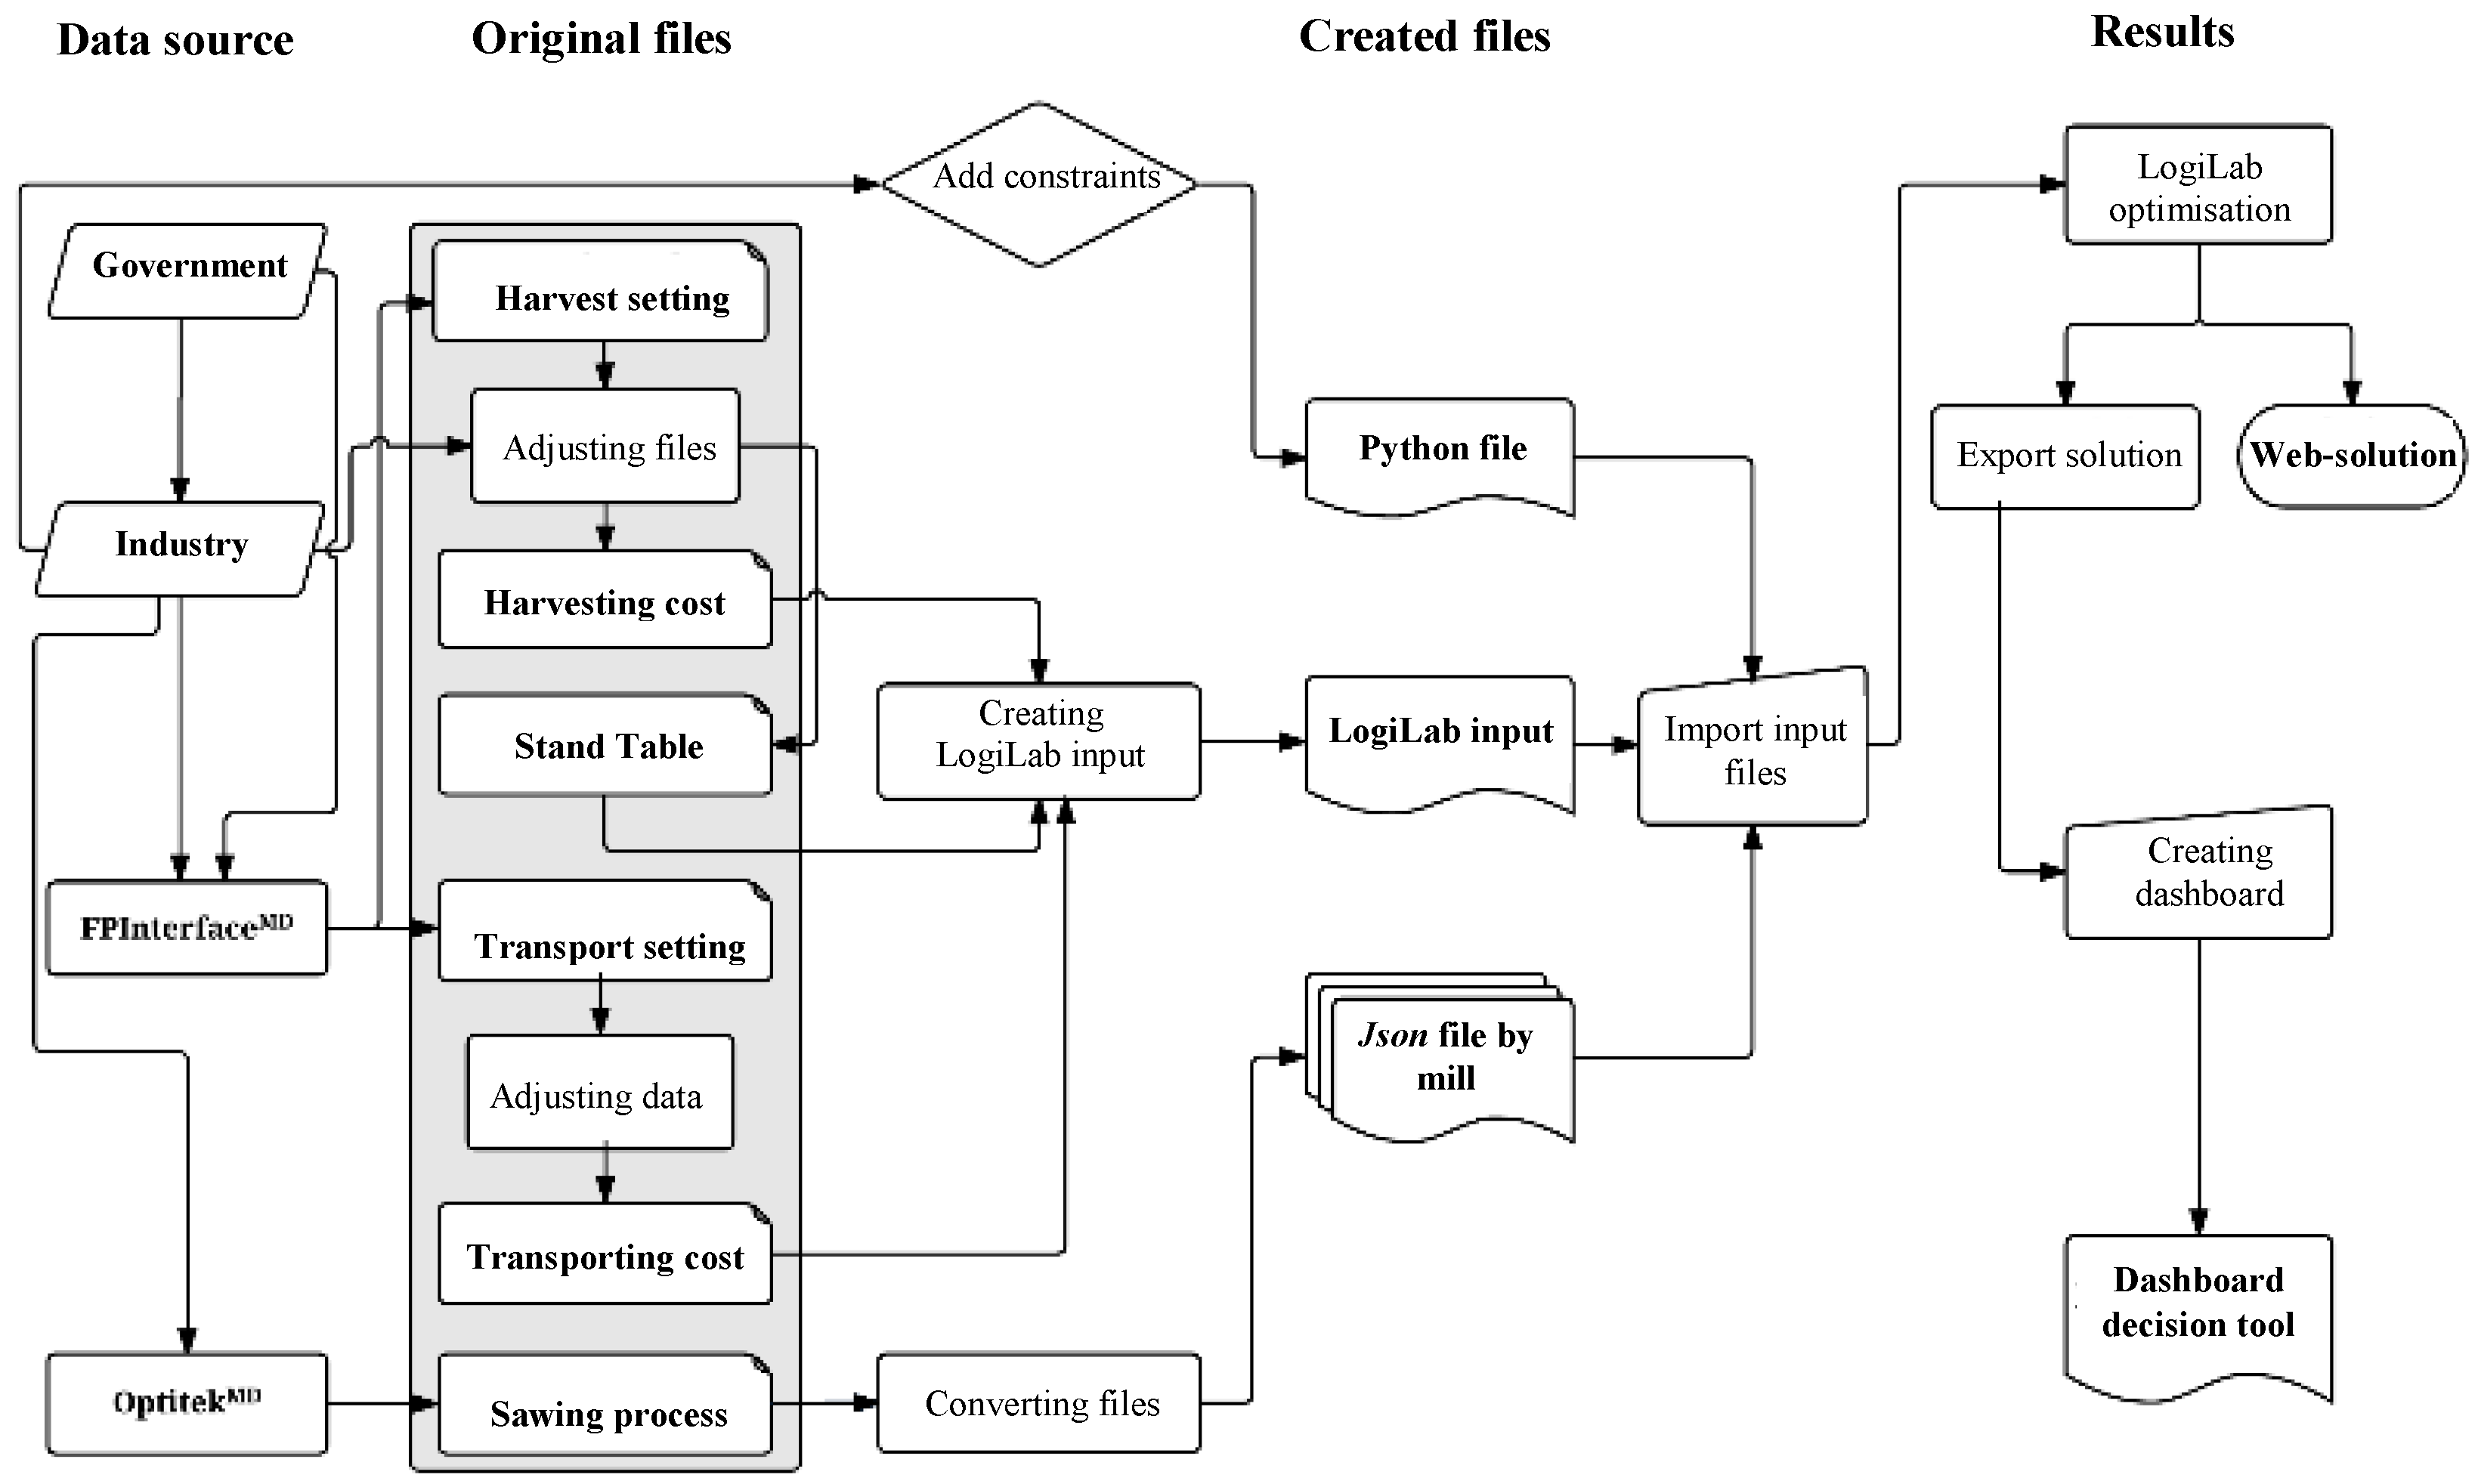
In addition, the company must establish a few parameters applicable to the model (for example, fuel cost adjustments, harvested areas positioning, and type of harvesting). Once optimization is completed, a summary of results can be seen in the LogiLab web interface. It is also possible to export a detailed solution file in Excel, which permits the generation of tables and graphs to make results analysis easier. The
Figure 1 flowchart lays out the various steps and files needed to create the model and visualize results.
The estimation of revenue generated via completed product sales was made possible using Optitek
TM, a software developed by FPInnovations. For each network mill, Optitek
TM simulated products generated for each log that entered the mill according to the current configuration of saw lines and log characteristics (for example, curvature, taper, and size). Quebec’s forest area is divided into 191 stumpage zones to reflect the market value of standing forest for each cubic meter (m
3). This value reflects market conditions and is adjusted every three months [
25]. Harvesting area data for company planning were produced using ten-year inventories from the
Ministère des Forêts, de la Faune et des Parcs [government] (MFFP). Data were then processed using the FPInterface
TM aggregation tool (a complementary FPInterface
TM module) to create harvesting blocks that work as procurement points to allocate wood to each mill.
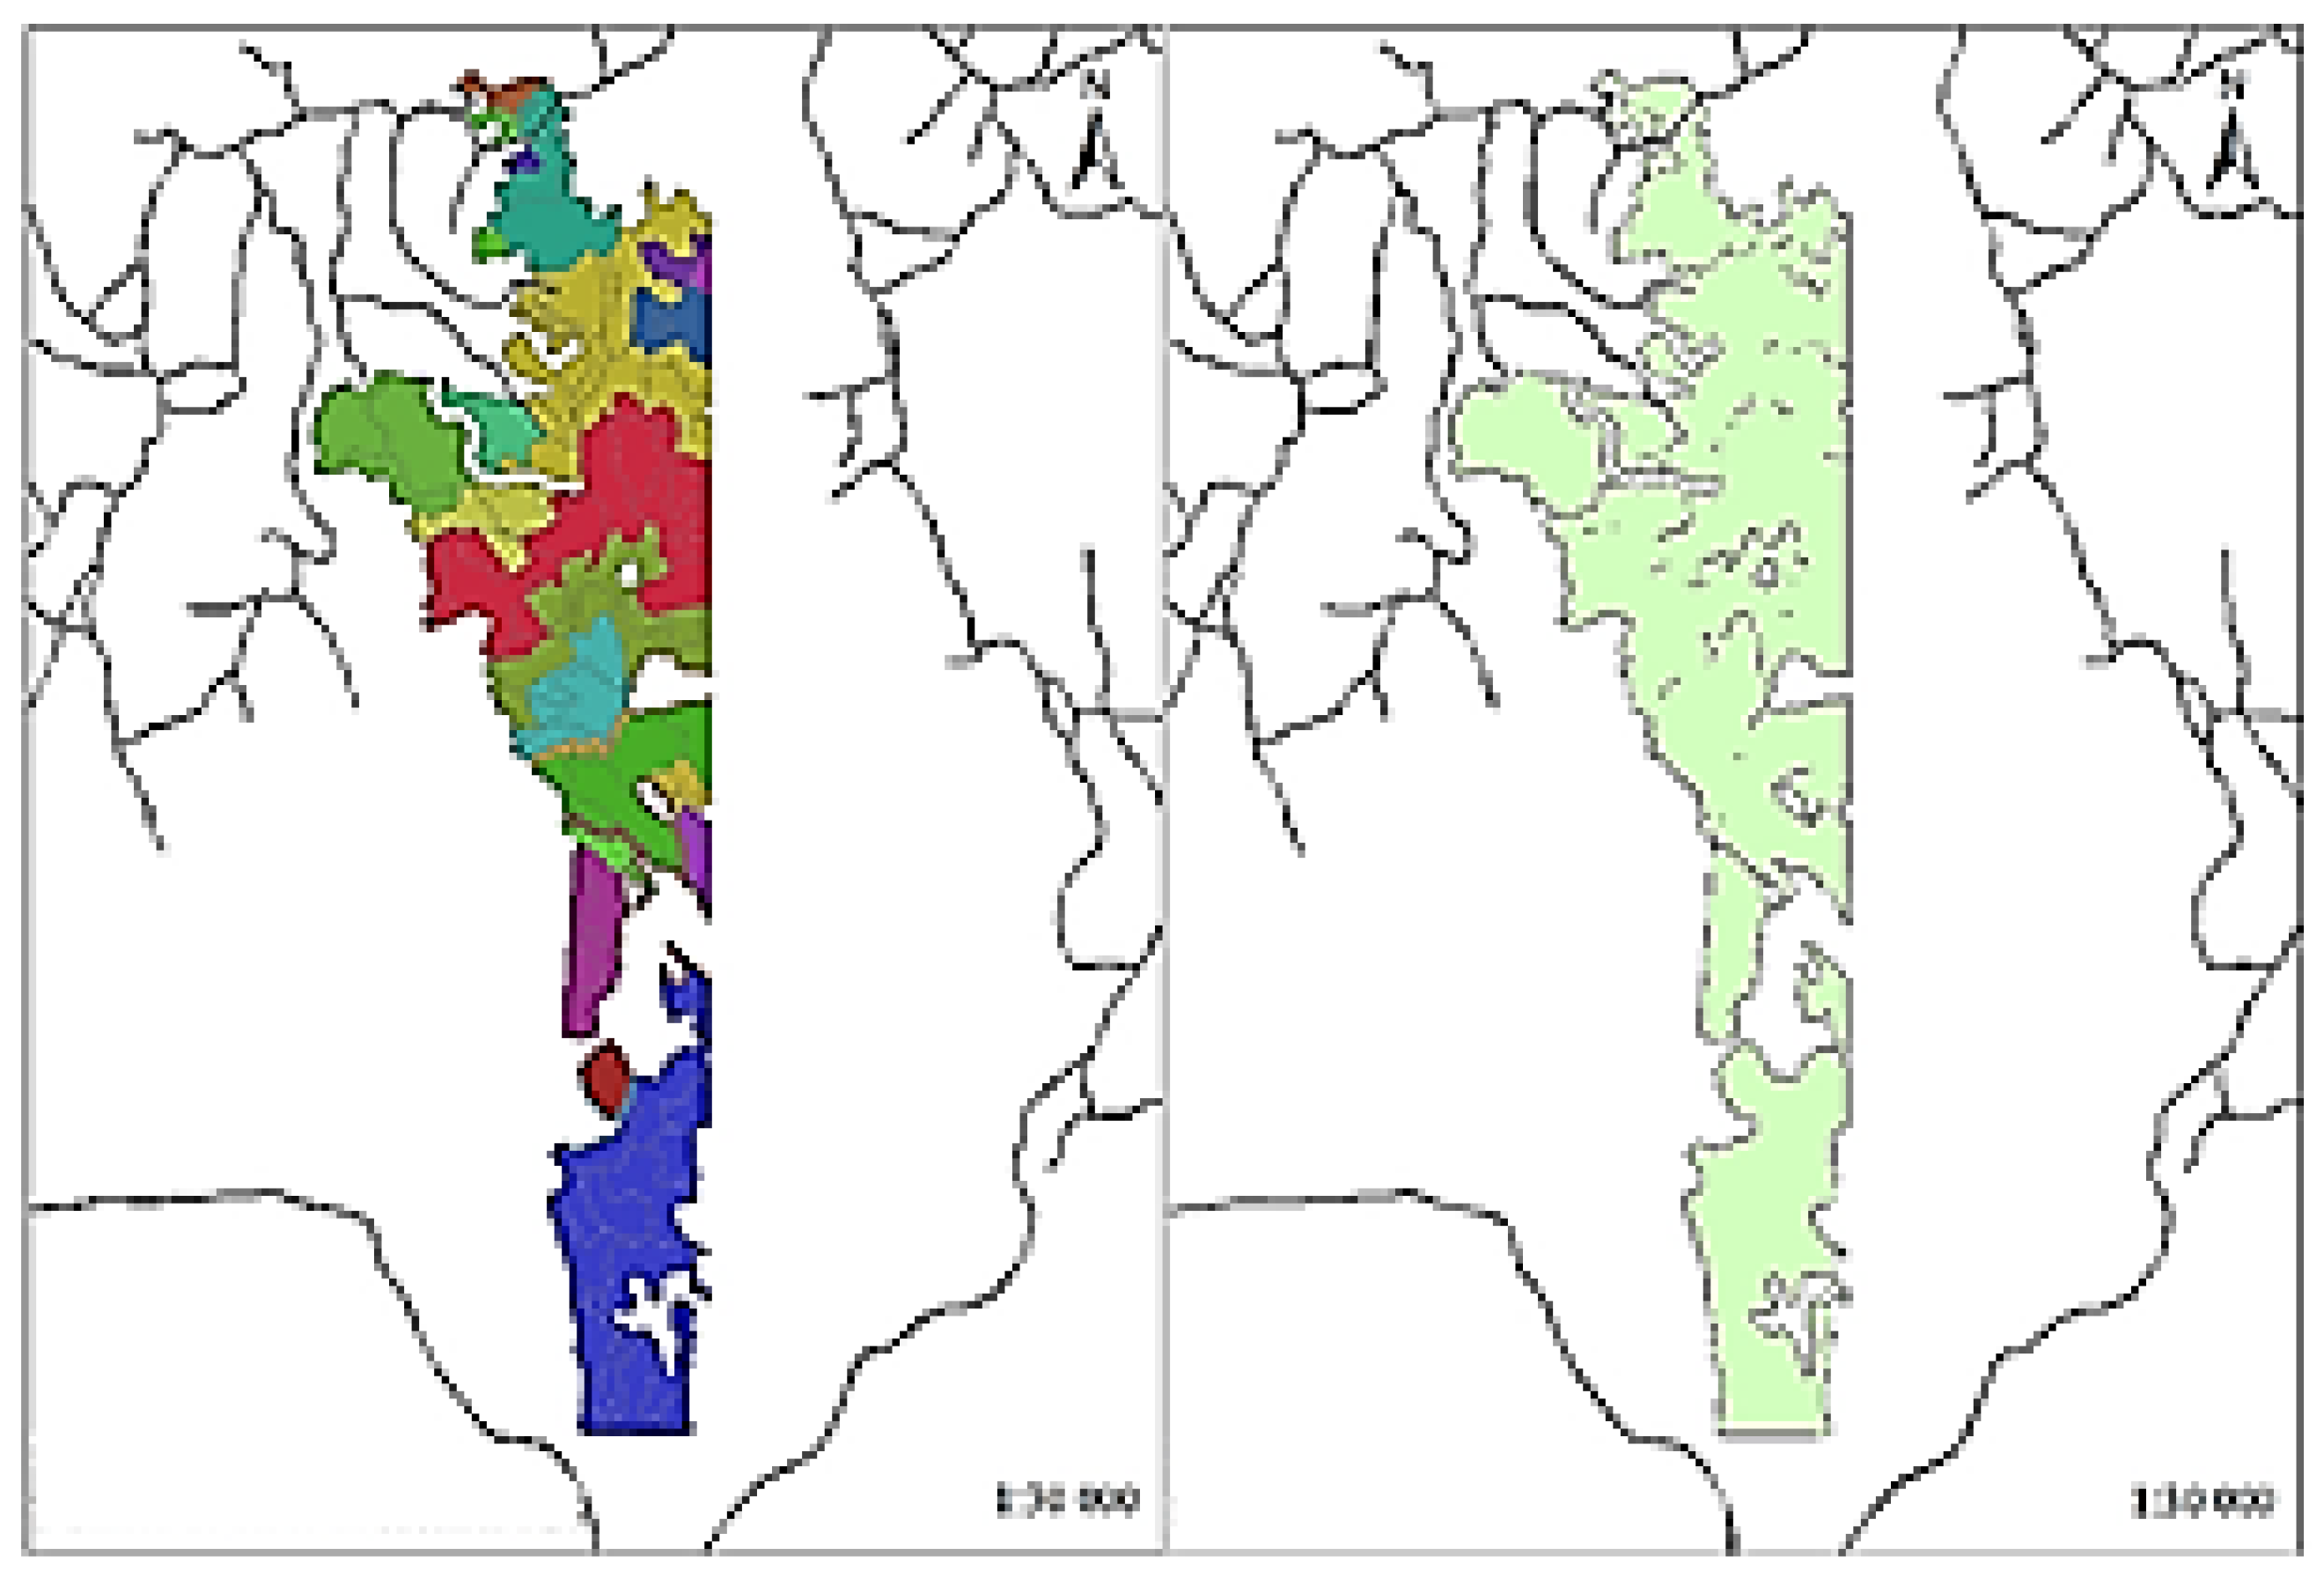
Figure 2 shows an example of harvesting blocks created by aggregating polygons in shapefile by attribute. A total of 66 blocks were created. Each harvesting block became a grouping of spatially dispersed harvesting areas.
Managers were questioned about their specific tasks so as to integrate the new optimization process into their current company planning process. Based on the answers received, we created a diagram that summarized the planning process, which was validated by the partner company. Planning steps, task descriptions for each staff member, hours spent on each task, software programs used for the process, and the approximate cost of developing a plan were laid out. We pinpointed various alternative and realistic scenarios in collaboration with planners.
Seven scenarios were generated in total: four optimized scenarios, a manual scenario, and two scenarios with adjusted inventory data. The latter two scenarios assessed the impact of imprecision of data on manual and optimal plans.
Table 2 shows the list of scenarios and the comparisons performed.
The “optimal baseline” (S1) plan was the closest to the current process in the partner’s company. It was the reference point for comparison to other scenarios.
The optimal scenario with “modified piles” (S2) compares the impact of sorting logs based on diameter instead of species. Piles tested in this scenario were (i) a pile of fir trees (all sizes), (ii) a pile of spruce and jack pine of small diameter (<16 cm), and (iii) a pile of spruce and jack pine of large diameter (≥16 cm).
The optimal scenario with “set bucking” (S3) requires each block to be harvested with a 500 cm (16’) length, regardless of destination. This scenario makes comparison with the reference scenario possible because two bucking lengths (500 and 560 cm) are allowed depending on the destination.
The “combined” optimal scenario (S4) uses pile sorting depending on diameter, species, and 500 cm bucking length.
The “manual” plan (S6) is where allocation decisions are made by planners without optimization.
Both scenarios with “adjusted inventory” (S5 and S7) consider actual data (exact values) of inventories that were measured and cross-referenced at the mill (available for some of the harvested blocks).
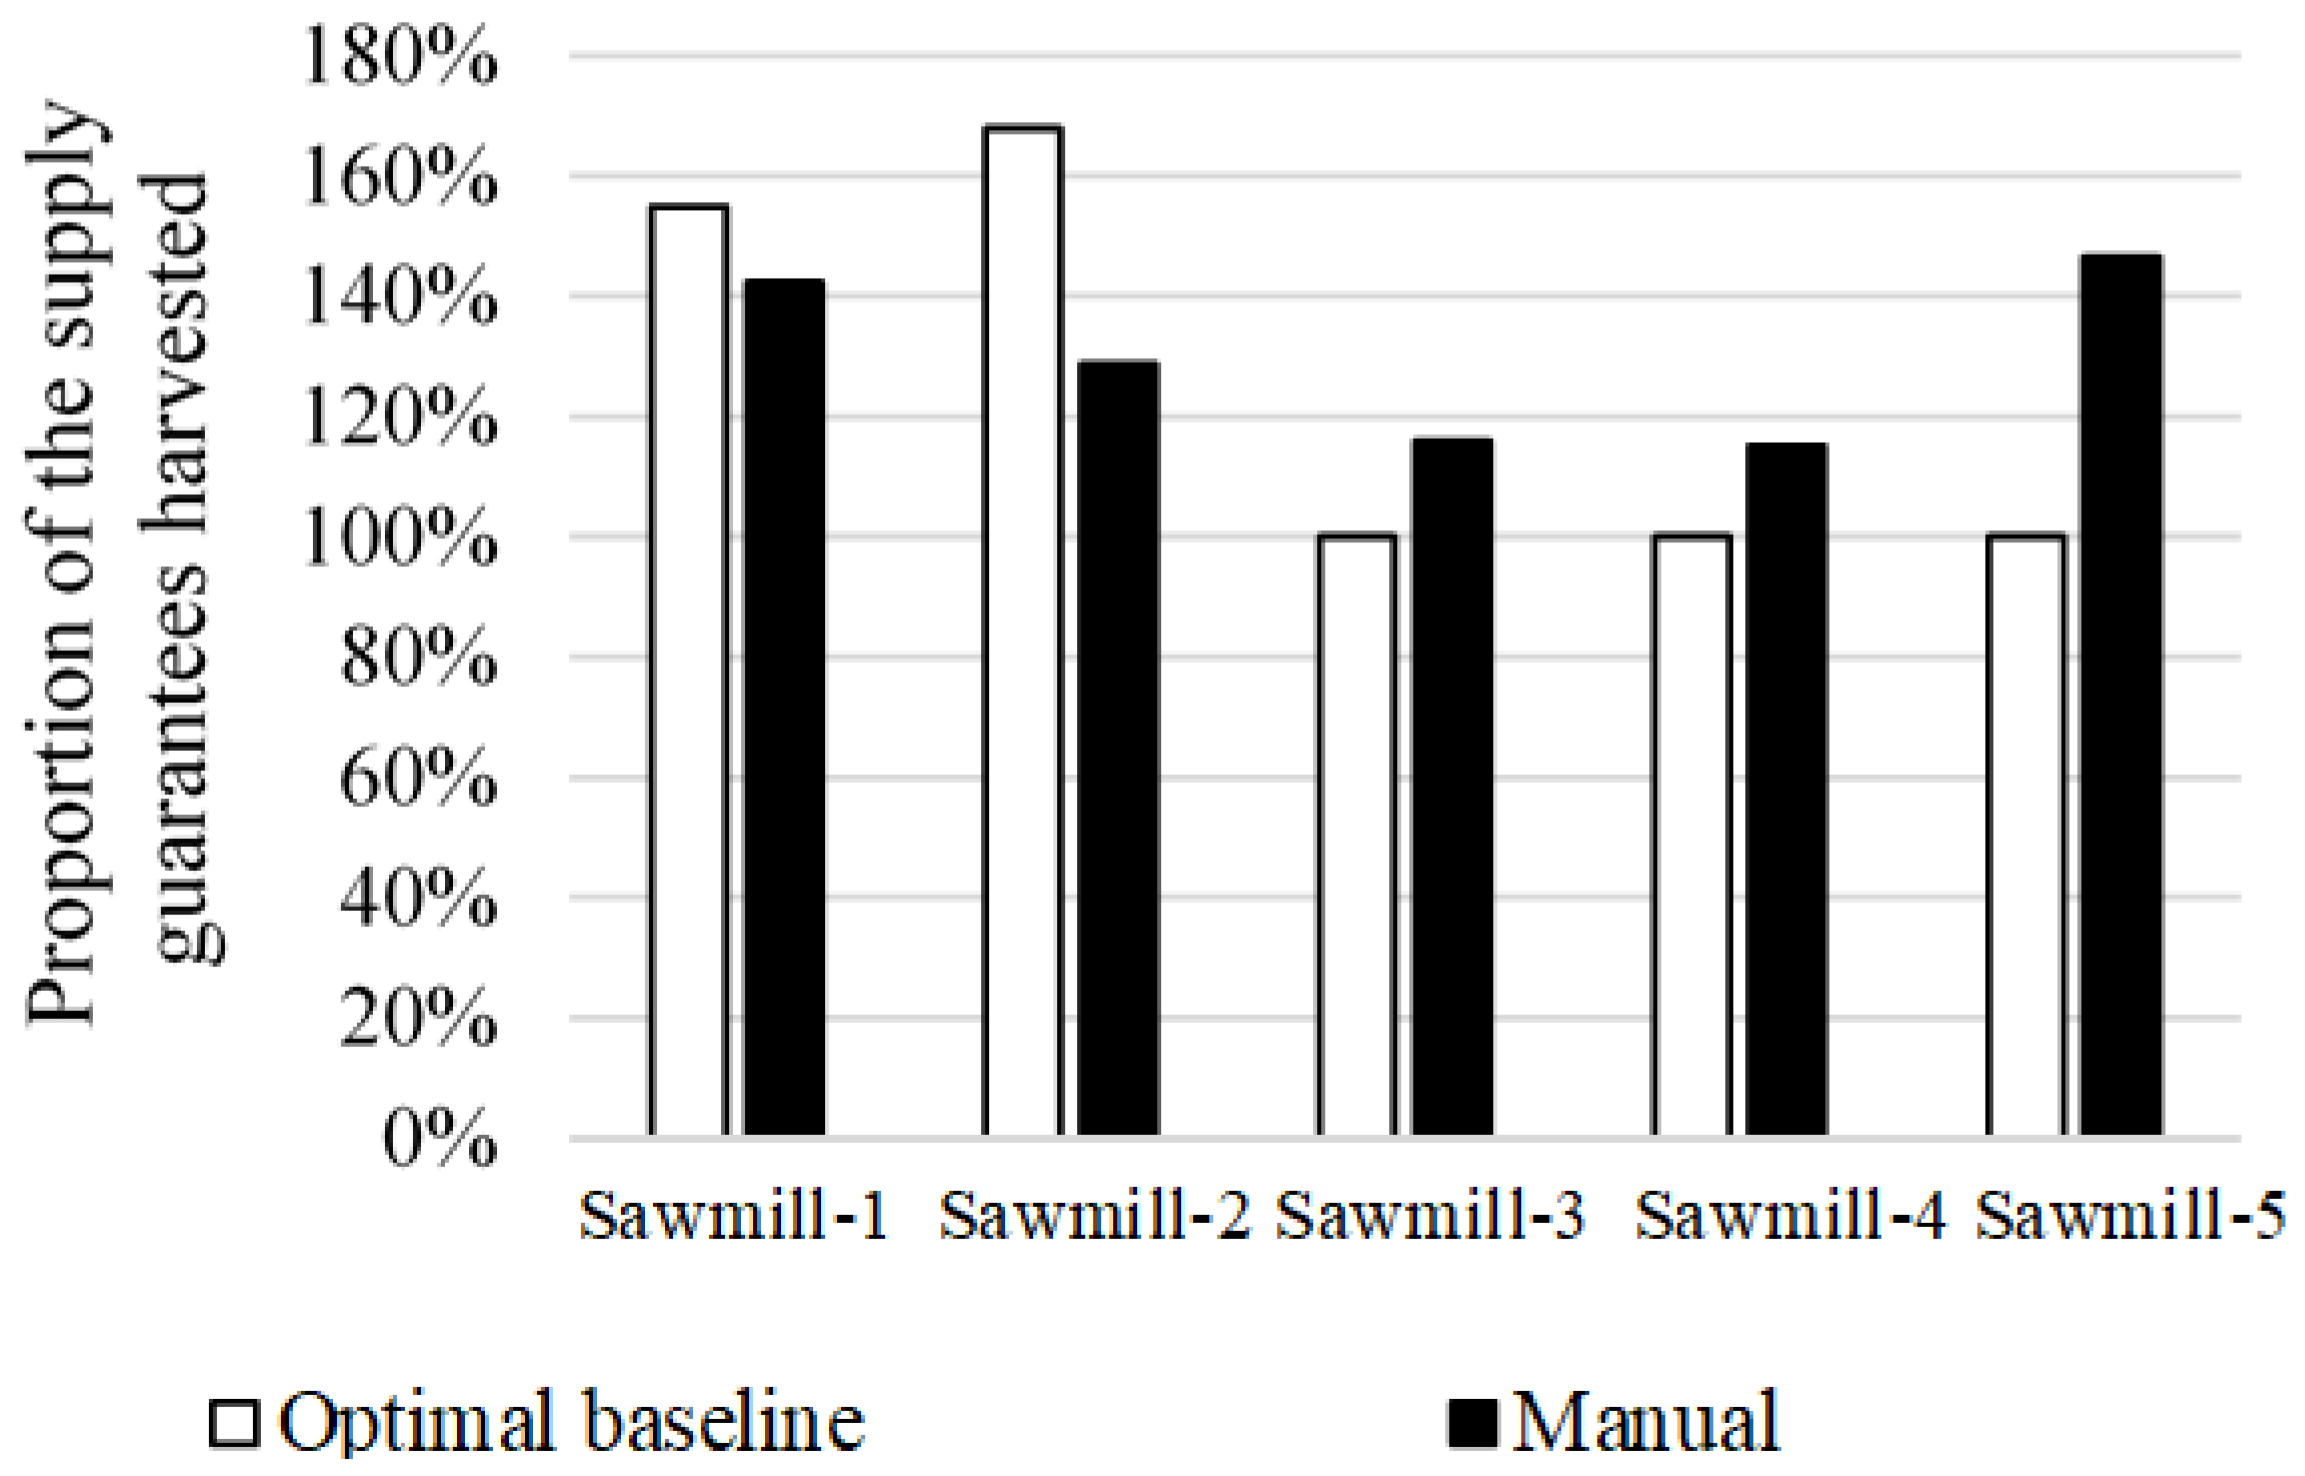
Lastly, in order to obtain comparable and realistic scenarios, we constrained the optimization model to at least meet the volume allocation specified on the company timber supply guarantee (TSG). This is to ensure each mill received at least 100% of its contracted wood supply. We also used a constraint to ensure optimal scenarios harvested the exact volume anticipated in the manual planning of the network, which was nearly 130% of all TSGs. The extra volume is usually obtained from an auction system managed by a state agency.
4. Results
4.1. Required Resources
Industry has the authority to act on a limited number of steps in the public forest planning process, as other steps are controlled by other agents. We identified seven main steps to describe the planning process:
Timber supply allocations (chief forester)
Choice of areas of interest (operational joint committee)
Volume available from auctions (Bureau de mise en marché des bois-BMMB)
Development of the individual annual programming process (IAPP) by timber supply (TS) beneficiaries
Sharing of individual annual programming processes (IAPP)
Submission of the IAPP to BMMB
Adaptation of harmonization measures if required
Of the seven steps, industry can provide input only on the fourth and seventh; thus, we proposed optimization for these two steps. The cost of the company’s manual plan was calculated using the hours needed per employee category for the development of each process step, and their average pay scale; necessary resources such as material and software were also considered. The process map (
Figure 1) and interviews with company personnel allowed us to estimate labor time and cost.
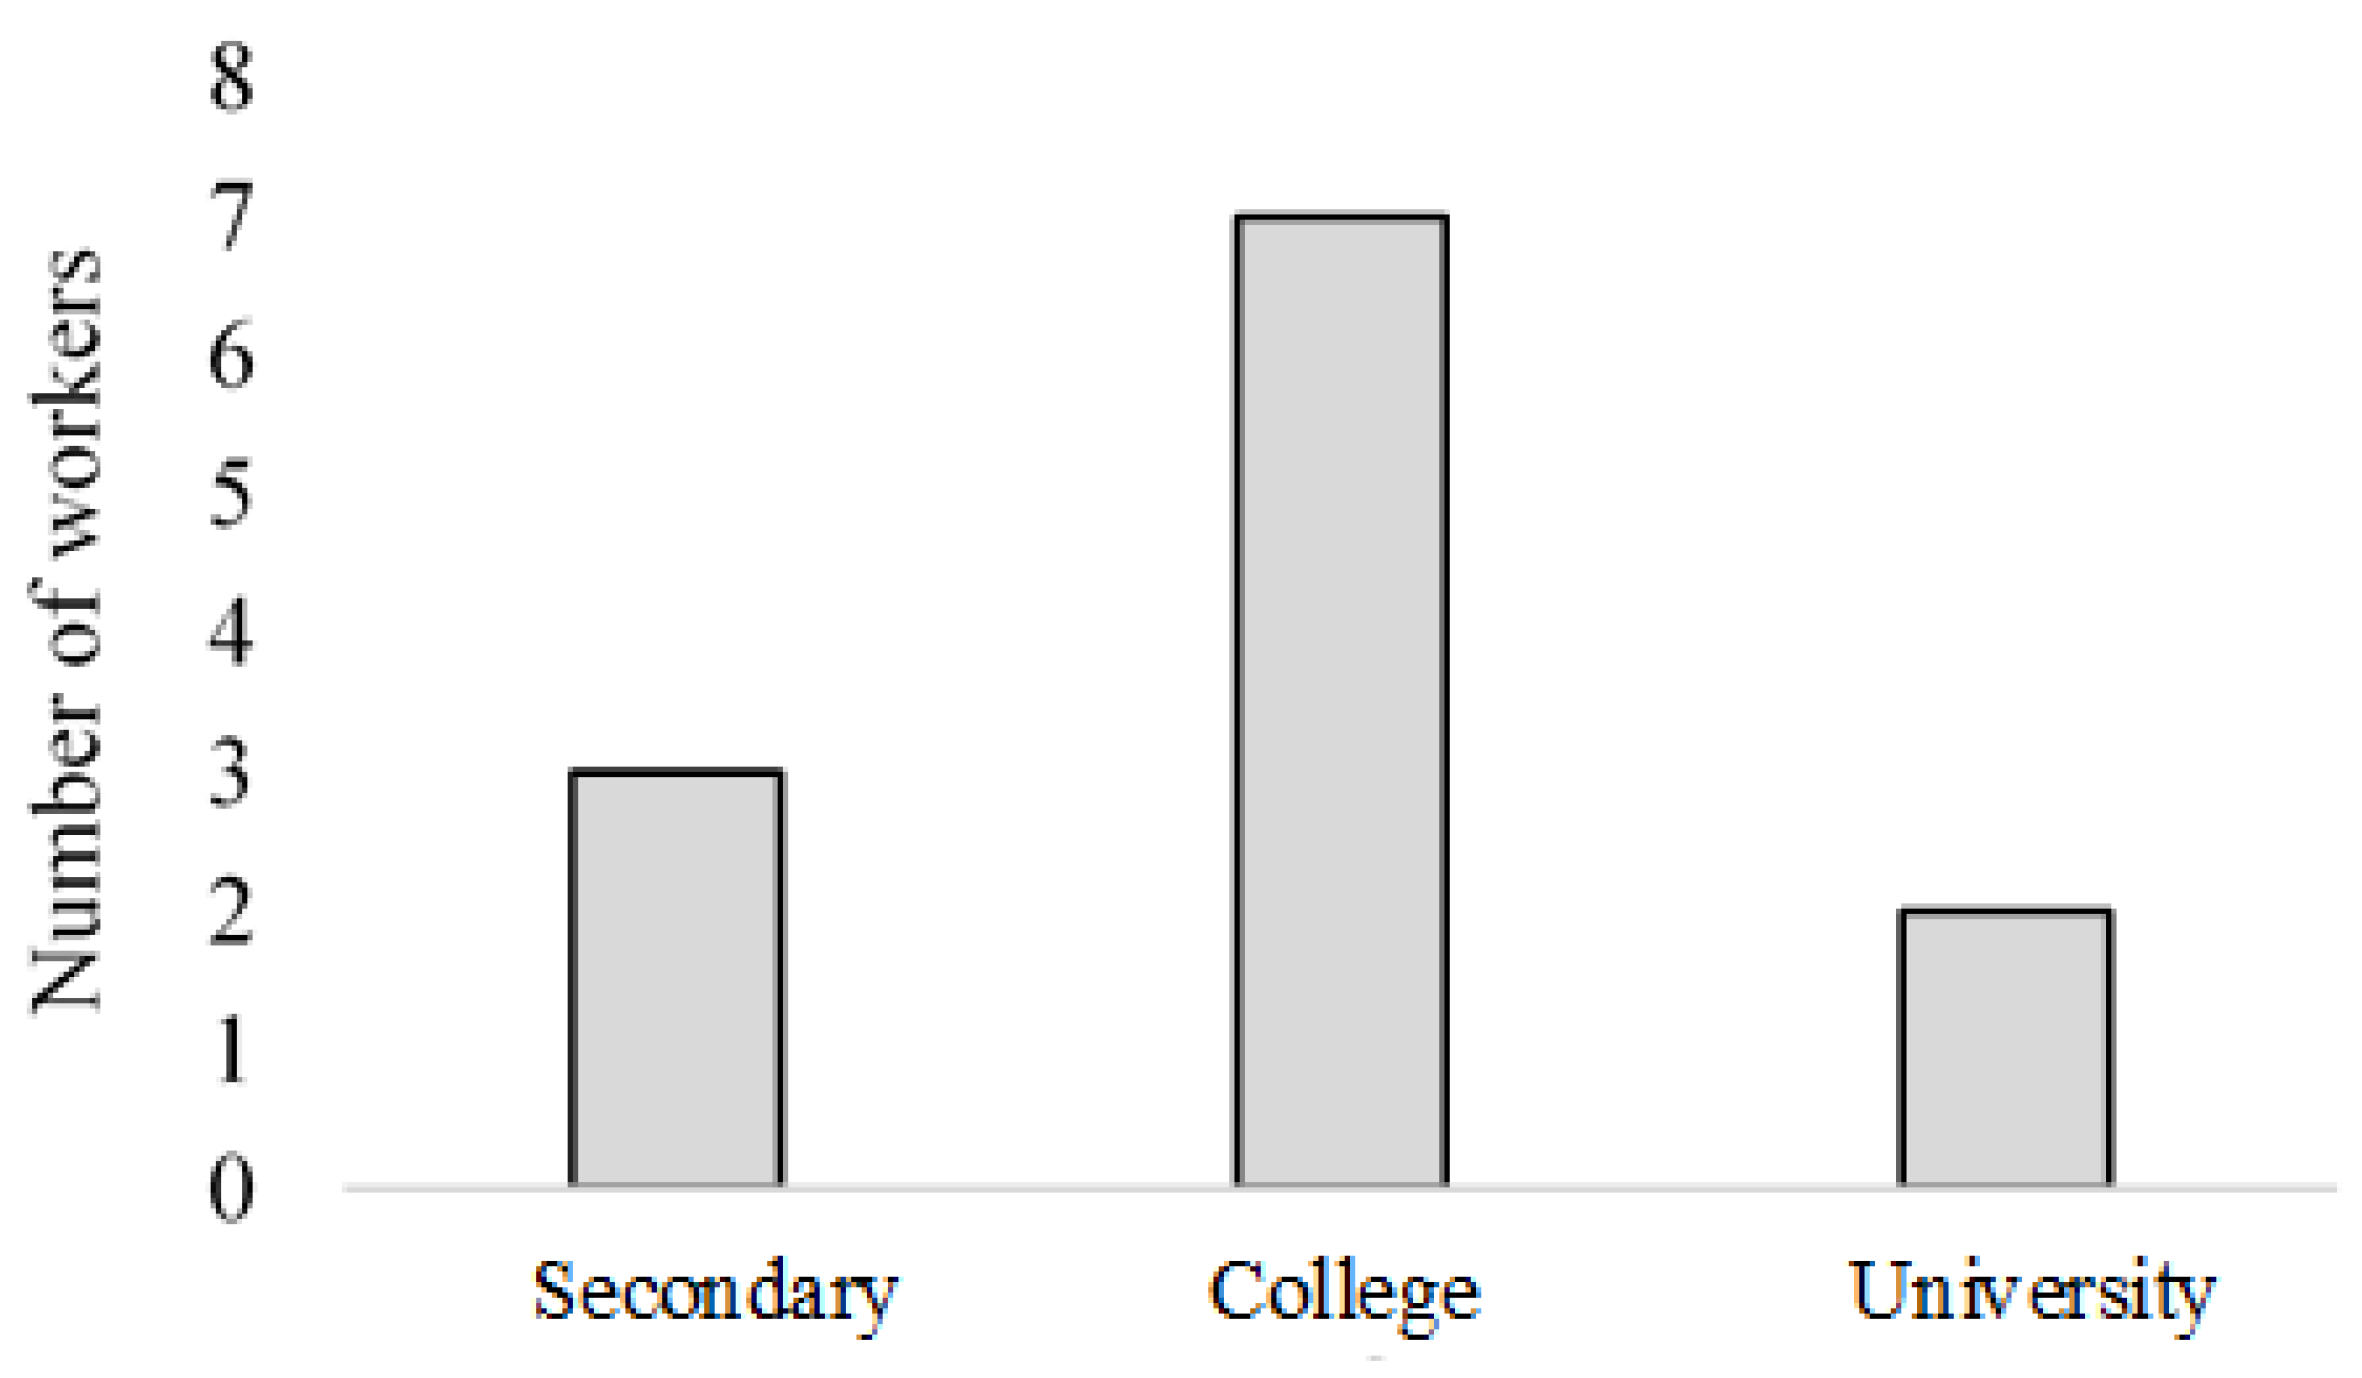
As shown in
Figure 3, 12 workers were involved, most of whom had a college degree. In total, between 56 and 128 workdays (eight hours per day) were needed for planning, amounting to an estimated cost between CAD 23,873 and CAD 30,918. The equipment needed for plan development included the use of many computerized tools, including Microsoft Excel, ArcGIS, SyGif_GT/
integrated model in ArcMap, Microsoft Word, and Microsoft Access. Costs connected to the use of these software programs were not calculated in the plan production cost because the company uses most of these computerized tools daily.
The initial optimal plan development in LogiLab includes the creation of input files. Once files have been imported into LogiLab, the problem is set, and optimization can be run. Generally, the resolution time for scenarios included in our optimization model was no more than 15 min. The creation and analysis of scenarios via LogiLab required a professional who had a bachelor’s degree in forestry, which corresponds to university-level training. Time required to generate an optimal planning scenario with LogiLab, create an input file, and incorporate a detailed solution in the control panel was estimated at a day and a half by a process expert. This cost was estimated at CAD 1119 for the first year and was cut by half in the following years. Through the incorporation of optimization in the planning process within the company, we estimated that the time currently used for planning would be minimally cut in half, amounting to an average savings of over CAD 13,698.
In addition, this process required the use of many computerized tools and software programs such as FPInterface
TM and Optitek
TM developed by FPInnovations, ArcGis, and CPLEX. According to Volpé [
26], the FPInterface
TM license cost CAD 3500 in addition to the annual subscription of CAD 1150. The CPLEX license was estimated at CAD 3573. The cost of Optitek
TM was not included in the planning process because it is already in use by the partner company. Savings of CAD 4355 were possible as of the first year of optimal planning implementation within the company (
Table 3). In the following years, savings were CAD 8415.
The current manual planning process requires more total time than the optimized planning process. Thus, we estimate that it would be more profitable to adopt the optimized process with LogiLab as soon as it is deployed. Investments in workforce training would be necessary in order to make the leap from the manual plan to the optimal plan and to master specific aspects of LogiLab. However, these investments should be negligible, given current workers’ qualifications. Since basic software such as ArcGis and Microsoft Excel are already used in the current manual planning process, it is possible to choose the optimal planning process with little effort.
4.2. Using Initial Inventory Data
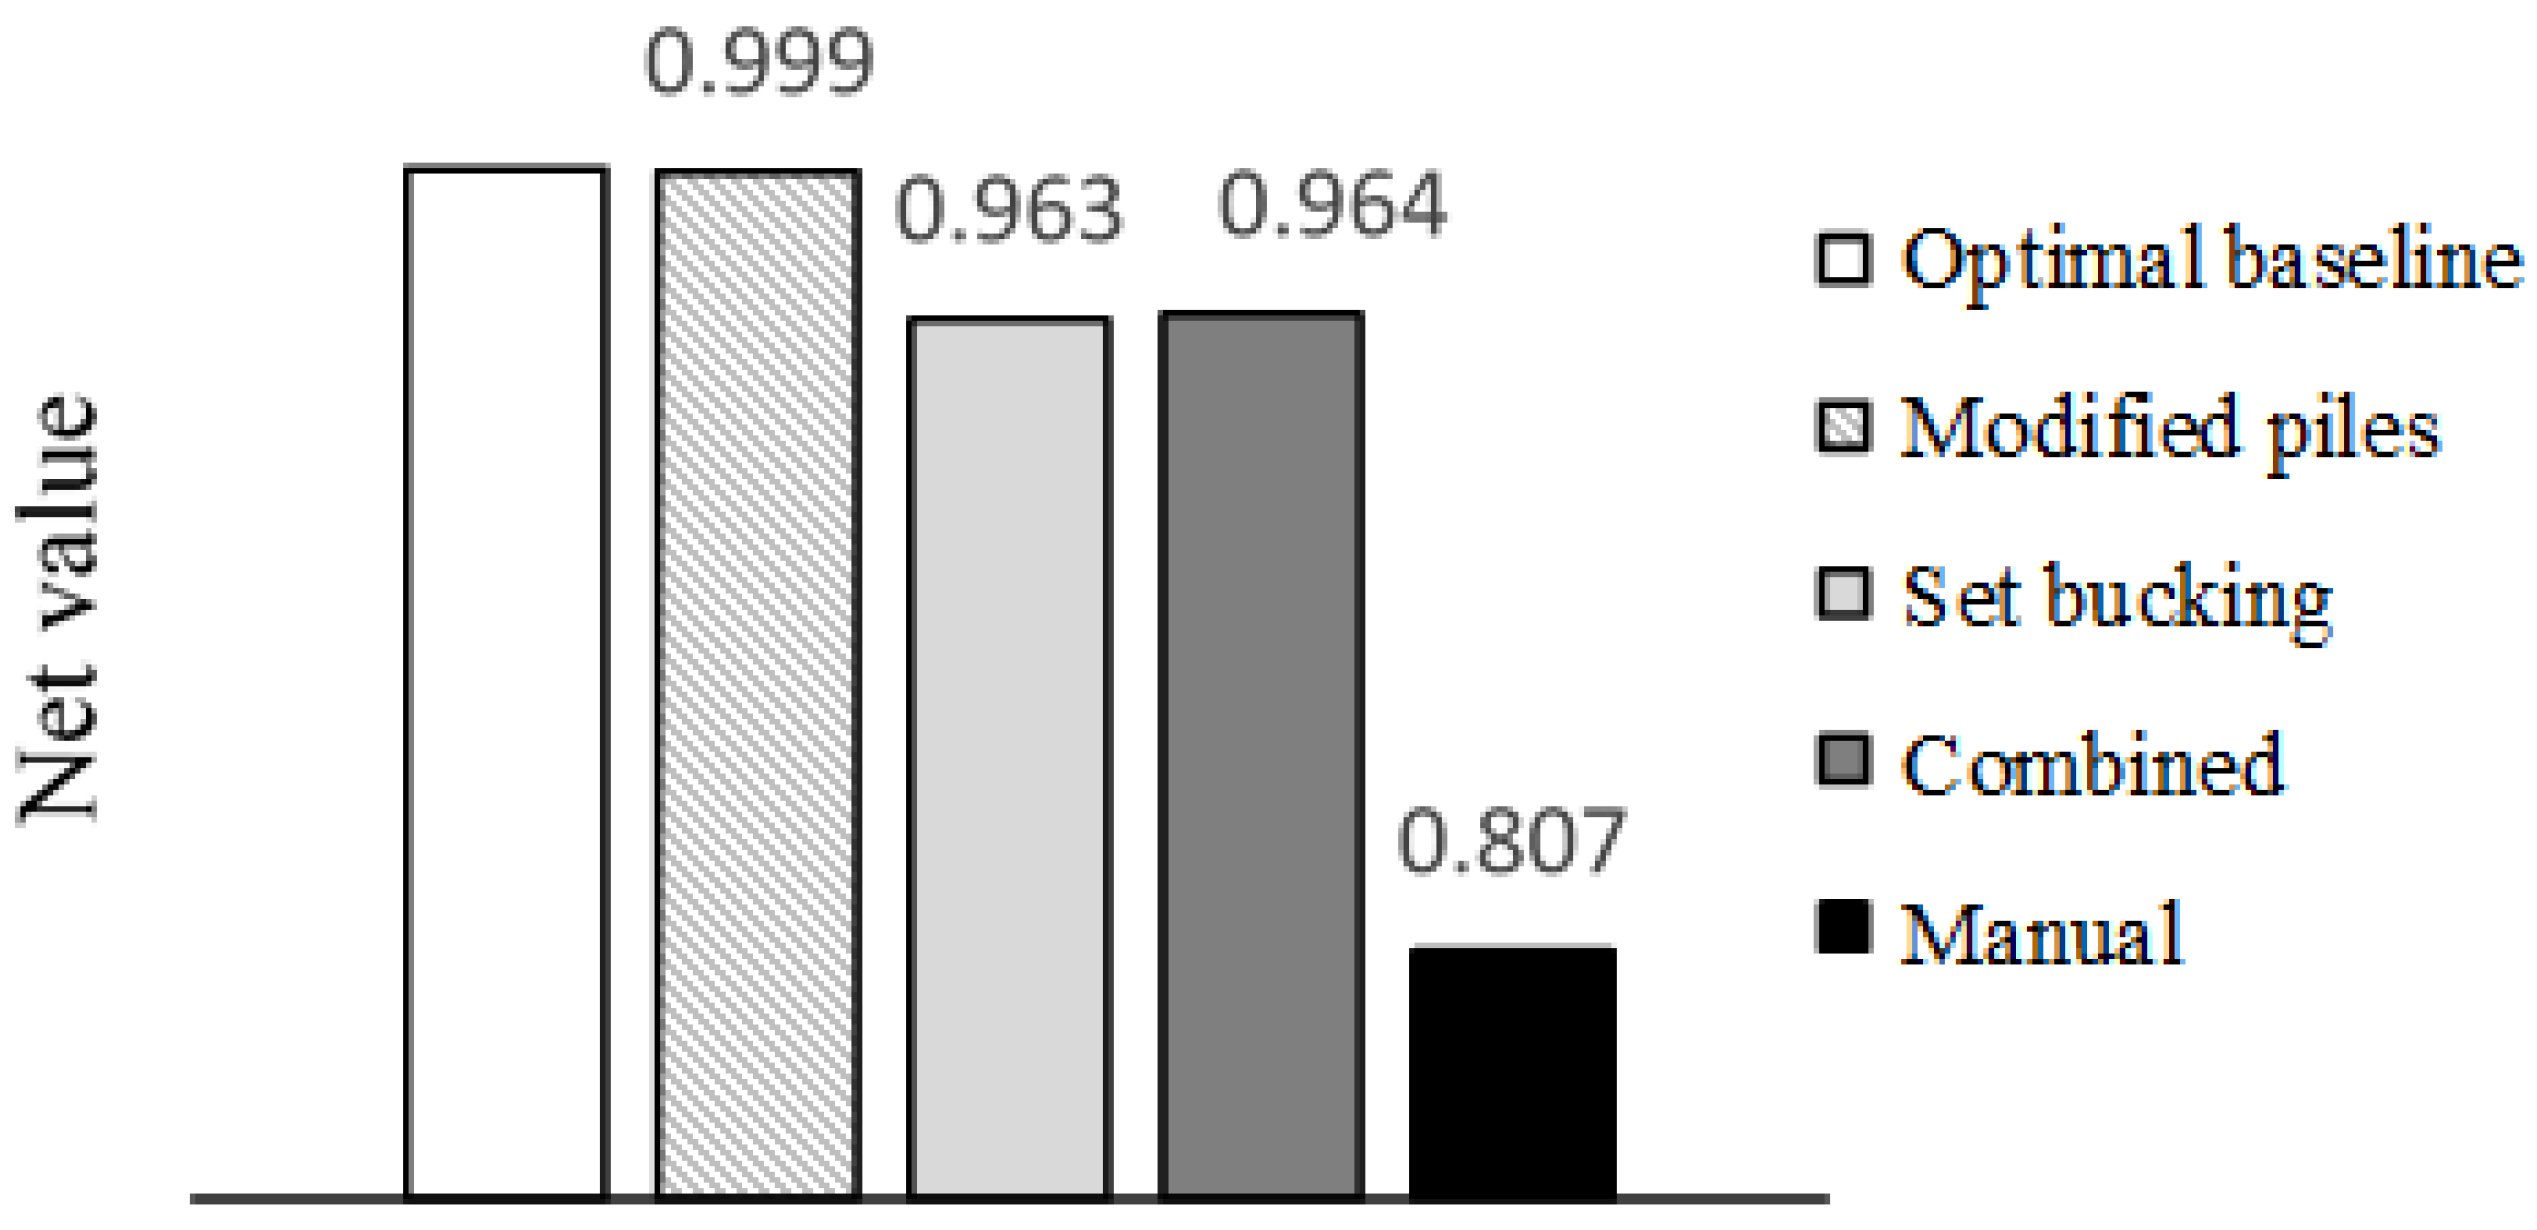
The optimal reference plan adapted for the case study is the plan with the highest net value, followed closely by the optimal plan with modified pile constraints, as shown in
Figure 4. The manual plan has the lowest net value with a 19.26% difference as opposed to the optimal plan of reference with a difference of approximately CAD 9 M. Other monetary values are presented in variation in relation to the optimal scenario (net value was set at 1.000) because of confidentiality.
In the manual plan, forecast revenues for sawing products are the lowest, whereas revenues for by-products are the highest (
Table 4). The highest revenues for sawing products are provided by the optimal plan with modified pile constraints; the lowest by-product revenues are related to the optimal plan of reference.
Though the manual method attempts to lessen expenses associated with transportation distances, it has the highest transportation costs, amounting to 1.7% more than transportation costs in the optimal plan of reference. With respect to production costs, the same trend is observed: the highest costs are generated by the manual plan, with 2.7% more than the lowest production costs in the optimal plan of reference (see
Table 4).
The analysis shows little variation among the optimal plan scenarios. The optimal plan of reference is well adapted to the company’s current operations; that scenario generates the greatest benefits. This result originates essentially from a drop in transportation and mill production costs. As with the optimal scenario with modified piles, the optimal scenario of reference is less restricted by product types allowed into the piles, enabling a more efficient allocation of products, more in line with transformation processes at the sawmills and travel distances. This is why the scenario with modified piles has a slightly lower net value even though it generated the highest lumber revenues.
When comparing the manual plan to other plans, we see a difference in costs, revenues, and net value generated as opposed to optimal scenarios that present more appealing results. In our analysis, revenues from by-products (e.g., chips, sawdust) have no benefit for the company; because the value of these by-products is lower than costs, they are generally sold at a loss.
The major difference between net values in the optimal reference scenario and the manual scenario is mainly the result of the allocation of harvest areas and volume depending on transformation performance at the sawmills. The more forest products (logs) shipped to sawmills have characteristics akin to the specific capacities of a given mill, the less they produce undesirable by-products and the more they produce high-value products (lumber), which has a direct impact on the net value generated by the mill.
Since the goal of this study is to maximize the network’s net value, the use of the optimization model allowed to send harvested volumes to the best-adapted sawmill, as a priority, to increase overall generated net value, all the while complying with imposed restrictions on minimum deliveries to each mill (
Figure 5).
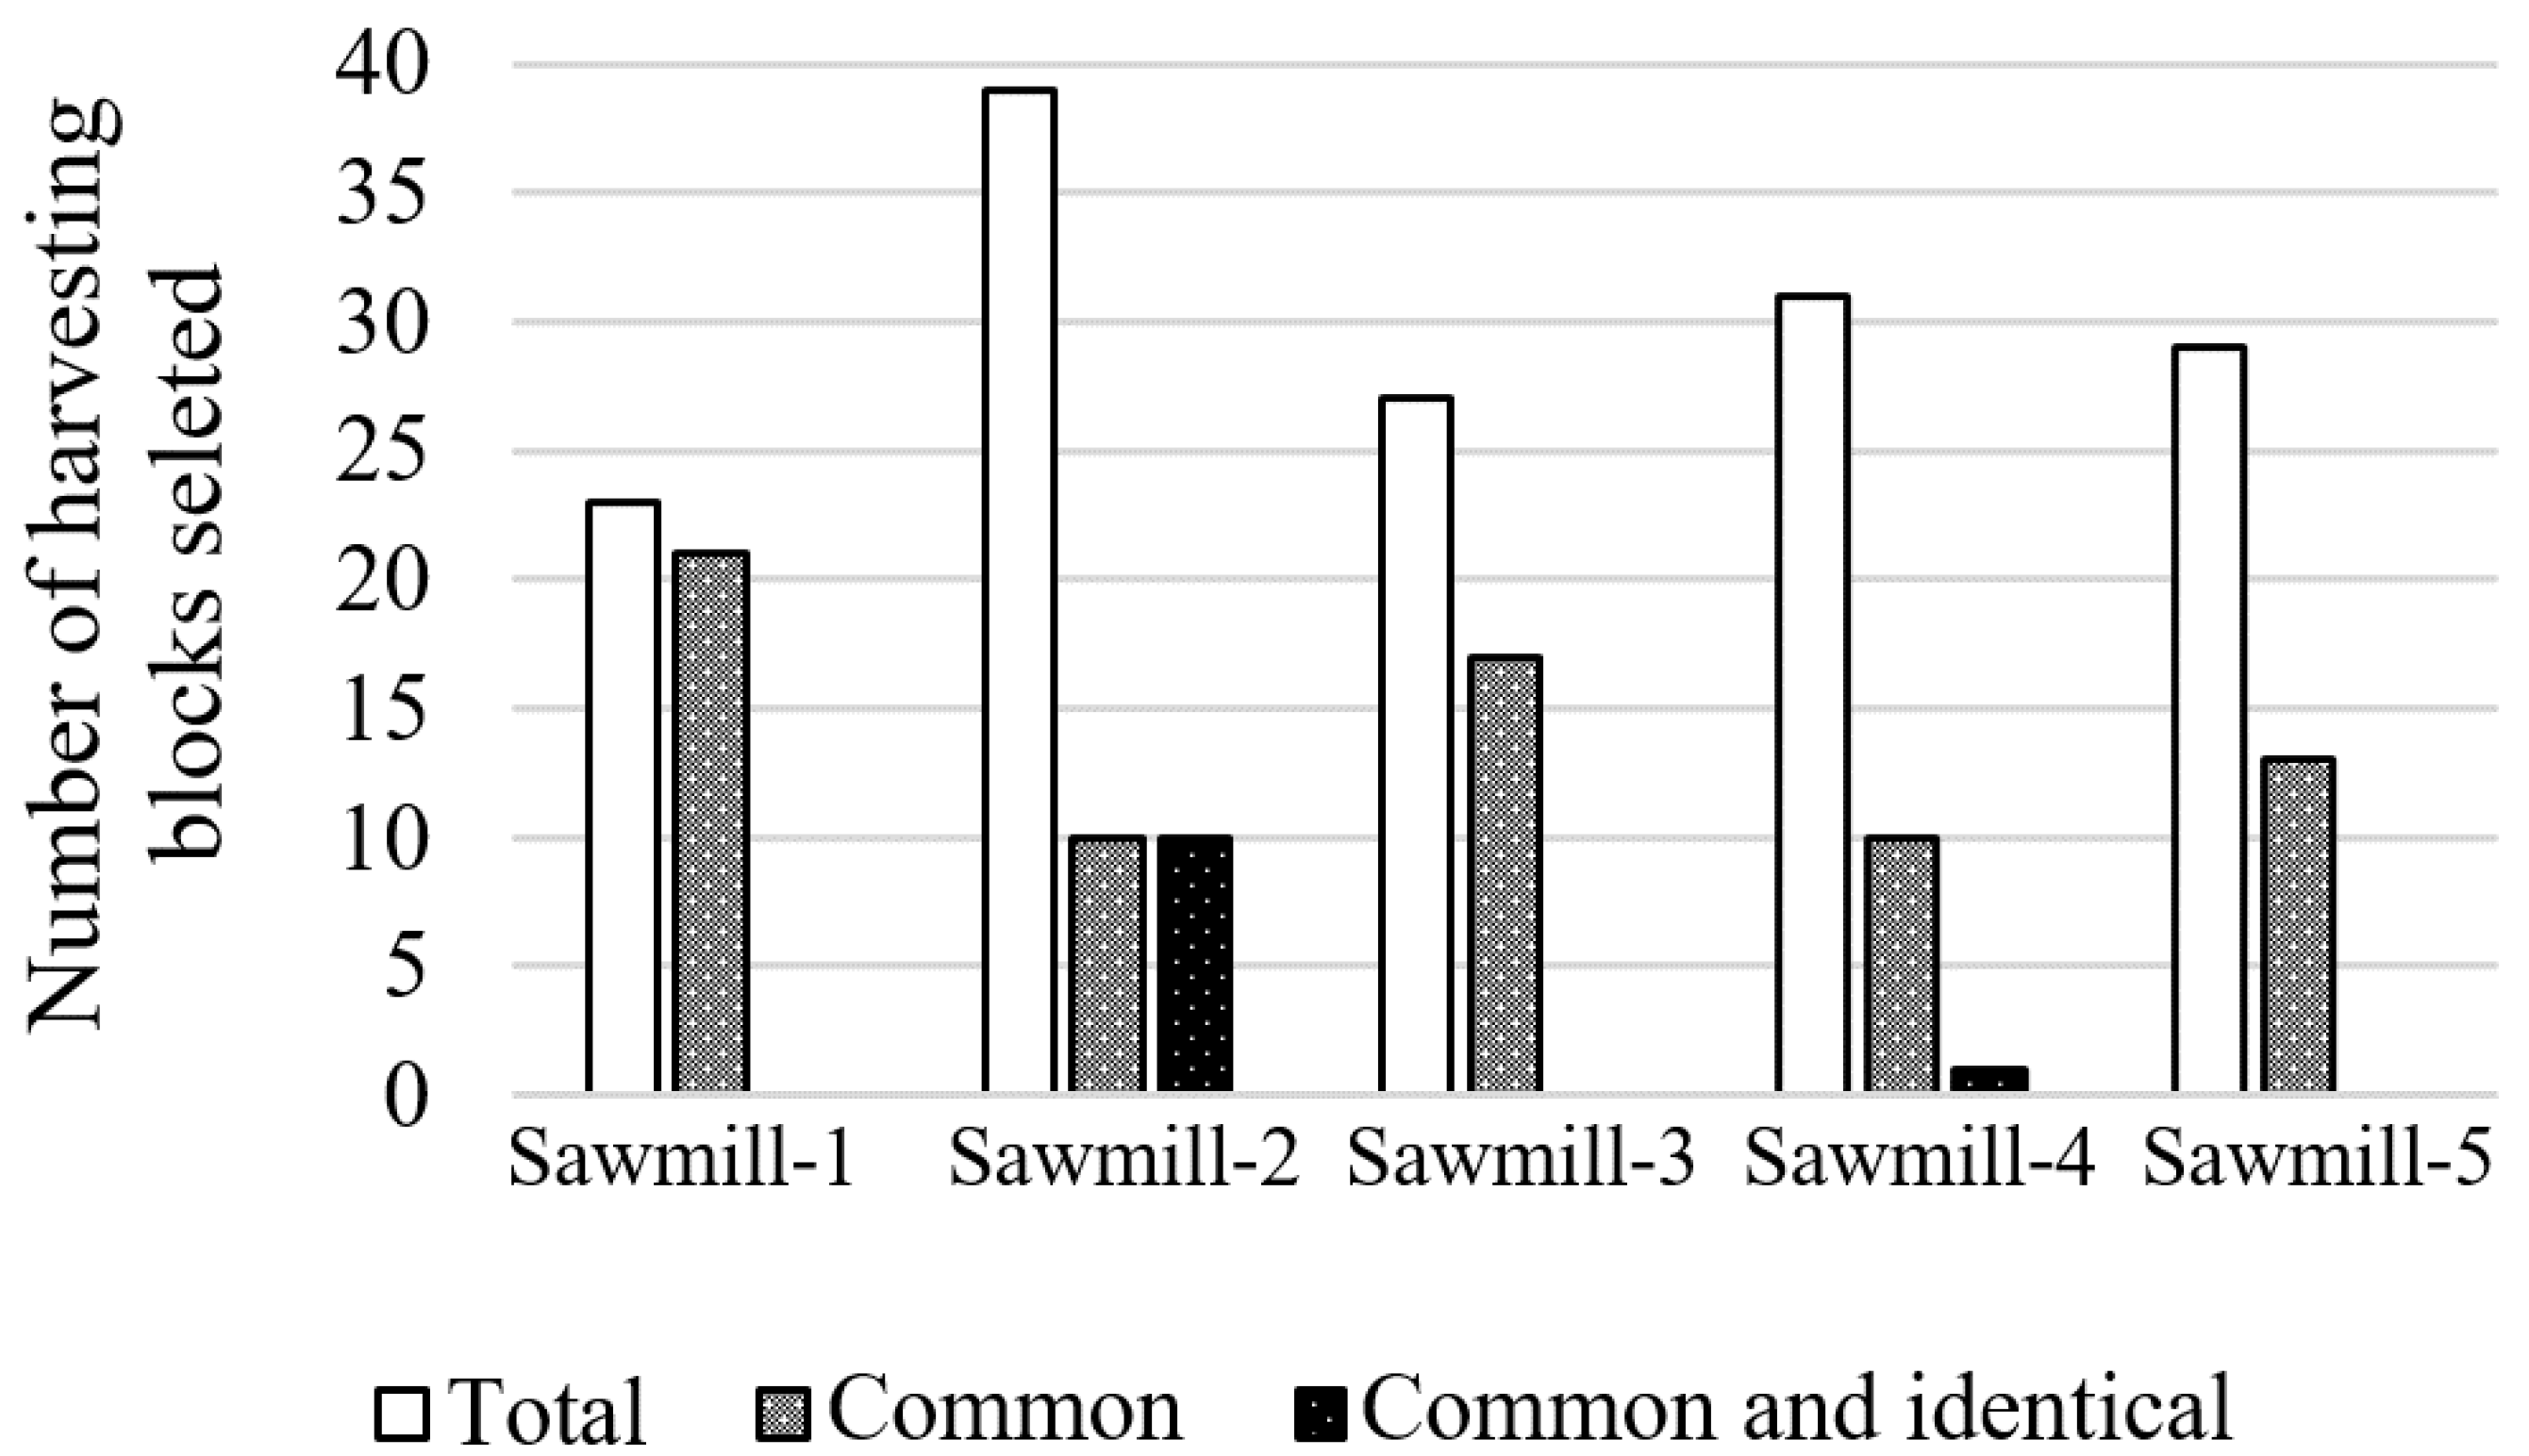
Comparing the allocation of expected harvest blocks to manual and optimal scenarios of reference, very few blocks were chosen and allocated the same among scenarios (
Figure 6). Both scenarios allocated only 11 harvest blocks (16%) the same way, i.e., the same blocks and same volume shipped to the same sawmills. In comparing the allocation of harvest blocks between the two scenarios, we see that:
91% of allocated harvest blocks to sawmill 1 were the same, though proportions were different among scenarios; none of the blocks were allocated the same way (shipped volume proportions/different blocks); 9% of allocated blocks were totally different;
26% of harvest blocks to sawmill 2 were the same; these blocks were allocated the same way among scenarios (74% were totally different);
63% of harvest blocks to sawmill 3 were the same, though proportions were different and no blocks were allocated the same way (37% were totally different);
32% of harvest blocks to sawmill 4 were the same, including only 3% that were allocated the same way (68% were totally different);
45% of harvest blocks to sawmill 5 were the same but in different proportions; none were allocated the same way (55% were totally different).
Allocating harvest areas to the sawmilling network is more profitable when optimization is used because the model considers transportation distances, transportation costs by mode, mill performance by imported forest products, capacity of mill processing, characteristics of raw material processed, value of generated finished products, and processing costs per mill and product. Manual planning is limited to matters related to transportation costs and uses approximations to guide mill process performance.
Our results confirmed that decisions made by the company concerning log classes in the forest were appropriate, as benefits were higher when piles no longer had to be sorted by diameter but only by species for all areas and when 560 cm logs were allowed to be produced.
4.3. Using Verified Inventory Data
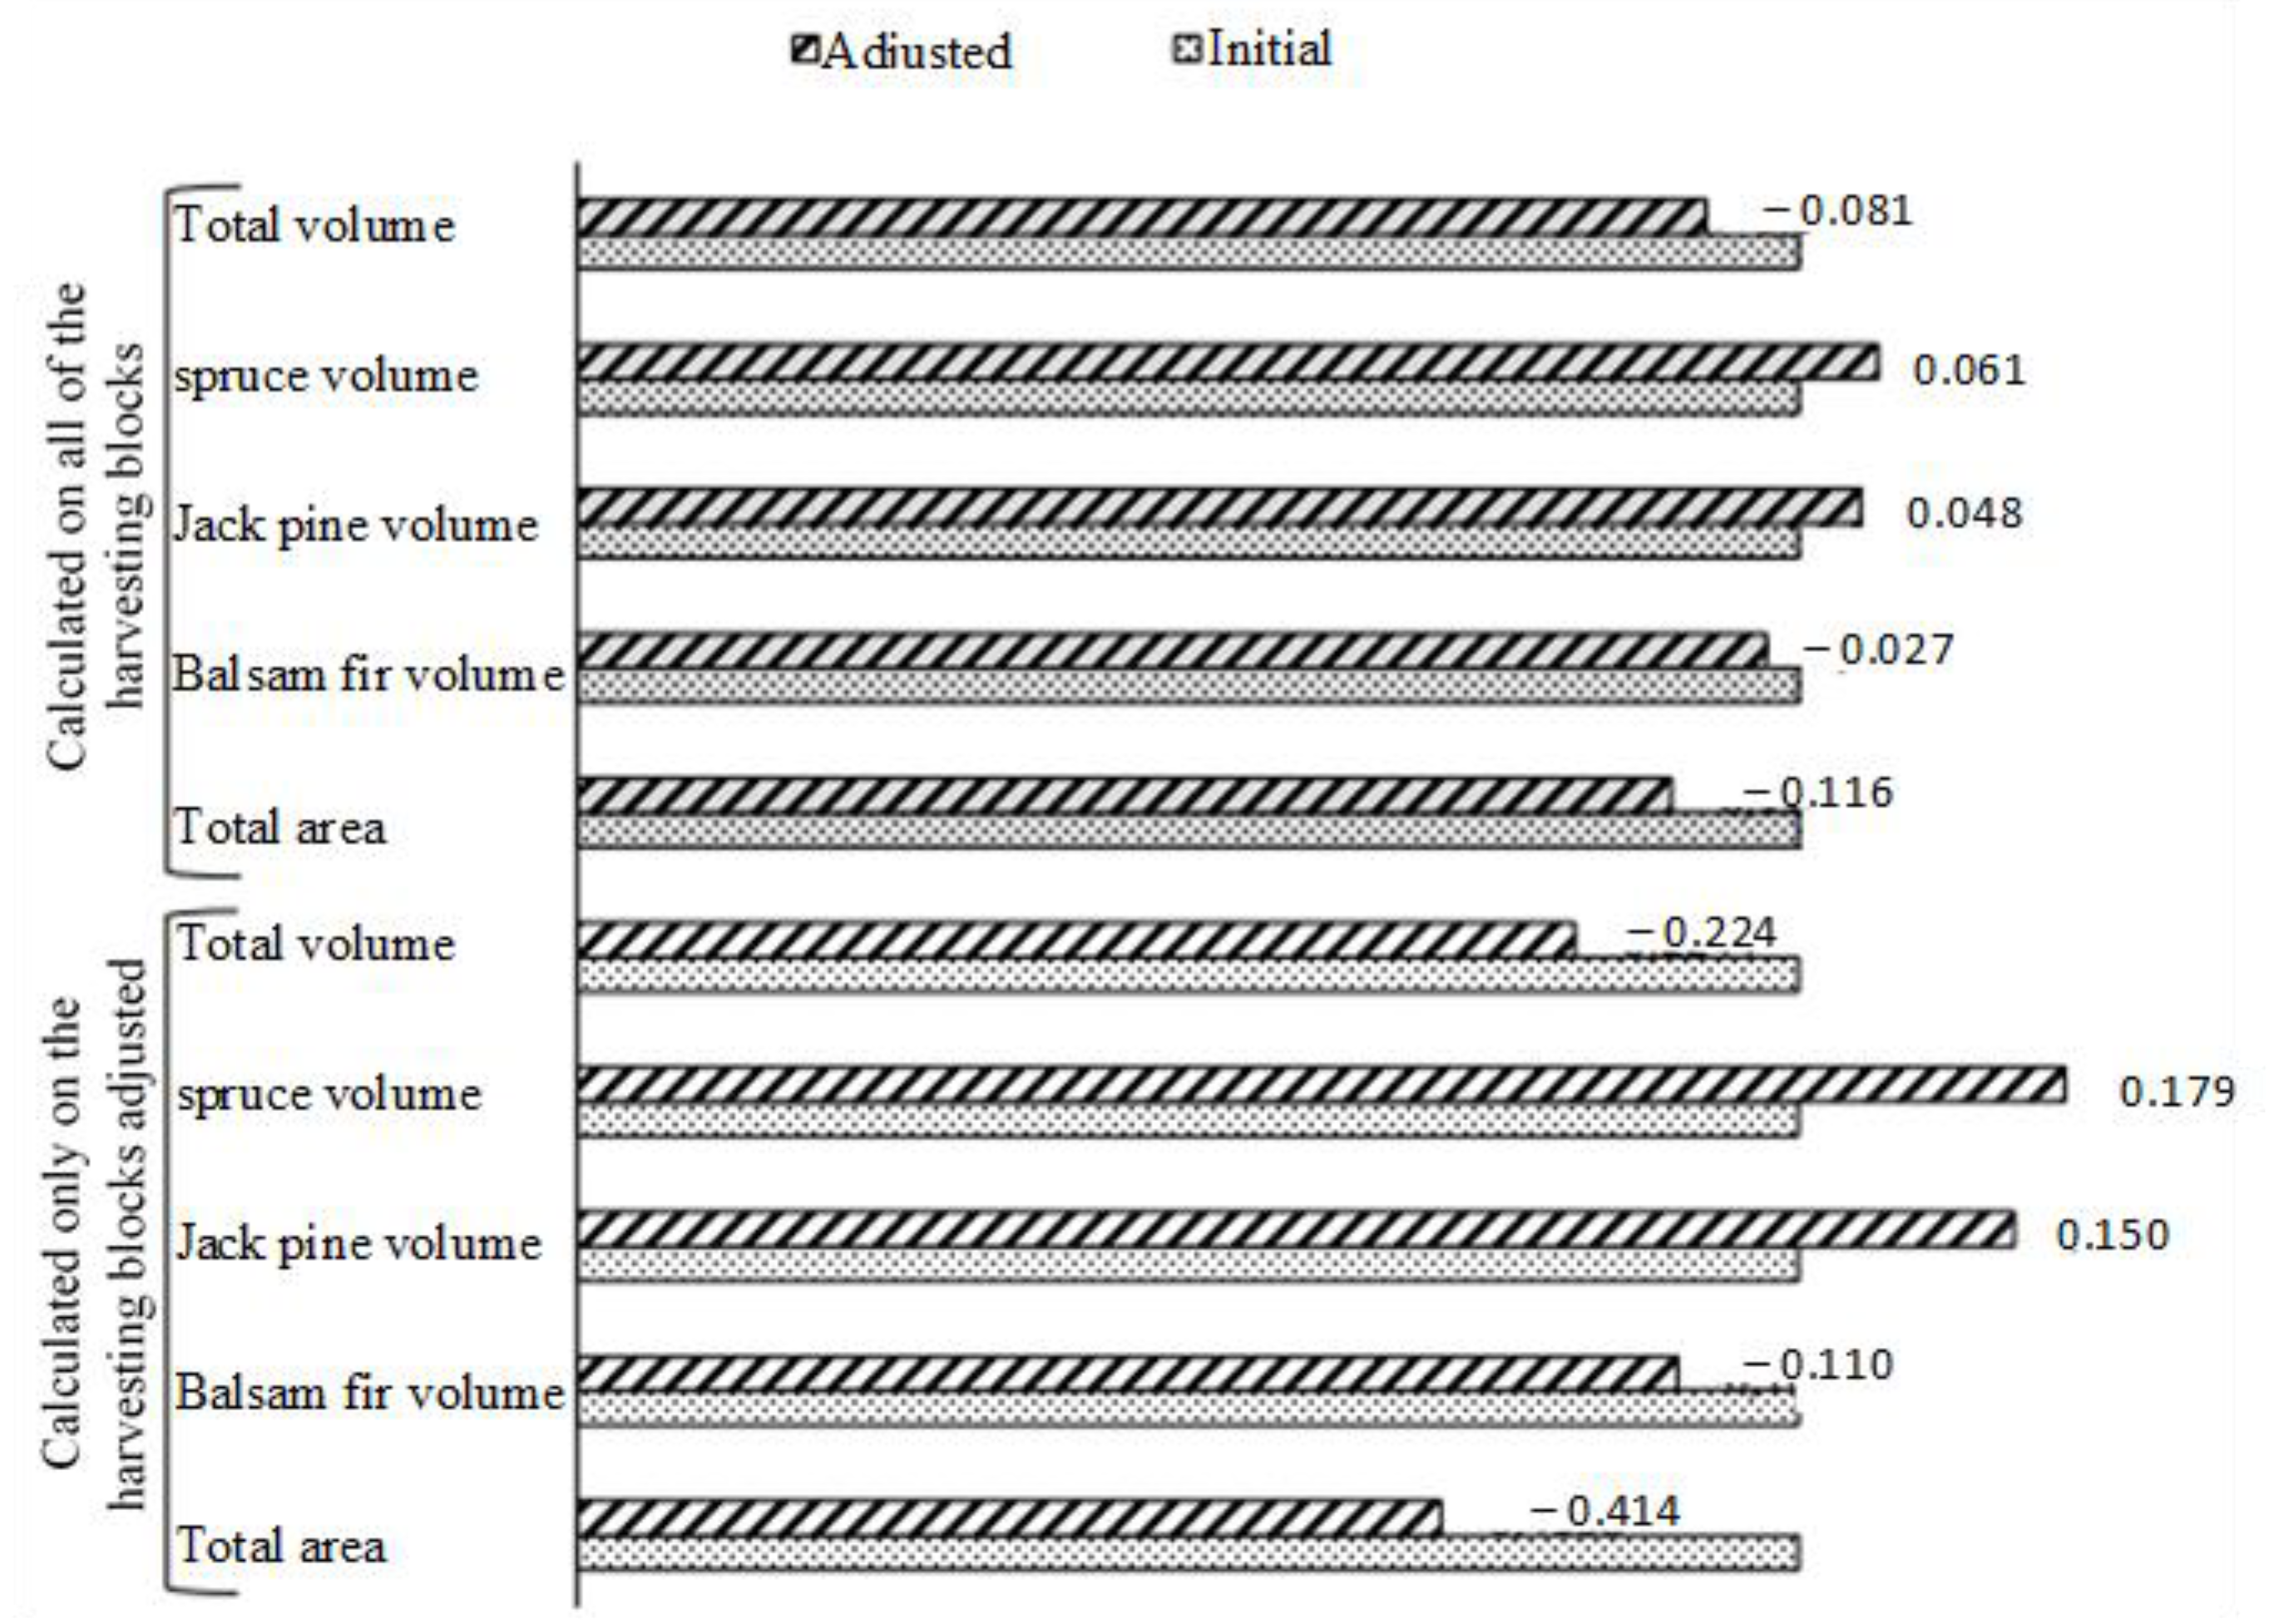
The impact of forestry inventory data accuracy on planning was assessed using actual volume as measured following harvest. For our case study, we received exact (real) harvested volumes of 18 out of 66 blocks, representing approximately 27% of all harvest blocks. As illustrated in
Figure 7, adjustments made to expected inventory data using data measured at the mill correspond to a drop of 8.18% of the total harvest volume and 11.6% of the blocks’ total area. Adjusted volume for 18 harvest blocks was lowered by 22.44% as opposed to the expected volume before harvesting. The proportion of black spruce and jack pine increases, whereas fir tree volume decreases when comparing forecast data with actual data.
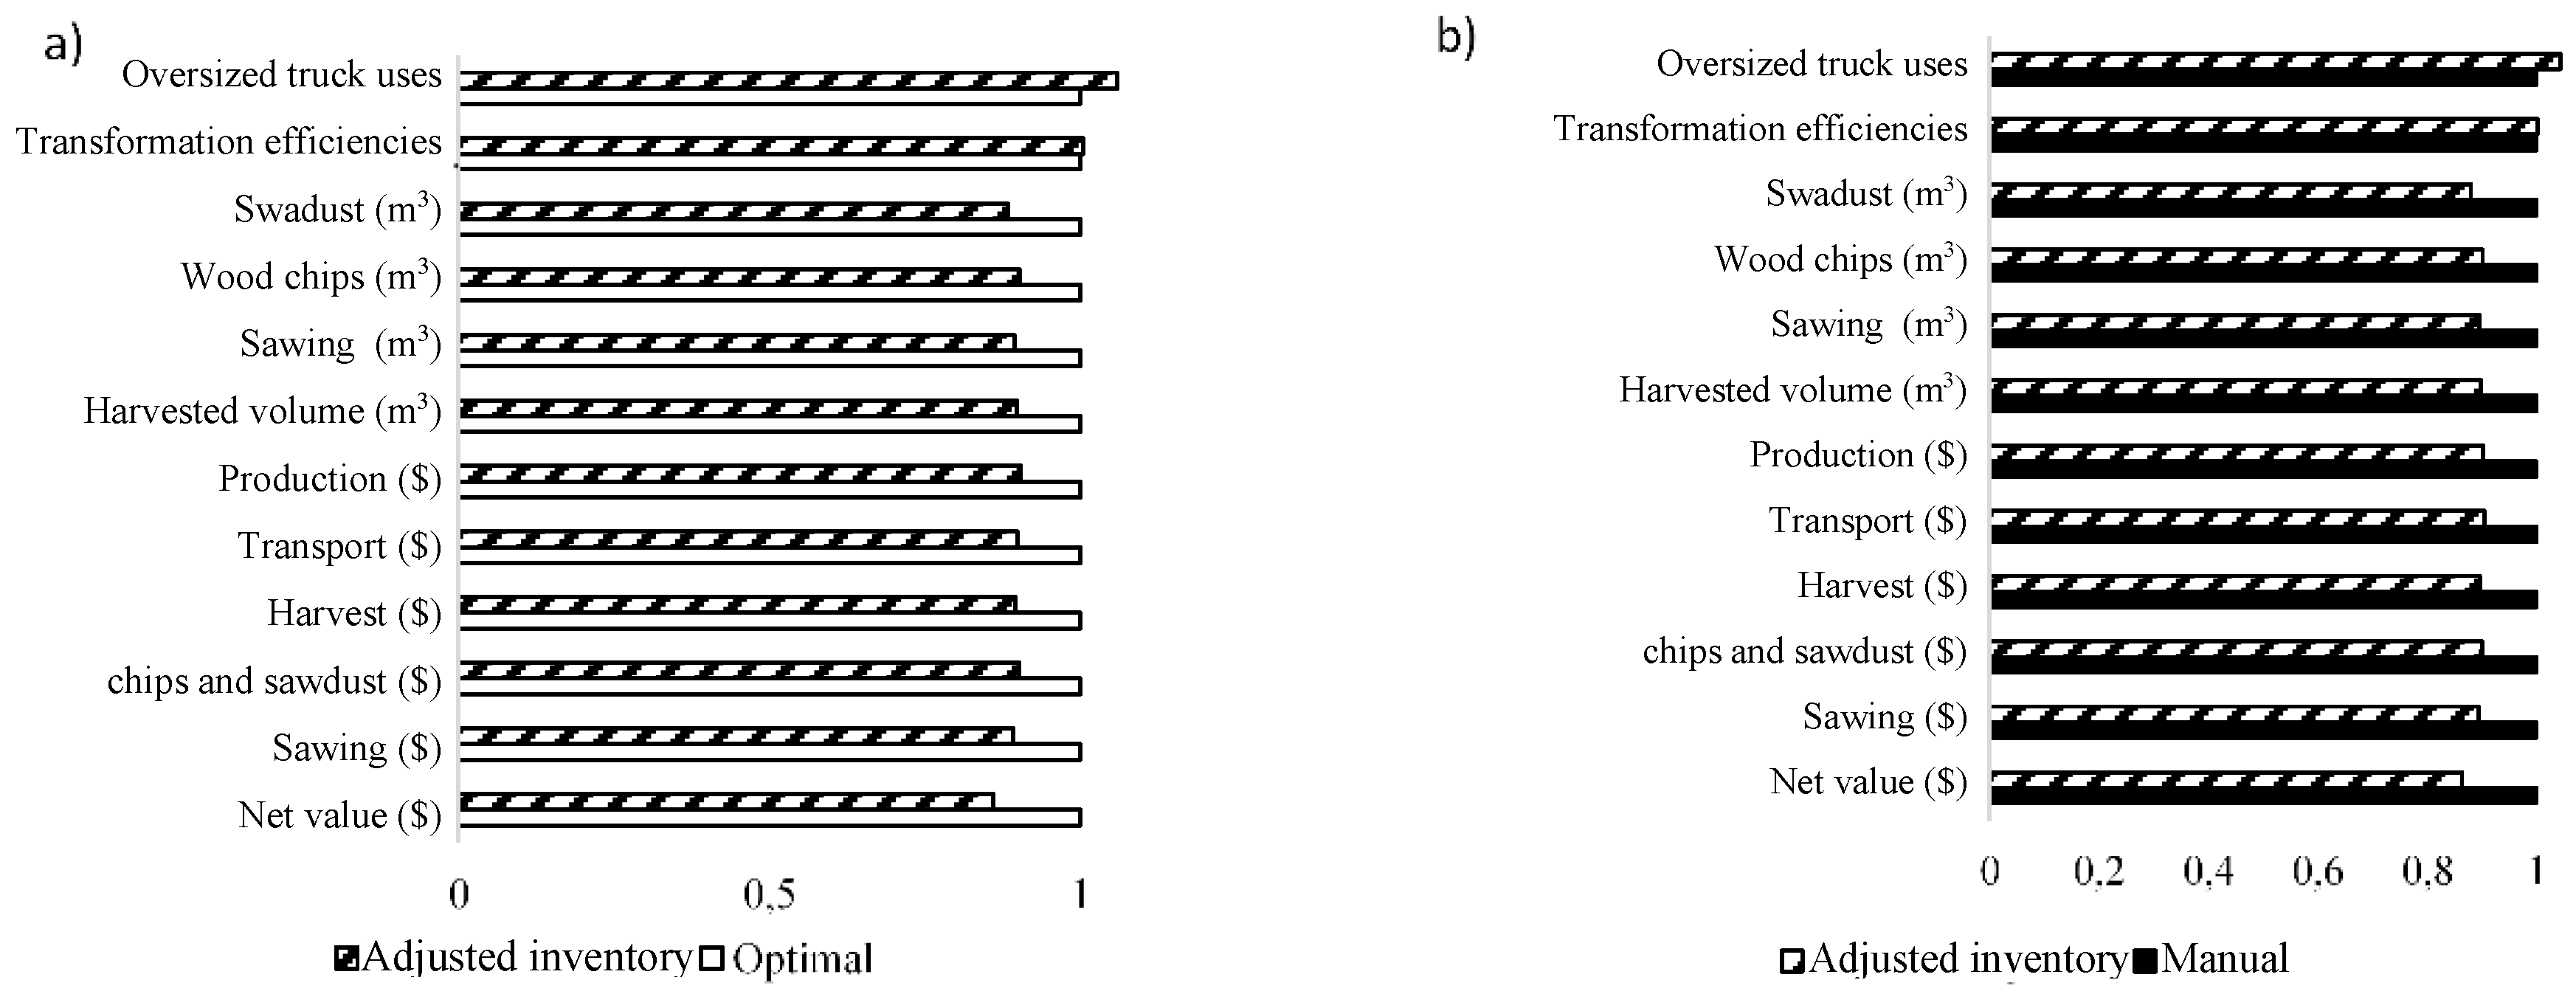
Initial inventory data were replaced by actual values in the mathematical model; a new optimized solution was calculated with an adjustment of volumes and areas. Results of the optimal and manual plans with real data were compared with plans using initial inventories (forecast), as shown in
Figure 8. Trends similar to those in manual and optimal plans were seen when inventories were adjusted. In adjusted manual and optimal plans (with 27% of adjusted inventories), there was a drop in harvested forest volume and factory products, a drop in costs and revenues, and a drop in net value. Few differences were seen between optimal and manual plans with inventory data adjusted in comparison to initial plans. On the basis of these results, the optimal plan remains the “best plan” even when inventory data change. In comparison to reference plans, both adjusted plans dropped at about the same level (around 14% for the optimal plan and 13.6% for the manual plan). The net value generated by optimization was still higher than the net value in the manual plan (a difference of CAD 7.5 M).
According to these data, the net value generated by the optimal plan of reference with adjusted inventory dropped slightly more than the value generated by the manual plan with adjusted inventory. For each cubic meter that was overestimated, the net value computed by the optimal plan generated losses of around CAD 5.01/m3 when compared to the manual plan with adjusted inventory. However, all inventories—considering that the manual plan’s net value does not drop post-adjustment—would need to be 30% less for the manual plan to become a better option and generate an equivalent or higher net value. An error close to 10%, around 286,013 m3, in harvested volume related to inventory data is a drop of 14% in net value in the optimal plan and 13.6% in the manual plan. In any case, these results point toward the importance of improving the precision of pre-harvest inventories.
5. Conclusions
Planning wood supply for forest product mills is often done based on planners’ experience and intuition. However, wood supply planning requires awareness of numerous criteria. It is generally accepted that the use of optimization helps planners make better decisions. In a rigorous manner, our study quantifies the benefits of a computerized optimization system to plan forest-mill allocations. Further, the effort and costs of setting up an optimization tool in a company are estimated using the real context of a company based in Canada. The literature indicates that previously, many theoretical models have been proposed—with few or no documented examples of application in companies. Thus, our study wanted to verify whether or not the complexity of the problem, the constantly changing natural environment, and the expertise required to use these models were the limiting factors to their application in an industrial context. To verify our initial hypotheses, we (i) assessed the potential for implementing mathematical optimization in a company and (ii) demonstrated the benefits of using mathematical optimization to support planning decisions. The study was conducted with the collaboration of a large-scale forest product company with five sawmills distributed across a large territory.
Results demonstrated that adopting the optimal planning process can lead to savings as early as the first year after implementation. However, implementing the proposed planning process will require some effort and changes within the company. Among these requirements is the purchase of certain software programs to create databases needed to use LogiLab, including FPInterfaceTM, OptitekTM, or CPLEX (a mathematical solver). A minimum of training in mathematical optimization and general programming knowledge is all that is required from staff. The use of an optimal planning process as a complement to the current planning method should minimally decrease the time dedicated to planning by half.
The results of a manual plan and an optimized plan were compared to demonstrate the benefits of using mathematical optimization to support planning decisions. Results showed little variation among optimal plans that incorporated different operational constraints. The effect of these variations revealed that the proposed optimal planning process was robust to operational variations. Results even demonstrated that the net value anticipated by the developed optimal plan was 19.26% higher than the value developed by the current company method. This increase can be attributed to an improved allocation of harvest blocks to specific mills. This more efficient allocation would lower transportation costs and increase average transformation performance in the network sawmills, enabling a greater volume of lumber—the main source of revenue—in addition to lowering production costs. It was considered and validated with company planners that all 66 areas were accessible except during the thaw season. It is however possible that the optimized solution would generate periodic imbalance between the volume to be transported and local trucking capacity. Such a problem is frequently reported in the literature [
27]. Attention must therefore be paid to this element when producing the bi-weekly transport schedule at the operational level. Our results also demonstrate that it is crucial to know in advance (by at least one year) which sectors will supply mills. With respect to the impact of varying the quality of inventory data, further research using a larger quantity of verified data would be needed.


