Article

Refined Assessment of Economic Loss from Pine Wilt Disease at the Subcompartment Scale

1
Key Laboratory of National Forestry and Grassland Administration on Forest and Grassland Pest Monitoring and Warning, Center for Biological Disaster Prevention and Control, National Forestry and Grassland Administration, Shenyang 110034, China
2
Key Laboratory for Silviculture and Conservation of Ministry of Education, Beijing Forestry University, Beijing 100083, China
*
Author to whom correspondence should be addressed.
Forests 2023, 14(1), 139; https://doi.org/10.3390/f14010139
Submission received: 27 November 2022 / Revised: 4 January 2023 / Accepted: 9 January 2023 / Published: 12 January 2023
(This article belongs to the Section Forest Health)

Abstract

:
Pine wilt disease is a major plant epidemic that has significantly impaired the ecological safety of pine wood, the national economy, and peoples’ livelihood. It is challenging to accurately assess the loss from pine wilt disease through academic research or field work. Based on the 342,000 subcompartments of epidemic data of pine wilt disease in China in 2020, this study builds a refined assessment indicator system and measurement model for economic loss from disasters at the subcompartment scale and assesses direct economic loss and ecological service value loss. The results show that through direct economic loss and ecological service value loss, China lost USD 7.40 billion in 2020, including a direct economic loss of USD 1.11 billion and ecological service value loss of USD 6.29 billion. Of the direct economic loss, the forest material resource loss and protection expense reached USD 0.17 billion and USD 0.94 billion, respectively; of the ecological system service losses, regulation service, supporting service, and cultural service losses reached USD 4.58 billion, USD 1.35 billion, and USD 0.36 billion. Spatial distribution analysis showed that the loss declined from southeast to northwest, with Shandong, Zhejiang, and Jiangxi suffering the greatest losses. Based on the subcompartment scale, this study employs a more refined assessment indicator system and measurement model to provide accurate real-world assessment results.

1. Introduction

Forests, as the main body of ecological environment construction, are a significant barrier that helps maintain and safeguard human survival and social development. The forest resources in China have been damaged by harmful biological disasters for a long time. In recent years, various pests have seriously affected the growth of forests. The biological disasters to Chinese forests have covered more than 10 million ha, which have caused direct economic losses up to USD 30.45 billion and a total economic loss of more than USD 202.98 billion, including ecological service value loss [1]. Carrying out biological disaster loss assessment can comprehensively, systematically, and scientifically reflect the effects of biological disasters on forest resources, the ecological system, and social development. It also provides good support to guide scientific prevention and control measures and implement precise management measures.
Pine wilt disease, a very harmful forest disease, is a major plant epidemic. Known as the “cancer” of pine trees, it is highly pathogenic, spreads quickly, has a wide range of transmission routes, is difficult to eradicate, and has a huge devastating effect on pine forest resources [2]. Pine wilt disease originates from North America, though Asia is one of the most serious disaster-hit regions [3]. Since 1982, when pine wilt disease was found in China, pine wilt disease has spread fast and shown increasing adaptive capacity. It gradually invades mid- and high-latitude areas, and with a growing extent of harm [4], large stretches of pine trees die rapidly. As of the end of 2021, the epidemic of pine wilt disease had spread to 340,500 pine subcompartments, 5530 towns, 742 counties (districts and cities), and 19 provinces (municipalities and autonomous regions). In 2021, it was found in 1,716,500 ha of forest, killing 14,079,200 pines [5]. At present, China is one of the hardest-hit countries by pine wilt disease, which has threatened ecological safety, biological safety, and economic development.
The pine wood nematode infests pine trees and disrupts their water transport process, which causes the pine trees to wilt and die rapidly. The pine moth pest is the disease’s short-distance natural transmission, while human economic and logistic activities are the main factor for the long-distance spread of the pine wood nematode. When infected with pine wood nematode disease, the pine tree secretes less pine resin, the color of the pine needles becomes darker, and the whole pine tree withers and dies. Due to the wide variety and distribution of pine wood nematode host plants and vector insects, pine wood nematodes carried by humans to a new area can spread rapidly and cause damage [6].
Since the 20th century, scholars have conducted economic loss assessments caused by forest diseases, forest pests, and parasitic seed plants from the 1920s to 1960s [7,8,9]. Hall et al. studied the average annual wood loss caused by three major defoliators in timber forests, i.e., Canadian Neobarbara, jack pine Tortricidae, and Malacosoma neustria, from 1982 to 1987. Haack estimated an economic loss of USD 53 million a year on average (including both direct and indirect economic losses) caused by Anoplophora glabripennis [10].
In forest pest loss assessment, indirect economic loss forms an important part that includes ecological service value loss and loss of related industries. On the topic of ecological service value, Costanza et al. [11] divided, from an ecological perspective, the global biological system into 16 types of ecosystem, which included 17 categories of ecosystem function benefits. Sutton et al. [12] estimated the value of global ecosystems using remote-sensing images, including their market value and non-market value, and drew the first map of global economic activity with a resolution of 1 km2. Sannigrahi et al. [13], building on the research results of Costanza et al. and Xie et al., calculated the values of nine service functions of the seven ecosystems using six unit area values.
Economic loss assessment of forestry pest disasters in China was carried out relatively early. Su et al. [14] used seven indicators to calculate the direct economic losses of forest pest disasters from 1996 to 2001, including the loss of patch mortality, the loss of stand mortality, the loss of stand growth, the loss of live stand quality, the loss of economic forest products, the loss of disaster prevention and relief, and the loss of ineffective use of fixed assets. Song et al. [15] used the physical value accounting method to calculate the direct economic losses and the biomass estimation method to calculate the ecological service value losses to assess the direct economic losses and forest ecological service value losses caused by forest pests during the Eleventh Five-Year Plan period in China and improved and perfected the existing assessment methods.
As far as the economic loss assessment of a single pine wilt nematode disaster is concerned, relatively few studies have been conducted. Guo [16] established an index system including 3 primary indicators, 24 secondary indicators, and 16 tertiary indicators, conducted a loss impact analysis through the study of the loss assessment index system of pine wilt nematode invasion, and explored the potential impact of pine wilt nematode invasion on economic and ecological functions and environmental and socio-cultural values; Li et al. [17] constructed an index system for evaluating the value of the environmental impact of the pine wilt nematode from three aspects, ecological, social, and economic, and based on this, they quantitatively assessed the economic loss of the pine wilt nematode disaster in Zhejiang province in 2004.
In recent years, scholars in China and abroad have spent a lot of time exploring, according to different assessment purposes, different pine wood nematode disaster loss assessment index systems, and quantitative calculation methods were established, and example assessments were carried out. Tarek et al. [18] developed an economic impact modeling framework applied to pine nematode disease in Europe by integrating information on climate, pine nematode disease transmission, and forestry asset values in Europe, projected future pine nematode disease transmission in Europe, and calculated the direct and social impacts of pine nematode disease disasters. Pine nematode disease in North America mainly affects the export of pine wood and its products, and it is estimated that the import and export restrictions due to pine nematode disease cost the United States about USD 150 million and Canada about USD 700 million annually [3]. Zhang et al. [19] constructed a set of practical pine wilt nematode disaster economic loss assessment index systems to quantitatively assess the disaster economic losses of pine wilt nematode disease in China at the provincial scale in 2017, and the assessment results included direct economic losses and indirect economic losses. Zhao et al. [20] established a pine wilt nematode disease economic loss assessment index system, covering natural ecological losses, landscape aesthetic losses, and economic production losses that quantitatively assessed the economic losses of pine wilt nematode disease at the provincial level in mainland China from 1998–2017.
Forest ecosystems have many functions. The economic loss caused by pine wilt disease includes three aspects: economic, social, and ecological service [21]. Some scholars divide it into direct economic loss and indirect economic loss. The direct economic loss assessment covers forest material resource loss and protection expense loss. Among the indirect economic losses are negative effects on related industries and reduction or loss of forest ecosystems. However, these findings are based on provincial data. They did not consider related factors, including stand characteristics, economic development, and ecological position. Assessment results with major differences are not conducive for comparison and analysis.
Based on the research results of predecessors, this study relies on forest and grassland to build a refined monitoring platform for the pine wilt disease epidemic. Featuring the basic information of 342,000 epidemic subcompartments, we build a refined assessment indicator system and measurement model for economic loss from pine wilt disease at the subcompartment scale and assess the economic loss from pine wilt disease in China in 2020 to establish a scientific and accurate assessment system. This study provides empirical and theoretical support for developing disaster prevention and control policies, objectively evaluating disaster governance effects and refining the management of forest resources.

2. Data and Method

2.1. Data Source

This study covers 18 provinces (municipalities and autonomous regions) that suffered from the epidemic of pine wilt disease in mainland China in 2020.

2.1.1. Basic Pest Data

Feature information data of each epidemic subcompartment, such as geographic location (county, city, province), dominant pine species (in mixed forests, the tree species that dominates in number of trees or stand volume is called the dominant tree species, limited to pine species in this study), origin (man-made forest or natural forest), average diameter at breast height (DBH) (basic indicator reflecting tree thickness), etc., are taken from the refined monitoring platform for the epidemic of pine wilt disease sensed by forest and grassland ecosystems. Clearing and governance data of each epidemic subcompartment: mainly used to calculate prevention, control, and restoration costs, these data are from the refined monitoring platform for epidemic of pine wilt disease sensed by forest and grassland ecosystems and the statistical statement for the clearance and governance of pine wilt disease provided by the National Forestry and Grassland Administration.

2.1.2. Revision Data

Gross primary productivity (GPP) and rainfall data from districts and counties are mainly used to revise the data differences caused by large coverage, wide range, geographical conditions, and climate differences of the study areas and are from the national platform for basic conditions of science and technology called the National Earth System Science Data Center (http://www.geodata.cn/ accessed on 26 July 2021) and the China Meteorological Data Service Centre (http://data.cma.cn/ accessed on 19 August 2021). For the average price of major crops, the per-unit yield, sown area, gross output value indicator of forestry, and Engel coefficient, crop-related data are mainly used to calculate the equivalent factor of ecological service value of 1 standard unit of the ecosystem. The gross output value indicator of forestry and the Engel coefficient from the China Statistical Yearbook are used to calculate the economic loss based on the currency level in that year.

2.2. Construction of an Assessment Indicator System for Losses from Pine Wilt Disease

Based on the geographical location of each subcompartment, the dominant pine species, the origin of the tree species, and the average DBH, this study established an indicator system appropriate for the evaluation of single subcompartment [5,9,10]. It mainly includes two level 1 indicators, i.e., direct economic loss and ecological service value loss, five level 2 indicators, and 12 level 3 indicators (Table 1). Except for the “prevention and governance input” among the level 3 indicators, other indicators are assessed in subcompartments.

2.3. Assessment Method

The assessment and calculation are carried out according to the three levels of indicators. In particular, except for “prevention and governance input”, which is obtained by inquiring at the provincial scale, all the indicators are quantified and calculated at the subcompartment scale.

2.3.1. Direct Economic Loss Assessment Method

Forest Material Resource Loss

Loss of stock volume means the loss of standing tree volume growth or stand volume growth caused by pine wilt disease. This assessment assumes that all the stand volumes of single pine trees cleared in that year had been lost. Based on the geographic location, origin, dominant pine species, and average DBH of a single epidemic subcompartment, and by referring to the “Tree Volume Tables of China” [22], we calculate the average stand volume of a single pine tree in each subcompartment to obtain the stand volume loss of a single subcompartment based on the number of trees cleared and then calculate the economic loss from the forest stock price. The calculation formula is [15]
L a = A d × N × T a
where La is the stand volume loss value of a single epidemic subcompartment, N is the number of pine trees cleared in this subcompartment, Ad is the average stand volume of single pine trees in this epidemic subcompartment, and Ta is the stock forest price of this type of pine (the currency level of 2020 is calculated according to the gross output value indicator of forestry). Some parameters are shown in Table 2.
Forest by-product loss: This mainly refers to pine resin and pinecone loss. According to current forestry standard Technical Regulations for Collection of Pine Resin (LY/T 1649-2007), pine resin should be collected from the pines with a DBH of no less than 18 cm. Pinecones are the pine nuts from Korean pines that have a DBH of no less than 20 cm. The economic loss of pine resin is calculated as [15]
L o = Y o × N × P o
where Lo is the pine resin loss value of a single epidemic subcompartment, Yo is the annual average resin output of single healthy pines, N is the number of cleared pines that reach the conditions of resin production, and Po is the average local pine resin price.
The formula for calculating pinecone loss is [15]
L n = Y n × N × P n
where Ln is the pinecone loss value of a single epidemic subcompartment, Yn is the annual average pinecone output of single healthy pines, N is the number of cleared pines that reach the conditions of pinecone production, and Po is the average local pinecone price. Some parameters are shown in Table 2.
Protection expense: the sum of various manpower and material resources that are input when pine wilt disease is present (without considering investment in fixed assets).
Input for prevention and control: all expenses invested in the investigation and monitoring of epidemic area or adjacent areas, cutting and treatment of sick trees, prevention and control in the epidemic area, prevention in the non-epidemic area, etc., are obtained from the forestry pest control information management system of the National Forestry and Grassland Administration.
Restoration costs: The costs incurred by replanting and resowing according to the distribution characteristics of cleared pine trees, stand conditions, and management objectives. According to the volume loss of single subcompartments, and by referring to the “Chinese Forest Resources Report (2014–2018)”, the regional average volume per unit area is converted into the non-forested area of each subcompartment for calculation based on the ecological restoration costs per unit area. This is calculated as
L f = S × P f
where Lf is the restoration costs of a single subcompartment, S is the non-forested area of the subcompartment, and Pf is the ecological restoration costs per unit area.

2.3.2. Ecological Service Value Loss Assessment Method

The ecosystem has complicated and diversified service functions which are closely related to local natural and geographical conditions, socioeconomic status, and religious faith [24]. In this assessment, we propose ecological service value adjustment coefficient, modify the theoretical value of ecological service value loss, and thus obtain the actual value that is closest to the actual loss.
  • Prepare an ecological service value equivalence table
In this study, the equivalent factor method is used to simulate the theoretical value of ecological service value loss produced by the affected forest ecosystem [25,26,27]. The economic value of the annual natural grain yield of 1 ha of farmland with an average yield is regarded as a standard unit of ecosystem service value equivalent factor. After being modified by the development stage coefficient representing the relative level of willingness to pay, combined with the basic equivalence table of coniferous forest, the GPP that is correct to the district and county level, and the precipitation spatio-temporal regulation factor, a dynamic equivalence table of ecological service value per unit area of coniferous forest is prepared to calculate the theoretical value loss of the ecological service value of the subcompartment:
F i j = { P i j × F 1 O R R i j × F 2
where F i j is the value equivalent factor per unit area of coniferous forest ecosystem in region j at time i ; P i j denotes the GPP spatio-temporal regulation factor of this ecosystem in region j at time i ; R i j indicates the precipitation spatio-temporal regulation factor of this system in region j at time i ; F 1 represents service functions, such as gas regulation, climate regulation, decontamination environment, nutrient cycling maintenance, biodiversity maintenance, and aesthetic landscape provision; and F 2 means the ecological service function is either hydrological regulation service or soil conservation service.
2.
Set the ecological service value adjustment coefficient
Economic location adjustment coefficient K1: the ratio of the per capita GDP of the region where the stand is located to the per capita GDP of China in the previous year, plus 1:
K 1 = 1 + G D P e / G D P o
where K1 is the economic location adjustment coefficient, GDPe is last year’s per capita GDP of the province where the epidemic area is located, and GDPo is last year’s per capita GDP of China.
Ecological location adjustment coefficient K2: the ecological protection level of the epidemic area is determined according to related standards in the Division of Forestry Development in China [28]:
K 2 = 1 + R
Formulas (6) and (7) are derived from Technical Specification for the Evaluation of Natural Resources (Forest) Assets, the forestry industry standard of the People’s Republic of China (LY/T2735-2016).
For ecological protection level 1, R is 1.00; for ecological protection level 2, R is 0.75; for ecological protection level 3, R is 0.50; for ecological protection level 4, R is 0.25; for ecological protection level 5, R is 0.
Key functional location adjustment coefficient K3: It is set for key functional ecological locations such as the Qin ling Mountains in Shaanxi, Huangshan Scenic Spot, Lushan Scenic Spot, Taishan Forestry Center, Zhangjiajie Natural Reserve, Mount Fanjing, and Fushun in Liaoning province. According to expert opinion, K3 is a constant set as
K 3 = 3

3. Results

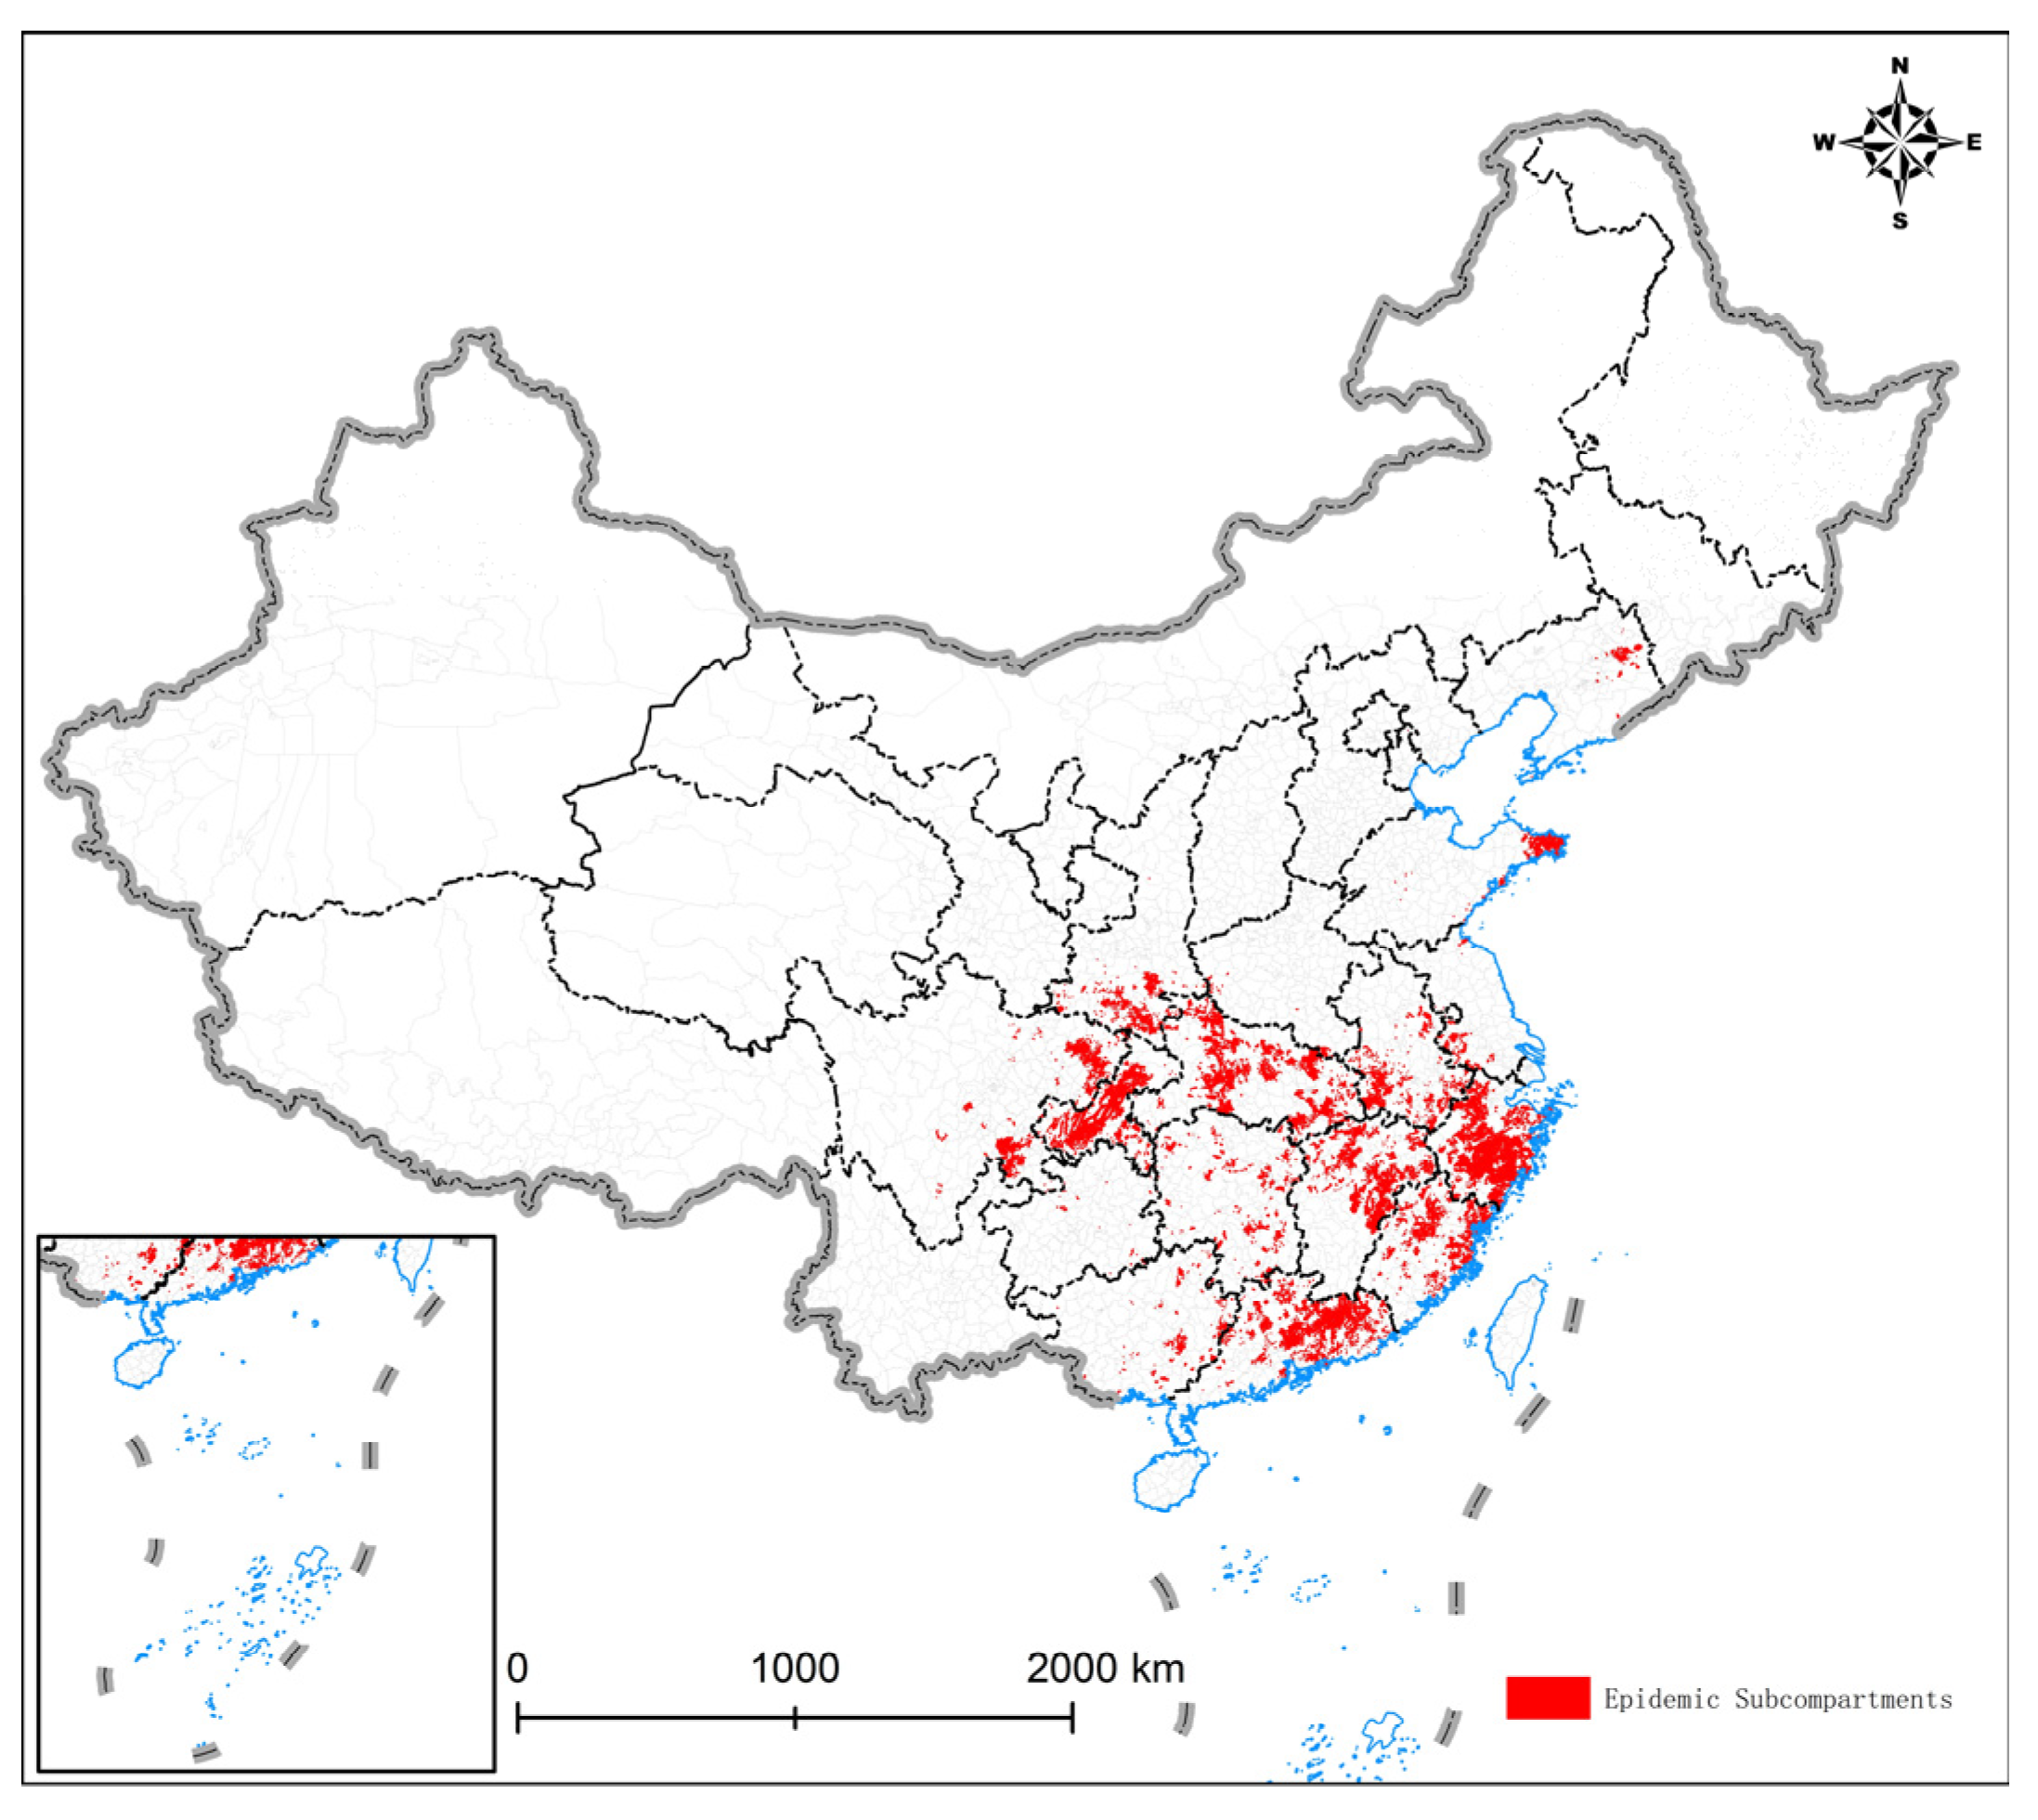
3.1. Small Group Distribution Pattern of Pine Wilt Nematode Epidemic in China in 2020

In 2020, China’s pine nematode disease epidemic had 342,000 subcompartments of data, infected about 16 million pine trees, about 28.71 million pine trees had to be cleared away after removal of the disease (Figure 1), the average accumulation per unit area of provinces (municipalities directly under the Central Government, autonomous regions), and the loss of area was about 2.5 million ha. The provinces where the number of cleared plants exceeded 3 million were Zhejiang, Jiangxi, and Hubei, all in East and Central China, with a loss area of more than 3000 ha; provinces where the number of cleared plants was between 1 million and 3 million were Shandong, Chongqing, Fujian, Sichuan, and Liaoning, with a combined loss area of more than 1000 ha; for the remaining provinces where the number of cleared plants in small groups of the epidemic was less than 1 million, the result was a loss area of less than 1000 ha. The rest of the provinces have less than 1 million strains, and the loss area was less than 1000 ha.

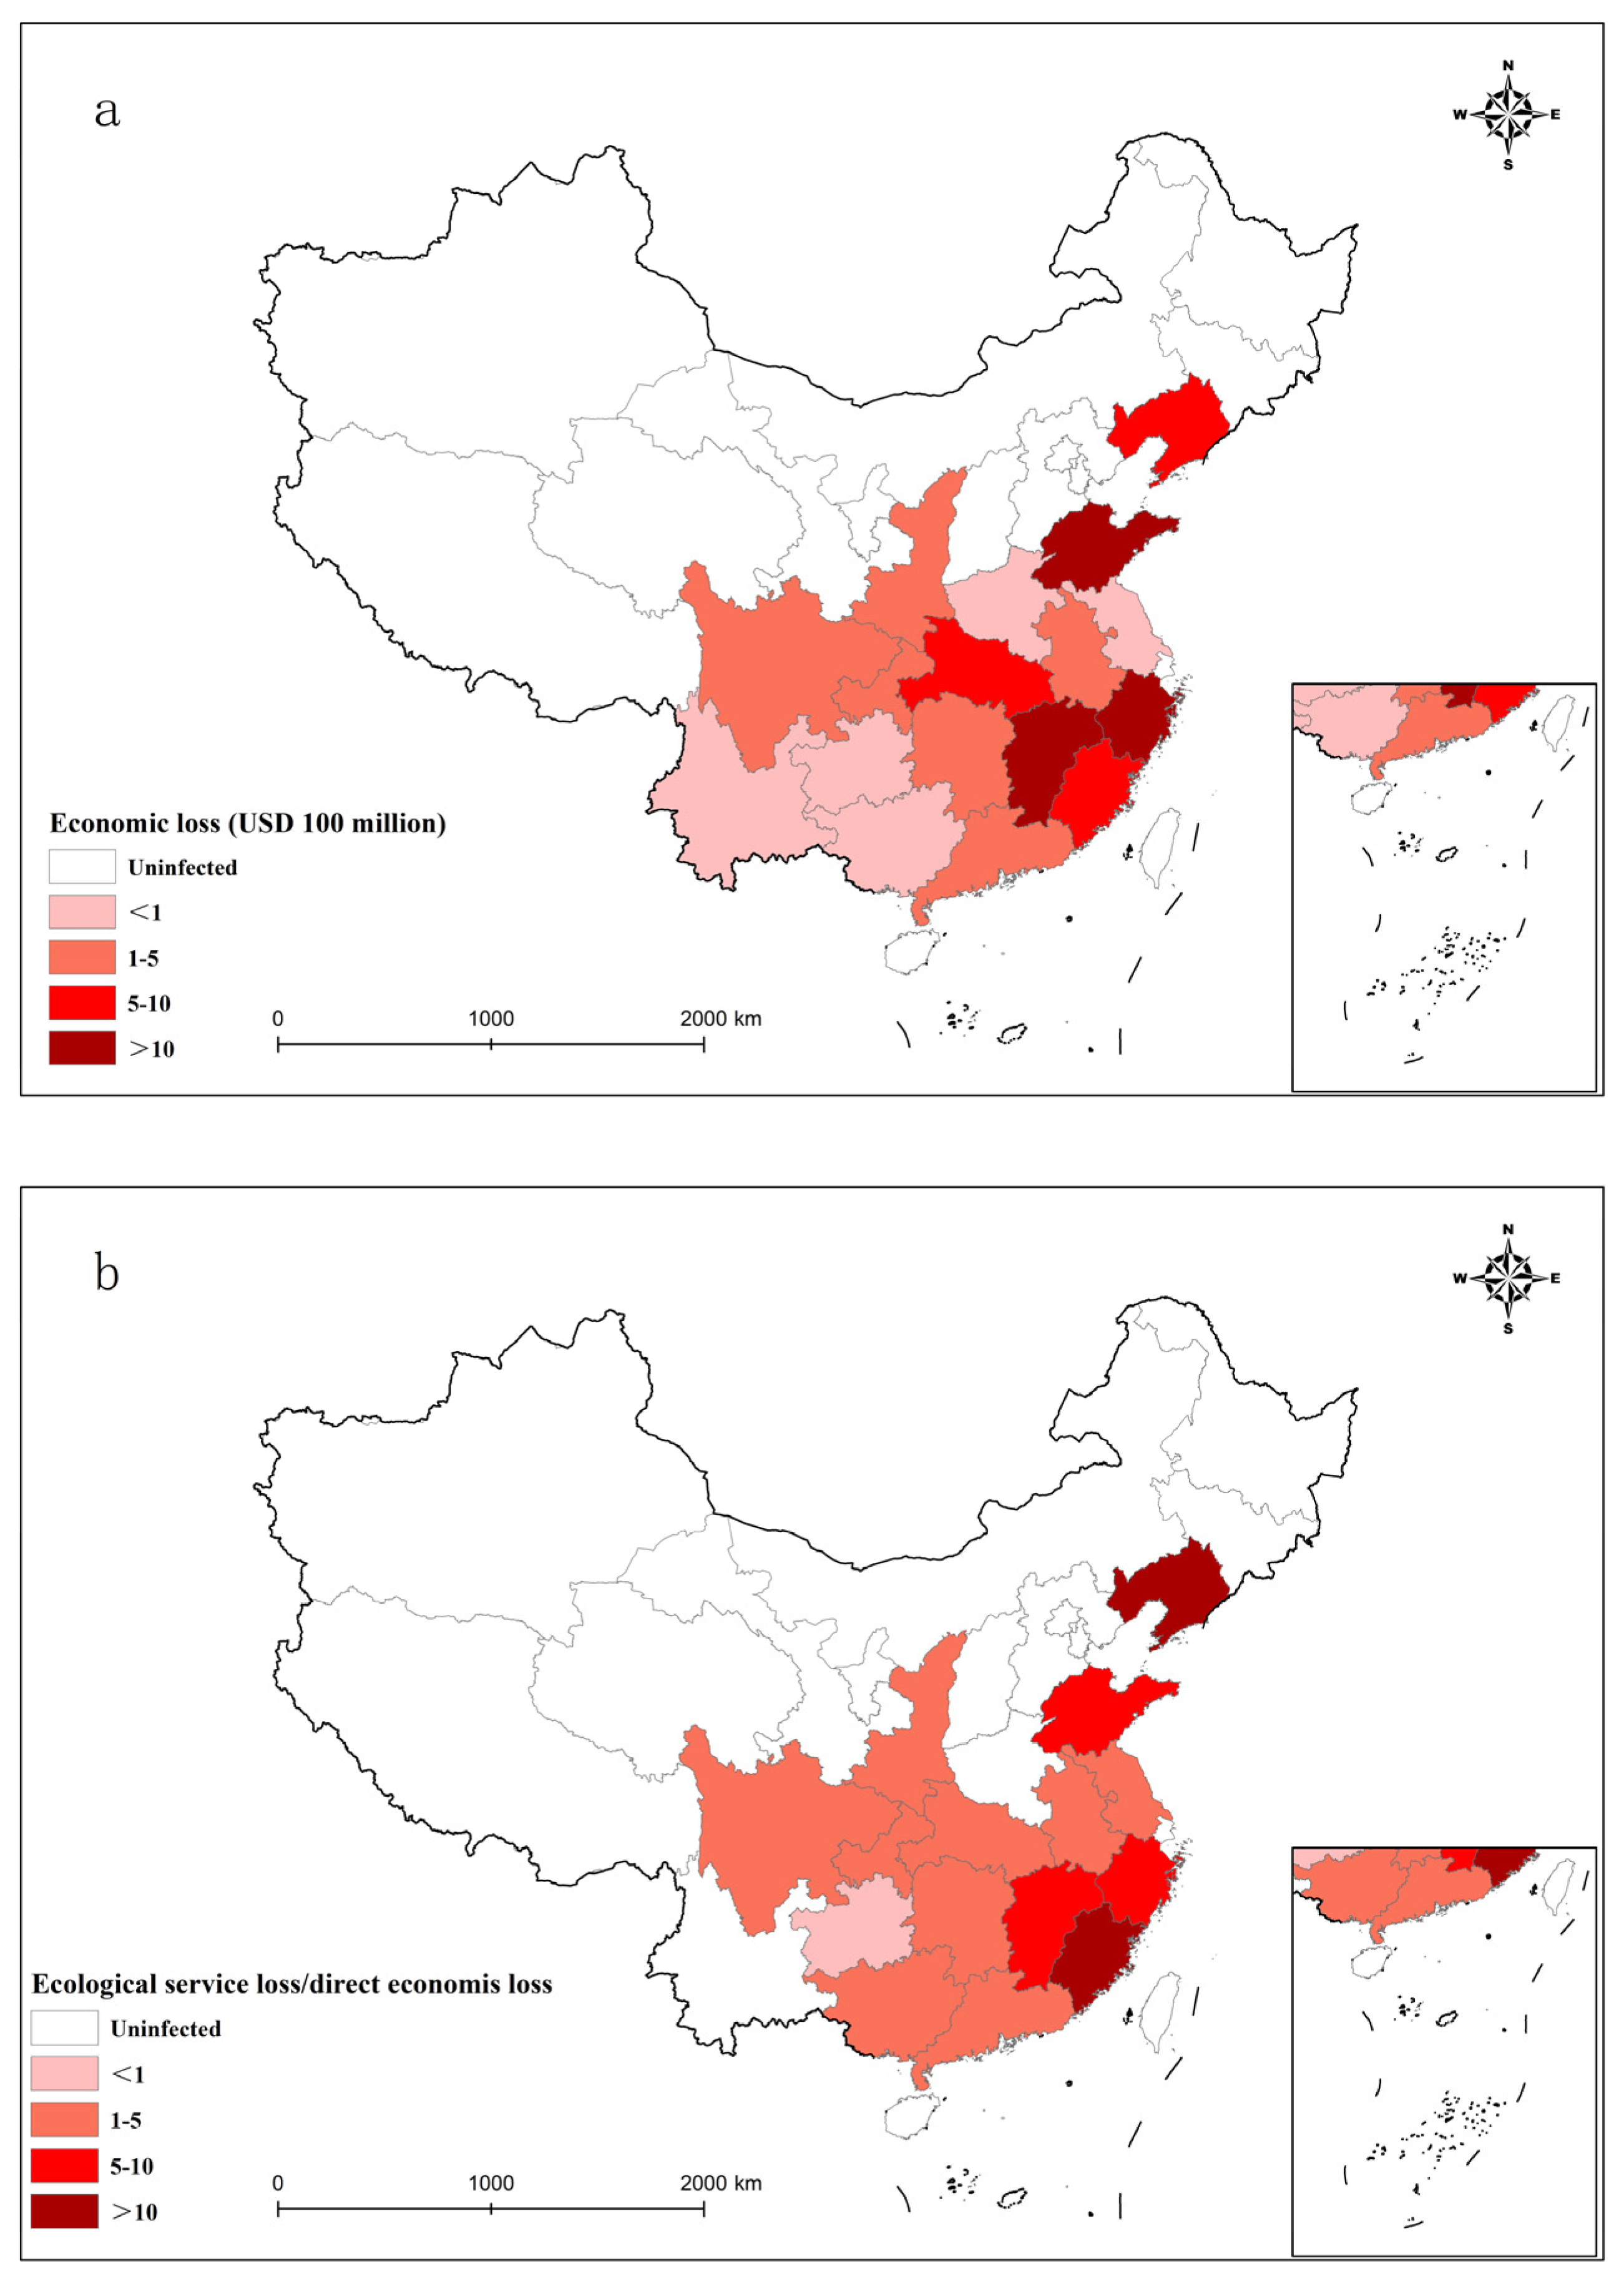
3.2. Economic Loss from Pine wilt Disease in China in 2020

In 2020, 1,809,200 ha of pine trees was infected with pine wilt disease. As a result, 28.71 million pine trees were cleared, with 1,960,316 m3 of stand volume being lost. If calculated based on the average stand volume per unit area of a province (municipality or autonomous region), this amounts to 25,031.99 ha of pine wood to be non-forested (Figure 2a), which results in a total economic loss of USD 7.40 billion, including a direct economic loss of USD 1.11 billion and ecological service value loss of USD 6.29 billion (Figure 2b). The provinces that suffered the greatest loss were Shandong, Zhejiang, and Jiangxi, accounting for 50.98% of the total economic loss from pine wilt in China (Figure 3a).
For the composition of economic losses from pine wilt disease in China, the ratio of ecological service value loss to direct economic loss is 5.60 on average, which indicates that the ecological service value loss is more serious (Figure 3b). In particular, Liaoning has the highest ratio, at 19.43, followed by Fujian, Shandong, and Zhejiang at 9.87, 9.80, and 7.04, respectively. Spatial distribution analysis shows that the loss declines from southeast to northwest, with Shandong, Zhejiang, and Jiangxi in the east suffering the greatest loss.

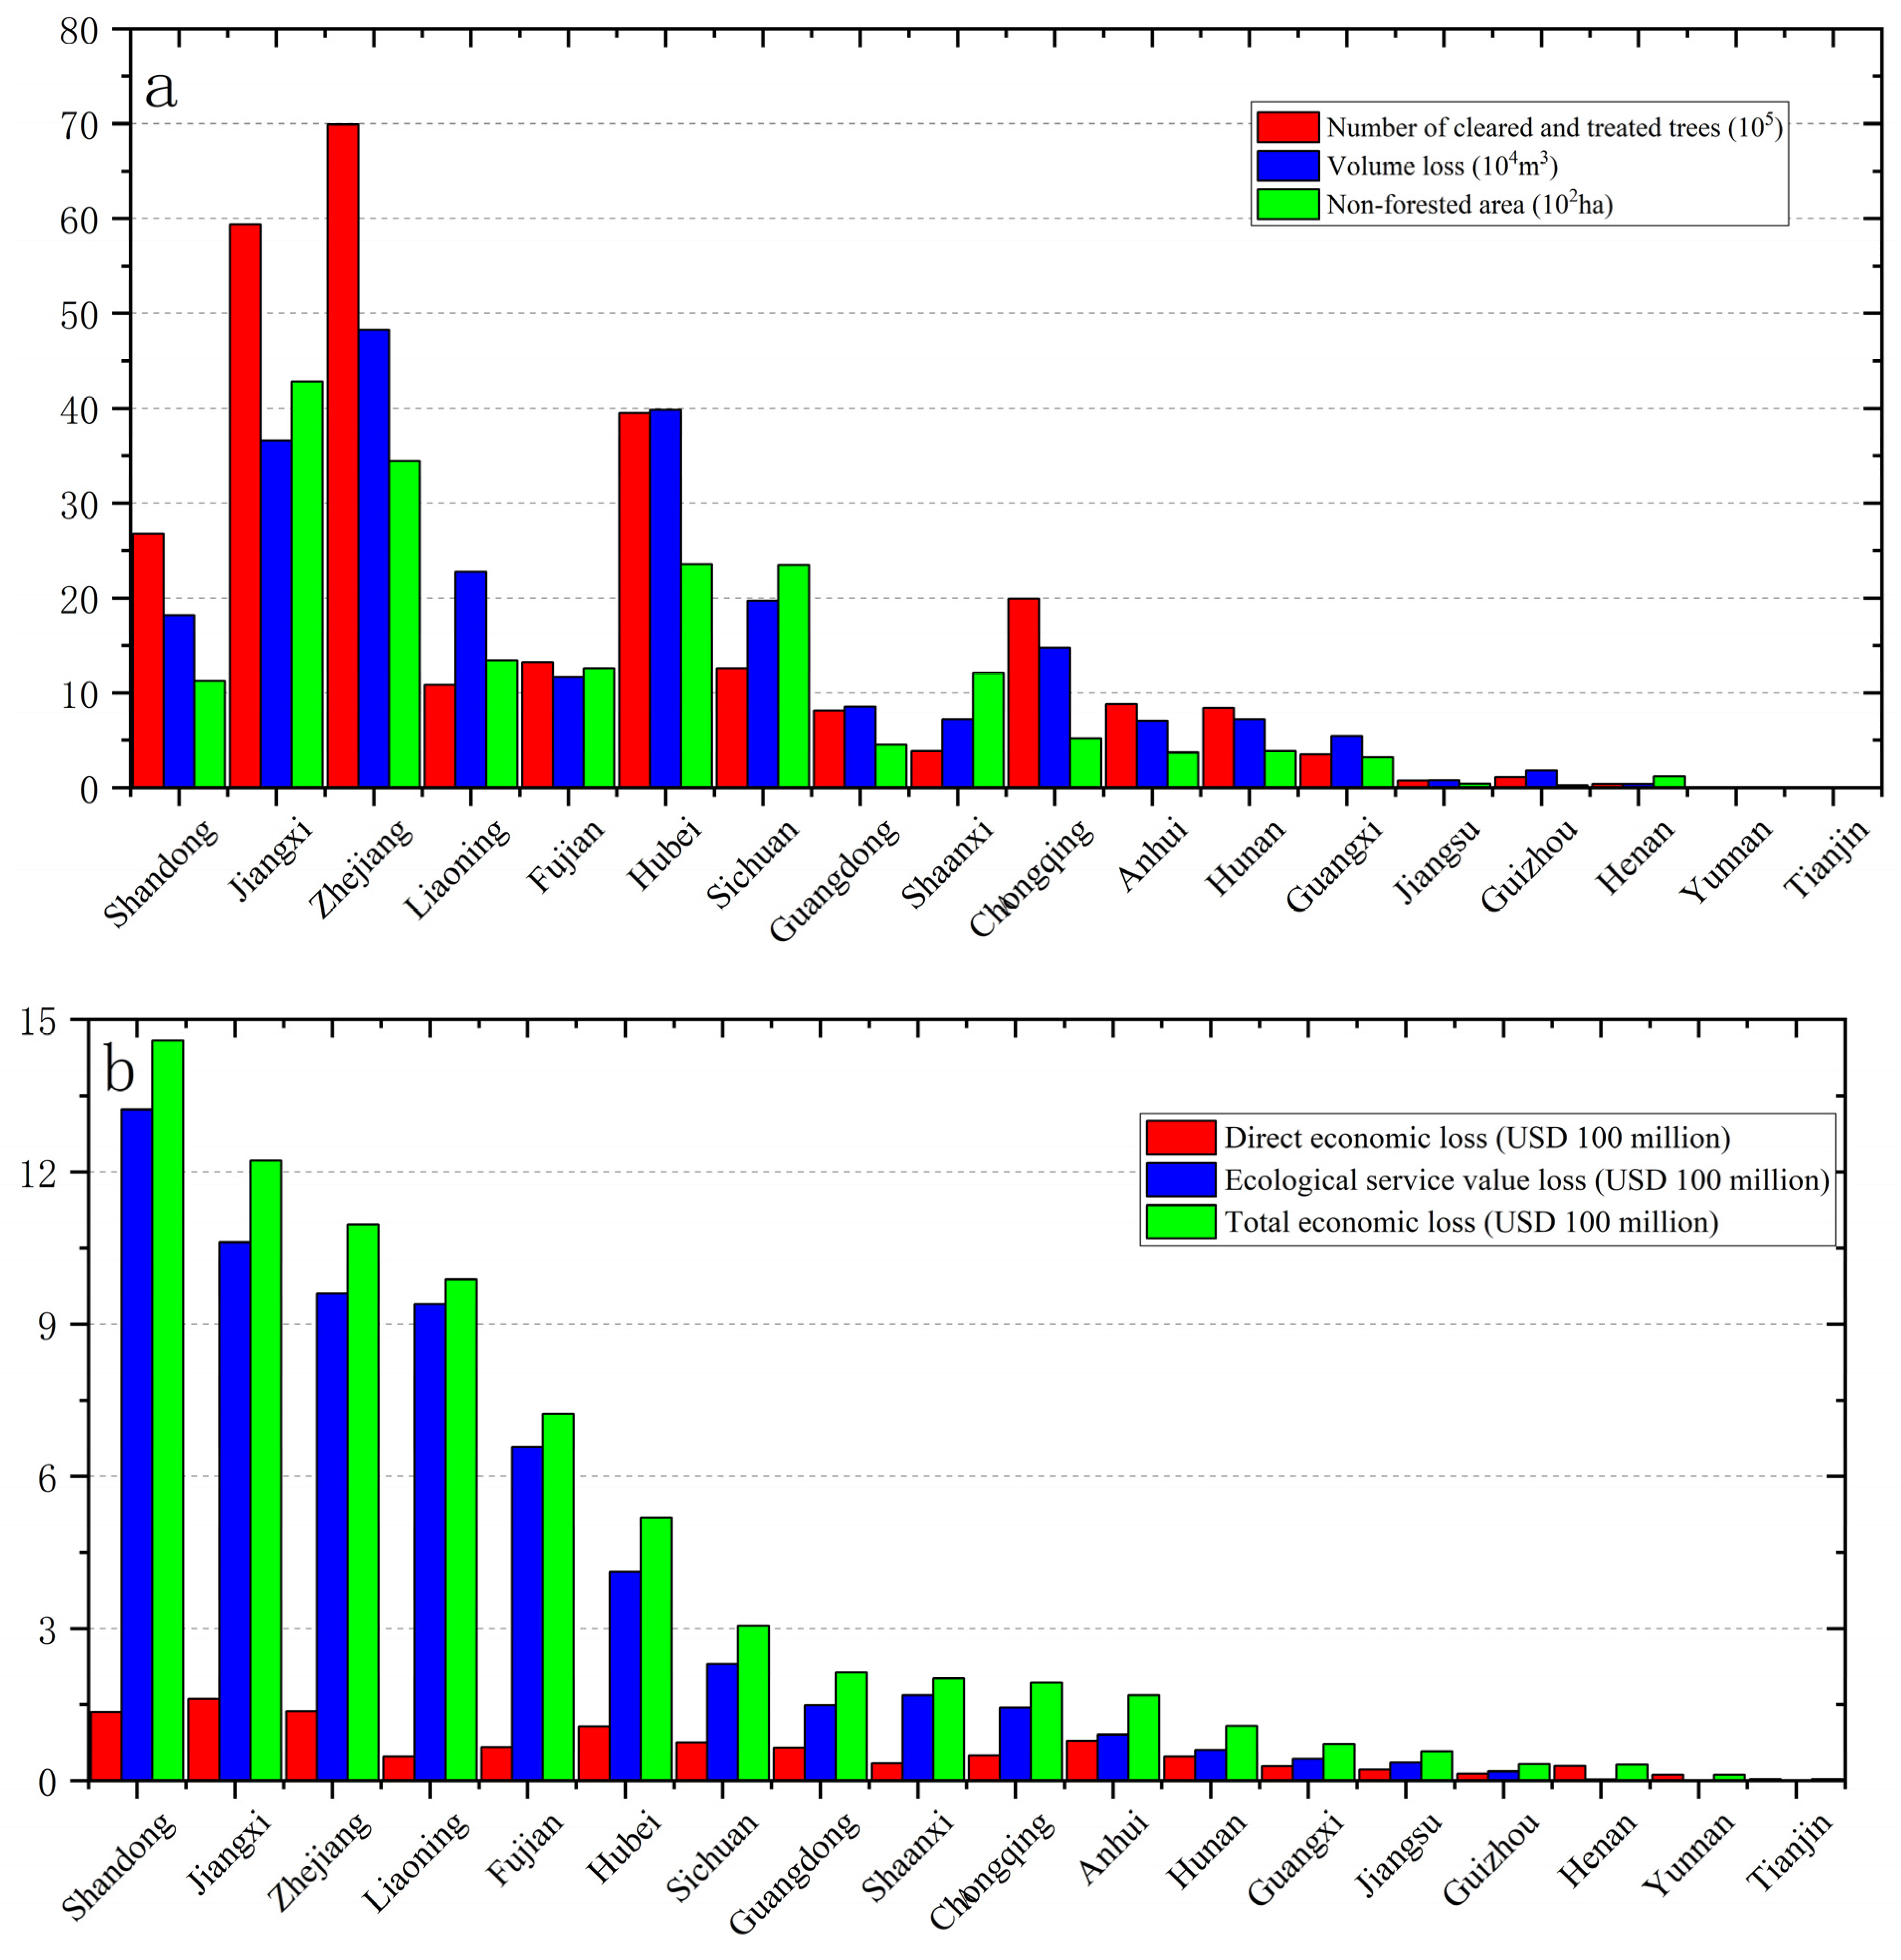
3.3. Level 2 and 3 Economic Loss Indicators

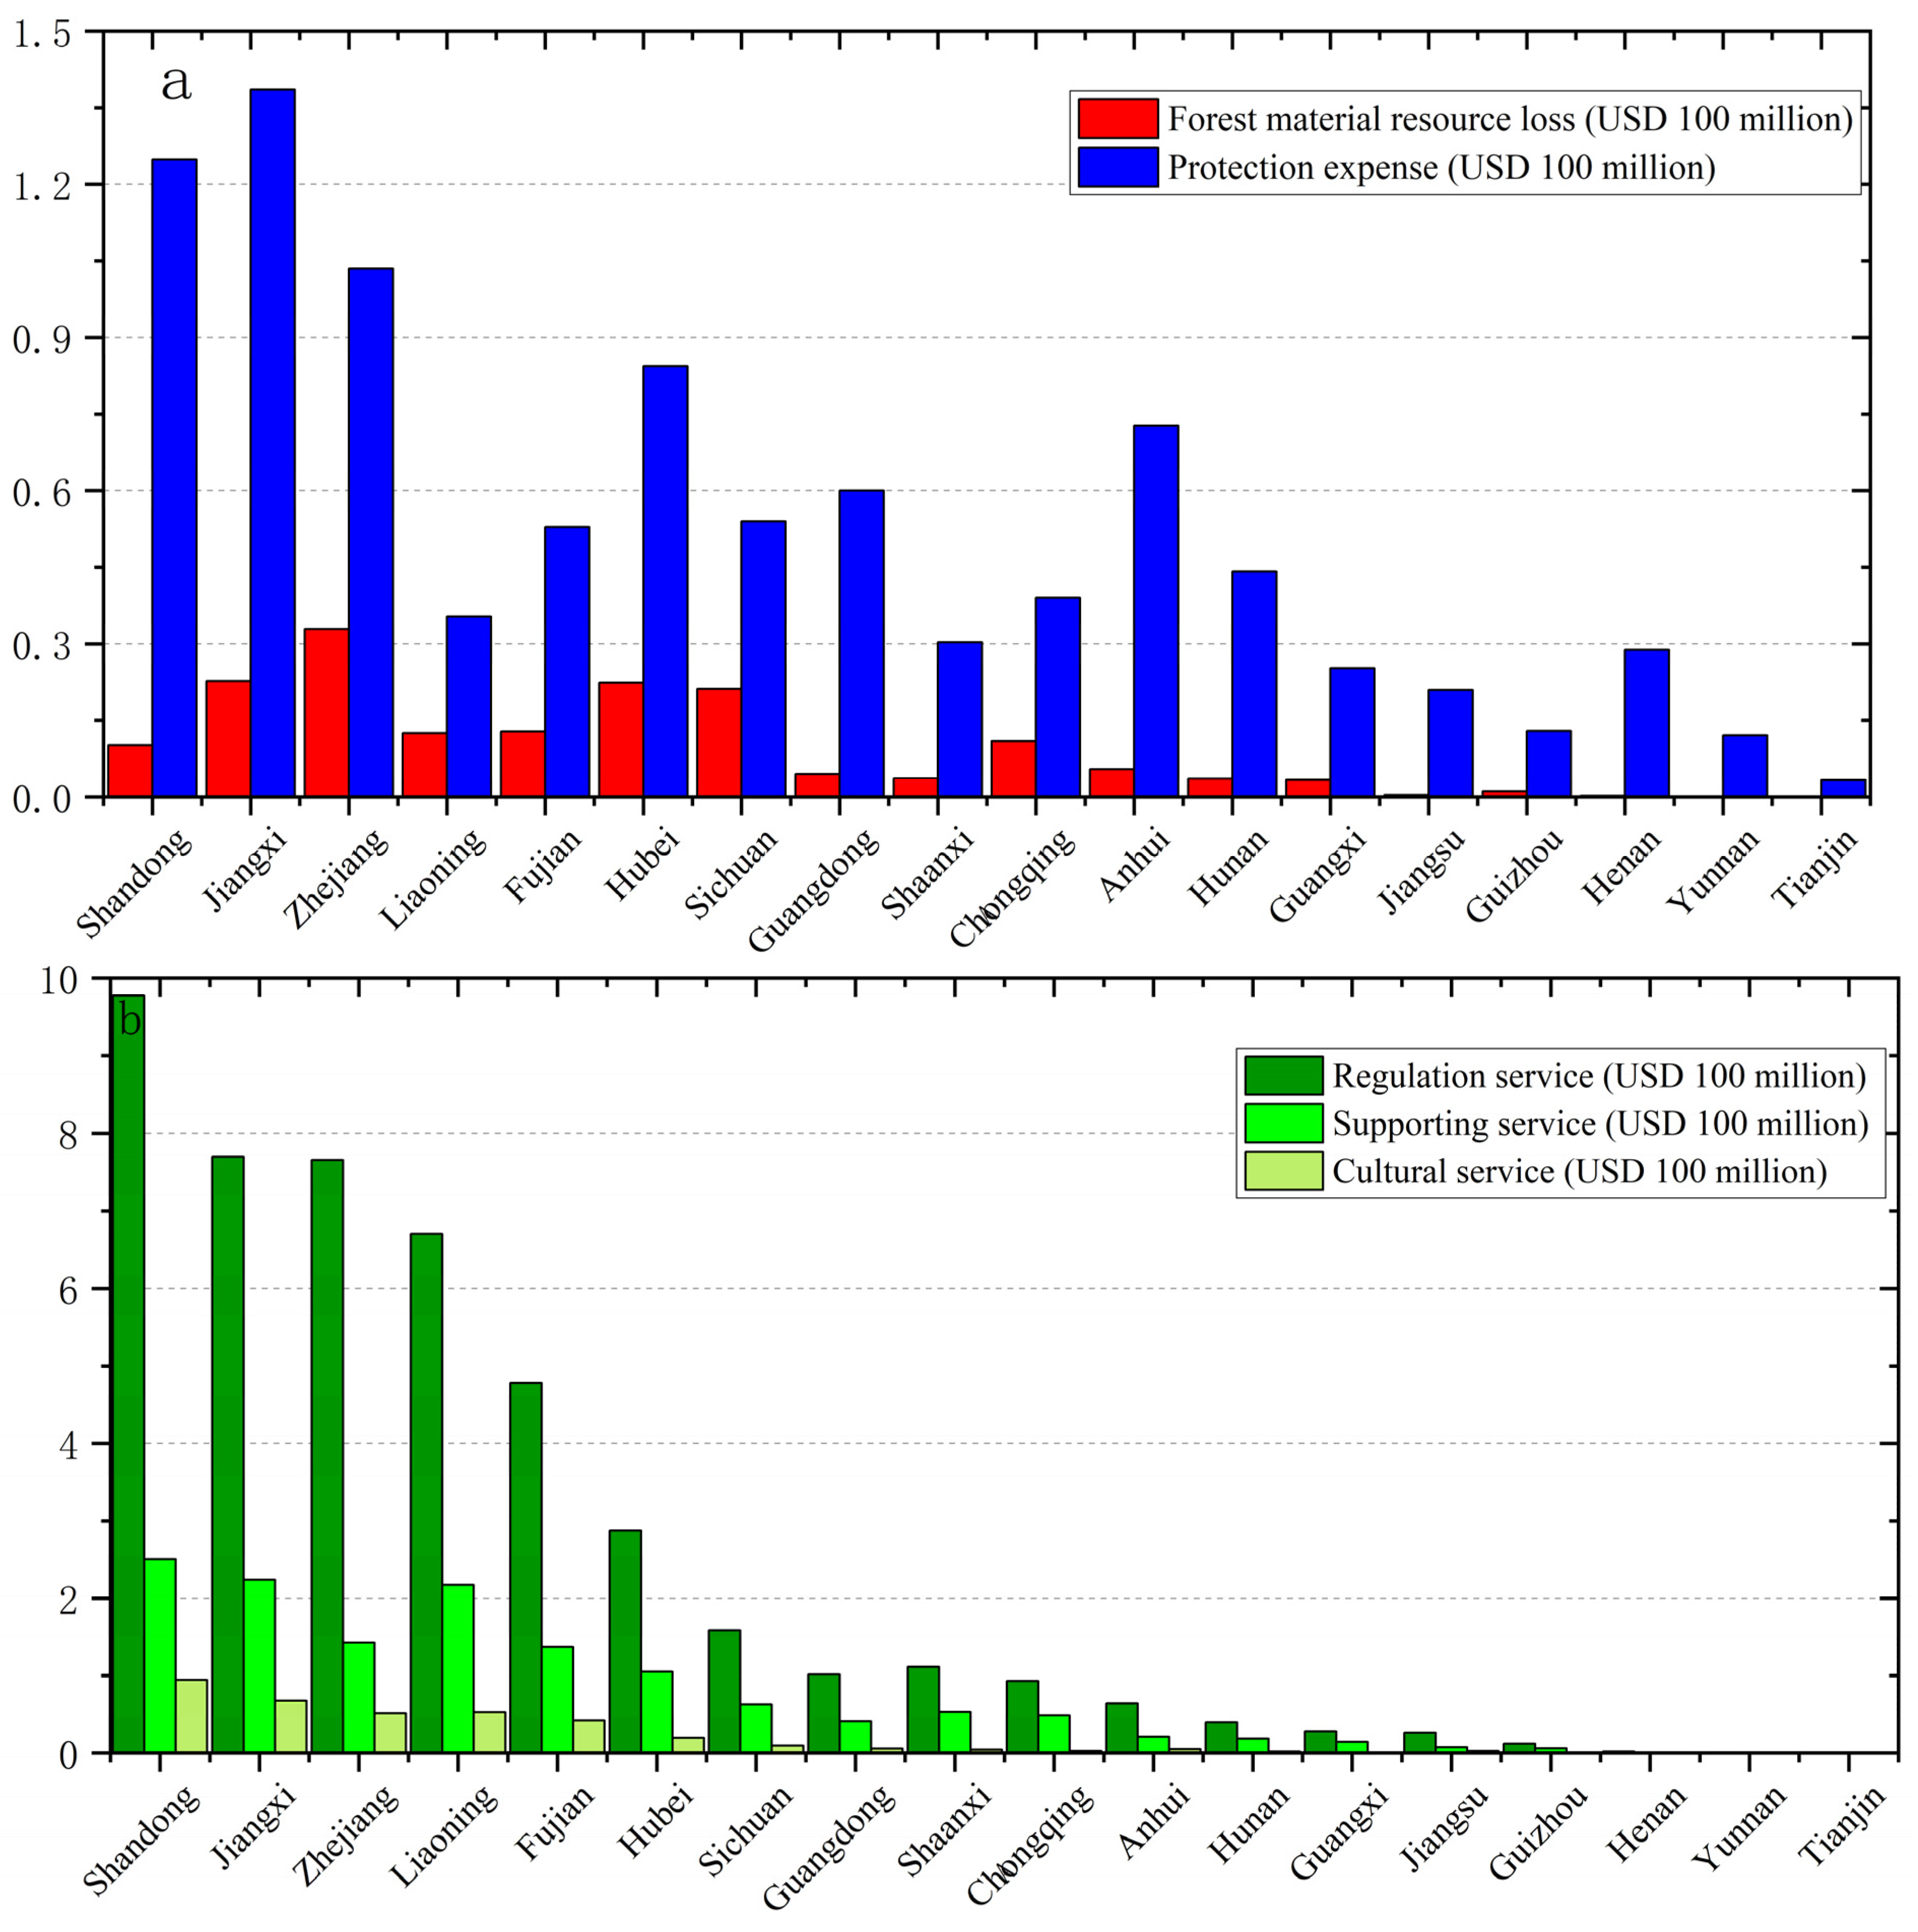
3.3.1. Level 2 Economic Loss Indicator

Among the direct economic loss, the forest material resource loss and protection expense in China in 2020 reached USD 0.17 billion and USD 0.94 billion (Figure 4a). In particular, the forest material resource losses in Zhejiang, Jiangxi, Hubei, and Sichuan exceeded USD 20 million, accounting for 58.56% of the total; there were no forest material resource losses in Yunnan and Tianjin in 2020. Protection expense accounted for 84.56% of the direct economic loss, which was spent by the three provinces (municipalities or autonomous regions) Shandong, Jiangxi, and Zhejiang, amounting to more than USD 100 million.
The level 2 indicator of ecological service value is composed of regulation service, supporting service, and cultural service losses. Regulation service is the primary function of forest ecological service value (Figure 4b), accounting for 72.84% of the ecological service value loss. The percentage of supporting service is 21.44% and that of cultural service function is the lowest, i.e., 5.72%.

3.3.2. Level 3 Economic Loss Indicator

There are 12 level 3 economic loss indicators in this assessment (Table A1). In the overall assessment result, among the economic losses from pine wilt disease in China in 2020, the climate regulation loss was USD 2.22 billion, with the largest percentage of the total loss being 30.01% on average. The average ratios of hydrological regulation, prevention and control inputs, and biodiversity loss fall between 10% and 20%, while those of gas regulation, decontamination environment, soil conservation, aesthetic landscape, and stand volume loss are within 1–10%. The losses of maintaining nutrient cycling, restoration, and forest by-products are below 1% on average.
In terms of the assessment result of each province, Henan inputs more than 90% of its resources toward total prevention and control. Yunnan and Tianjin spend money only on prevention and control. Except for Henan, Yunnan, and Tianjin, the ratios of level 3 economic loss indicators of each province show a generally consistent trend with the overall trend, though there are a few differences. For direct losses, Sichuan and Chongqing suffer the greatest stand volume loss, the forest by-product losses in Guangxi and Anhui are more than those in other provinces, and Guangxi, Chongqing, Hunan, and Sichuan have high restoration costs. In terms of ecological service value loss, gas regulation, climate regulation, decontamination environment, nutrient cycling maintenance, biodiversity, and aesthetic landscape show almost the same trend: Fujian, Jiangxi, and Liaoning have greater losses, while Hunan, Chongqing, Guangxi, and Guizhou have lesser. The hydrological regulation and soil conservation trends are similar: Chongqing and Shaanxi are relatively high, both of which account for more than 20% of the disaster loss of the province, and Anhui, Jiangxi, Fujian, and Jiangsu have lower ratios, all less than 10%.

4. Discussion

This study assessed the economic losses caused by the pine nematode disaster in China in 2020. According to the assessment results, the total economic losses were USD 7.40 billion, direct economic losses were USD 1.11 billion, ecological service value losses were USD 6.29 billion, and ecological service value losses were 5.6 times of direct economic losses.
In the spatial distribution, the pine nematode disease incidence area is heavily concentrated in East and Central China, with Zhejiang, Hubei, and Jiangxi provinces ranking among the top three in the country. The top three total economic losses are Shandong, Jiangxi, and Zhejiang. Protection expense accounts for 84.56% of the direct economic loss, with Shandong, Jiangxi, and Zhejiang provinces accounting for more than USD 100 million in protection expense, ranking as the top three in China. In addition, in terms of loss of ecological services, Jiangxi and Zhejiang, as old epidemic areas, have a large number of cured trees, a large amount of reduced forestless area, and a high loss of ecological services. Although the number of cured trees in Shandong was not the largest in 2020, due to ecological geography and other factors, as well as the existence of scenic spots such as Taishan Forest farm, the ecological service value adjustment coefficient is high, and the final economic loss is also high. In addition, in terms of loss of ecological services, Jiangxi and Zhejiang, as old epidemic areas, have a large number of cured trees, a large amount of reduced forestless area, and a high loss of ecological services. Although the number of cured trees in Shandong was not the largest in 2020, due to ecological geography and other factors, as well as the existence of scenic spots such as Taishan Forest farm, the ecological service value adjustment coefficient is high, and the final economic loss of ecological service value is much higher than that of Jiangxi and Zhejiang. The highest ratio of ecological service losses to direct economic losses is Liaoning, followed by Fujian and Shandong and Zhejiang. Although Liaoning province was a new epidemic area in 2018, in recent years in Liaoning province pine forests have spread over a large area, with pine forests reaching the sea being the most significant feature of China’s northeastern forested areas. Large areas of red pine, oil pine, larch, and camphor pine and other susceptible species will provide greater invasion space for pine wilt nematode disease. Daxinganling, Xiaoxinganling, and other scenic spots also led to a higher adjustment coefficient of ecological location in Liaoning province; therefore, its ecological service value loss was higher [29]. The higher annual precipitation in Fujian province and Zhejiang province affected their spatial and temporal adjustment factors, which in turn increased the ecological service value loss. In addition, the protection expense of Liaoning and Fujian is low, which leads to the direct economic loss being low, so the ratio of these two provinces is high.
We constructed a more complete index system for assessing economic losses of pine wilt nematode disasters. In recent years, there have been few studies on the assessment of economic losses from pine wilt nematode disasters in China, most of which were conducted to construct assessment index systems with regional differences and quantitative calculations for the different ecological and economic conditions in each region. For example, Li et al. [17] assessed the pine wilt nematode disaster losses in Zhejiang province, and compared with this study, this paper included biodiversity services in ecosystem services into the index, and quantitative studies were also performed for climate regulation services. Guo et al. [16] quantitatively assessed the pine wilt nematode disaster losses in Jiangxi province from 2006 to 2010, and compared with this study, this paper included control costs and ineffective forestry costs, and the direct economic loss assessment index system was included. On a national scale, Zhang et al. [19] conducted a quantitative assessment of the national pine wilt nematode disaster economic losses in 2017 from the perspective of direct and indirect economic losses. Compared with this assessment, although this study has similarity in the index system and assessment methods, the assessment results differed significantly, with the direct economic loss of this study being about 2.20 times of the direct economic loss of that study and the ecological service value loss also being about 2.72 times of the indirect economic loss of that study. Zhang et al. [19] used the area of occurrence of pine wood nematode disease as the calculation base, while the present study concluded that the area of occurrence is not equivalent to the actual area of loss, and it is more appropriate to quantitatively assess the actual loss by converting it into the area without forestation. Zhang et al. [19] used annual growth loss per unit area to calculate accumulation loss, while this study concluded that after pine trees were killed or removed by pine wood nematode infestation, the entire volume of wood was lost in the current year, and different criteria for determining accumulation loss led to different assessment results.
This study used the most fine-scale forest small-group data on the occurrence of pine wilt nematode disease in China to date and found that pine wilt nematode disease caused significant economic losses to forest ecosystems in China in 2020. This assessment takes subcompartment data, which cover geographic location, dominant tree species, average DBH, origin of tree species, and other characteristics as the subject matter for the first time. A pine wilt disease indicator system and loss measurement model based on the subcompartment scale are established. It has three characteristics.
Previous studies have mostly taken provincial regions as the assessment units, which is a large scale. Their results are too general to find differences over small ranges [16,17,30]. This assessment is the first to be based on forest subcompartments as the units. Regarding internal homogenized feature data as an important parameter, we combine the number of cleared sick trees in each subcompartment to build a subcompartment scale-based loss measurement model, which achieves accurate short-range assessment and lays a solid foundation for spatio-temporal dynamic assessments. We made assessments based on the stand volume loss at the subcompartment scale. With the non-forested area converted from the average regional stand volume per unit area, we calculated the direct economic loss and ecological service value loss. The result more closely resembles the actual situation. It realizes socialized accounting of ecological service value. In this assessment, the ecological service value adjustment coefficient is set. It further embodies the key role of forest ecosystems in social services from economics, ecology, key functions, and other aspects.
According to the results of the study, the loss of ecological service value in each province is much larger than the direct economic loss, and the average is 5.6 times of the direct economic loss, which is consistent with the results of several previous studies. The value of China’s forest resources was estimated to be USD 1.88 trillion, of which the value of three forest environmental benefits (water conservation, soil protection, and oxygen and nitrogen fixation) was USD 99.14 billion per year, which was three times the value of standing trees and proposed that the overall environmental value should be 6 to 20 times the value of standing trees. [31] In calculating the economic loss of the pine wood nematode disaster in 2016, Shen et al. used the multiplier method to calculate indirect economic loss assessment with specific parameters of 6–20 times [14,32]. Zhang et al. [19] calculated that the indirect economic loss in China in 2017 was 4.6 times the direct economic loss on average.
Direct economic losses include two secondary indicators: forest material resource loss and protection expenses. According to the calculation results, direct economic losses are mainly protection expenses, accounting for about 84.55% of the direct economic losses, most of which are the prevention and control input, accounting for about 79.99% of the direct economic losses. Yunnan and Tianjin are cities without epidemics, so their economic losses were only prevention and control input in 2018. Since then, the central leading comrades attach great importance to the prevention and control of the pine wilt nematode disease epidemic and have provided important instructions many times. In the face of the serious situation of the epidemic, governments at all levels and forestry authorities invested a lot of money into pine nematode disease prevention and management and the implementation of “to clean up sick (dying, dead) pine trees as the core, medium insect control, drilling injection and other auxiliary measures” of the integrated prevention and control strategy, to truly achieve sick and dead pine trees’ “comprehensive eradication, precise eradication and complete eradication”.
The loss of ecological service value includes regulation service loss, supporting service loss, and cultural service loss. The loss of ecological service value is mainly the loss of regulation service and the loss of supporting service, accounting for 94.29% of the loss of ecological service value. The largest loss of regulating services is climate regulation, which accounts for 48.50% of regulating services; the loss of supporting services is mainly biodiversity, which accounts for 61.09% of supporting services. The loss of ecological service value does not only depend on the area of pine nematode disaster, but also the different stand and forest conditions of forest resources in each province make the service value of forest ecosystem not exactly equal, and there are even large differences.
This evaluation alsohas the following limitations.
Although built on previous studies, this assessment puts forward a loss assessment system and measurement model based on the subcompartment scale for the first time. It still has some problems in its actual operations. The following problems affect the accuracy of the assessment results to some degree and need to be improved in the future: losses of related industries such as production, service, and logistics that have nothing to do with the pine wilt epidemic, failure of stock forest prices to reflect regional differences, and general statistics of protection expenses.
Affected by the invisibility of the disaster and accuracy and timeliness of data parameters, the result of this assessment still has some errors compared to the actual loss. Since pests always have an ongoing effect on forests, there is derivative loss that will accumulate in the foreseeable future. In the meantime, with the improvement of our understanding of forest ecological service functions, the ecosystem service value rises as a whole. The value of the ecological service value loss in this assessment represents our current understanding only. In short, the actual economic loss caused by pine wilt disease should be higher than this assessment shows.

5. Conclusions

This assessment is the first to take the ecological subcompartment as the minimum unit. From characteristic parameters, including geographic location, origin, dominant tree species, and average DBH, it builds a smaller-scale system for assessment of loss from pine wilt disease and estimates the values of losses in 2020. The assessment results show that, due to the pine wilt disease, China lost USD 7.40 billion in 2020, including a direct economic loss of USD 1.11 billion and an ecological service value loss of USD 6.29 billion. Through analysis and comparison, we can see that the subcompartment scale-based method is simple and easy and can be flexibly and widely applied. Its result is closer to the actual situation, so it can accurately describe how the stand subcompartments in different regions are affected and how many losses are caused [5,6,9]. Laying a solid foundation for the systematic understanding of pine wilt disease distribution and development, this study offers practical insight into the improvement of forest operation and management and scientific forestry production investment. At the same time, it is important to realize that the disaster loss relief is the lag of disaster propagation and occurrence. How to prevent it effectively, to avoid causing huge losses, is our top priority. We should give priority to prevention and pay more attention to prevention for the 97% of healthy pine forests while providing treatment for the 3% of infected pine forests. We suggest strengthening monitoring and early warning and promptly carrying out research on emergency prevention and control technology.

Author Contributions

Conceptualization, G.F.; methodology, F.L. and T.D.; validation, F.L. and T.D.; formal analysis, F.L.; resources, G.F.; data curation, H.S.; writing—original draft, F.L., T.L. and N.D.; writing—review and editing, J.H.; project administration, J.H. and G.F. All authors have read and agreed to the published version of the manuscript.

Funding

Major National Key R&D Program of China (2021YFD1400900); Operation subsidy Project of Forestry Science and Technology Innovation platform of State Forestry and Grassland Administration (2020132304).

Data Availability Statement

Not applicable.

Conflicts of Interest

The authors declare no conflict of interest.

Appendix A

Table A1. Level 3 indicators of economic loss from pine wilt disease (unit: USD million).
RegionStand Volume LossForest By-Product LossPrevention and Control InputRestoration CostsGas RegulationClimate RegulationDecontamination EnvironmentHydrological RegulationSoil ConservationMaintain Nutrient CyclingBiodiversityAesthetic Landscape
Shandong10.140.00120.953.91196.02584.60171.8125.1415.5118.45216.7894.55
Jiangxi22.060.61133.555.02139.76416.80122.4990.9156.0713.15154.5567.41
Zhejiang30.901.9593.829.66106.27316.9593.15249.5415.4510.00117.5351.26
Liaoning12.420.0827.367.97109.09325.3495.61139.8286.2310.27120.6452.62
Fujian11.301.5045.557.3387.63261.3576.8152.0132.088.2596.9142.27
Hubei21.181.2082.042.3440.27120.1135.3091.6656.533.7944.5419.43
Sichuan21.110.0350.053.9419.3157.5916.9264.2639.631.8221.359.31
Guangdong4.040.4258.311.7011.8635.3810.4043.9327.101.1213.125.72
Shaanxi3.450.1528.861.458.8526.407.7668.2142.070.839.794.27
Chongqing10.850.0436.032.955.0715.134.4568.3742.170.485.612.45
Anhui4.660.7771.321.4110.4031.029.1213.628.400.9811.505.02
Hunan3.340.2242.701.453.339.942.9223.6114.560.313.681.61
Guangxi2.900.4724.121.101.775.291.5519.5412.050.171.960.86
Jiangsu0.390.0020.800.164.8614.484.262.561.580.465.372.34
Guizhou1.090.0012.530.370.732.180.648.425.190.070.810.35
Henan0.220.0128.740.080.250.750.220.620.380.020.280.12
Yunnan0.000.0012.080.000.000.000.000.000.000.000.000.00
Tianjin0.000.003.320.000.000.000.000.000.000.000.000.00
Total160.027.46892.1350.84745.492223.31653.40962.22455.0170.16824.42359.59

References

  1. Yan, J. Economic Analysis and Countermeasure of Forest Bio-Disaster Management in China; Beijing Forestry University: Beijing, China, 2008. [Google Scholar]
  2. Pan, C.S. Development of Studies on Pinewood Nematodes Diseases. J. Xiamen Univ. 2011, 50, 476–483. [Google Scholar]
  3. Ye, J.R. Epidemic Status of Pine Wilt Disease in China and Its Prevention and Control Techniques and Counter Measures. Sci. Silvae Sin. 2019, 55, 1–10. [Google Scholar]
  4. Wang, X.Z.; Cao, Y.F.; WANG, L.F.; Piao, C.G.; Li, C.L. Current Status of Pine Wilt Disease and Its Control Status. J. Environ. Entomol. 2018, 40, 256–267. [Google Scholar]
  5. Li, S.; Sun, H.; Zhou, Y.T.; Li, X.D.; Yu, Z.J.; Dong, Z.H. Occurrence of Major Forestry Pests in China in 2021 and Forecast of Their Occurrence Trend in 2022. For. Pest Dis. 2022, 41, 44–47. [Google Scholar] [CrossRef]
  6. Li, Y.X.; Zhang, X.Y. Analysis on the Trend of Invasion and Expansion of Bursaphelenchus Xylophilus. For. Pest Dis. 2018, 37, 1–4. [Google Scholar]
  7. Miller, J.M.; Patterson, J.E. Preliminary Studies on the Relation of Fire Injury to Bark-Beetle Attack in Western Yellow Pine; USDA: Washington, DC, USA, 1927. [Google Scholar]
  8. Meinecke, E.P. Evaluation of Loss from Killing Diseases in the Young Forest. J. For. 1928, 26, 283–298. [Google Scholar]
  9. Chester, K.S. Plant Disease Losses: Their Appraisal and Interpretation. Biology 1950. [Google Scholar] [CrossRef]
  10. Wang, J.B. The Study on Economic Analysis and Its Prevention and Control Stratigies China’s Forest Biological Disasters; Chinese Academy of Forestry Sciences: Beijing, China, 2013. [Google Scholar]
  11. Costanza, R.; d’Arge, R.; de Groot, R.; Farber, S.; Grasso, M.; Hannon, B.; Limburg, K.; Naeem, S.; O’Neill, R.V.; Paruelo, J.; et al. The Value of the World’s Ecosystem Services and Natural Capital. Ecol. Econ. 1998, 25, 3–15. [Google Scholar] [CrossRef]
  12. Sutton, P.C.; Costanza, R. Global Estimates of Market and Non-Market Values Derived from Nighttime Satellite Imagery, Land Cover, and Ecosystem Service Valuation. Ecol. Econ. 2002, 41, 509–527. [Google Scholar] [CrossRef]
  13. Sannigrahi, S.; Bhatt, S.; Rahmat, S.; Paul, S.K.; Sen, S. Estimating Global Ecosystem Service Values and Its Response to Land Surface Dynamics during 1995–2015. J. Environ. Manag. 2018, 223, 115–131. [Google Scholar] [CrossRef]
  14. Su, H.J.; You, D.K.; Chang, G.B.; Zhao, J.; Zhang, Z.R.; Qiu, L.X. Principle and Theoretical Basis of Economic Loss Assessment of Forest Pest Disasters. For. Pest Dis. 2004, 3, 1–4. [Google Scholar]
  15. Song, Y.S.; Su, H.J.; Yu, H.Y.; Qu, T.; Chang, G.B.; Zhao, J. Evaluation of Economic Losses Caused by Forest Pest Disasters between 2006 and 2010 in China. For. Pest Dis. 2011, 30, 1–4+24. [Google Scholar]
  16. Guo, X.H.; Jiang, P.W.; Chang, E.Z.; Sun, N. Research on the Loss Evaluation Index System of Bursaphelenchus Xylphilus Nickle Invading China. Liaoning For. Sci. Technol. 2008, 16, 5–8. [Google Scholar]
  17. Li, L.Y.; Gao, L.; Wen, Y.L.; Shen, Y.Q. Environmental Impact Eco-Assessment of Pine Wood Nematode in Zhejiang Province. For. Econ. 2009, 8, 68–73. [Google Scholar]
  18. Soliman, T.; Mourits, M.C.M.; van der Werf, W.; Hengeveld, G.; Robinet, C.; Lansink, A.O. Framework for Modelling Economic Impacts of Invasive Species, Applied to Pine Wood Nematode in Europe. PLoS ONE 2012, 7, e45505. [Google Scholar] [CrossRef] [Green Version]
  19. Zhang, X.; Zhao, J.J.; Yan, J.; Fang, G.F.; Huang, J.X. Economic Loss Assessment of Pine Wilt Disease in China’s Mainland in 2017. J. Beijing For. Univ. 2020, 42, 96–106. [Google Scholar]
  20. Zhao, J.J.; Huang, J.X.; Yan, J.; Fang, G.F. Economic Loss of Pine Wood Nematode Disease in Mainland China from 1998 to 2017. Forests 2020, 10, 1042. [Google Scholar] [CrossRef]
  21. Liang, Q.L.; Liu, P.; Chen, M.; Liu, Z.J.; Song, Z.H.; Su, Y.L. Research Review on Forest Pest Disaster Losse Assessment. For. Resour. Manag. 2015, 2, 139–144. [Google Scholar]
  22. Liu, Q.J.; Meng, S.W.; Zhou, H. Tree Volume Tables of China; China Forestry Publishing House: Beijing, China, 2017; ISBN 978-7-5038-8935-6. [Google Scholar]
  23. Chang, G.B.; Su, H.J.; You, D.K.; Zhao, J.; Mei, L.J.; Dong, X.B. Estimate Method for the Economic Losses of Forest Pest Disasters. For. Pest Dis. 2004, 4, 1–5. [Google Scholar]
  24. Xie, G.D.; Xiao, Y.; Lu, C.X. Study on Ecosystem Services: Progress, Limitation and Basic Paradigm. J. Plant Ecol. 2006, 30, 191–199. [Google Scholar]
  25. Xie, G.D.; Zhang, C.X.; Zhang, L.M.; Chen, W.H.; Li, S.M. Improvement of the Evaluation Method for Ecosystem Service Value Based on Per Unit Area. J. Nat. Resour. 2015, 30, 1243–1254. [Google Scholar]
  26. Xie, G.D.; Zhang, C.X.; Zhang, C.S.; Xiao, Y.; Lu, C.X. The Value of Ecosystem Services in China. Resour. Sci. 2015, 37, 1740–1746. [Google Scholar]
  27. Niu, H.P.; Zhang, A.L. Method of Measuring Ecological and Social Benefits of Cultivated Land and Its Application. Trans. Chin. Soc. Agric. Eng. 2010, 26, 316–323. [Google Scholar]
  28. National Forestry and Grassland Administration. Forestry Development Zoning of China; National Forestry and Grassland Administration: Beijing, China, 2011; ISBN 978-7-5038-6131-4. [Google Scholar]
  29. Zheng, Y.N.; Liu, P.X.; Shi, Y.; Wu, H.; Yu, H.Y.; Jiang, S.W. Difference Analysis on Pine Wilt Disease between Liaoning Province of Northeastern China and Other Epidemic Areas in China. J. Beijing For. Univ. 2011, 43, 155–160. [Google Scholar]
  30. Shen, C.Z.; Wen, X.S.; Li, L.H.; Hou, P.H.; Long, Y.; Li, G.D. Evaluation of Disasters Losses Caused by Forest Pests in Jiangxi Province. Chin. Geogr. Sci. 2012, 29, 28–31. [Google Scholar]
  31. Yang, X.H.; Jiang, J.L. Economic Loss Assessment of Forest Pest and Disease Disasters in Guangxi. Guangxi For. Sci. 2005, 1, 21–25. [Google Scholar]
  32. Zhao, A.X.; Ma, Z.J. Appraising study for the loss evaluation system of natural disasters. J. Nat. Disasters 1993, 3, 1–7. [Google Scholar]
Figure 1. Epidemic subcompartments distribution of pine wilt disease in China in 2020.
Forests 14 00139 g001
Figure 2. Losses caused by pine wilt disease in different regions in 2020. (a) Number of cleared trees, volume loss, and non-forested area. (b) Economic loss.
Forests 14 00139 g002
Figure 3. Spatial distribution of loss from pine wilt disease in China in 2020. (a) Total economic loss. (b) Ratio of ecological service loss to direct economic loss.
Forests 14 00139 g003
Figure 4. Level 2 economic loss indicators from pine wilt disease in different regions in 2020. (a) Direct economic loss indicators. (b) Ecological service value loss indicators.
Forests 14 00139 g004
Table 1. Assessment indicator system for economic loss from pine wilt disease.
Level 1 IndicatorLevel 2 IndicatorLevel 3 Indicator
Direct economic lossForest material resource lossStand volume loss
Forest by-product loss
Protection expensePrevention and control input
Restoration costs
Ecological service value lossRegulation service lossGas regulation
Climate regulation
Decontamination environment
Hydrological regulation
Supporting service lossSoil conservation
Maintain nutrient cycling
Biodiversity
Cultural service lossAesthetic landscape
Table 2. Description of calculation parameters for assessment of loss from pine wilt disease.
ParameterMethod of ObtainingValue
Forest by-product (pine resin and cone)Market investigationThe outputs of pine resin from single pines are as follows: mason pine, Pinus kesiya, and slash pine 4.5 kg/tree, Pinus yunnanensis 3.0 kg/tree, unit price: USD 2/kg
Pine nut output of a single tree: 1.125 kg, USD 15/kg
Stock forest priceBy referring to the calculation method of Chang et al. [23], the currency level of 2020 is converted using the gross output value indicator of forestryPinus sylvestris, Pinus yunnanensis, Pinus densata, and Pinus kesiya: USD 94/m3;
Mason pine, Chinese pine, Pinus densiflora, Pinus thunbergii, and Pinus armandii: USD 90/m3
Korean pine: USD 111/m3
Ecological restoration costs per unit areaBy referring to the Guide on Estimation of Investment in Ecological Protection and Restoration Project in Key Areas (Trial Implementation)Mid-temperate zone: USD 2247/ha;
Warm temperature zone: USD 2160/ha;
Subtropical zone: USD 2001/ha;
Tropical zone: USD 2320/ha;
Disclaimer/Publisher’s Note: The statements, opinions and data contained in all publications are solely those of the individual author(s) and contributor(s) and not of MDPI and/or the editor(s). MDPI and/or the editor(s) disclaim responsibility for any injury to people or property resulting from any ideas, methods, instructions or products referred to in the content.

