
Modeling Degraded Bamboo Shoots in Southeast China
Abstract
:1. Introduction
2. Materials and Methods
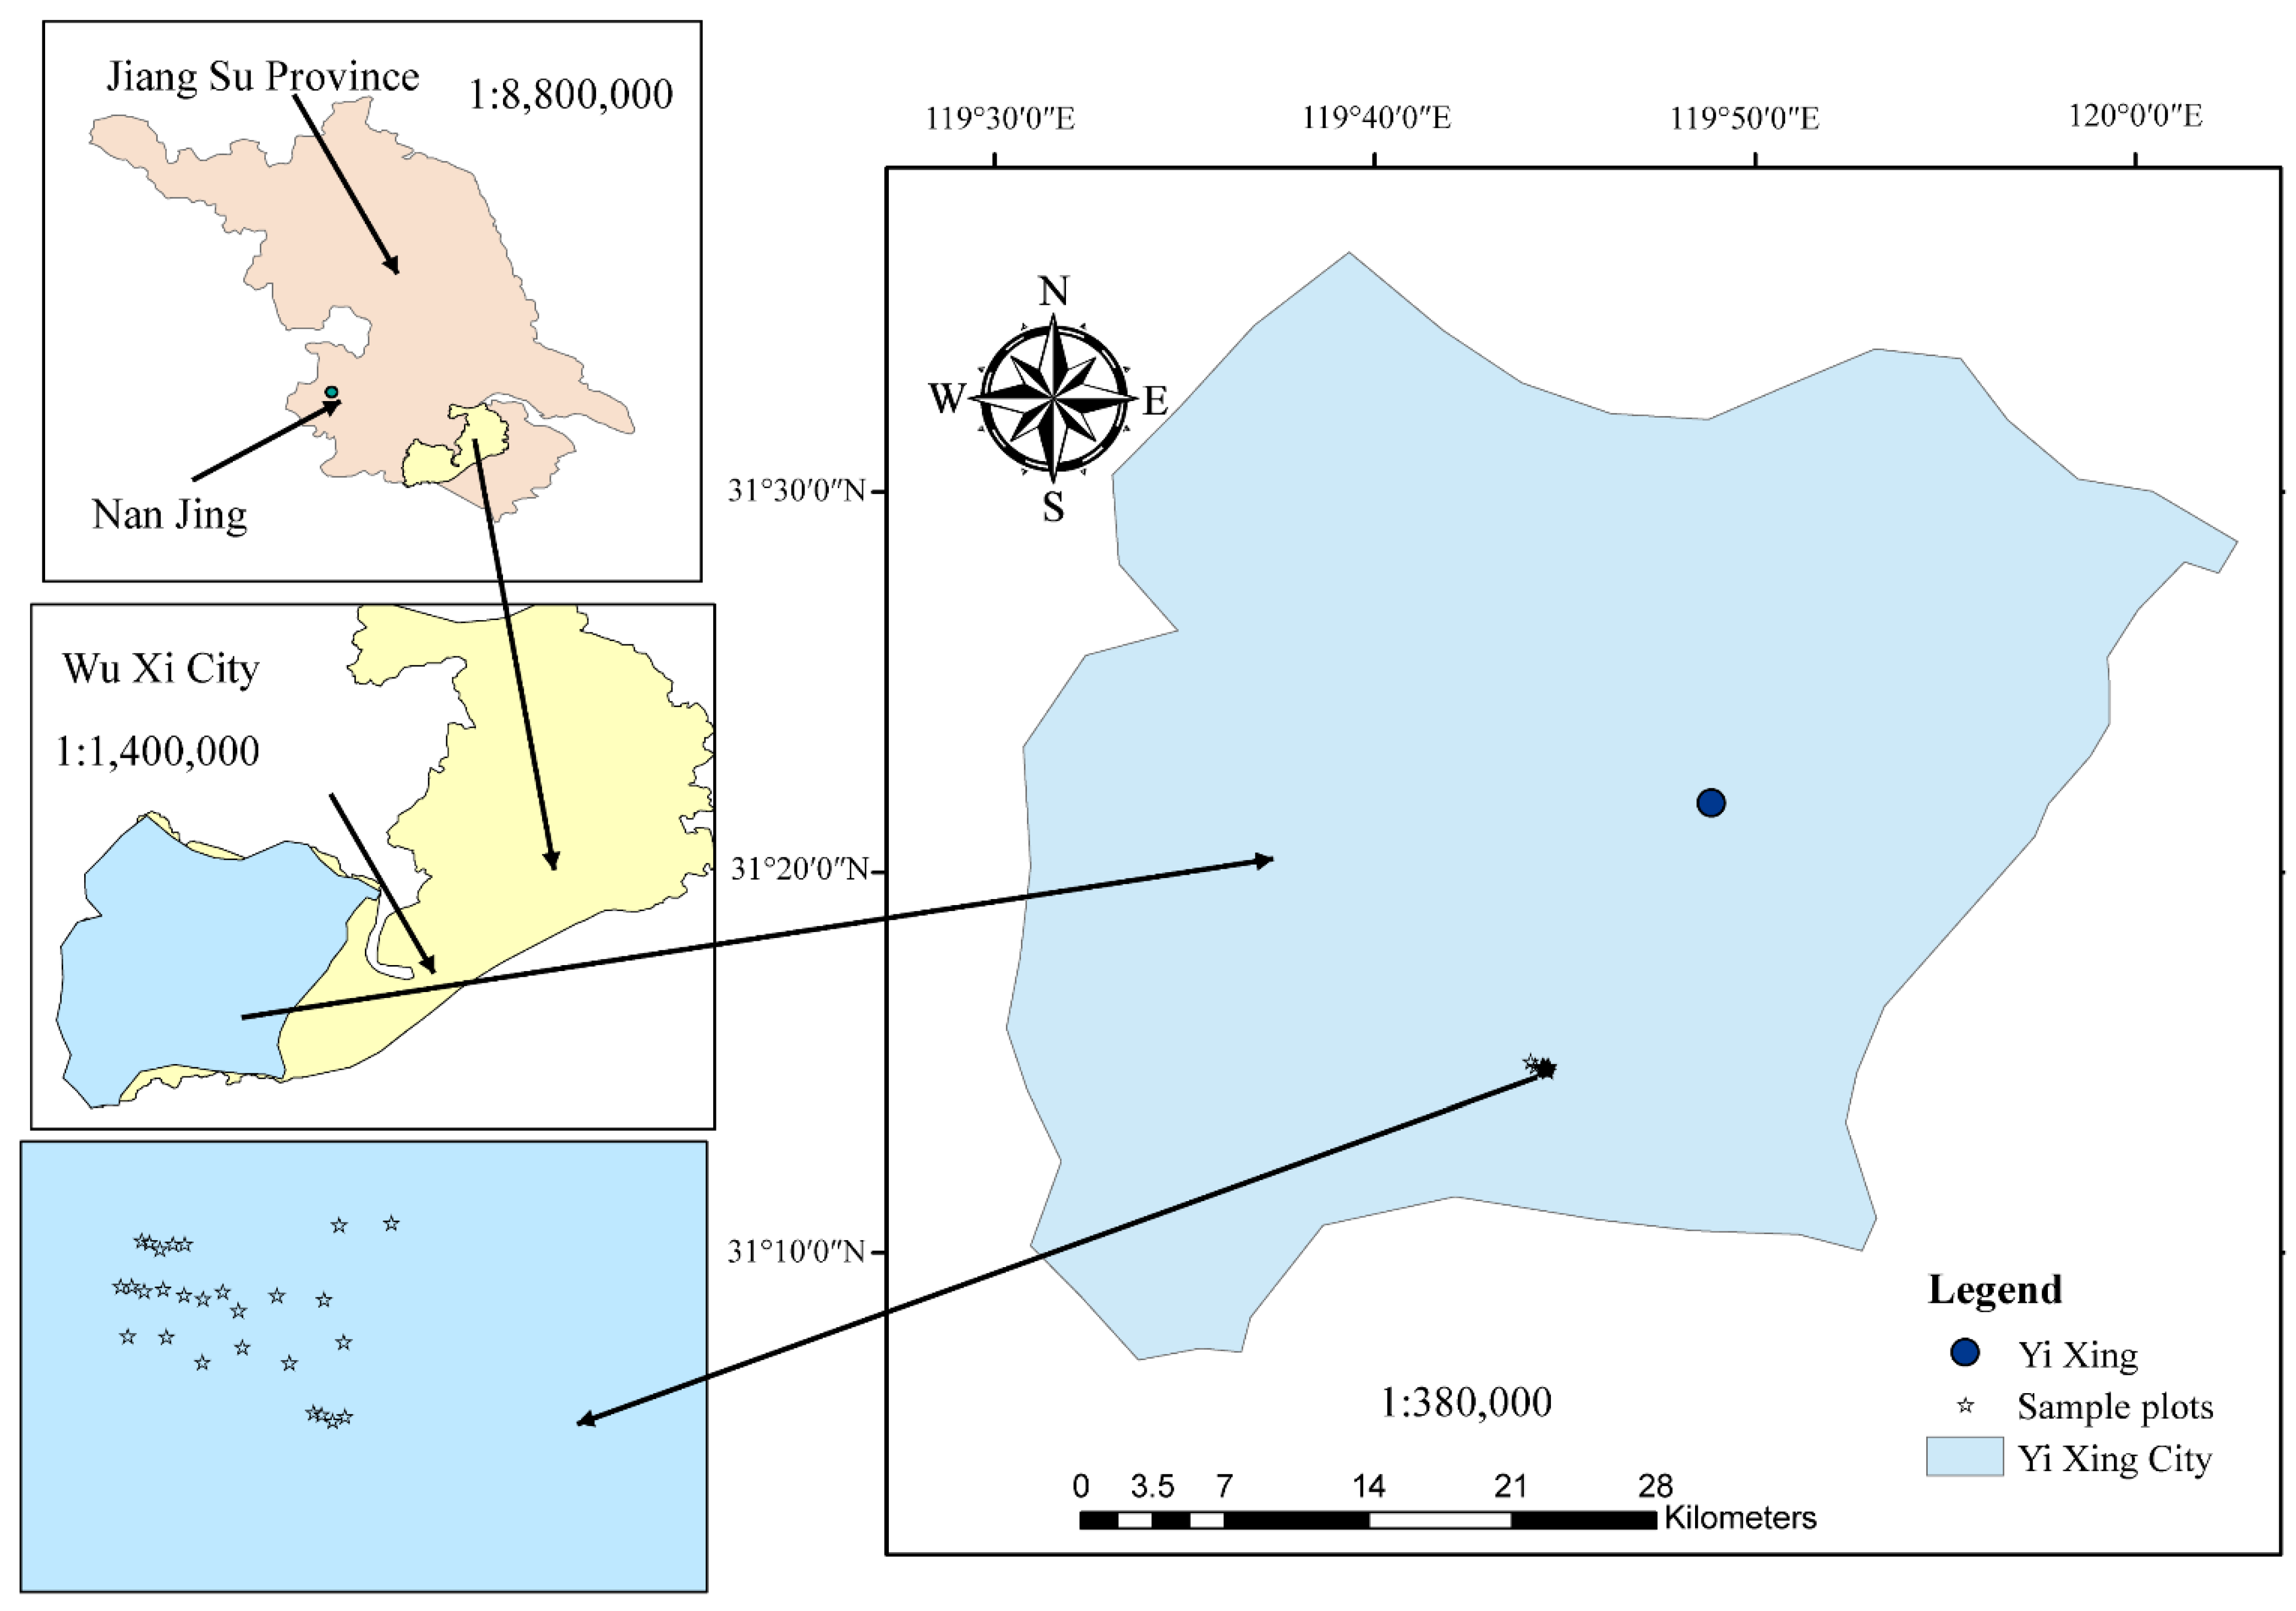
2.1. Study Site
2.2. Sampling and Measurement of DBS
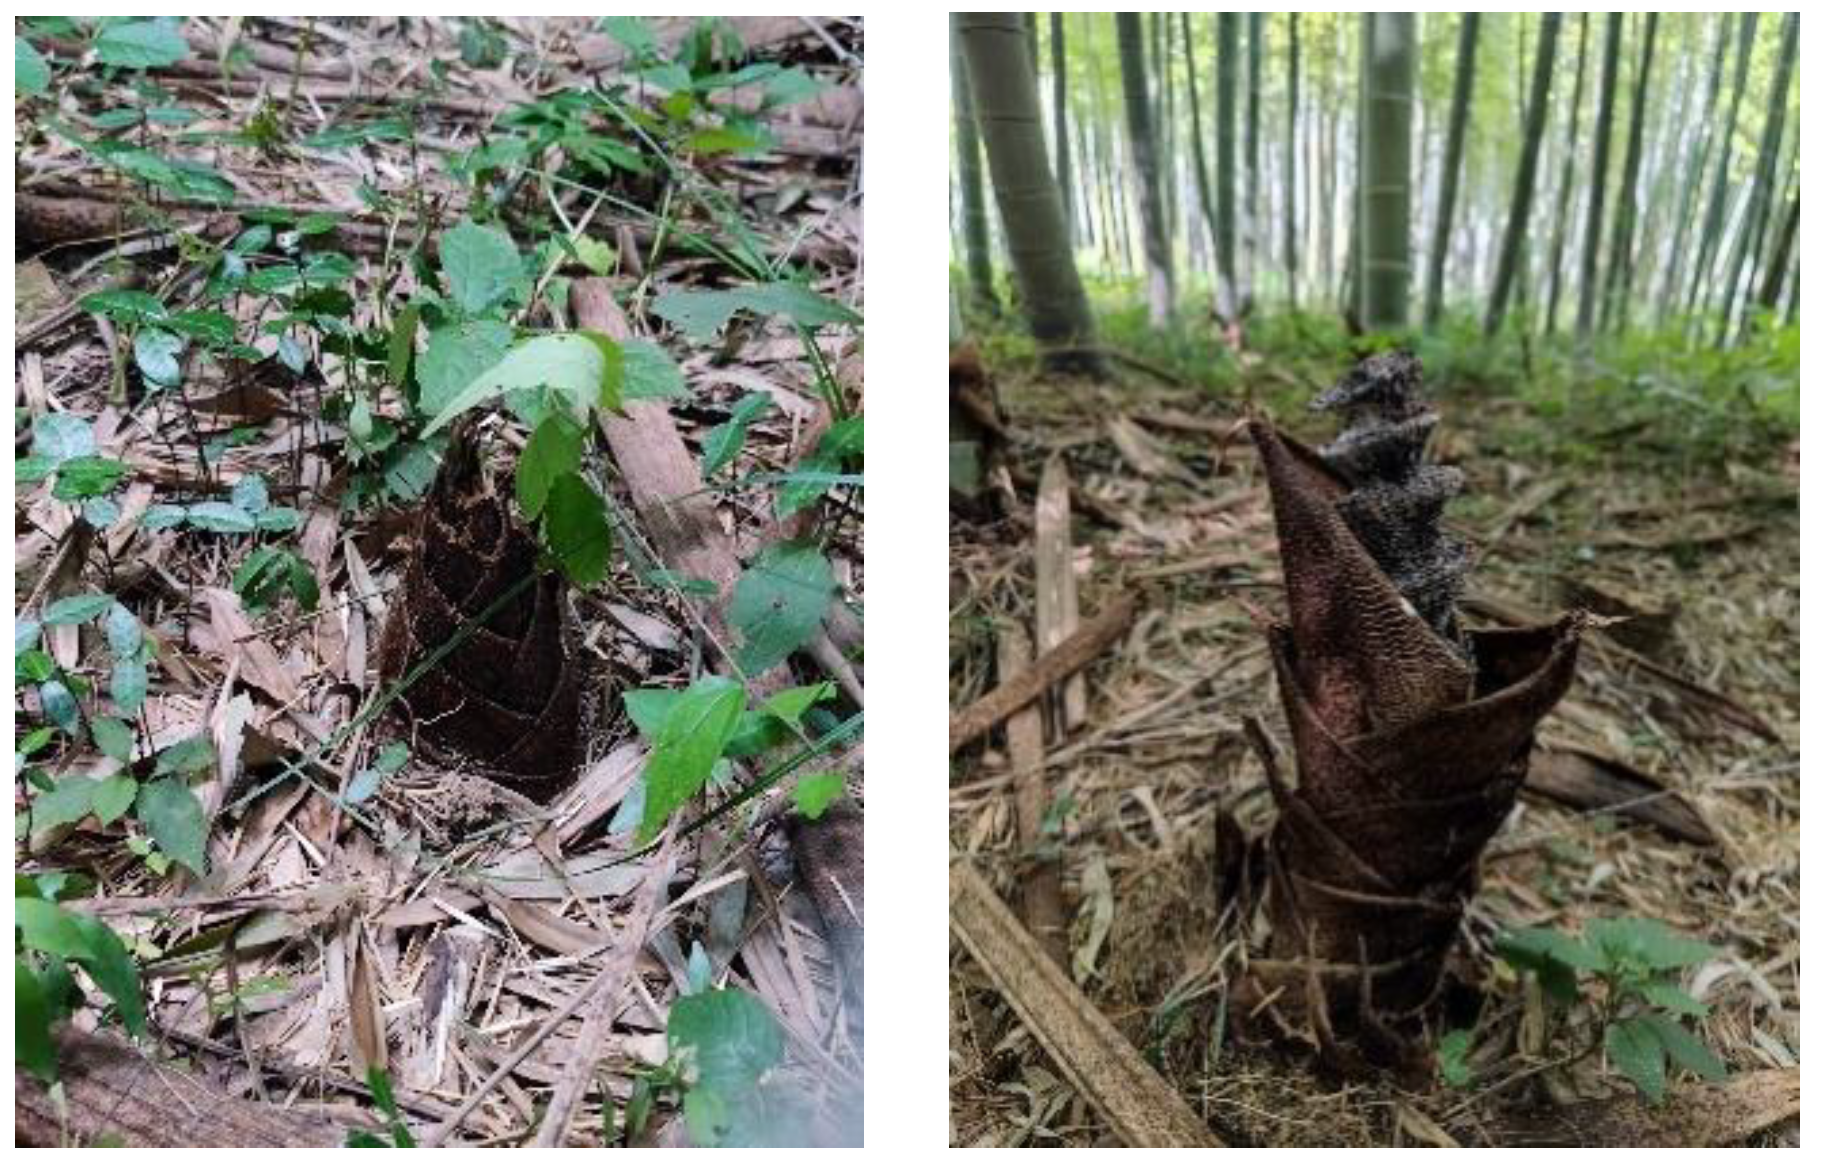
2.2.1. Distinguishing Degraded Bamboo Shoots (DBS)
2.2.2. Degraded Bamboo Shoots (DBS) Investigation
2.2.3. Sample Plots Soil Sampling
2.2.4. Determination of Soil Nutrients
2.3. Determination of Predictor Variables
2.4. Candidate Models
2.5. Mixed-Effects Models
2.6. Model Evaluation
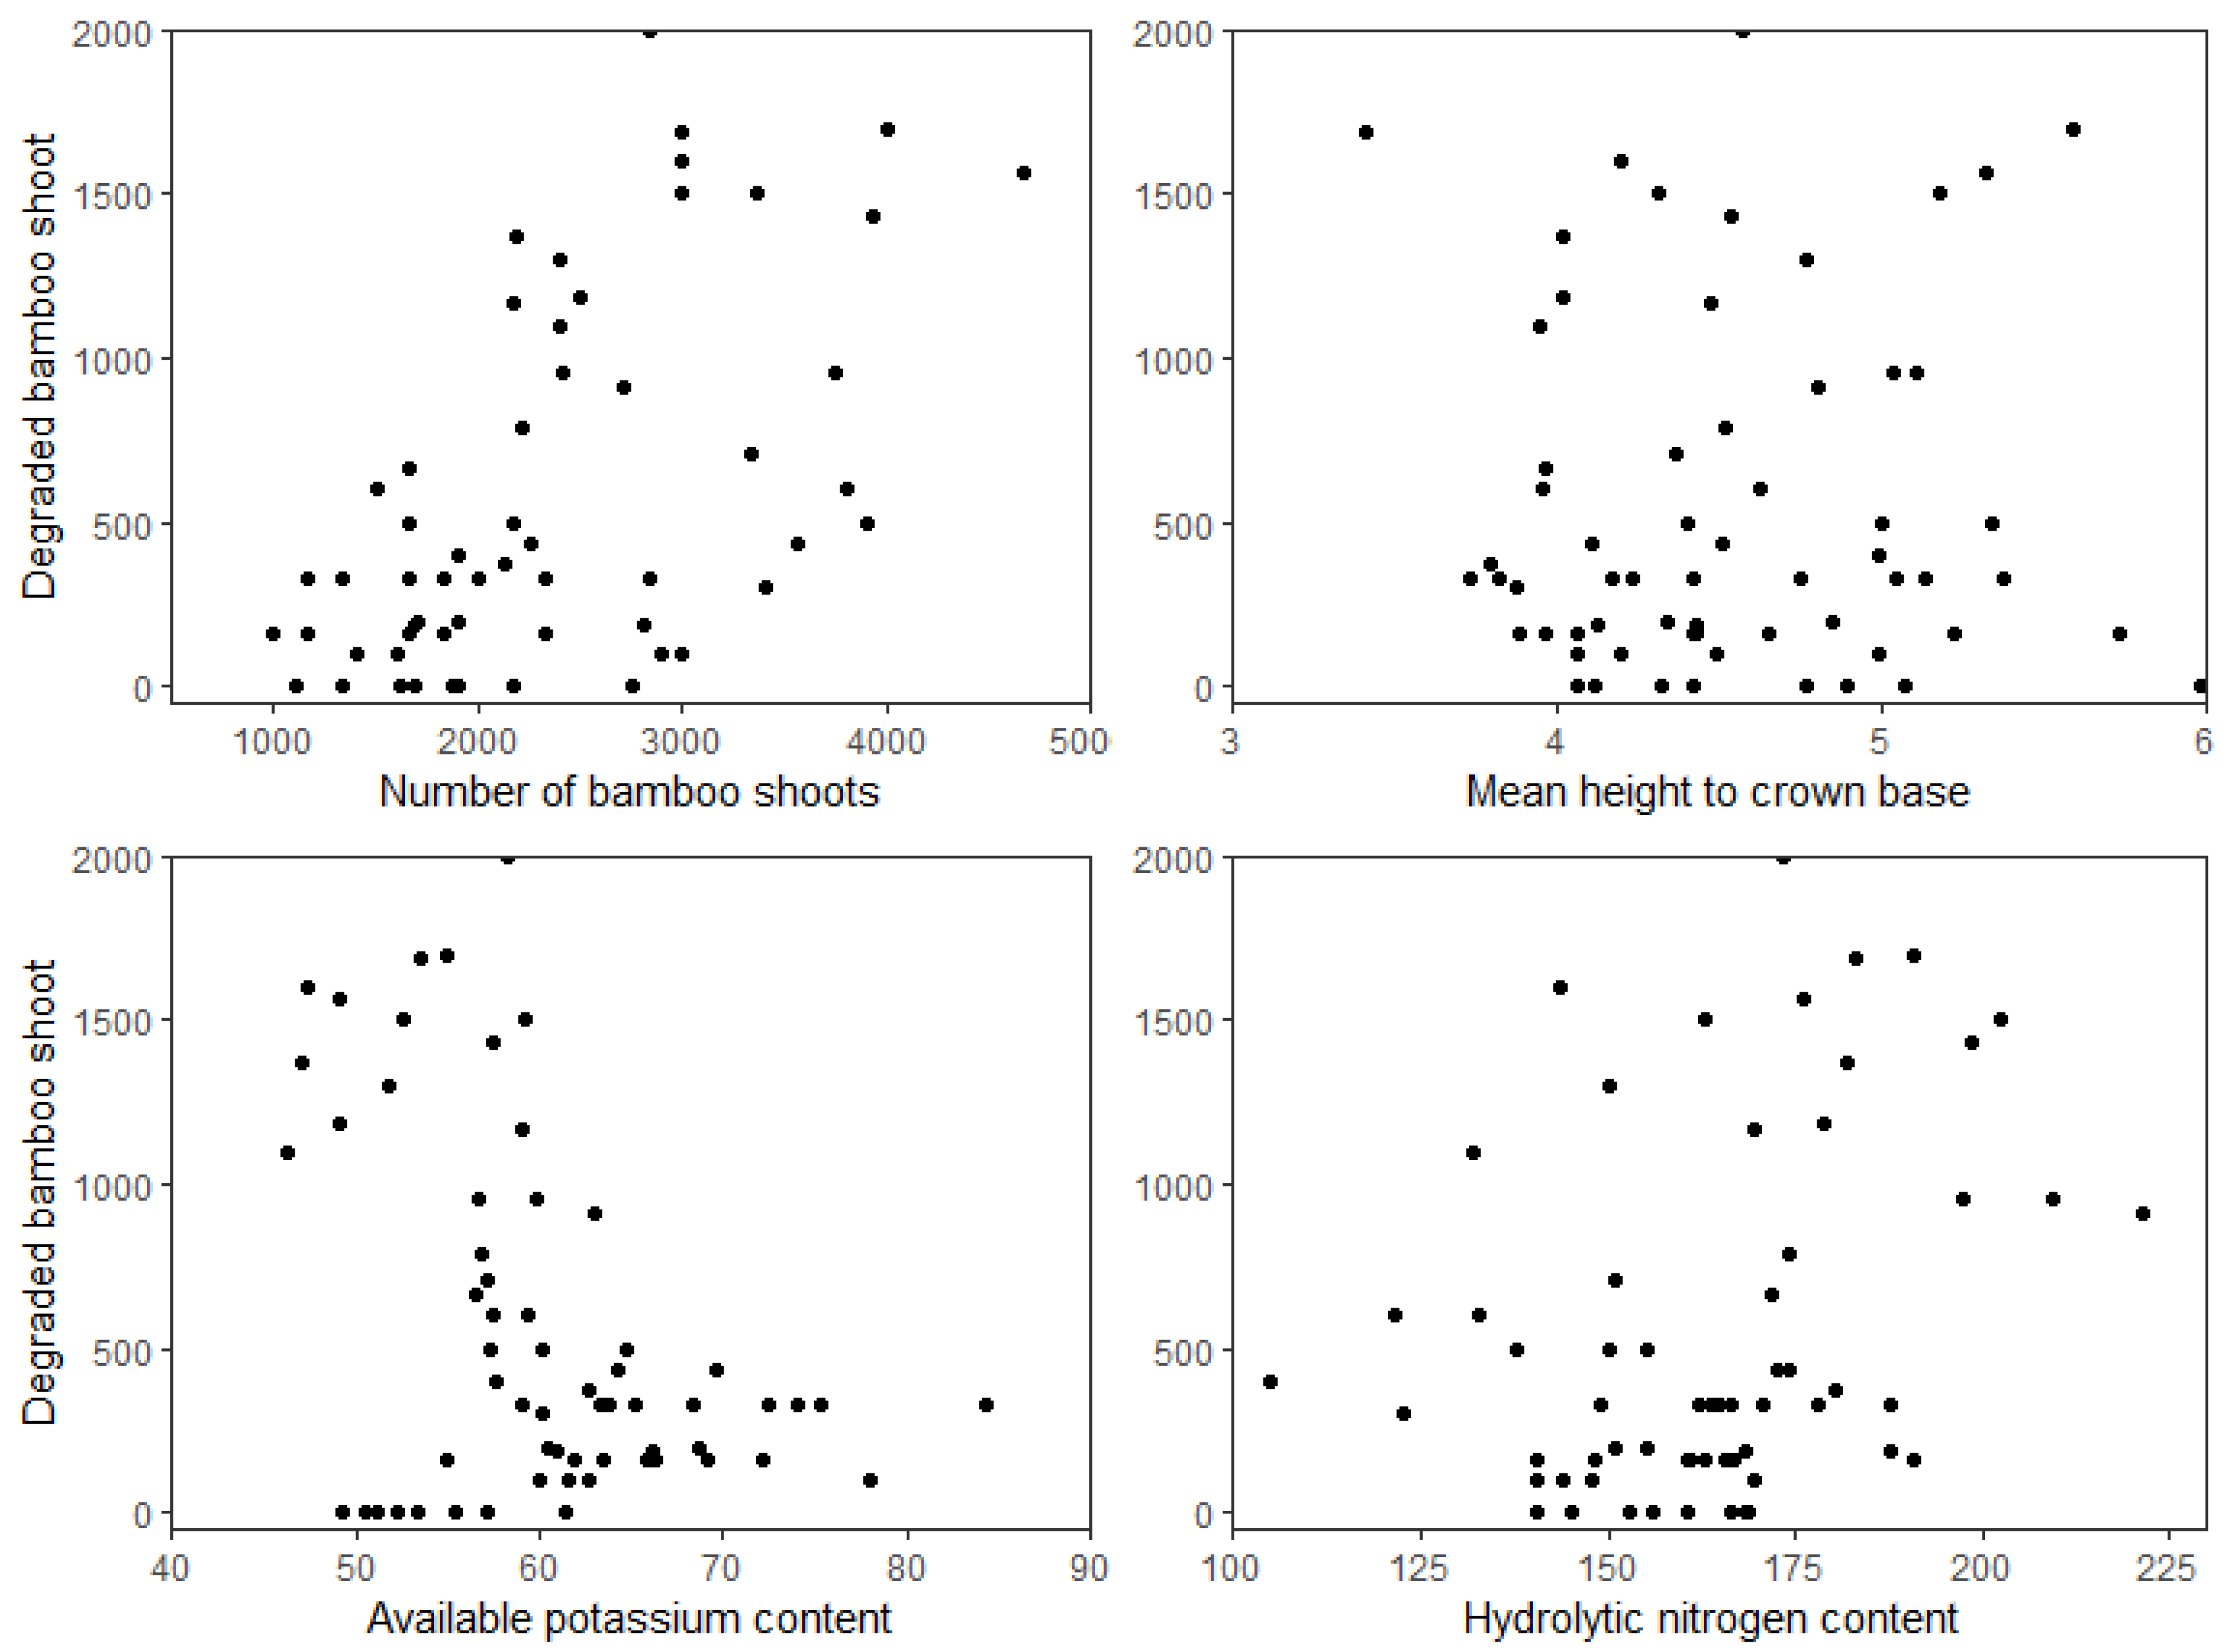
3. Results
3.1. Basic Models
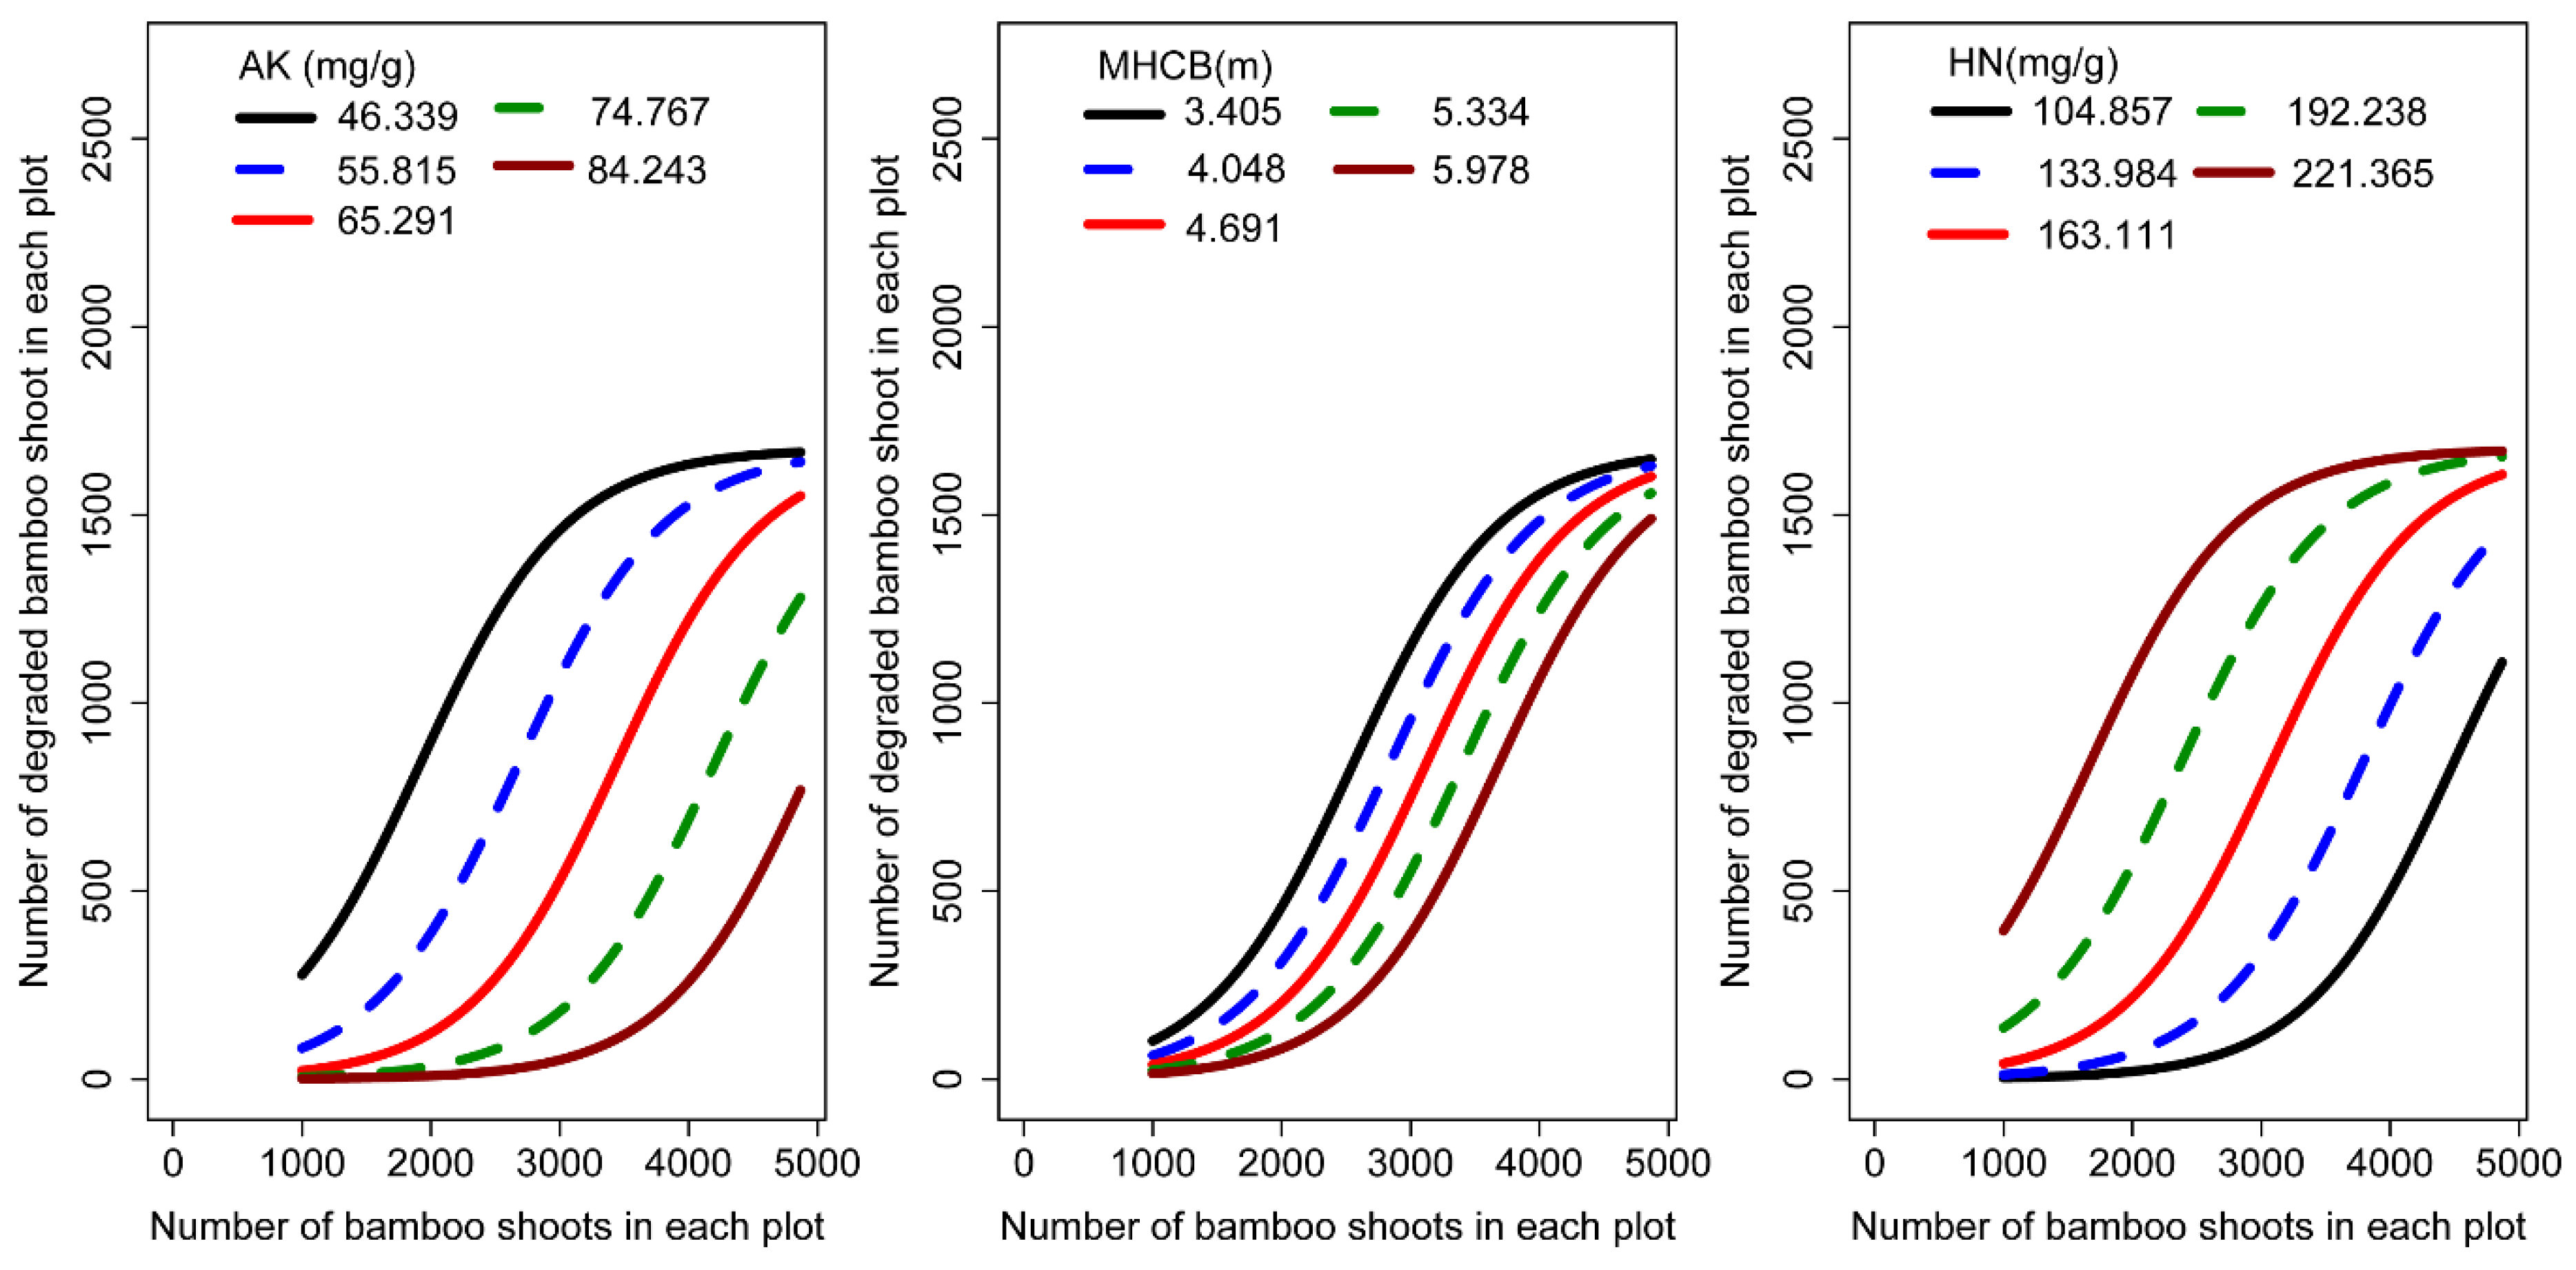
3.2. NLME Models
3.3. Parameter Estimates
3.4. Model Evaluation
4. Discussion
5. Conclusions
Author Contributions
Funding
Data Availability Statement
Acknowledgments
Conflicts of Interest
References
- Fu, J.H. Chinese Moso bamboo: Its importance. BAMBOO Mag. Am. Bamboo Soc. 2001, 22, 5–7. [Google Scholar]
- Song, X.Z.; Zhou, G.M.; Jiang, H.; Yu, S.Q.; Fu, J.H.; Li, W.Z.; Wang, W.F.; Ma, Z.H.; Peng, C.H. Carbon sequestration by Chinese bamboo forests and their ecological benefits: Assessment of potential, problems, and future challenges. Environ. Rev. 2011, 19, 418–428. [Google Scholar] [CrossRef]
- Scurlock, J.; Dayton, D.; Hames, B. Bamboo: An overlooked biomass resource? Biomass Bioenergy 2000, 19, 229–244. [Google Scholar] [CrossRef]
- Zhang, X.Q.; Lei, Y.C.; Liu, X.Z. Modeling stand mortality using Poisson mixture models with mixed-effects. iForest-Biogeosciences For. 2014, 8, 333. [Google Scholar] [CrossRef]
- Yue, J.; Yuan, N.; Gu, X.; Wu, X.; Yuan, J. Studies on the Abortion of Bamboo Shoots. J. Bamboo Res. 2018, 37, 25–31. (In Chinese) [Google Scholar]
- Bai, R.H.; Pan, Y.H.; Shi, Q.T.; Wang, S.D. Nutrient component of the degraded bamboo shoots of Phyllostachys heterocycla var pubescens. J. Bamboo Res. 2011, 30, 23–26. [Google Scholar]
- Chen, A.L.; Zhao, W.Q.; Ruan, Y.Q.; Guo, C.C.; Zhang, W.G.; Shi, J.M.; Yang, G.Y.; Yu, F. Regulation of shoot emergence and degradation and the changes of nutrient composition during degradation of Phyllostachys edulis ‘Pachyloen’. Sci. Silv. Sin. 2019, 55, 32–40. [Google Scholar]
- Zhang, H.F.; Tang, G.G. Study on the shooting and degradation law of Phyllostachys vivax McClure cv aureocaulis. Anhui Agric. Sci. 2010, 38, 20921–20922. (In Chinese) [Google Scholar]
- Zhang, Y.; Xie, Y.; Ma, Y.; Tang, W.; Yuan, T. Study on growth characteristics of young bamboo and shooting of Chimonobambusa utilis at different altitudes. J. Nanjing For. Univ. (Nat. Sci. Ed.) 2019, 43, 199–203. (In Chinese) [Google Scholar]
- Zhao, W.; Chen, A.; Xiao, J.; Wu, Z.; Yang, G.; Yu, F. Insights into bamboo shoot degeneration. Pak. J. Bot. 2021, 53, 1065–1072. [Google Scholar] [CrossRef]
- Liu, W.; Cela, J. Count Data Models in SAS. Stat. Data Anal. 2008, 371, 1–12. [Google Scholar] [CrossRef]
- Li, Y.X. Moso Bamboo: Causes of Shoot Degeneration and Upgrading Technique. Non-Wood For. Res. 1998, 20, 20–23. (In Chinese) [Google Scholar]
- Yang, H.Q.; Yang, J.B.; Peng, Z.H.; Gao, J.; Yang, Y.M.; Peng, S.; Li, D.Z. A molecular phylogenetic and fruit evolutionary analysis of the major groups of thepaleotropical woody bamboos (Gramineae: Bambusoideae) based on nuclear ITS,GBSSI gene and plastid tmL—F DNA sequences. Mol. Phylogenetics Evol. 2008, 48, 809–824. [Google Scholar] [CrossRef]
- Sun, G.Z. Investigation and Study on Main Pests of degraded bamboo shoot. J. Sichuan For. Sci. Technol. 1996, 17, 32–37. (In Chinese) [Google Scholar]
- Yu, C.H.; Liang, G. A Study on the Bamboo Shoots Degenerated by Kumasia kumaso (Sugi) in Bamboo Forests of Acidosasa edulis. J. Fujian For. Sci. Technol. 2004, 31, 27–30. (In Chinese) [Google Scholar]
- Chen, Q. A Study on the Regulation of the Production and Degradation of Shoot in Pure and Mixed Stands of Phyllostachys heterocycla cv pubescens. J. Fujian Coll. For. 2000, 20, 361–364. (In Chinese) [Google Scholar]
- Liao, G.; Huang, Y. Shoot and degradation of bamboo shoots in Phyllostarchys pubescens forests. J. Bamboo Res. 1984, 2, 70–79. (In Chinese) [Google Scholar]
- Zheng, Y.S.; Hong, W.; Qiu, E.F. Study on the regulation of shoot emergence and degradation of Phyllostachys heterocycle CV. Pubescens shoot. Sci. Sylvae Sin. 1998, 34, 73–77. (In Chinese) [Google Scholar]
- Wang, H. Study on mathematical model of shoot emergence of Moso Bamboo. For. Prospect. Des. 2007, 1, 154–156. (In Chinese) [Google Scholar]
- Sala, A.; Piper, F.I.; Hoch, G. Physiological mechanisms of drought induced tree mortality are far from being resolved. New Phytol. 2010, 186, 274–281. [Google Scholar] [CrossRef]
- Fu, L.; Sun, W.; Wang, G. A climate-sensitive aboveground biomass model for three larch species in northeastern and northern China. Trees 2017, 31, 557–573. [Google Scholar] [CrossRef]
- Fu, L.; Liu, Q.; Wang, G.; Li, Z.; Chen, E.; Pang, Y.; Tang, S.; Song, X.; Wang, G. Development a system of compatible individual tree diameter and aboveground biomass rrediction models using error-in-variable regression and airborne LiDAR data. Remote Sens. 2018, 10, 325. [Google Scholar] [CrossRef]
- Zhou, X.; Fu, L.; Sharma, R.P.; He, P.; Lei, Y.; Guo, J. Generalized or general mixed-effect modelling of tree morality of Larix gmelinii subsp. principis-rupprechtii in Northern China. J. For. Res. 2021, 32, 2447–2458. [Google Scholar] [CrossRef]
- Zhou, X.; Qiao, C.C.; Rps, D.; Wang, Y.; He, P.; Guo, J.; Fu, L. A climate sensitive mixed-effects diameter class mortality model for Prince Rupprecht larch (Larix gmelinii var principis-rupprechtii) in northern China. For. Ecol. Manag. 2021, 491, 119091. [Google Scholar] [CrossRef]
- Affleck, D.L.R. Poisson mixture models for regression analysis of stand-level mortality. Can. J. For. Res. 2006, 36, 2994–3006. [Google Scholar] [CrossRef]
- Li, C.M.; Zhao, L.F.; Li, L.X. Modeling stand-level mortality of mon-golian oak (Quercus mongolica) based on mixed effect model and zero-inflated model methods. Sci. Silcae Sci. 2019, 55, 27–36. [Google Scholar]
- Kwak, H.; Lee, W.K.; Saborowski, J.; Lee, S.Y.; Won, M.; Koo, K.; Lee, M.B.; Kim, S. Estimating the spatial pattern of human-caused forest fires using a generalized linear mixed model with spatial autocorrelation in South Korea. Int. J. Geogr. Inf. Sci. 2012, 26, 1589–1602. [Google Scholar] [CrossRef]
- Xiao, Y.D.; Zhang, X.Q.; Ji, P. Modeling forest fire occurrences using count-data mixed models in qiannan autonomous prefecture of Guizhou Province in China. PLoS ONE 2015, 10, e0120621. [Google Scholar] [CrossRef]
- Susaeta, A.; Carter, D.R.; Chang, S.J.; Adams, D.C. A generalized Reed model with application to wildfire risk in even-aged Southern United States pine plantations. For. Policy Econ. 2016, 67, 60–69. [Google Scholar] [CrossRef]
- Fan, S.; Xiao, F.; Wang, S.; Su, W.; Yu, X.; Shen, Z. Fine root biomass and turnover in moso bamboo plantation in Huitong forest station, Hunan province. Sci. Silvae Sin. 2009, 45, 1–6. (In Chinese) [Google Scholar]
- Zheng, Y.; Guan, F.; Fan, S.; Zhou, Y.; Jing, X. Functional Trait Responses to Strip Clearcutting in a Moso Bamboo Forest. Forests 2021, 12, 793. [Google Scholar] [CrossRef]
- Akinwande, M.O.; Dikko, H.G.; Samson, A. Variance infation factor: As a condition for the inclusion of suppressor variable(s) in regression analysis. Open J. Stats 2015, 5, 754–767. [Google Scholar] [CrossRef]
- Hosmer, D.W.; Lemeshow, S. Applied survival analysis: Regression modeling of time to event data. J. Am. Stat. Assoc. 2000, 95, 195–222. [Google Scholar] [CrossRef]
- Brooks, M.E.; Kristensen, K.; van Benthem, K.J.; Magnusson, A.; Berg, C.W.; Nielsen, A.; Skaug, H.J.; Maechler, M.; Bolker, B.M. GlmmTMB balances speed and flexibility among packages for zero-inflated generalized linear mixed modeling. R J. 2017, 9, 378–400. [Google Scholar] [CrossRef]
- R Core Team. R: A Language and Environment for Statistical Computing; R Foundation for Statistical Computing: Vienna, Austria, 2020. [Google Scholar]
- Wang, G.J.; Chen, H.; Ma, G.L.; Li, C.X.; Wang, X.J.; Yang, D.S.; Wang, Y. Research on the Law and influence factors of shoot degeneration for Chimonobambusa hejiangensis. World Bamboo Ratt. 2016, 14, 1–9. [Google Scholar]
- Yang, Y.; Titus, S.J.; Huang, S. Modeling individual tree mortality for white spruce in Alberta. Ecol. Model. 2003, 163, 209–222. [Google Scholar] [CrossRef]
- Hailemariam, T.; Mitchell, S.J. An Individual-Tree Mortality Model for Complex Stands of Southeastern British Columbia. West. J. Appl. For. 2005, 2, 101–109. [Google Scholar]
- Zhang, X.; Lei, Y.; Lei, X.; Chen, Y.; Feng, M. Predicting stand-level mortality with count data models. Sci. Silvae Sin. 2012, 48, 54–61. [Google Scholar]
- Sharma, R.P.; Bílek, L.; Vacek, Z.; Vacek, S. Modelling crown width diameter relationship for Scots pine in the central Europe. Trees 2017, 31, 1875–1889. [Google Scholar] [CrossRef]
- Monserud, R.A.; Sterba, H. A basal area increment model for individual trees growing in even- and uneven-aged forest stands in Austria. For. Ecol. Manag. 1996, 80, 57–80. [Google Scholar] [CrossRef]
- Kuprevicius, A.; Auty, D.; Achim, A.; Caspersen, J.P. Quantifying the influence of live crown ratio on the mechanical properties of clear wood. For. Int. J. For. Res. 2013, 86, 361–369. [Google Scholar] [CrossRef]
- Umemura, M.; Takenaka, C. Retranslocation and localization of nutrient elements in various organs of moso bamboo (Phyllostachys pubescens). Sci. Total Environ. 2014, 493, 845–853. [Google Scholar] [CrossRef] [PubMed]
- Su, W.; Fan, S.; Zhao, J.; Cai, C. Effects of various fertilization placements on the fate of urea-15 N in moso bamboo forests. For. Ecol. Manag. 2019, 453, 117632. [Google Scholar] [CrossRef]
- Huang, J.; Shi, X.; Zhang, Z. Effects of Fertilization and Stand Density on Shoot Yield of Chimonobambusa quadrangularis. World Bamboo Ratt. 2018, 16, 30–32+36. (In Chinese) [Google Scholar]
- Zhang, Z.; Zhang, Z.; Zhang, H. Preliminary study on the effect of Fertilization on vegetative shoot withdrawal of Phyllostachys pubescens. Hubei For. Sci. Technol. 1997, 20, 5–9. [Google Scholar]
- Li, J.; Liu, X.; Li, S.; Rong, J.; Zheng, Y.; Su, X. Effects of N-K-P Fertilization on Physiological Characteristics of Bamboo Shoots and Leaves Southwest China. J. Agric. Sci. 2020, 33, 2885–2890. (In Chinese) [Google Scholar]
- Lu, X.; Wu, G. Study on growth regulators during shoot growth and senescence of Phyllostachys pubescens. Plant Physiol. Commun. 1979, 29, 21–24. (In Chinese) [Google Scholar]
- Nirmala, C.; David, E.; Sharma, M.L. Changes in nutrient components during ageing of emerging juvenile bamboo shoots. Int. J. Food Sci. Nutr. 2007, 58, 612–618. [Google Scholar] [CrossRef]
- Choudhury, D.; Sahu, J.K.; Sharma, G.D. Value addition to bamboo shoots: A review. J. Food Sci. Technol. 2012, 49, 407–414. [Google Scholar] [CrossRef] [Green Version]
- Liu, Y.; Tang, Q.; You, Y.; Zeng, S.; Li, Y.; Chen, D.; Chen, D. Evaluation of the bamboo shoots’ development status and nutrition in Sichuan, China. In Proceedings of the International Conference on Education, Barcelona, Spain, 4–6 July 2016. [Google Scholar]


| Slope (°) | Aspect | Slope Position | Number of Sampling Plots | Block |
|---|---|---|---|---|
| 0–3 | Southwest | Downhill slope | 25 | Block 1 |
| 4–7 | Southwest | Middle slope | 17 | Block 2 |
| 8–11 | Southwest | Uphill slope | 12 | Block 3 |
| 11–14 | Northwest | Middle slope | 5 | Block 4 |
| 15–18 | Northwest | Middle slope | 5 | Block 5 |
| Variables | Min | Max | Mean | Std. |
|---|---|---|---|---|
| NBS (culms/ha) | 1000 | 4867 | 2373 | 901.75 |
| MD (cm) | 7.42 | 9.82 | 8.97 | 0.42 |
| MHCB (m) | 3.41 | 5.98 | 4.53 | 0.53 |
| N (culms/ha) | 1833 | 8100 | 4507 | 1271.17 |
| DBS (culms/ha) | 0 | 2700 | 611 | 620.20 |
| NB (culms/ha) | 813 | 3400 | 1762 | 688.92 |
| BA (m2/ha) | 13.15 | 49.56 | 29.14 | 7.76 |
| QMD (cm) | 7.64 | 9.91 | 9.10 | 0.40 |
| SOC (g/kg) | 13.44 | 43.10 | 33.69 | 5.47 |
| TN (g/kg) | 0.84 | 2.34 | 1.74 | 0.27 |
| TP (g/kg) | 0.22 | 0.39 | 0.26 | 0.04 |
| TK (g/kg) | 7.84 | 11.76 | 9.63 | 0.77 |
| HN (mg/kg) | 104.9 | 221.10 | 164.6 | 21.65 |
| AP (mg/kg) | 0.17 | 2.45 | 1.17 | 0.48 |
| AK (mg/kg) | 46.34 | 84.24 | 60.45 | 7.61 |
| Mode l | Equation | Equation No. |
|---|---|---|
| PS | (1) | |
| NB | (2) | |
| ZIP | (3) | |
| ZINB | (4) | |
| HP | (5) | |
| HNB | (6) | |
| Logistic | (7) |
| Parameter | Poisson (M1) | NB (M2) | ZIP (M3) | HP (M5) | Logistic (M7) | |
|---|---|---|---|---|---|---|
| a | 1676 *** (216.3000) | |||||
| Zero component | α0 | 8.6077 * (4.0411) | 8.6085 * (4.0412) | |||
| α1 | −0.1843 * (0.0731) | −0.1843 * (0.0732) | ||||
| Count component | β0 | 6.7810 *** (0.0670) | 5.4638 ** (1.8701) | 7.6000 *** (0.0644) | 7.6000 *** (0.0644) | 0.3075 (3.1060) |
| β1 | 0.0005 *** (5.81 × 10⁻⁶) | 0.0006 ** (0.0002) | 0.0004 *** (6.21 × 10⁻⁶) | 0.0004 *** (6.21 × 10⁻⁶) | −0.0018 *** (4.87 × 10⁻⁴) | |
| β2 | −0.2819 *** (0.0010) | −0.1519 (0.3404) | −0.0076 *** (1.06 × 10⁻²) | −0.0076 *** (1.06 × 10⁻²) | 0.1417 ** (5.03 × 10⁻²) | |
| β3 | −0.0038 *** (0.0008) | −0.0226 (0.0222) | −0.0549 *** (0.0008) | −0.0548 *** (0.0008) | 0.7761 (0.5046) | |
| β4 | 0.0103 *** (0.0002) | 0.0080 (0.0073) | 0.0009 *** (0.0002) | 0.0008 *** (0.0002) | −0.0427 ** (0.0149) | |
| R2 | 0.5268 | 0.4691 | 0.4861 | 0.4861 | 0.6022 | |
| RMSE | 429.9827 | 455.4711 | 448.0134 | 448.0134 | 394.1936 | |
| TRE | 30.3217 | 32.2449 | 28.7537 | 28.7537 | 25.3112 |
| Parameter | Poisson (M17) | NB (M18) | ZIP (M19) | HP (M20) | Logistic (M21) | |
|---|---|---|---|---|---|---|
| a | 1897.1424 *** (275.5338) | |||||
| Zero component | α0 | 8.6077 * (4.0361) | 8.6080 * (4.0126) | |||
| α1 | −0.1843 * (0.0731) | −0.1944 * (0.0733) | ||||
| Count component | β0 | 4.7960 *** (0.2171) | 5.4638 ** (1.8701) | 5.3030 *** (0.2214) | 5.3027 *** (0.2208) | 1.4120 (2.4835) |
| β1 | 0.0007 *** (8.166 × 10⁻⁶) | 0.0006 ** (0.0002) | 0.0005 *** (8.512 × 10⁻⁶) | 0.0005 *** (8.412 × 10⁻⁶) | −0.0015 *** (0.0004) | |
| β2 | −0.2045 *** (0.0125) | −0.1519 (0.3404) | −0.0311 * (0.0134) | −0.0299 * (0.0130) | 0.1266 *** (0.0362) | |
| β3 | −0.0538 *** (8.984 × 10⁻⁴) | −0.0226 (0.0222) | −0.0673 *** (8.928 × 10⁻⁴) | −0.0655 *** (8.902 × 10⁻⁴) | 0.5535 (0.4239) | |
| β4 | 0.0226 *** (4.153 × 10⁻⁴) | 0.0080 (0.0073) | 0.0233 *** (4.434 × 10⁻⁴) | 0.0212 *** (4.404 × 10⁻⁴) | −0.0407 *** (0.0118) | |
| Covariance matrix of random effects variance | block | 0.1821 | 4.414 × 10⁻⁹ | 0.1924 | 0.1920 | 0.1107 |
| R2 | 0.6183 | 0.4690 | 0.5991 | 0.5990 | 0.6596 | |
| RMSE | 386.2009 | 455.4711 | 395.6937 | 394.6932 | 364.7028 | |
| TRE | 23.9796 | 32.2448 | 22.2586 | 22.2183 | 20.8995 |
| Variance Functions | NLME DBS Model | |
|---|---|---|
| AIC | LL | |
| Equation (11) | 949.0738 | −466.5369 |
| Equation (12) | 948.1784 | −465.0892 |
| Equation (13) | 950.1784 | −465.0892 |
Publisher’s Note: MDPI stays neutral with regard to jurisdictional claims in published maps and institutional affiliations. |
© 2022 by the authors. Licensee MDPI, Basel, Switzerland. This article is an open access article distributed under the terms and conditions of the Creative Commons Attribution (CC BY) license (https://creativecommons.org/licenses/by/4.0/).
Share and Cite
Zhou, X.; Guan, F.; Fan, S.; Yin, Z.; Zhang, X.; Li, C.; Zhou, Y. Modeling Degraded Bamboo Shoots in Southeast China. Forests 2022, 13, 1482. https://doi.org/10.3390/f13091482
Zhou X, Guan F, Fan S, Yin Z, Zhang X, Li C, Zhou Y. Modeling Degraded Bamboo Shoots in Southeast China. Forests. 2022; 13(9):1482. https://doi.org/10.3390/f13091482
Chicago/Turabian StyleZhou, Xiao, Fengying Guan, Shaohui Fan, Zixu Yin, Xuan Zhang, Chengji Li, and Yang Zhou. 2022. "Modeling Degraded Bamboo Shoots in Southeast China" Forests 13, no. 9: 1482. https://doi.org/10.3390/f13091482