Article

Is the Pinus massoniana Lamb. Tree-Ring Latewood Formation Influenced by the Diurnal Temperature Range in Humid Subtropical China?

1
Key Laboratory of Humid Subtropical Eco-Geographical Process (Ministry of Education), College of Geographical Sciences, Fujian Normal University, Fuzhou 350000, China
2
Electric Power Research Institute of State Grid Fujian Electric Power Co., Ltd., Fuzhou 350000, China
3
Research Center for Scientific Development in the Fenhe River Valley, Taiyuan Normal University, Jinzhong 030619, China
*
Author to whom correspondence should be addressed.
Forests 2022, 13(9), 1439; https://doi.org/10.3390/f13091439
Submission received: 14 August 2022 / Revised: 4 September 2022 / Accepted: 6 September 2022 / Published: 8 September 2022
(This article belongs to the Special Issue Applications of Dendrochronology in Forest Climatology)

Abstract

:
Tree-ring latewood is a key proxy for the reconstruction of climate, especially for temperature. The mechanisms of latewood formation and its responses to climates remain uncertain. Given that the tree-ring latewood of the taproot is absent belowground under conditions of low temperature gradients, we thus hypothesize that low diurnal temperature ranges (DTRs) may be one determining factor for latewood production. To evaluate this hypothesis, we designed experimental investigations by adding heat-protecting layers to the trunks of Pinus massoniana Lamb. to lower DTRs and simulate the environmental conditions underground in the Fuzhou area of humid subtropical China (HSC). We found that a decreased DTR induces a significant decline in latewood cell thickness and a slight reduction in latewood cell number and latewood density. DTRs played an important role in the formation of tree-ring width (TRW) and latewood width (LWW) rather than precipitation. Our study highlighted the effects of DTRs on tree growth and wood anatomical changes and provided a possible explanation for the “divergence problem” in dendroclimatology.

1. Introduction

Tree-ring latewood of seasonally temperature-sensitive species that are in the Northern Hemisphere with seasonality was widely used for the reconstruction of past climate change, particularly for temperature reconstructions [1,2,3]. Although the latewood generally forms in autumn when the temperature drops, the latewood proxies (e.g., latewood width and density) are often not negatively correlated to temperature [4,5]. On the contrary, the maximum latewood density data are generally positively correlated with summer temperature in the high latitudes of the Northern Hemisphere [6,7,8]. The “divergence problem” refers to the reduced sensitivity of latewood density and tree-ring width to temperature in some high latitude regions since the 1980s, and it is worth noting that this phenomenon is not ubiquitous [9,10]. The mechanisms of the tree-ring latewood formation are still under debate, which limits our ability to understand the relationships between latewood and climate.
Compared to water availability, the temperature has a greater impact on adult tree growth, seed output and seedling recruitment [11]. Temperature can also significantly affect lumen area and cell wall thickness depending on the phenology of the cambium [12]. For instance, an increase in temperature by short-term stem heating during early spring induced an increase in the tracheid diameters and lumen area in Cryptomeria japonica D. Don. [13]. Localized stem heating from the rest to the growth phase showed that woody rings formed more latewood-like cells in Picea abies (L.) H. Karst. [14], and the Eucalyptus grandis W. Hill ex Maiden. seedlings grown at high temperatures had thicker fiber cell walls and a higher density [15]. Photoperiod and precipitation are important external factors that affect the production of latewood. Longer photoperiods tend to correspond to higher growth rates, and short photoperiods normally induce latewood formation and cambial dormancy in the stems of conifer species [16,17,18]. Drought stress can constrain cell enlargement and lead to latewood formation [19,20,21]. In other words, as an important physiological factor, changes in hormones strongly modulate the formation of latewood, such as a decrease in indole-3-acetic acid (IAA) or the centration of inhibitor abscisic acid (ABA) [22,23,24]. Studies have also shown that the amount of crown and growth of foliar also affect the production of latewood [25,26].
In addition to the factors mentioned above, other less studied factors, such as the diurnal temperature range (DTR), may relate to the latewood formation. The diurnal temperature range (DTR), defined as the difference between maximum temperature (Tmax) and minimum temperature (Tmin) on a daily scale, is considered an important index of climate change and has been shown to influence tree growth [27,28,29]. We consider this mechanism possible because tree rings of the taproots often have no latewood belowground but form latewood when exposed to the surface. One potential reason for this difference is largely attributed to the lower DTR belowground. In addition, related studies on exposed roots showed that the distinct temperature fluctuations due to the loss of surface soil caused abrupt anatomical shifts in tree roots [30,31]. Buried stems were found to form narrower rings with less distinct transitions [32]. Accordingly, we hypothesize that the latewood formation may be hindered by the reduction in the DTR. The reduced DTR, due to a more rapidly increasing pace of night temperature under the global warming background [33], may cause a decrease in the latewood density and partly explain the mechanisms of the divergence problem.
Pinus massoniana Lamb. is one of the most widely used endemic tree species for dendrochronological studies in humid subtropical China (HSC) due to their high climate sensitivity and long duration [34,35,36]. In this study, we conducted a novel experiment by covering the Pinus massoniana trunks with heat-protecting layers for one year to simulate the belowground thermal conditions with a reduced DTR. The disparity between the latewood characteristics of stems with and without heat-protecting layers were evaluated to investigate the possible effect of the DTR on latewood formation in HSC.

2. Materials and Methods
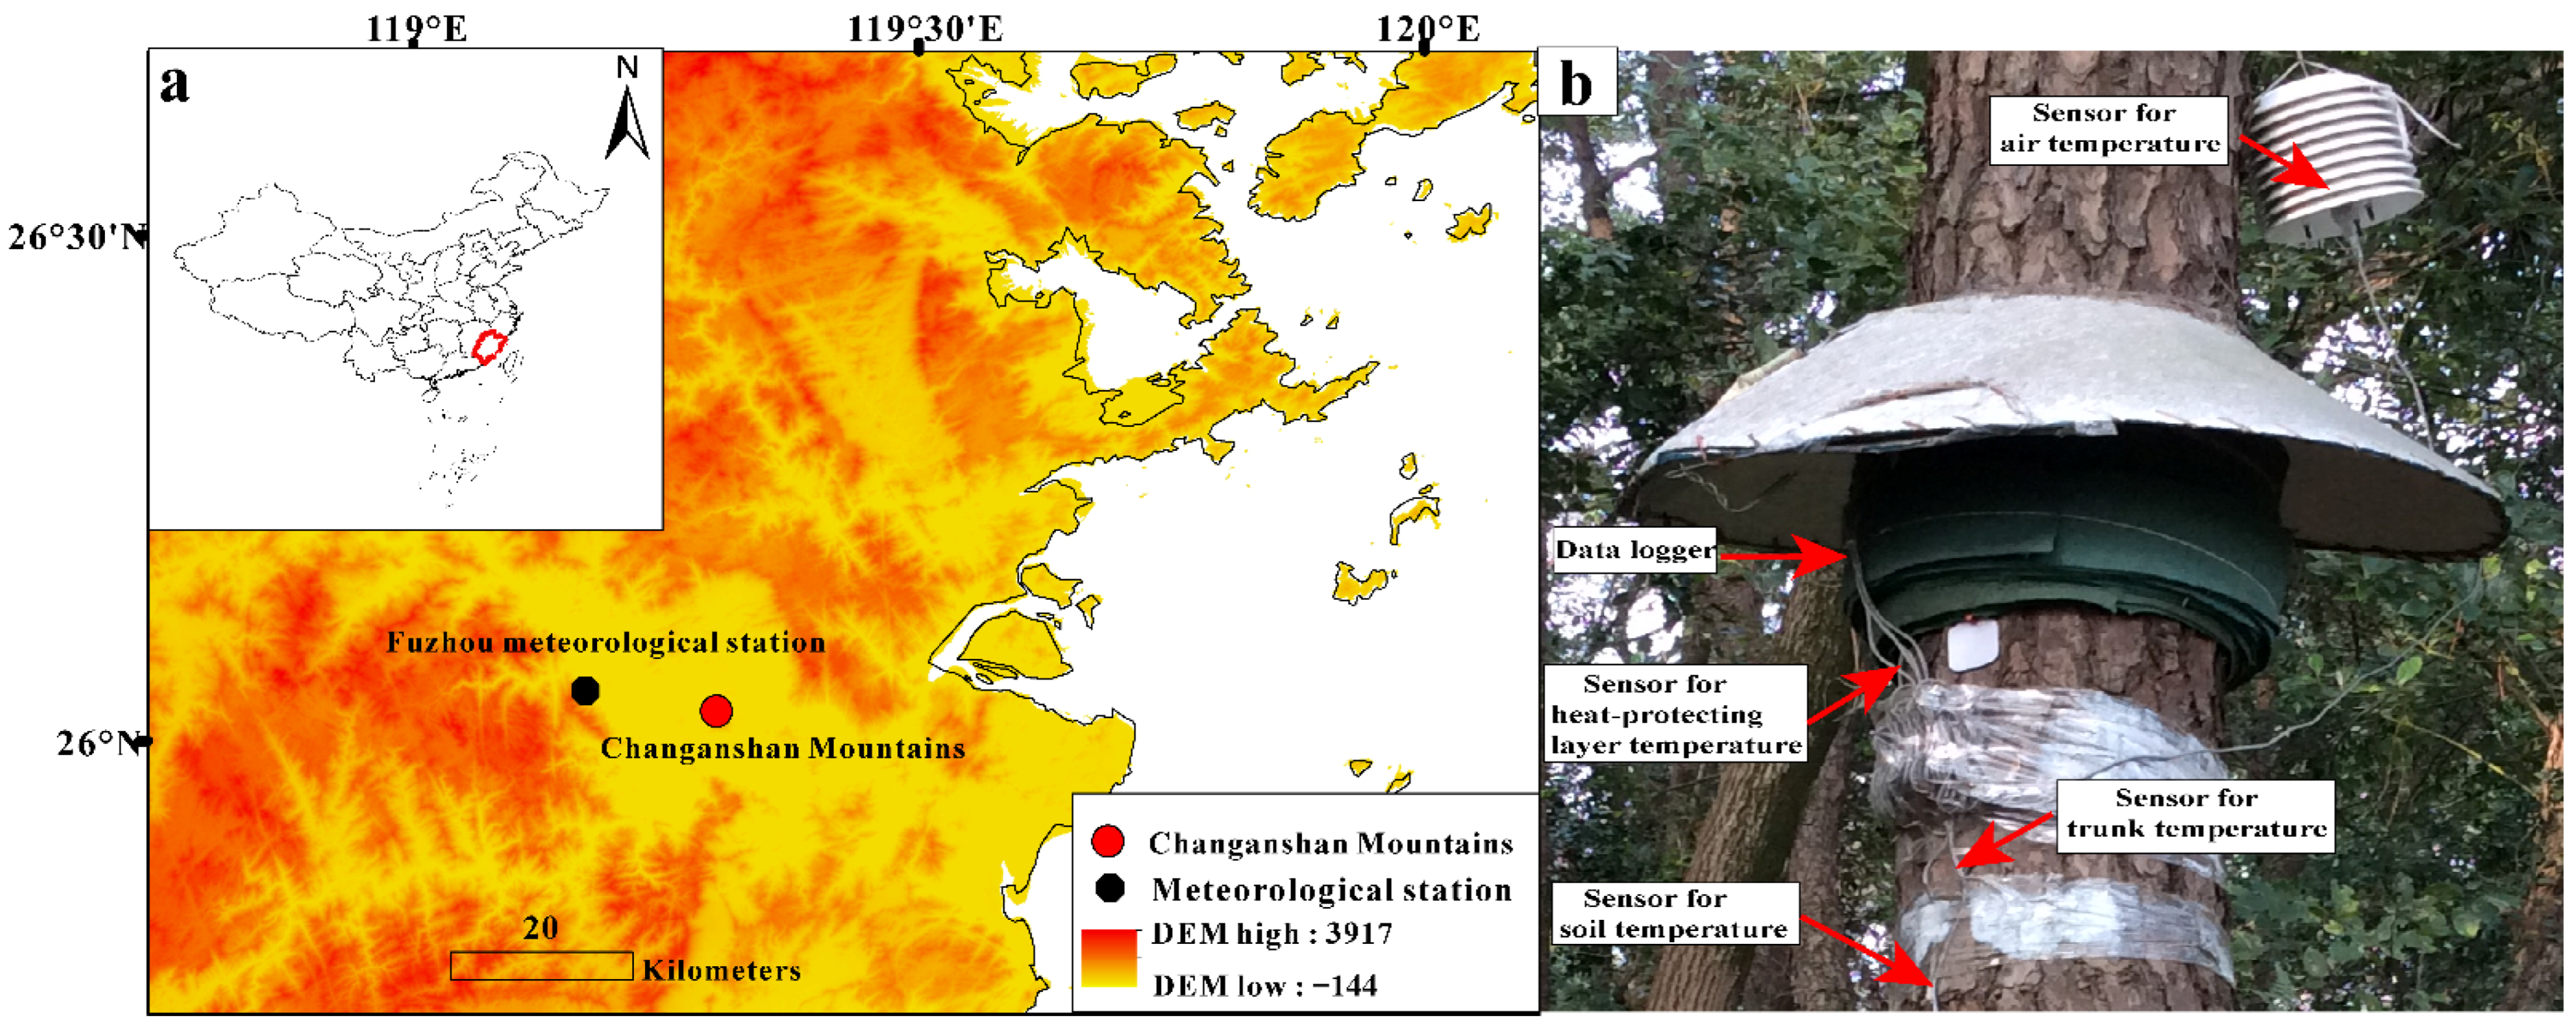
2.1. Study Region

The experimental site (119.30° E, 26.03° N, 101 m a.s.l.) is located in the Changanshan Mountains of Fuzhou City, the provincial capital of Fujian province of China in the west of the Taiwan strait (Figure 1a). This site is dominated by naturally growing evergreen forests mixed with Pinus massoniana trees. According to the climate records from the Fuzhou meteorological station (119.17° E, 26.05° N, 84 m a.s.l) nearby, the study area is characterized by a humid subtropical climate with an annual mean temperature of 19.9 °C and total precipitation of 1366 mm. The study region is influenced by the spring persistent rainfall with increasing precipitation from the beginning of the year to June. In summer, the western Pacific high controls the study region, showing a hot and relatively dry climate [37]. However, the hottest months in July and August often correspond to insufficient precipitation due to the control of the western Pacific subtropical high (Figure 2a). Changes in the DTR and precipitation showed a significantly (p < 0.01) inverse relationship, i.e., dry conditions corresponding to a higher DTR (Figure S1). No significant tendency was found in the annual total precipitation for the study area during 1953–2015 based on the linear fitting model. The temperature changes maintained a notable upward trend, while the DTR showed a marked downward trend (Figure 2b–d). At this site, we selected 8 healthy and mature Pinus massoniana trees for the heat-protecting experiments (Figure 1b).

2.2. Tree-Ring Width Chronology

We collected 75 tree-ring cores (3 to 4 cores per tree) from 20 healthy natural Pinus massoniana trees around the experimental site. The cores were air-dried and polished with a series of sandpaper until the cellular structure was visible [38,39]. Given the distinct boundary between latewood and earlywood, cross-dated tree-ring width (TRW) and latewood width (LWW) series were measured to a 0.001 mm precision using a LINTAB 6.0 measuring system. We divided the LWW by the TRW to calculate the sequence of the latewood ratio (LWR) of each core. The cross-dating quality of these tree-ring samples was again checked with the program COFECHA [40]. Age-related growth trends of the raw measurements were removed by fitting smoothed cubic spline curves with two-thirds of the mean lengths of each series. The chronology is developed by the mean of the dimensionless tree-ring indices via a biweight robust mean methodology [41]. To account for the potentially reduced signal strength with a low sample size, for example, its early portion, we used the statistic of the subsample signal strength (SSS) of higher than 0.85 to determine its reliable section [42,43].

2.3. Heat-Protecting Experiments on Tree Trunks

As shown in Figure 1b, the heat-protecting layers were used to wrap up the tree trunks to simulate the soil environment with relatively low temperature differences among seasons and between days and nights. The temperature sensors were equipped in the heat-protecting layers, the soil beneath the forests, ambient air and the uncovered trunks, respectively. The soil temperatures were used to compare with the monitored air temperature and temperature in the heat-protected layer. The temperature dynamics were recorded at a step of 30 min. We conducted heat-protecting experiments starting from the dormancy stage on 13 February to the end of the growing season on 16 December in the year of 2015. At the end of the growing season in December, we collected tree-ring cores from the trunks within the heat-protecting layers and 30 cm below without the heat-protecting layers, respectively.

2.4. Tree-Ring Paraffin Section and Blue Intensity and Anatomical Structures of Tree-Ring Data

In this research, latewood blue intensity (LWBI) was measured as an alternative indicator of maximum latewood density (MXD). Before the measurement of BI, the mixture of benzene and ethanol with a purity greater than 99.5% (2:1) was used for Soxhlet extraction for 48 h to reduce the color transition between heartwood and sapwood. The samples were air-dried and polished again with 1200 grit sandpaper until smoothed surfaces. The prepared cores were scanned using a flatbed scanner (Epson Perfection V800 photo, Epson, Los Alamitos, CA, USA) equipped with SilverFast Ai Studio 8.8 (SilverFast, Kiel, Germany) software with an optical scanning resolution of 3200 dpi. In this study, the image analysis software CooRecorder 9.3/CDendro 9.3 (CybisElektronik & Data AB, Saltsjöbaden, Sweden) [44] was used to measure LWBI. We used the “Mean of sorted pixels” to collect color data, specifically the mean of the 15 percent darkest pixels for the latewood parameter. Since the original BI reflection values were negatively correlated with the tree-ring density, we converted the original BI data according to the method introduced by [45]. We only measured the LWBI of the annual ring formed in 2015 to verify the effect of heat-protecting on density. The selected samples were softened in hot water, then dehydrated in successive ethanol solutions (70%, 90%, 95% and 100%) and pure D-limonene, and finally embedded in paraffin. Transverse sections, 9–12 μm thickness, were cut with a rotary microtome ((YD315, Jinhua YIDI Medical Appliance Co., Ltd., Jinhua, China) and stained with 3% safranin (Merck, Darmstadt, Germany) and 0.5% Astra blue (Sigma-Aldrich, Steinheim, Germany), both in 95% ethanol. The image of each micro-section was captured with a light microscope (DM750P, LEICA, Wetzlar, Germany). With these micro-section images, we measured the following radial parameters of each sample in 2015: cell number (N), radial lumen diameter (LD) and double cell wall thickness (2CWT) and lumen area (LA) in ImageJ (National Institutes of Health, Bethesda, MD, USA). All the parameters were averaged along three radial files. Tracheids were classified as earlywood or latewood according to Mork’s formula [46]. The ratio of latewood cells is equal to the ratio of the number of latewood cells to the total number of tree-ring cells.

2.5. Climate Data

We employed the instrumental data of monthly mean temperature, and monthly total precipitation from the Fuzhou meteorological station, and calculated Vapor Pressure Deficit (VPD). Gridded DTR and self-calibrating PDSI (scPDSI) data were obtained from Climate Research Unit (CRU) TS4.03 dataset with a resolution of 0.5° by 0.5°. CRU TS (Climatic Research Unit gridded Time Series) is a widely used climate dataset over all land domains of the world except Antarctica. It is derived by the interpolation of monthly climate anomalies from extensive networks of weather station observations [47].

2.6. Analytical Methods

The Pearson correlations of the TRW, LWW and LWR chronologies with climate records were calculated. The correlation analyses between tree-ring data and climate variables were calculated from the start of the previous growing season (previous October) to the end of the current year (current October). In addition, the 21-year running correlations between climate and tree-ring data were further conducted to reveal the temporal changes of the climate–growth relationships. Then, we selected the climate factors with the highest correlations and explored their contribution to tree growth through the boosted regression tree (BRT) model. The BRT analyses were implemented in R version 3.63 [48] using the DISMO package [49,50]. We fitted the BRT models using five-fold cross-validation to identify the optimum number of trees [49].
We classified the extreme years of DTR based on the mean ± 1.5 standard deviations of DTR and used the Tukey test to compare the differences between extreme high and low DTR scenarios for different tree-ring indicators (TRW, LWW and LWR). Considering the assumption of normality was not met by all parameters of wood anatomy. The differences in wood anatomy between samples with different treatments were determined using the Mann–Whitney U test (not normality).

3. Results

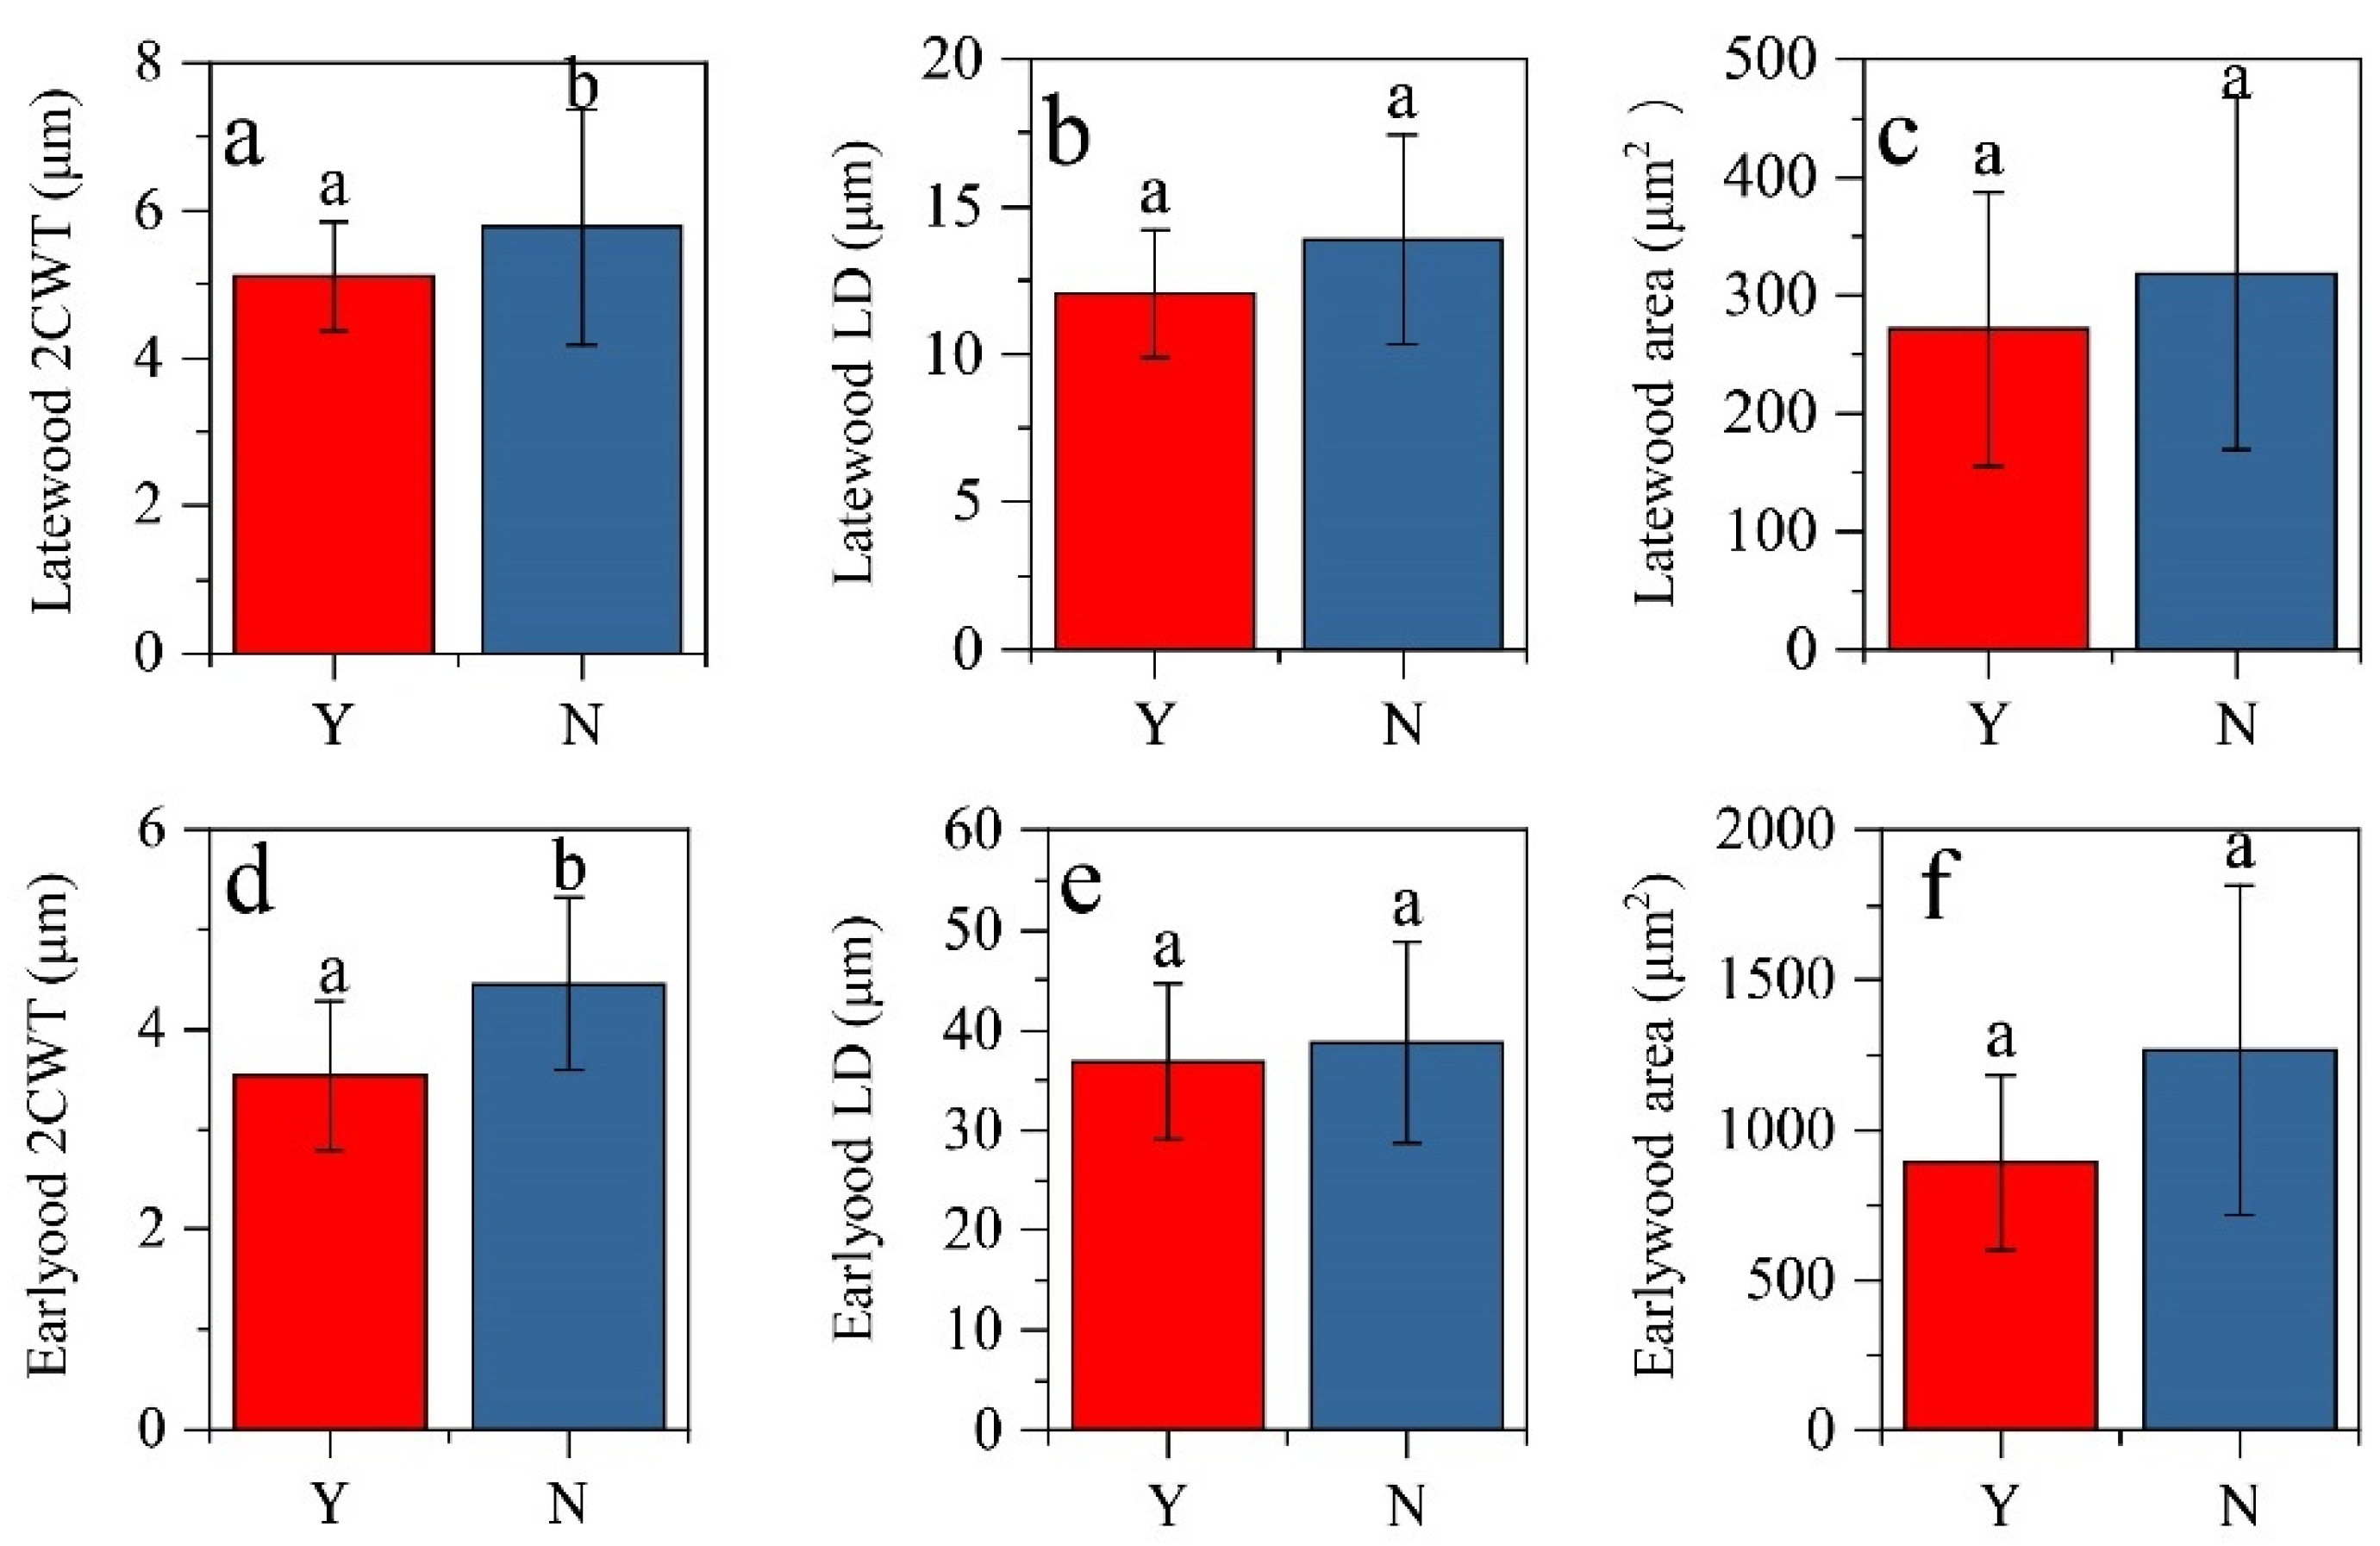
3.1. Wood Anatomy Changes after the Heat-Protecting

The heat-protecting layers reduced the hourly temperature gradients (Figure 3a) and lagged the peak and bottom of the interior temperatures for 1–2 h relative to the ambient atmosphere, indicative of a marked thermal insulation effect. It should be noted that the temperature gradients within the heat-protecting layers are still larger than those in the soil. The seasonal temperature gradients within the heat-protecting layers and under the soil are quite similar to those in the ambient atmosphere (Figure 3), indicating that the heat-protecting measure has limited influence on the seasonal temperature gradients.
After the heat-protecting treatment, the number of earlywood and latewood cells decreased slightly according to the Mann–Whitney U test (p > 0.05), resulting in a slight disparity of xylem cells among trees (p > 0.05) (Figure 4a–c). The ratios of the earlywood (latewood) cells to total xylem cells increased (declined) but the changes were insignificant (p > 0.05). The blue intensity of the latewood decreased after the heat-protecting treatment, indicating that the low DTR can reduce the latewood density, but the decrease was nonsignificant (Figure 4). A decline was found in all of the anatomical parameters for the trees due to the heat-protecting treatment (Figure 5). However, only the decreases in the double cell wall thickness variations in earlywood and latewood were significant (p < 0.05) (Figure 5a,d).

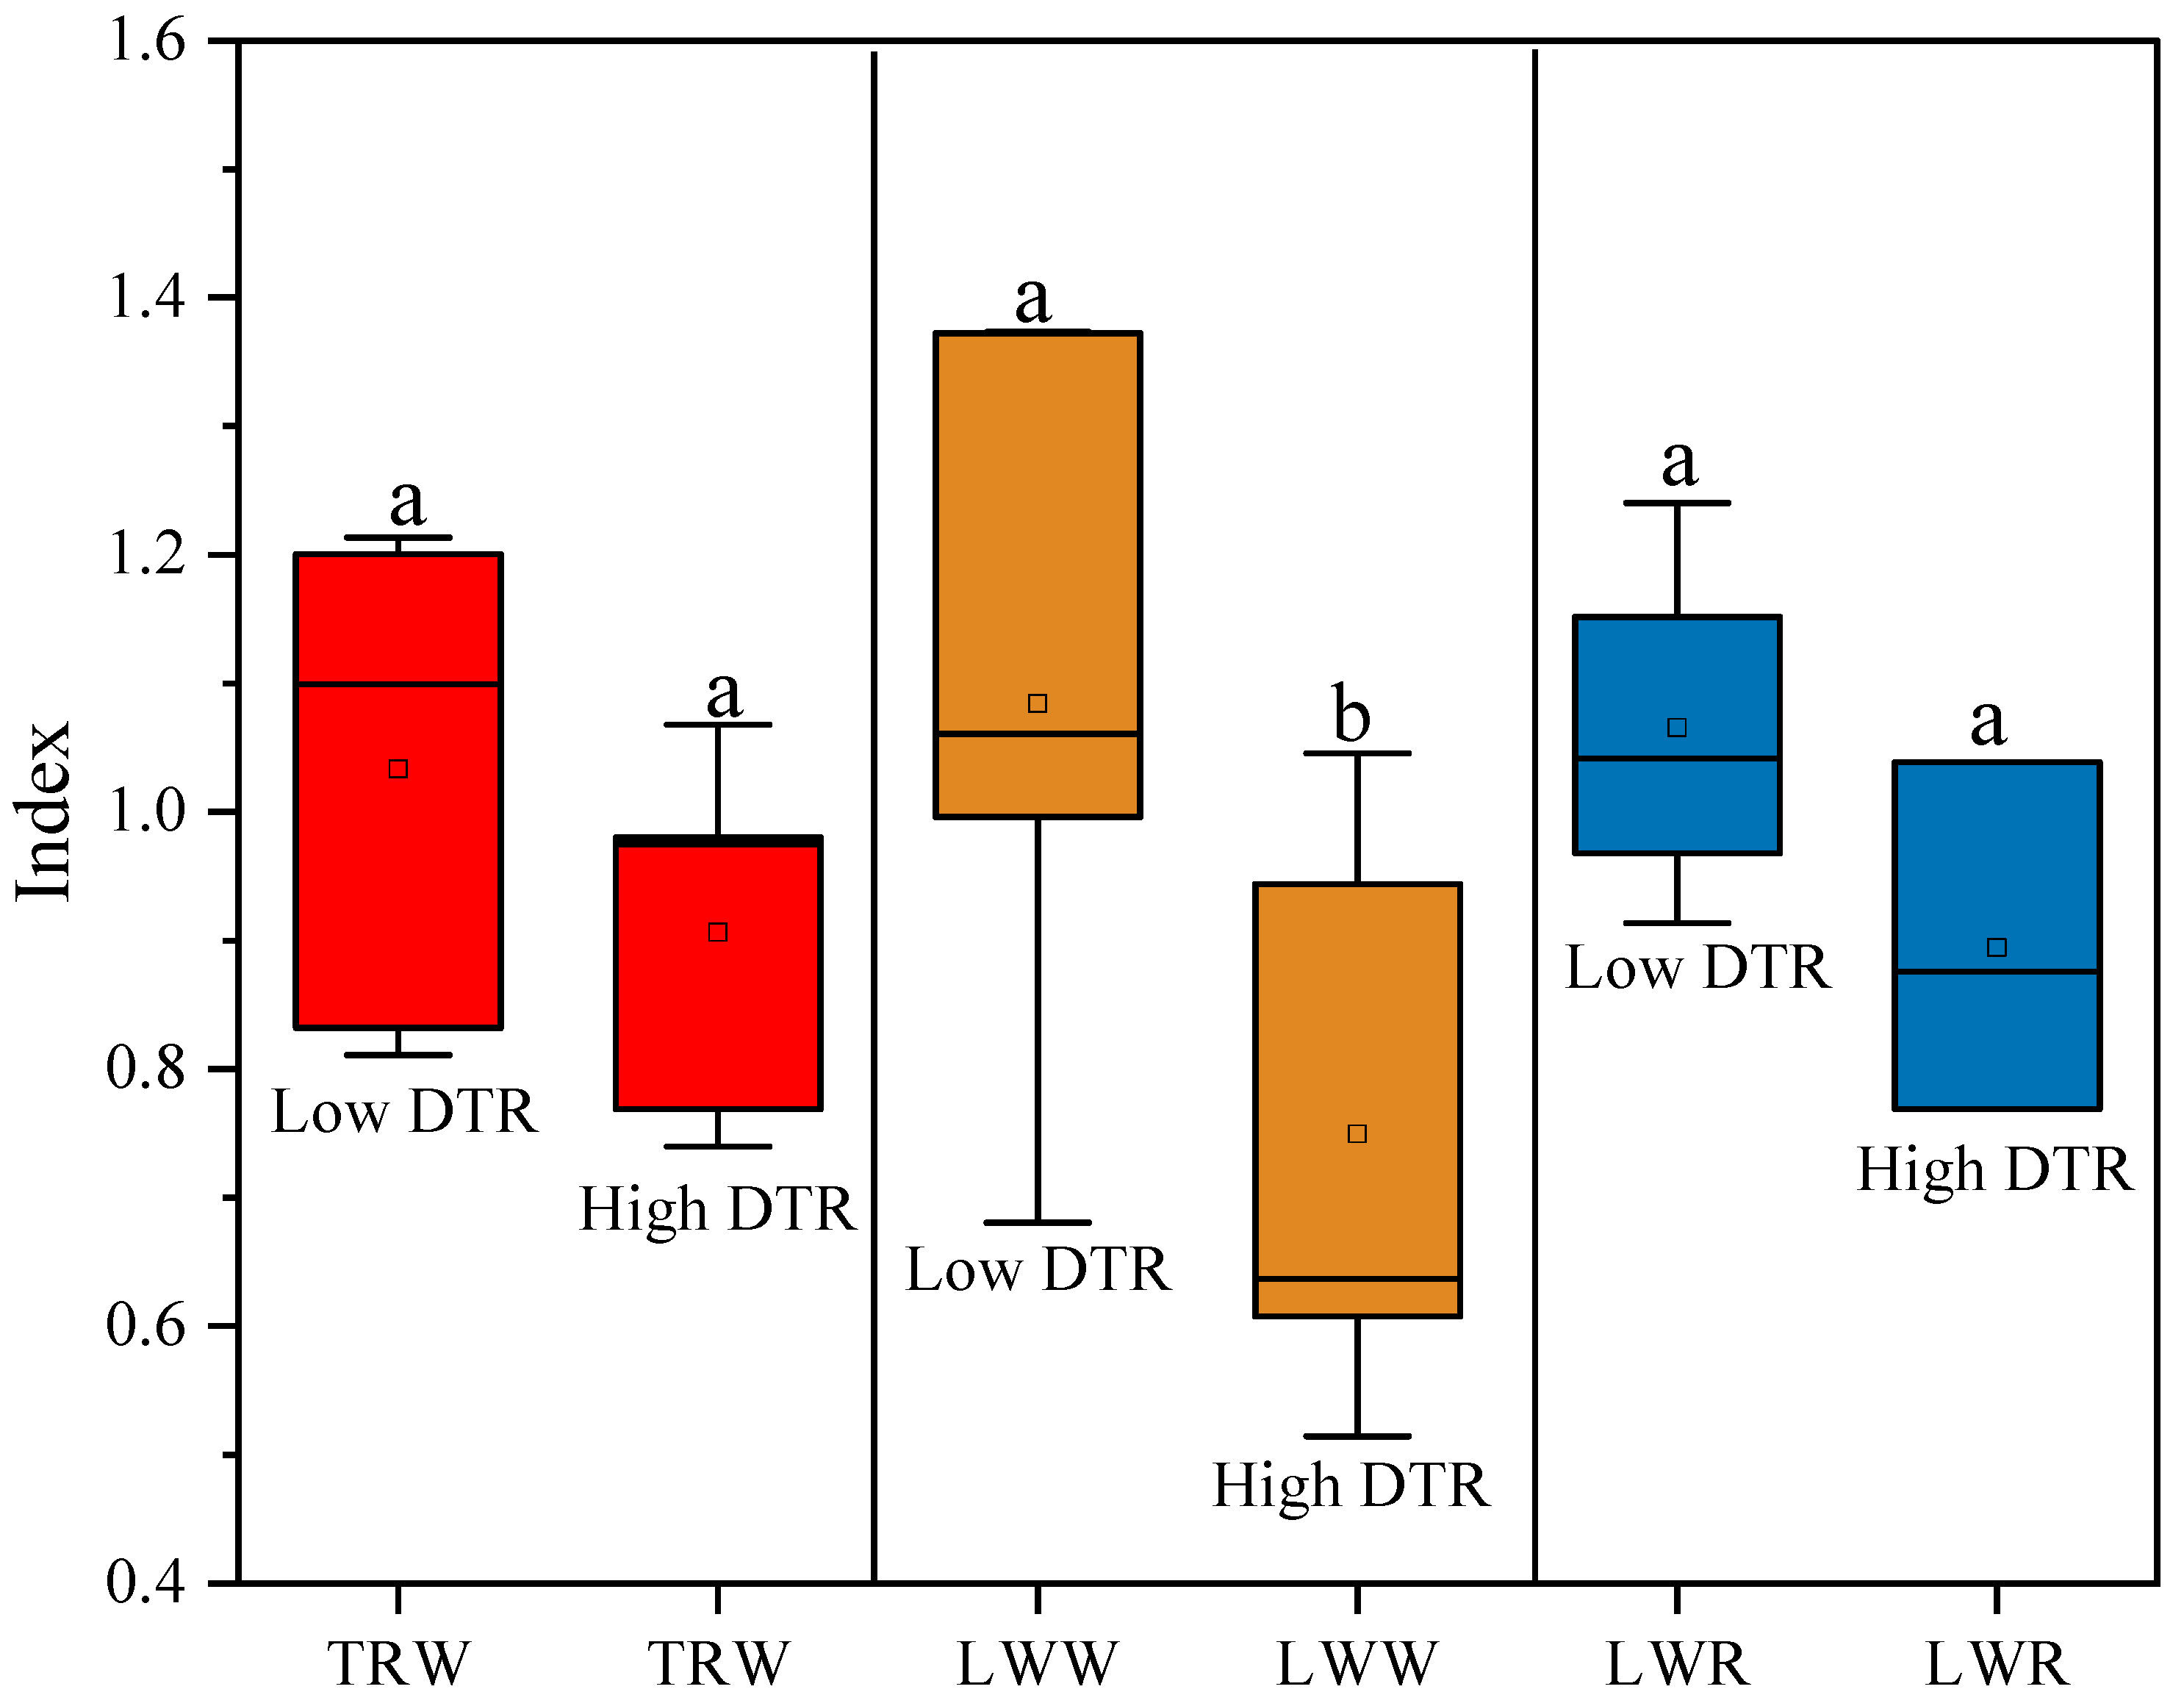
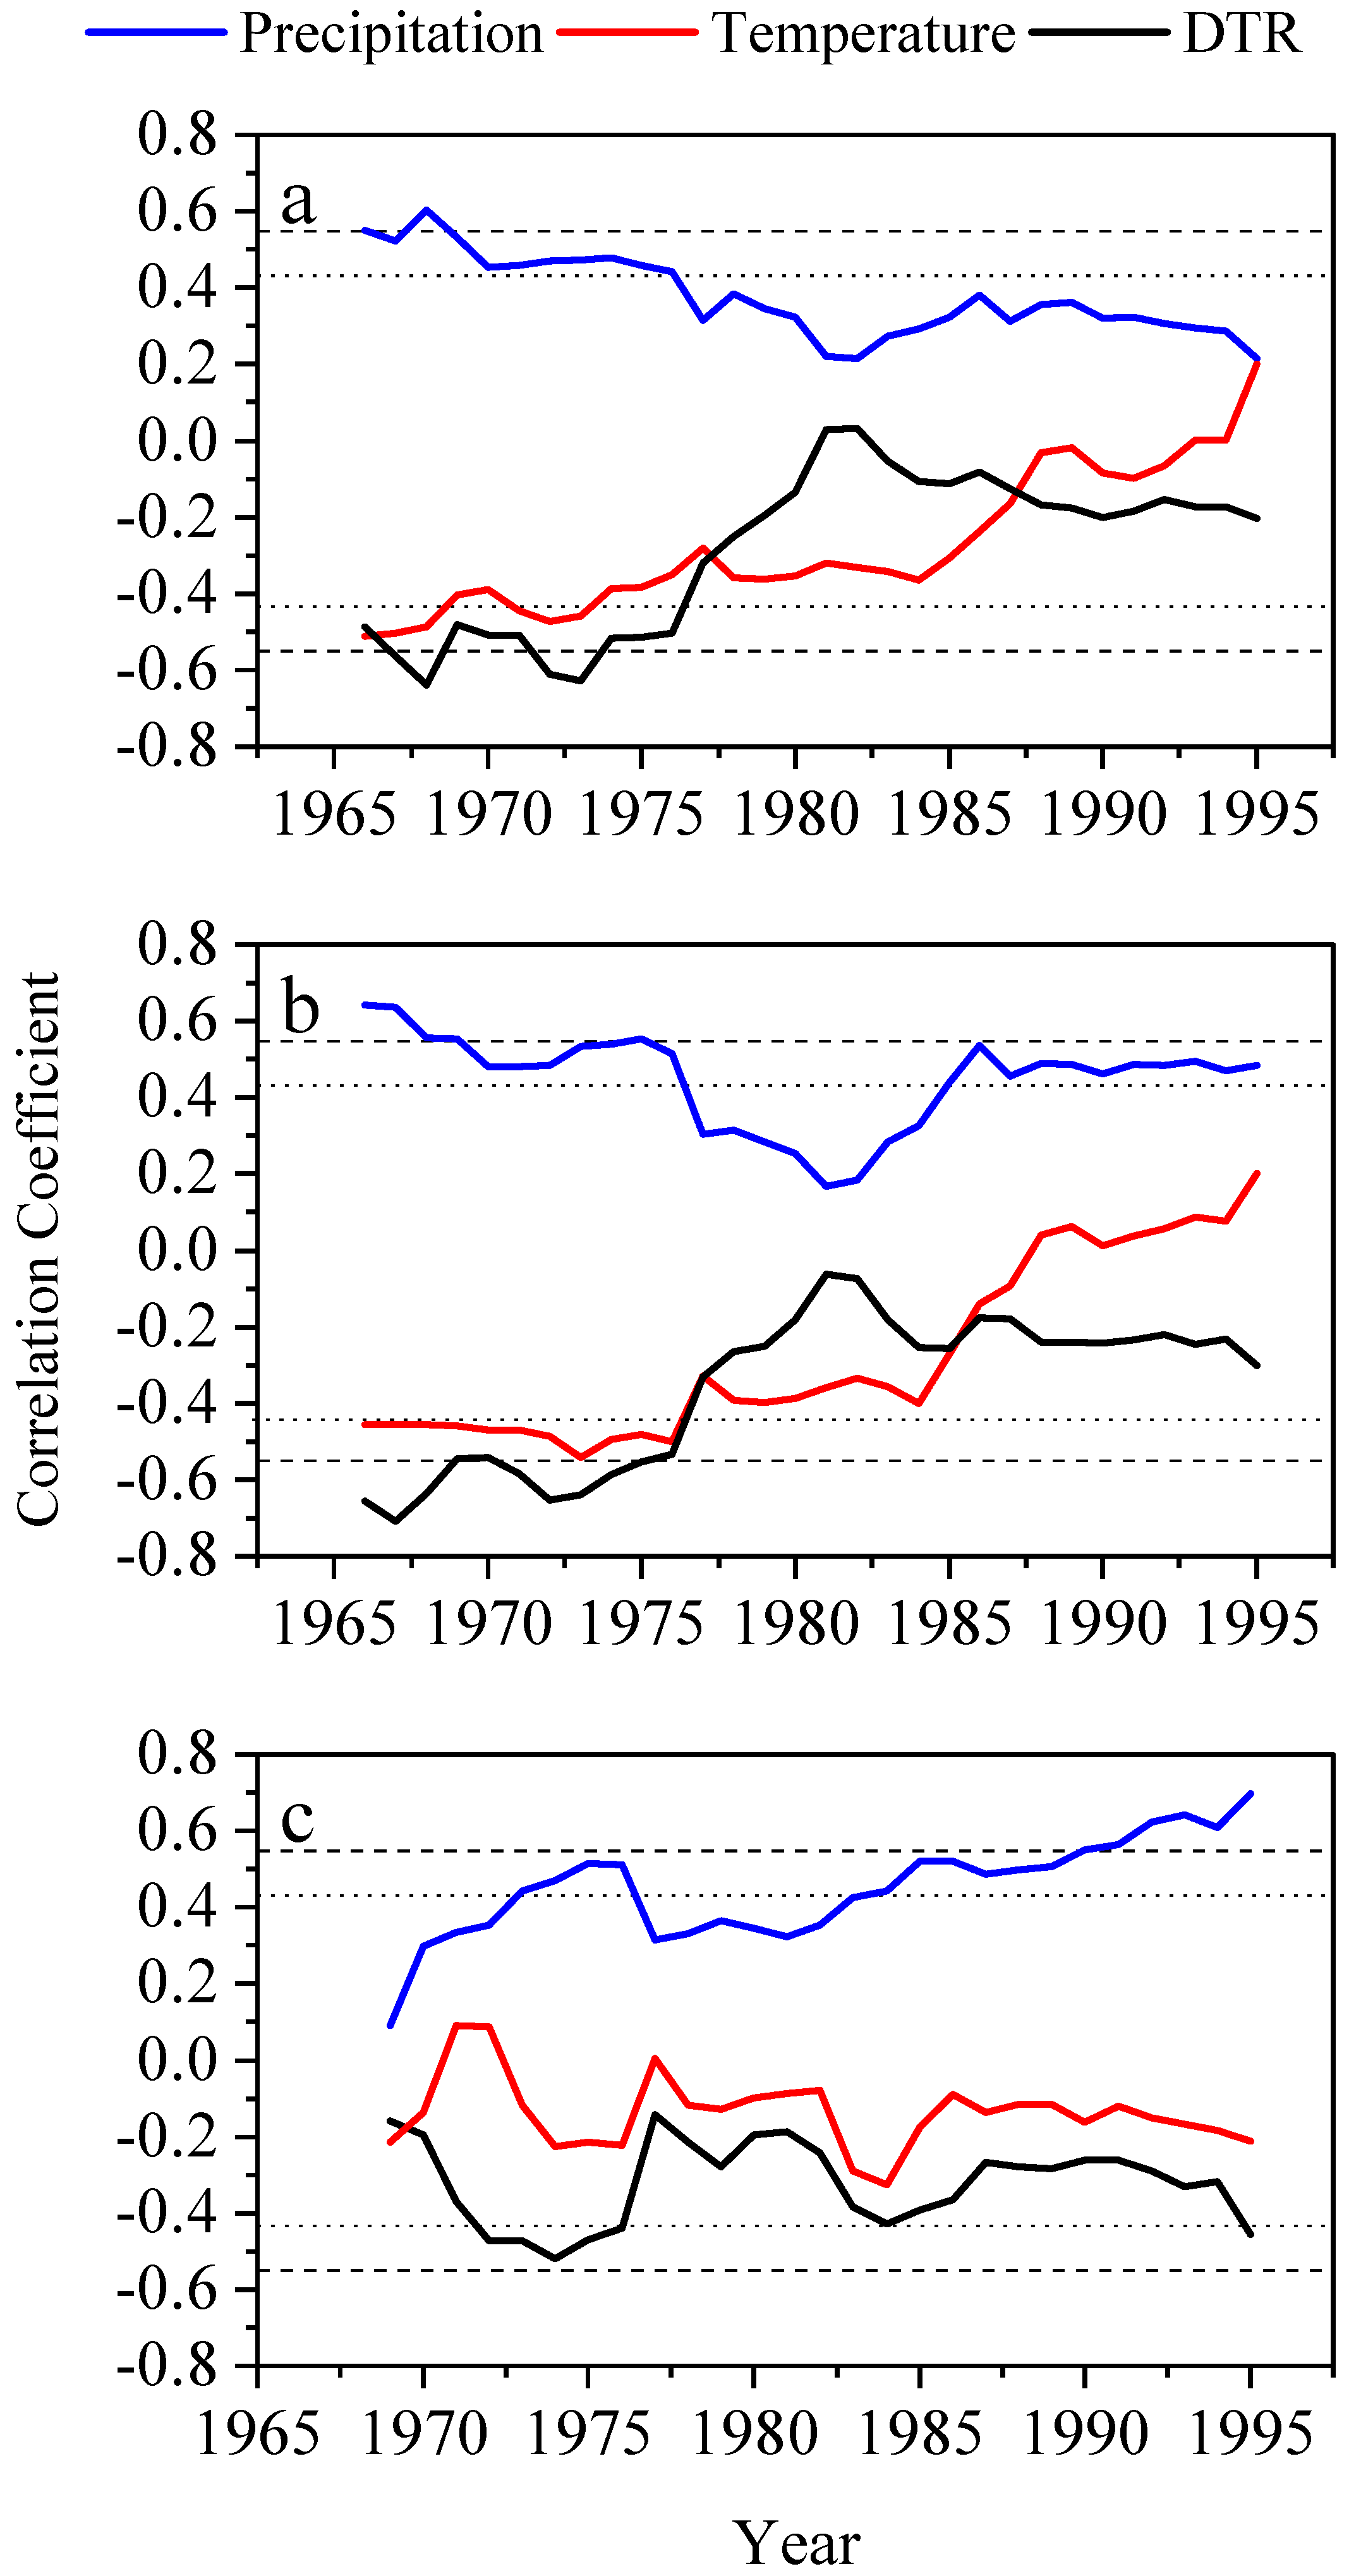
3.2. Tree-Ring Chronology and Climate–Growth Relationship

The reliable timespan of the TRW and LWW chronologies extended from 1966 to 2015, and the reliable LWR chronologies spanned from 1969 to 2015 (Figure 6). The TRW STD chronology was significantly positively correlated with precipitation from May to September, and significantly negatively correlated with temperature in June. Significant negative correlations between the STD and DTR were also seen in the current June and June–October (Figure 7a). The LWW chronology was significantly and positively correlated with precipitation in July but showed significant and negative relationships with the DTR in June and October (Figure 7b). For LWR chronology, STD had a significantly positive relationship with precipitation in July and July–October and had a negative relationship with the DTR in July–October (Figure 7c). Only June VPD was significantly negatively correlated with TRW, while the relationship between VPD and scPDSI and the tree-ring metrics was not significant in any other month (Figure S2). Thus, drought stress induced by high temperature and relative lower precipitation was the most determining factor for tree growth in the study region. The DTR changes also had a strong negative effect on the growth of Pinus massoniana.
After screening, we found that 1975, 1984, 1985, 1990, 2000, 2012 and 2015 were extreme low DTR years, while 1966, 1967, 1971, 2003 and 2004 were extreme high DTR years (Table S1). Enhanced tree growth was found at a lower DTR in the absence of severe drought. However, it is noteworthy that only the change in latewood width reached significance (Figure 8).
Moving correlation analysis with the 21-year window revealed that the influence of temperature on the different indices of chronology was unstable and indicated index difference. The negative effect of temperature and the DTR declined for TRW and LWW but not for LWR. Whereas the positive effect of precipitation was strengthened only for LWR, it seemed static for LWW and decreased for TRW (Figure 9).

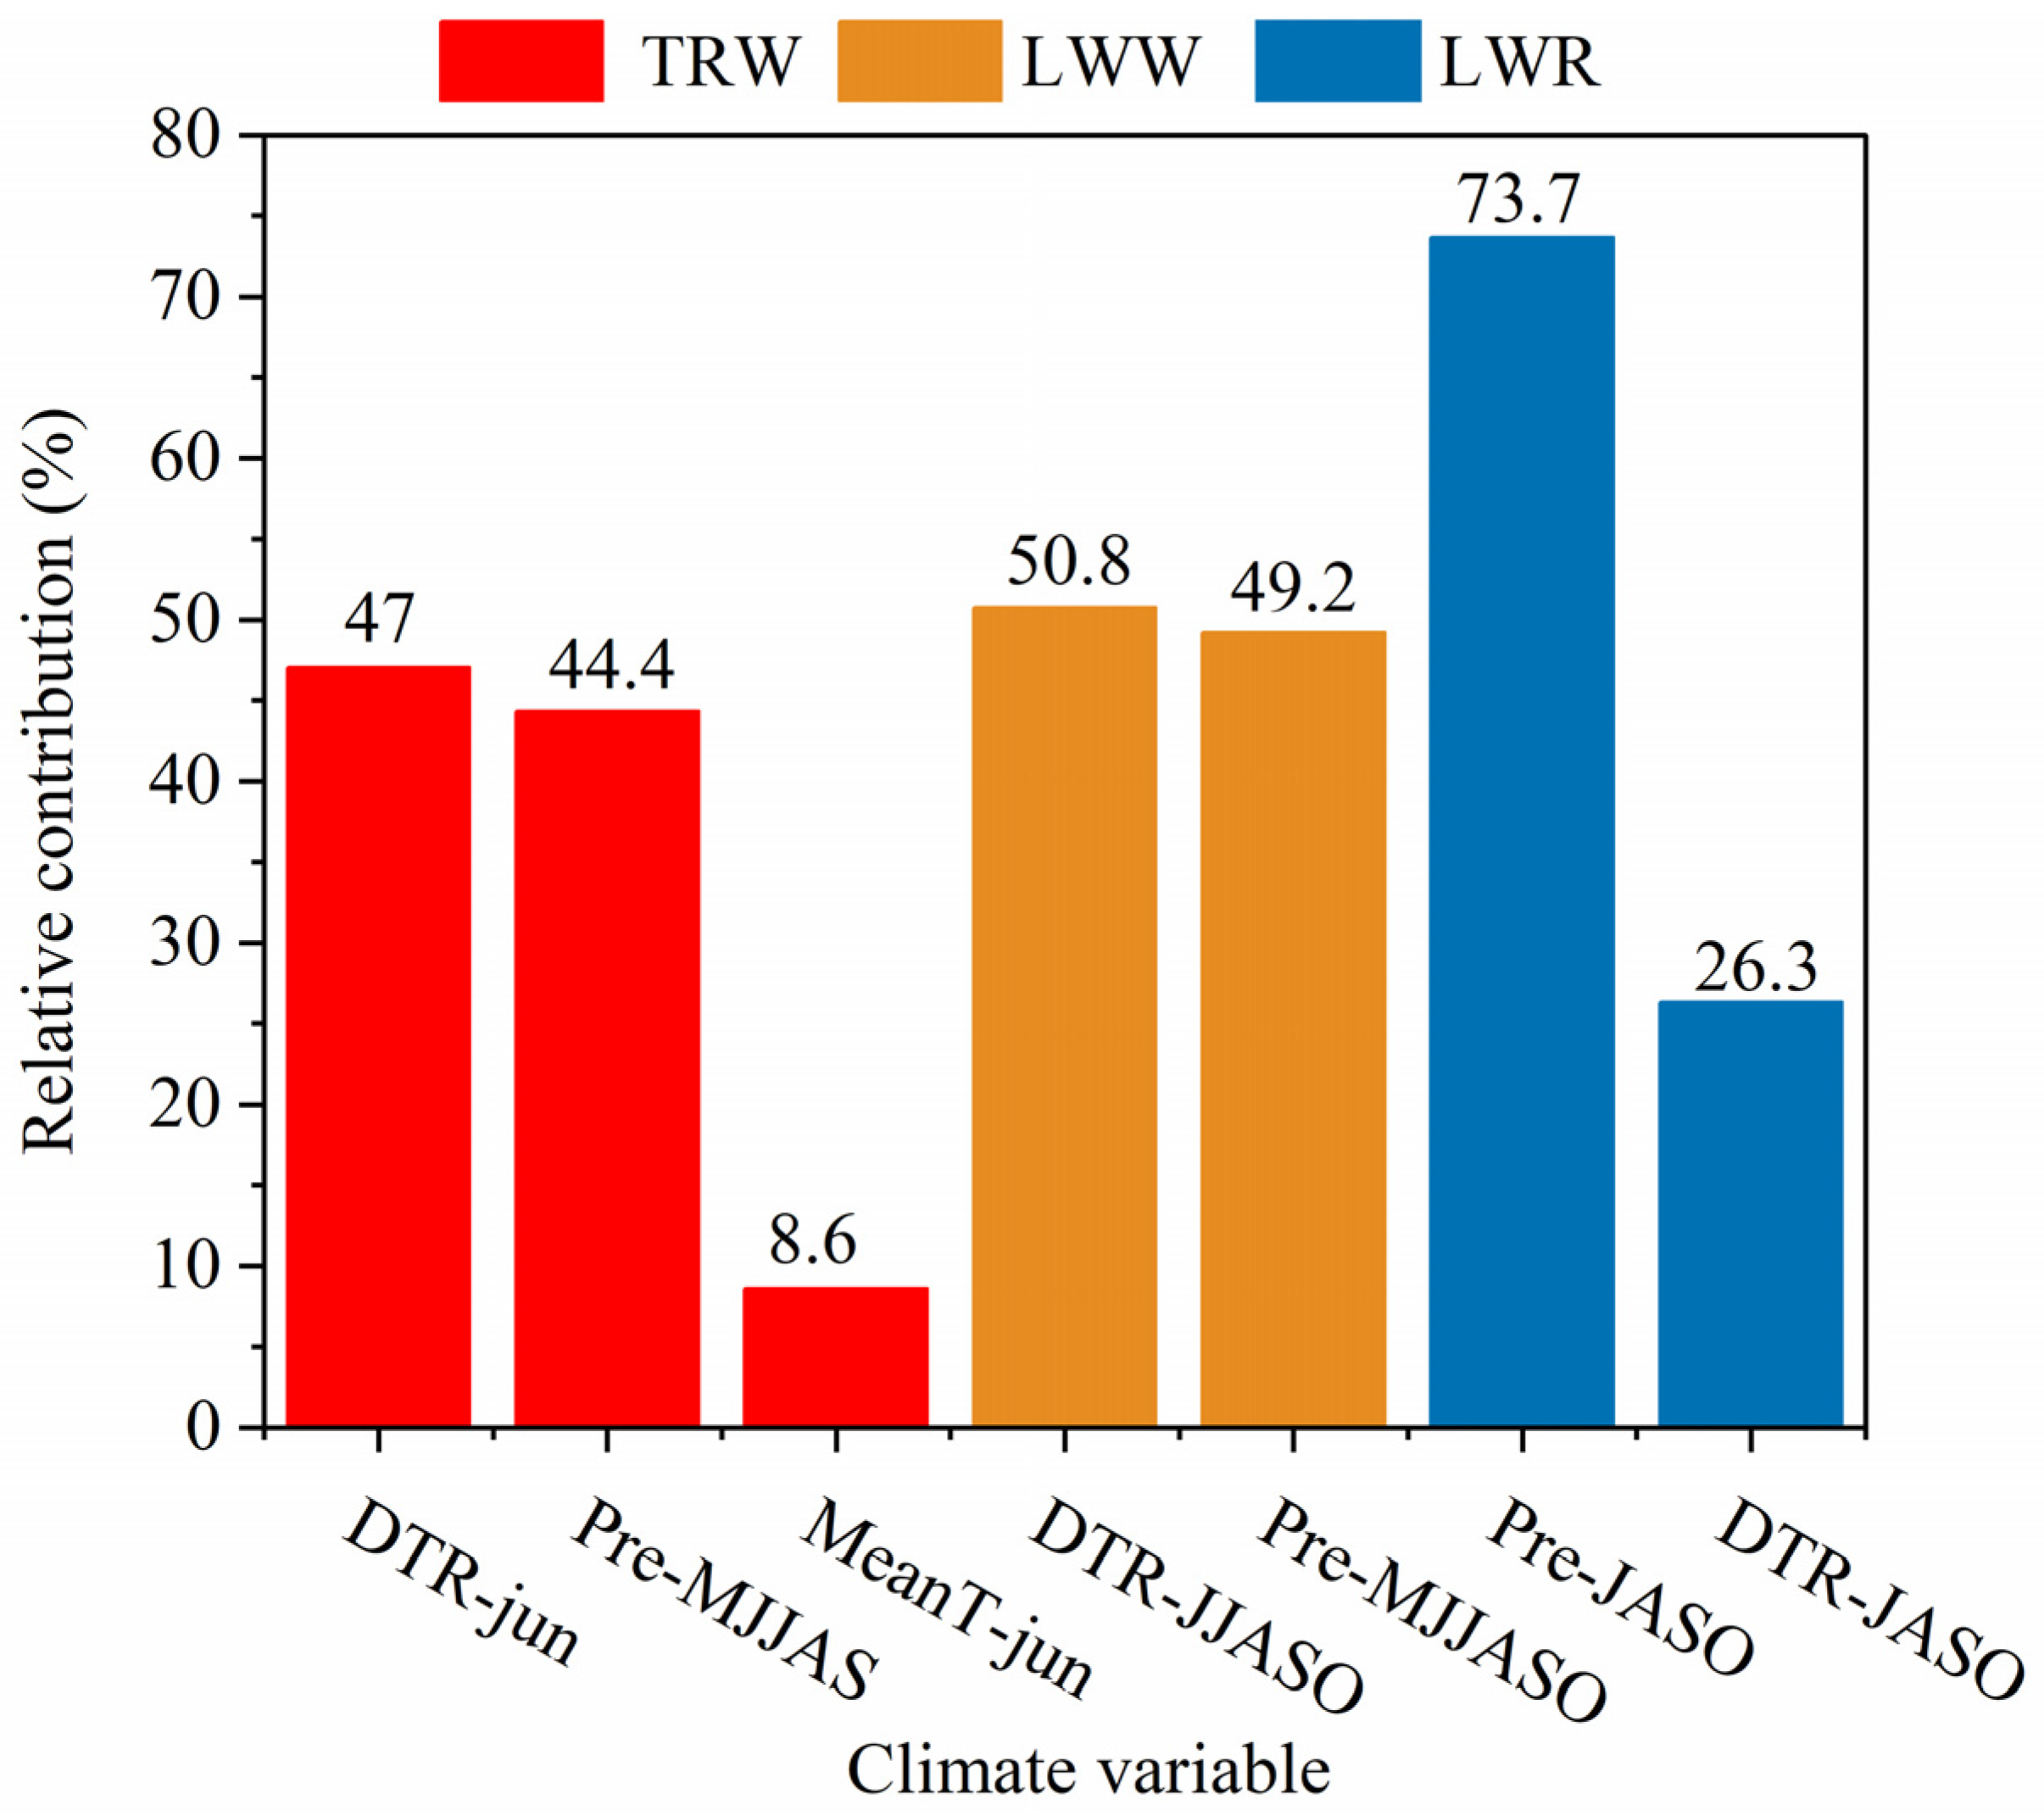
3.3. The Contribution of Climatic Factors in Climate–Growth Relationships

Variability in the DTR in June, the precipitation in May–September and the temperature in June played the dominant roles in the formation of the annual rings, which accounted for 47%, 44.4% and 8.6% of the TRW chronology, respectively. For LWW chronology, the contributions of the June–October DTR and May–October precipitation were 50.8% and 49.2%, respectively. For LWR chronology, the contribution of July–October precipitation was 73.7% and the contribution of the July–October DTR was 26.3%. Overall, the DTR contributes more to TRW and LWW in Pinus massoniana than precipitation, but precipitation is the most important factor to regulate the change in LWR (Figure 10).

4. Discussion

4.1. The Effect of Heat-Protecting on Latewood Formation and Wood Anatomy

Abrupt temperature shifts were considered as one of the major factors that induce the anatomical structure changes in trees [32]. In this study, no significant decrease was found in the latewood caused by the heating-protecting treatment (Figure 5), suggesting that the DTR was not the major factor for the latewood formation of Pinus massoniana. Pinus massoniana trees in Southeast China produced latewood in June and July rather than the late growing season [51]. The distinct disparity between the cellular morphology between earlywood and latewood is also interpreted as an important adaptation strategy of trees to maintain equilibrium for their capacity to conduct water, mechanical stability and resistance to cavitation [52]. Latewood formation can occur in the middle stage of the growing season when adverse conditions arrive earlier than normal [25]. Drought stress is one of the important triggers for the formation of latewood [19,20]. For instance, in arid areas, the lumen area of the earlywood diminishes markedly to reduce the risk of cavitation [53,54]. Therefore, it is assumed that an increase in the latewood ratio may store a large amount of stored water and increase resistance to drought [55,56]. The latewood formation of Pinus massoniana occurred exactly in summer when tree growth was suffering drought stress [35,36].
The decrease in the cell wall thickness and radial lumen diameter of earlywood and latewood cohered with the decreased DTR (Figure 5). Temperature is closely linked with carbon mobilization and deposition rates at the time of wall thickening [57]. Thus, the lower daytime temperature due to heat-protecting may constrain cell wall deposition rates and lead to the thinning of the cell wall [58]. Wall thickening involves high energetic costs and depends mainly on the carbohydrates produced by photosynthesis [59,60]. Under natural conditions, the increased cell wall thickness of the tracheid occurred due to the greater availability of photosynthate in the cambial zone [61]. Stem temperature had a critical effect on stem respiration [62]. Nighttime warming and less precipitation aggravated carbon loss through intensified respiration, and limited plant growth [63,64,65,66]. Indeed, previous studies have found that low photosynthate supply as a result of factors, such as higher night temperatures leading to increased respiration, may result in the reduced cell wall thickness of gymnosperm seedlings and saplings [61]. The changes in the concentrations of soluble sugars might affect the osmotic potential of cells to provide the turgor pressure for cell expansion [67]. We, therefore, speculate that the nonsignificant reduction in cell diameter may be caused by a decrease in starch content due to increased nighttime respiration, which affects osmotic pressure and thus limits cell expansion. (Figure 5b,e) [68].
However, the heat-protecting treatment failed to cause a remarkable decrease in latewood density in Pinus massoniana in the study area. It is worth noting that BI is still a prototype parameter as it is still less tested relative to MXD in representing the density, although recent researchers in the immediate region have demonstrated the effectiveness of BI in representing density to some extent [69,70]. Latewood density is mainly determined by the cell wall thickness and lumen area [71,72]. Previous research found the Eucalyptus grandis seeding reduction in the lumen area of xylem with increasing temperature [15], and nighttime temperatures having a greater effect on tracheid expansion than daytime temperatures in Larix sibirica Ldb. and Podocarpus latifolius (Thunb.) R.Br. ex Mirb. [73,74]. The nonsignificant decrease in the lumen area and the number of latewood cells may offset the impact of the thickening of the cell wall, resulting in a nonsignificant decrease in latewood density.

4.2. Tree Growth Relationship

Different parts of an annual ring may contain different environmental signals, or they contain the same signal but with different strengths [69]. The LWW and LWR tended to be more sensitive to summer drought, which demonstrated that Pinus massoniana in the study area possibly produced latewood in summer [51]. Summer droughts limited tree growth via modulations of evapotranspiration, leading to a decrease in stomatal conductance and photosynthesis rate [75,76,77]. Such response patterns of trees to summer drought in subtropical China have been verified by previous tree-ring studies and observations of intra-annual wood formation monitoring [35,36,78,79].
The DTR strongly influences the net photosynthetic product of trees via modulations of photosynthesis in the daytime and respiration at night [28,80]. The DTR played a dominant role in regulating the growth of TRW and LWW instead of drought. The DTR variations were commonly [81] affected by land surface, atmospheric boundary layer processes, clouds, aerosols and atmospheric circulations [82]. Thus, the correlations of the DTR with the Tmax, Tmin and precipitation were examined to explain the negative correlations between the tree-ring index and DTR (Figure S1). Enhanced precipitation and soil moisture usually reduced the DTR through surface evaporative cooling [83]. Generally, cloudy, mild and wet conditions during the vegetation period may lower the DTR and enhance photosynthetic activity and biomass productivity [84]. However, in the study area, a high DTR during the summer season likely corresponded to cloudless weather, which reduced soil moisture availability due to high temperatures, little rainfall and enhanced evapotranspiration. This also explains why all tree-ring indices are at low values in the extreme high DTR scenario. The close DTR–growth relationships were also reported in the eastern Tibetan plateau and central Spain [29,85]. It is worth noting that the consequences of the reduced DTR on tree growth remain uncertain. Greater nighttime than daytime warming, associated with a wetter climate, has been demonstrated to be beneficial to plant growth [81]. For instance, a reduced DTR mitigates drought impacts on larch and benefits tree growth in North China [28]. However, the reduced DTR with warmer summer night conditions could lead to an unfavorable tree carbon budget and cause tree mortality in Southeast Alaska [66]. Studies about the effects of the DTR on tree growth in humid subtropical regions are still limited. Given the decreasing trends of the DTR in the study region, we suggest the DTR could become an increasingly important factor for tree growth in the future.
The “divergence phenomenon” was found in the climate–growth relationships of Pinus massoniana trees in the study area, which showed a strengthened (weakened) linkage with precipitation (temperature). Consistent with the warming climate, such a response pattern has been frequently reported in cold and alpine regions [9,86]. In recent years, the phenomenon was also found in warm and humid subtropical regions [87,88,89]. Great effort has been made to indicate the possible mechanism of the “divergence problem”, but the associated knowledge is still too fragmental by far due to various driving factors [90,91,92,93,94]. Temperature-induced drought stress has been proved to be one of the driving mechanisms of the “divergence problem” [90,92]. For instance, the increasing influence of precipitation in May and July weakened the relationship between temperature and tree rings at low altitudes in the Dabie Mountains [87]. Although a significant temperature increase did occur in the study area, no significant drought trend was found, so we suggest that growth divergence in Pinus massoniana may not be caused by water deficit in this research. In addition, the decrease in the DTR may also be an important reason for the “divergence problem”. Previous research confirmed the cause of the reduced temperature sensitivity of whitebark pine in the western Canadian Cordillera is related to the interaction between the DTR and cloud cover patterns [95].

5. Conclusions

In the present work, we designed a novel experiment to investigate the effect of the DTR on latewood formation of Pinus massoniana in HSC. We used the heat-protecting layers to wrap up the tree trunks to lower the temperature gradients and mimic the environmental conditions underground. In addition, we developed the TRW, LWW and LWR chronologies of Pinus massoniana trees to analyze the climate–growth relationships and temporal stability. Although the heat-protecting treatment did not lead to a significant reduction in the number of latewood cells, it could reduce the cell wall thickness of the latewood. On the interannual scale, we found that the DTR strongly limited the TRW and LWW of Pinus massoniana, even though precipitation is still the most important factor to regulate the LWR. LWW and LWR have become more sensitive to moisture availability and less sensitive to temperature in recent decades. Such an unstable relationship might be linked to the DTR. Our research provides more insights into explaining the formation of latewood and understanding the generation of the “divergence problem”.

Supplementary Materials

The following supporting information can be downloaded at: https://www.mdpi.com/article/10.3390/f13091439/s1, Figure S1. (a) Correlation matrix about the DTR, Precipitation, Maximum temperature and minimum temperature. red and blue indicate the positive and negative relationship, respectively. The “*” indicate the p = 0.05 significance level. The linear fit about DTR and minimum temperature (b), Maximum temperature (c) and precipitation (d). Figure S2. Correlations between (a) tree-ring width (TRW), (b) latewood width (LWW), (c) latewood ratio (LWR) and scPDSI (left), VPD (right). The correlations were calculated from previous (capital letter) October to current (lowercase letters) October, with significant correlations shown in gray (p < 0.05) and black (p < 0.01). Table S1. tree-ring width (TRW), Latewood width (LWW) and latewood ratio (LWR) in extreme Low and high DTR year.

Author Contributions

Conceptualization, K.F.; Data curation, Z.Z. and Z.D.; Formal analysis, Z.Z.; Methodology, F.Z.; Supervision, K.F. and Y.C.; Validation, Y.L.; Writing—original draft, Z.Z.; Writing—review & editing, K.F., Y.C. and F.Z. All authors have read and agreed to the published version of the manuscript.

Funding

This research was funded by National Science Foundation of China grant number [41971022, 41888101 and 42130507], the Swedish Research Council Formas project (2017-01408), and Fellowship for the Youth Talent Support Program of Fujian Province.

Institutional Review Board Statement

Not applicable.

Informed Consent Statement

Not applicable.

Data Availability Statement

Data sharing is not applicable.

Acknowledgments

The authors are grateful to the anonymous reviewers and Academic Editor for their valuable comments on the revision of this article.

Conflicts of Interest

The authors declare no conflict of interest.

References

  1. Rutherford, S.; Mann, M.; Osborn, T.; Briffa, K.; Jones, P.D.; Bradley, R.; Hughes, M. Proxy-based Northern Hemisphere surface temperature reconstructions: Sensitivity to method, predictor network, target season, and target domain. J. Clim. 2005, 18, 2308–2329. [Google Scholar] [CrossRef]
  2. Fan, Z.-X.; Bräuning, A.; Yang, B.; Cao, K.-F. Tree ring density-based summer temperature reconstruction for the central Hengduan Mountains in southern China. Glob. Planet. Chang. 2009, 65, 1–11. [Google Scholar] [CrossRef]
  3. Anchukaitis, K.J.; Wilson, R.; Briffa, K.R.; Büntgen, U.; Cook, E.R.; D’Arrigo, R.; Davi, N.; Esper, J.; Frank, D.; Gunnarson, B.E. Last millennium Northern Hemisphere summer temperatures from tree rings: Part II, spatially resolved reconstructions. Quat. Sci. Rev. 2017, 163, 1–22. [Google Scholar] [CrossRef]
  4. Deng, G.; Li, M.; Hao, Z.; Shao, X. Responses to Climate Change of Maximum Latewood Density from Larix speciosa Cheng et Law and Abies delavayi Franch. in the Northwest of Yunnan Province, China. Forests 2022, 13, 720. [Google Scholar] [CrossRef]
  5. Yin, H.; Sun, Y.; Li, M.-Y. Reconstructed temperature change in late summer over the eastern Tibetan Plateau since 1867 CE and the role of anthropogenic forcing. Glob. Planet. Chang. 2022, 208, 103715. [Google Scholar] [CrossRef]
  6. Esper, J.; Düthorn, E.; Krusic, P.J.; Timonen, M.; Büntgen, U. Northern European summer temperature variations over the Common Era from integrated tree-ring density records. J. Quat. Sci. 2014, 29, 487–494. [Google Scholar] [CrossRef]
  7. Wu, P.; Wang, L.; Shao, X. Reconstruction of summer temperature variation from maximum density of alpine pine during 1917–2002 for west Sichuan Plateau, China. J. Geogr. Sci. 2008, 18, 201–210. [Google Scholar] [CrossRef]
  8. Schneider, L.; Smerdon, J.E.; Büntgen, U.; Wilson, R.J.S.; Myglan, V.S.; Kirdyanov, A.V.; Esper, J. Revising midlatitude summer temperatures back to A.D. 600 based on a wood density network. Geophys. Res. Lett. 2015, 42, 4556–4562. [Google Scholar] [CrossRef]
  9. D’Arrigo, R.; Wilson, R.; Liepert, B.; Cherubini, P. On the ‘divergence problem’ in northern forests: A review of the tree-ring evidence and possible causes. Glob. Planet. Chang. 2008, 60, 289–305. [Google Scholar] [CrossRef]
  10. Leonelli, G.; Coppola, A.; Baroni, C.; Salvatore, M.C.; Maugeri, M.; Brunetti, M.; Pelfini, M. Multispecies dendroclimatic reconstructions of summer temperature in the European Alps enhanced by trees highly sensitive to temperature. Clim. Chang. 2016, 137, 275–291. [Google Scholar] [CrossRef]
  11. Qiu, T.; Sharma, S.; Woodall, C.W.; Clark, J.S. Niche Shifts From Trees to Fecundity to Recruitment That Determine Species Response to Climate Change. Front. Ecol. Evol. 2021, 9, 719141. [Google Scholar] [CrossRef]
  12. Castagneri, D.; Fonti, P.; von Arx, G.; Carrer, M. How does climate influence xylem morphogenesis over the growing season? Insights from long-term intra-ring anatomy in Picea abies. Ann. Bot. 2017, 119, 1011–1020. [Google Scholar] [CrossRef] [PubMed]
  13. Yuichiro, O.; Takafumi, K. Effect of heat on cambial reactivation during winter dormancy in evergreen and deciduous conifers. Tree Physiol. 1997, 17, 81–87. [Google Scholar]
  14. Giovannelli, A.; Mattana, S.; Emiliani, G.; Anichini, M.; Traversi, M.L.; Pavone, F.S.; Cicchi, R. Localized stem heating from the rest to growth phase induces latewood-like cells formation and slower stem radial growth in Norway spruce saplings. Tree Physiol. 2021, 42, 1149–1163. [Google Scholar] [CrossRef] [PubMed]
  15. Thomas, S.D.; Montagu, D.K.; Conroy, P.J. Temperature effects on wood anatomy, wood density, photosynthesis and biomass partitioning of Eucalyptus grandis seedlings. Tree Physiol. 2007, 27, 251–260. [Google Scholar] [CrossRef]
  16. Mellerowicz, E.; Coleman, W.; Riding, R.; Little, C. Periodicity of cambial activity in Abies balsamea. I. Effects of temperature and photoperiod on cambial dormancy and frost hardiness. Physiol. Plant. 1992, 85, 515–525. [Google Scholar] [CrossRef]
  17. Eklund, L.; Little, C.A.; Riding, R.T. Concentrations of oxygen and indole-3-acetic acid in the cambial region during latewood formation and dormancy development in Picea abies stems. J. Exp. Bot. 1998, 49, 205–211. [Google Scholar]
  18. Babushkina, E.A.; Belokopytova, L.V.; Zhirnova, D.F.; Vaganov, E.A. Siberian spruce tree ring anatomy: Imprint of development processes and their high-temporal environmental regulation. Dendrochronologia 2019, 53, 114–124. [Google Scholar] [CrossRef]
  19. Campelo, F.; Nabais, C.; Freitas, H.; Gutiérrez, E. Climatic significance of tree-ring width and intra-annual density fluctuations in Pinus pinea from a dry Mediterranean area in Portugal. Ann. For. Sci. 2007, 64, 229–238. [Google Scholar] [CrossRef]
  20. Lebourgeois, F. Climatic signals in earlywood, latewood and total ring width of Corsican pine from western France. Ann. For. Sci. 2000, 57, 155–164. [Google Scholar] [CrossRef]
  21. Zahner, R.; Lotan, J.E.; Baughman, W.D. Earlywood-latewood features of red pine grown under simulated drought and irrigation. For. Sci. 1964, 10, 361–370. [Google Scholar]
  22. Pharis, R.; Jenkins, P.; Aoki, H.; Sassa, T. Hormonal physiology of wood growth in Pinus radiata D. Don: Effects of gibberellin A4 and the influence of abscisic acid upon (3H) gibberellin A4 metabolism. Funct. Plant Biol. 1981, 8, 559–570. [Google Scholar] [CrossRef]
  23. Davies, P.J. Plant Hormones: Physiology, Biochemistry and Molecular Biology; Springer Science & Business Media: New York, NY, USA, 2013. [Google Scholar]
  24. Funada, R.; Kubo, T.; Tabuchi, M.; Sugiyama, T.; Fushitani, M. Seasonal variations in endogenous indole-3-acetic acid and abscisic acid in the cambial region of Pinus densiflora Sieb. et Zucc. stems in relation to earlywood-latewood transition and cessation of tracheid production. Holzforschung 2001, 55, 128–134. [Google Scholar]
  25. Renninger, H.J.; Gartner, B.L.; Grotta, A.T. No correlation between latewood formation and leader growth in Douglas-fir saplings. Iawa J. 2006, 27, 183–191. [Google Scholar] [CrossRef]
  26. Funada, R.; Kubo, T.; Fushitani, M. Early-and latewood formation in Pinus densiflora trees with different amounts of crown. Iawa J. 1990, 11, 281–288. [Google Scholar] [CrossRef]
  27. Braganza, K.; Karoly, D.J.; Arblaster, J.M. Diurnal temperature range as an index of global climate change during the twentieth century. Geophys. Res. Lett. 2004, 31, L13217. [Google Scholar] [CrossRef]
  28. Zhang, X.; Manzanedo, R.D.; Lv, P.; Xu, C.; Hou, M.; Huang, X.; Rademacher, T. Reduced diurnal temperature range mitigates drought impacts on larch tree growth in North China. Sci. Total Environ. 2022, 848, 157808. [Google Scholar] [CrossRef]
  29. Büntgen, U.; Martínez-Peña, F.; Aldea, J.; Rigling, A.; Fischer, E.M.; Camarero, J.J.; Hayes, M.J.; Fatton, V.; Egli, S. Declining pine growth in Central Spain coincides with increasing diurnal temperature range since the 1970s. Glob. Planet. Chang. 2013, 107, 177–185. [Google Scholar] [CrossRef]
  30. Stoffel, M.; Corona, C.; Ballesteros-Cánovas, J.A.; Bodoque, J.M. Dating and quantification of erosion processes based on exposed roots. Earth-Sci. Rev. 2013, 123, 18–34. [Google Scholar] [CrossRef]
  31. Zhou, F.; Gou, X.; Zhang, J.; Zhao, Z.; Chen, Q.; Cao, Z. Application of Picea wilsonii roots to determine erosion rates in eastern Qilian Mountains, Northwest China. Trees 2013, 27, 371–378. [Google Scholar] [CrossRef]
  32. Friedman, J.M.; Vincent, K.R.; Shafroth, P.B. Dating floodplain sediments using tree-ring response to burial. Earth Surf. Process. Landf. 2010, 30, 1077–1091. [Google Scholar] [CrossRef]
  33. Thorne, P.; Donat, M.; Dunn, R.; Williams, C.; Alexander, L.; Caesar, J.; Durre, I.; Harris, I.; Hausfather, Z.; Jones, P. Reassessing changes in diurnal temperature range: Intercomparison and evaluation of existing global data set estimates. J. Geophys. Res. Atmos. 2016, 121, 5138–5158. [Google Scholar] [CrossRef]
  34. Huang, J.-G.; Guo, X.; Rossi, S.; Zhai, L.; Yu, B.; Zhan, S.; Zhang, M. Intra-annual wood formation of subtropical Chinese red pine shows better growth in dry season than wet season. Tree Physiol. 2018, 38, 1225–1236. [Google Scholar] [CrossRef]
  35. Li, D.; Fang, K.; Li, Y.; Chen, D.; Liu, X.; Dong, Z.; Zhou, F.; Guo, G.; Shi, F.; Xu, C. Climate, intrinsic water-use efficiency and tree growth over the past 150 years in humid subtropical China. PLoS ONE 2017, 12, e0172045. [Google Scholar]
  36. Li, Y.; Fang, K.; Cao, C.; Li, D.; Zhou, F.; Dong, Z.; Zhang, Y.; Gan, Z. A tree-ring chronology spanning 210 years in the coastal area of southeastern China, and its relationship with climate change. Clim. Res. 2016, 67, 209–220. [Google Scholar] [CrossRef]
  37. Peel, M.C.; Finlayson, B.L.; McMahon, T.A. Updated world map of the Köppen-Geiger climate classification. Hydrol. Earth Syst. Sci. 2007, 11, 1633–1644. [Google Scholar] [CrossRef]
  38. Stokes, M.A. An Introduction to Tree-Ring Dating; University of Arizona Press: Arizona, AZ, USA, 1996. [Google Scholar]
  39. Schweingruber, F.H. Tree Rings: Basics and Applications of Dendrochronology; Springer Science & Business Media: New York, NY, USA, 1988. [Google Scholar]
  40. Holmes, R.L. Computer-Assisted Quality Control in Tree-Ring Dating and Measurement. Tree-Ring Bull. 1983, 43, 52–67. [Google Scholar]
  41. Cook, E.R. A Time Series Analysis Approach to Tree Ring Standardization. Ph.D. Thesis, University of Arizona, Tucson, AZ, USA, 1985. [Google Scholar]
  42. Wigley, T.M.; Briffa, K.R.; Jones, P.D. On the average value of correlated time series, with applications in dendroclimatology and hydrometeorology. J. Clim. Appl. Meteorol. 1984, 23, 201–213. [Google Scholar] [CrossRef]
  43. Buras, A. A comment on the expressed population signal. Dendrochronologia 2017, 44, 130–132. [Google Scholar] [CrossRef]
  44. Larsson, L.-Å. CooRecorder and CDendro Programs of the CooRecorder/CDendro Package Version 9.3. Available online: http://www.cybis.se/forfun/dendro/ (accessed on 3 March 2018).
  45. Rydval, M.; Larsson, L.-Å.; McGlynn, L.; Gunnarson, B.E.; Loader, N.J.; Young, G.H.; Wilson, R. Blue intensity for dendroclimatology: Should we have the blues? Experiments from Scotland. Dendrochronologia 2014, 32, 191–204. [Google Scholar] [CrossRef]
  46. Denne, M. Definition of latewood according to Mork (1928). Iawa J. 1989, 10, 59–62. [Google Scholar] [CrossRef]
  47. Harris, I.; Osborn, T.J.; Jones, P.; Lister, D. Version 4 of the CRU TS monthly high-resolution gridded multivariate climate dataset. Sci. Data 2020, 7, 109. [Google Scholar] [CrossRef] [PubMed]
  48. R Core Team. R: A Language and Environment for Statistical Computing; R Foundation for Statistical Computing: Vienna, Austria, 2017. [Google Scholar]
  49. Elith, J.; Leathwick, J.R.; Hastie, T. A working guide to boosted regression trees. J. Anim. Ecol. 2008, 77, 802–813. [Google Scholar] [CrossRef]
  50. Robert, H.; Steven, P.; John, L.; Jane, E. Dismo: Species Distribution Modeling. R Package Version 2020. Available online: https://cran.r-project.org/web/packages/dismo/dismo.pdf (accessed on 10 August 2022).
  51. Zhang, Y.; Fang, K.; ZHou, F.; Dong, Z.; Gan, Z.; Li, D. A Study on the Inter-annual Latewood Growth of pinus massoniana in Fuzhou. J. Subtrop. Resour. Environ. 2016, 11, 59–64. [Google Scholar]
  52. De Luis, M.; Novak, K.; Raventós, J.; Gričar, J.; Prislan, P.; Čufar, K. Climate factors promoting intra-annual density fluctuations in Aleppo pine (Pinus halepensis) from semiarid sites. Dendrochronologia 2011, 29, 163–169. [Google Scholar] [CrossRef]
  53. Vieira, J.; Rossi, S.; Campelo, F.; Freitas, H.; Nabais, C. Xylogenesis of Pinus pinaster under a Mediterranean climate. Ann. For. Sci. 2014, 71, 71–80. [Google Scholar] [CrossRef]
  54. Eilmann, B.; Zweifel, R.; Buchmann, N.; Fonti, P.; Rigling, A. Drought-induced adaptation of the xylem in Scots pine and pubescent oak. Tree Physiol. 2009, 29, 1011–1020. [Google Scholar] [CrossRef] [Green Version]
  55. Domec, J.C.; Gartner, B.L. How do water transport and water storage differ in coniferous earlywood and latewood? J. Exp. Bot. 2002, 53, 2369–2379. [Google Scholar] [CrossRef]
  56. Martinez-Meier, A.; Sanchez, L.; Pastorino, M.; Gallo, L.; Rozenberg, P. What is hot in tree rings? The wood density of surviving Douglas-firs to the 2003 drought and heat wave. For. Ecol. Manag. 2008, 256, 837–843. [Google Scholar] [CrossRef]
  57. Gindl, W.; Grabner, M.; Wimmer, R. The influence of temperature on latewood lignin content in treeline Norway spruce compared with maximum density and ring width. Trees 2000, 14, 409–414. [Google Scholar] [CrossRef]
  58. Cuny, H.E.; Rathgeber, C.B. Xylogenesis: Coniferous Trees of Temperate Forests Are Listening to the Climate Tale during the Growing Season But Only Remember the Last Words! Plant Physiol. 2016, 171, 306–317. [Google Scholar] [CrossRef] [PubMed]
  59. Demura, T.; Ye, Z.-H. Regulation of plant biomass production. Curr. Opin. Plant Biol. 2010, 13, 298–303. [Google Scholar] [CrossRef] [PubMed]
  60. Cuny, H.E.; Rathgeber, C.B.; Frank, D.; Fonti, P.; Mäkinen, H.; Prislan, P.; Rossi, S.; Del Castillo, E.M.; Campelo, F.; Vavrčík, H. Woody biomass production lags stem-girth increase by over one month in coniferous forests. Nat. Plants 2015, 1, 15160. [Google Scholar] [CrossRef]
  61. Larson, P.R. Some indirect effects of environment on wood formation. In The Formation of Wood in Forest Tress; Zimmermann, M.H., Ed.; Academic Press: New York, NY, USA, 1964; pp. 345–365. [Google Scholar]
  62. Yang, Q.; Xu, M.; Chi, Y.; Zheng, Y. Relationship between stem CO2 efflux and stem temperature at different measuring depths in Pinus massoniana trees. Acta Ecol. Sin. 2016, 36, 229–235. [Google Scholar] [CrossRef]
  63. Yokota, T.; Hagihara, A. Seasonal change in the temperature coefficient Q 10 for respiration of field-grown hinoki cypress (Chamaecyparis obtusa) trees. J. For. Res. 1996, 1, 165–168. [Google Scholar] [CrossRef]
  64. Yang, Y.; Zhao, M.; Xu, X.; Sun, Z.; Yin, G.; Piao, S. Diurnal and seasonal change in stem respiration of Larix principis-rupprechtii trees, northern China. PLoS ONE 2014, 9, e89294. [Google Scholar] [CrossRef] [PubMed]
  65. Peng, S.; Piao, S.; Ciais, P.; Myneni, R.B.; Chen, A.; Chevallier, F.; Dolman, A.J.; Janssens, I.A.; Penuelas, J.; Zhang, G. Asymmetric effects of daytime and night-time warming on Northern Hemisphere vegetation. Nature 2013, 501, 88–92. [Google Scholar] [CrossRef] [PubMed]
  66. Sullivan, P.F.; Mulvey, R.L.; Brownlee, A.H.; Barrett, T.M.; Pattison, R.R. Warm summer nights and the growth decline of shore pine in Southeast Alaska. Environ. Res. Lett. 2015, 10, 124007. [Google Scholar] [CrossRef]
  67. Holtta, T.; Makinen, H.; Nojd, P.; Makela, A.; Nikinmaa, E. A physiological model of softwood cambial growth. Tree Physiol. 2010, 30, 1235–1252. [Google Scholar] [CrossRef]
  68. Rahman, M.H.; Begum, S.; Nakaba, S.; Yamagishi, Y.; Kudo, K.; Nabeshima, E.; Nugroho, W.D.; Oribe, Y.; Funada, R. Relationship between the earlywood-to-latewood transition and changes in levels of stored starch around the cambium in locally heated stems of the evergreen conifer Chamaecyparis pisifera. Trees-Struct. Funct. 2016, 30, 1619–1631. [Google Scholar] [CrossRef]
  69. Cao, X.; Fang, K.; Chen, P.; Zhang, P.; Björklund, J.; Pumijumnong, N.; Guo, Z. Microdensitometric records from humid subtropical China show distinct climate signals in earlywood and latewood. Dendrochronologia 2020, 64, 125764. [Google Scholar] [CrossRef]
  70. Cao, X.; Hu, H.; Kao, P.-k.; Buckley, B.M.; Dong, Z.; Chen, X.; Zhou, F.; Fang, K. Improved spring temperature reconstruction using earlywood blue intensity in southeastern China. Int. J. Climatol. 2022, 1–17. [Google Scholar] [CrossRef]
  71. Schweingruber, F.; Fritts, H.; Bräker, O.; Drew, L.; Schär, E. The X-ray Technique as Applied to Dendroclimatology. Tree-Ring Bull. 1978, 38, 61–91. [Google Scholar]
  72. Rathgeber, C. Conifer tree-ring density inter-annual variability—Anatomical, physiological and environmental determinants. New Phytol. 2017, 216, 621–625. [Google Scholar] [CrossRef]
  73. Dunisch. Low night temperatures cause reduced tracheid expansion in podocarpus latifolius. Iawa J. 2010, 31, 245–255. [Google Scholar] [CrossRef]
  74. Antonova, G.F.; Stasova, V.V. Effects of environmental factors on wood formation in larch ( Larix sibirica Ldb.) stems. Trees 1997, 11, 462–468. [Google Scholar] [CrossRef]
  75. Song, X.; Lyu, S.; Wen, X. Limitation of soil moisture on the response of transpiration to vapor pressure deficit in a subtropical coniferous plantation subjected to seasonal drought. J. Hydrol. 2020, 591, 125301. [Google Scholar] [CrossRef]
  76. Larysch, E.; Stangler, D.F.; Puhlmann, H.; Rathgeber, C.B.K.; Seifert, T.; Kahle, H.P. The 2018 hot drought pushed conifer wood formation to the limit of its plasticity: Consequences for woody biomass production and tree ring structure. Plant Biol. 2022. [Google Scholar] [CrossRef] [PubMed]
  77. Oberhuber, W.; Gruber, A. Climatic influences on intra-annual stem radial increment of Pinus sylvestris (L.) exposed to drought. Trees 2010, 24, 887–898. [Google Scholar] [CrossRef]
  78. Zheng, Z.; Zhou, F.; Fonti, P.; Ren, P.; Li, X.; Miao, G.; Dong, Z.; Fang, K. Intra-Annual Wood Formation of Cryptomeria fortunei and Cunninghamia lanceolata in Humid Subtropical China. Front. Ecol. Evol. 2021, 9, 733974. [Google Scholar] [CrossRef]
  79. Dong, Z.; Chen, D.; Du, J.; Yang, G.; Bai, M.; Zhou, F.; Zheng, Z.; Ruan, C.; Fang, K. A 241-Year Cryptomeria fortune Tree-Ring Chronology in Humid Subtropical China and Its Linkages with the Pacific Decadal Oscillation. Atmosphere 2020, 11, 247. [Google Scholar] [CrossRef]
  80. Bonfils, C. Extending the record of photosynthetic activity in the eastern United States into the presatellite period using surface diurnal temperature range. Geophys. Res. Lett. 2005, 32, L08405. [Google Scholar] [CrossRef]
  81. Cox, D.T.C.; Maclean, I.M.D.; Gardner, A.S.; Gaston, K.J. Global variation in diurnal asymmetry in temperature, cloud cover, specific humidity and precipitation and its association with leaf area index. Glob. Chang. Biol. 2020, 26, 7099–7111. [Google Scholar] [CrossRef]
  82. Lindvall, J.; Svensson, G. The diurnal temperature range in the CMIP5 models. Clim. Dyn. 2015, 44, 405–421. [Google Scholar] [CrossRef]
  83. Dai, A.; Trenberth, K.E.; Karl, T.R. Effects of clouds, soil moisture, precipitation, and water vapor on diurnal temperature range. J. Clim. 1999, 12, 2451–2473. [Google Scholar] [CrossRef]
  84. Gimeno, T.E.; Camarero, J.J.; Granda, E.; Pías, B.; Valladares, F. Enhanced growth of Juniperus thurifera under a warmer climate is explained by a positive carbon gain under cold and drought. Tree Physiol. 2012, 32, 326–336. [Google Scholar] [CrossRef]
  85. Tao, Q.; Zhang, Q.B.; Chen, X. Tree-ring reconstructed diurnal temperature range on the eastern Tibetan plateau and its linkage to El Niño-Southern Oscillation. Int. J. Climatol. 2020, 41, 1696–1711. [Google Scholar] [CrossRef]
  86. Zhang, Y.; Guo, M.; Wang, X.; Gu, F.; Liu, S. Divergent tree growth response to recent climate warming of Abies faxoniana at alpine treelines in east edge of Tibetan Plateau. Ecol. Res. 2018, 33, 303–311. [Google Scholar] [CrossRef]
  87. Cai, Q.; Liu, Y.; Qian, H.; Liu, R. Inverse effects of recent warming on trees growing at the low and high altitudes of the Dabie Mountains, subtropical China. Dendrochronologia 2020, 59, 125649. [Google Scholar] [CrossRef]
  88. Rakthai, S.; Fu, P.L.; Fan, Z.X.; Gaire, N.P.; Pumijumnong, N.; Eiadthong, W.; Tangmitcharoen, S. Increased Drought Sensitivity Results in a Declining Tree Growth of Pinus latteri in Northeastern Thailand. Forests 2020, 11, 361. [Google Scholar] [CrossRef]
  89. Hza, E.; Qcab, C.; Yu, L. Altitudinal difference of growth-climate response models in the north subtropical forests of China. Dendrochronologia 2022, 72, 125935. [Google Scholar]
  90. Jacoby, G.C.; D’Arrigo, R.D. Tree ring width and density evidence of climatic and potential forest change in Alaska. Glob. Biogeochem. Cycles 1995, 9, 227–234. [Google Scholar] [CrossRef]
  91. Cook, E.R.; Peters, K. Calculating unbiased tree-ring indices for the study of climatic and environmental change. Holocene 1997, 7, 361–370. [Google Scholar] [CrossRef]
  92. Barber, V.A.; Juday, G.P.; Finney, B.P. Reduced growth of Alaskan white spruce in the twentieth century from temperature-induced drought stress. Nature 2000, 405, 668–673. [Google Scholar] [CrossRef]
  93. Yonenobu, H.; Eckstein, D. Reconstruction of early spring temperature for central Japan from the tree-ring widths of Hinoki cypress and its verification by other proxy records. Geophys. Res. Lett. 2006, 33, L10701. [Google Scholar] [CrossRef]
  94. Esper, J.; Frank, D.; Büntgen, U.; Verstege, A.; Hantemirov, R.M.; Kirdyanov, A.V. Trends and uncertainties in Siberian indicators of 20th century warming. Glob. Chang. Biol. 2010, 16, 386–398. [Google Scholar] [CrossRef]
  95. Youngblut, D.K.; Luckman, B.H. Evaluating the temperature sensitivity of radial growth patterns from whitebark pine in the western Canadian Cordillera. Dendrochronologia 2013, 31, 16–28. [Google Scholar] [CrossRef]
Figure 1. (a) Location of the Changanshan site in Fujian province of China, (b) photos of monitoring instruments on trees at Changanshan site. The temperature sensors were equipped in the heat-protecting layers, the soil beneath the forests, ambient air and the uncovered trunks, respectively.
Forests 13 01439 g001
Figure 2. (a) Monthly climatic diagram at the Fuzhou meteorological station near the sampling site for the period of 1953–2017. Time series of the (b) precipitation, (c) mean temperature and (d) diurnal temperature range for the period of 1953–2017.
Forests 13 01439 g002
Figure 3. (a) Mean hourly and (b) monthly temperatures for the soil, heat-protecting layer, trunk and air from 13 February to 16 December in the year 2015.
Forests 13 01439 g003
Figure 4. Comparison of the cell numbers of (a) earlywood and (b) latewood and (c) total cells and (d) earlywood ratio, (e) latewood ratio and (f) blue intensity of latewood between trees with (Y red) and without (N blue) the heat-protecting. a—different letters indicate significant differences. Values are mean ± standard error (sample size n = 8).
Forests 13 01439 g004
Figure 5. Comparison of the wood anatomy parameters (double cell wall thickness (2CWT) and radial lumen diameter (LD) and lumen area (LA) of latewood (ad) and earlywood (e,f) between heat-protecting (Y) and without treatment (N). a, b—different letters indicate significant differences. Values are mean ± standard error (sample size n = 8).
Forests 13 01439 g005
Figure 6. Tree-ring chronologies of P. massoniana based on (a) width and (b) latewood width and (c) latewood ratio. The reliable portions of the chronologies were determined by the statistic of subsample signal strength (SSS) over 0.85.
Forests 13 01439 g006
Figure 7. The correlation plots for (a) tree-ring width (TRW), (b) latewood width (LWW), (c) latewood ratio (LWR) with monthly mean precipitation (left), monthly mean temperature (center) and diurnal temperature range (right). The correlations were calculated from previous (capital letter) October to current (lowercase letters) October, with significant correlations shown in grey (p < 0.05) and black (p < 0.01). MJJAS: the period from May to September, JJASO: the period from June to current October, MJJASO: the period from May to October, JASO: the period from July to October.
Forests 13 01439 g007
Figure 8. Comparison of tree-ring width (TRW), latewood width (LWW) and latewood ratio (LWR) under low and high DTR years. The squares and horizontal lines inside the boxplot indicate the mean and median values, and the bottom and top edges indicate the 25th and 75th percentiles. a, b—different letters indicate significant differences (Tukey test).
Forests 13 01439 g008
Figure 9. 21–year running correlations between the (a) TRW chronology and the mean precipitation (May–September of the current year), temperature (June–September of the current year) and DTR (June–October of the current year); the (b) LWW chronology and the mean precipitation (May–October of the current year), temperature (June–September of the current year) and DTR (June–October of the current year); the (c) LWR chronology and the mean precipitation (July–October of the current year), temperature (July–October of the current year) and DTR (June–September of the current year). Dotted and dashed horizontal lines indicate the p = 0.05 and p = 0.01 significance levels, respectively.
Forests 13 01439 g009
Figure 10. The relative contribution of most significant climate factors to variations in the TRW and LWW and LWR in the BRT model. DTR, Pre and MeanT indicate the diurnal temperature range, precipitation and mean temperature. jun: current June; MJJAS: the period from current May to September; JJASO: the period from current June to October; MJJASO: the period from current May to October; JASO: the period from current July to October.
Forests 13 01439 g010
Publisher’s Note: MDPI stays neutral with regard to jurisdictional claims in published maps and institutional affiliations.

