Article

Reconstruction of the Standardized Precipitation-Evapotranspiration Index for the Western Region of Durango State, Mexico

by
Citlalli Cabral-Alemán
1,
José Villanueva-Díaz
2,*,
Gerónimo Quiñonez-Barraza
3,
Armando Gómez-Guerrero
4 and
Jesús Guadalupe Arreola-Ávila
1
1
Unidad Regional Universitaria de Zonas Áridas, Universidad Autónoma Chapingo, Carretera Gómez Palacio—Ciudad Juárez, Km 40, Bermejillo 35230, Mexico
2
Centro Nacional de Investigación Disciplinaria Relación Agua-Suelo-Planta Atmósfera (INIFAP-CENID-RASPA), Instituto Nacional de Investigaciones Forestales Agrícolas y Pecuarias, Margen Derecha del Canal Sacramento Km 6.5, Gómez Palacio 35140, Mexico
3
Instituto Nacional de Investigaciones Forestales Agrícolas y Pecuarias, Campo Experimental Valle del Guadiana (INIFAP-CEVAG), Km 4.5 Carretera Durango-Mezquital, Durango 34170, Mexico
4
Posgrado en Ciencias Forestales, Colegio de Postgraduados, Km 36.5 Carretera México-Texcoco, Texcoco 56230, Mexico
*
Author to whom correspondence should be addressed.
Forests 2022, 13(8), 1233; https://doi.org/10.3390/f13081233
Submission received: 31 May 2022 / Revised: 27 July 2022 / Accepted: 1 August 2022 / Published: 3 August 2022
(This article belongs to the Special Issue Applications of Dendrochronology in Forest Climatology)

Abstract

:
In recent decades, droughts associated with climate change have increased in frequency and intensity. Given this trend, the understanding of climate variability over time has raised great interest. The main objective of this study was to reconstruct the standardized precipitation-evapotranspiration index (SPEI) from tree rings of Pinus durangensis Martinez at a representative site in the western region of the Durango State, Mexico. To this end, we used radii of 286 cross-sections, which were processed through conventional dendrochronological techniques. In addition, chronologies of total ring and early and latewood were generated, covering 296 years. In parallel, we analyzed the association between the chronologies obtained and the cumulative SPEI for 3, 6, 9, and 12 months. The earlywood residual chronology (EWres) showed the closest association with the six-month cumulative SPEI for February–May (SPEI6FM). Thus, the SPEI6FM for the past 296 years was reconstructed through a simple linear regression model. In this reconstruction, 18% of the years were wet, 16% dry, and 66% average. In addition, an increase in the frequency of droughts was observed from 1880 onwards, which might have been related to the rise in temperature due to climate warming. Therefore, the annual rings of P. durangensis are suitable for use as a proxy for the reconstruction of historical climatic events in this region of northern Mexico.

1. Introduction

The rise in global temperature in response to climate change has led to a marked increase in the frequency and intensity of drought in recent decades [1,2,3]. Droughts caused by the prolonged absence of precipitation, combined with increased evaporation, have negatively impacted both society and the environment [4,5,6]. In particular, forests are among the ecosystems most affected by this phenomenon, which causes severe impacts such as reduced productivity [7] and increased intensity and frequency of fires [8,9].
Given this situation, improving our understanding of natural climate variability over time is of great interest. However, this is a complex task because our knowledge of past climate conditions is limited by the lack of historical climate records [10,11]. In Mexico, weather data come from meteorological stations with records covering less fewer 75 years [12]. Consequently, instrumental records can only provide limited information regarding climate variability, including droughts.
In recent decades, it has been demonstrated that tree rings are a suitable proxy for the historical reconstruction of climatic variability. In Mexico, tree rings of forest species have been used to reconstruct precipitation [13,14], temperature [15], surface runoff [16,17], and droughts [18,19], among other climatic variables.
Droughts are difficult to characterize in terms of intensity, duration, and spatial extent [5]. However, in recent years, techniques have been developed to study and monitor these variables [20]. These techniques include drought indices, which are an effective method for analyzing this phenomenon [9]. In addition, there is a large number of drought indices [6,20]. Among the most widely used indices is the Palmer Drought Severity Index (PDSI) [21] and the Standardized Precipitation Index (SPI) [22]. For its part, the PDSI is based on the water balance equation and on a fixed time scale. However, droughts are known to be a multiscale phenomenon. In this sense, the SPI is a multiscale and widely accepted index, but its main disadvantage is that it does not include temperature, which strongly affects the severity of droughts. In this way, the SPEI tries to overcome these limitations by combining the multiscale nature of the SPI and the water balance equation used in the PDSI [5].
Therefore, the main objective of this study was to reconstruct droughts based on the SPEI from tree rings of P. durangensis collected in the San Diego de Tezains site, in the municipality of Santiago Papasquiaro, Durango, Mexico. The working hypothesis was that P. durangensis is sufficiently sensitive to drought so that the evolution of its radial growth is closely correlated with the SPEI.

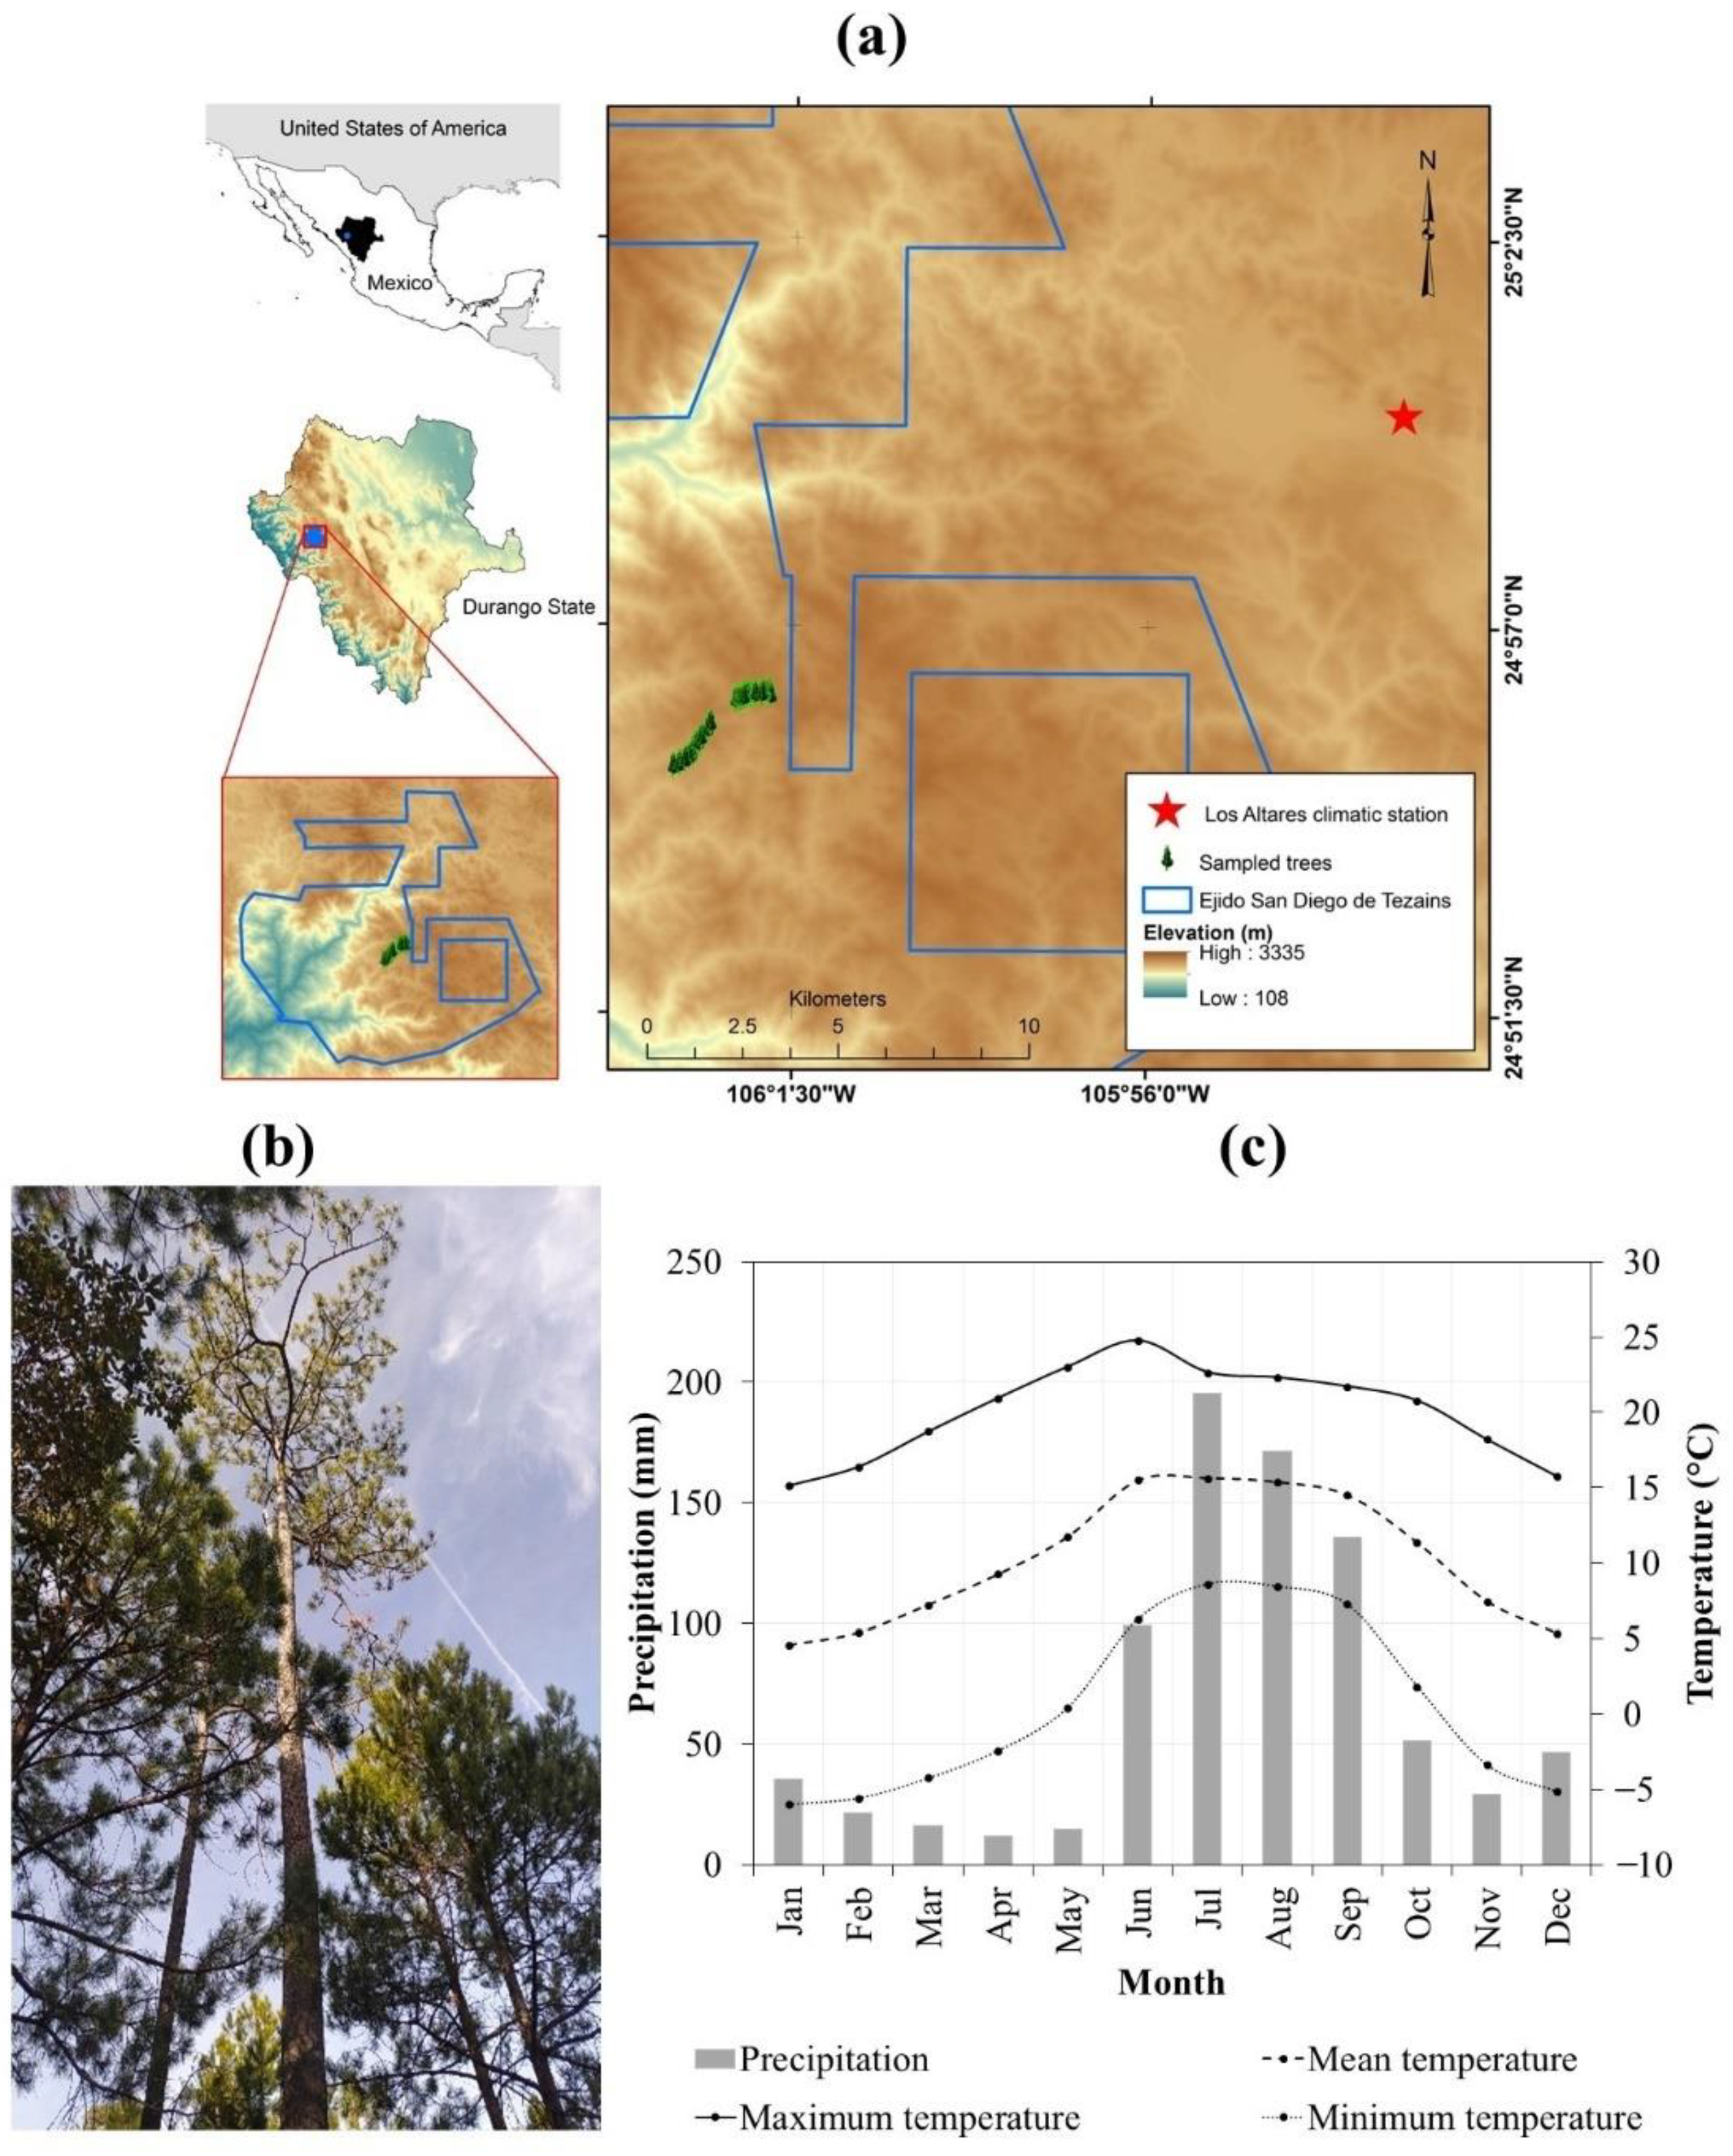
2. Materials and Methods

The San Diego de Tezains site is located in the northwestern region of the state of Durango, in the Sierra Madre Occidental, between coordinates 24°48′16.98″ N, 25°12′38.91″ N and 106°12′37.63″ W, 106°12′25.58″ W. It stretches across the municipalities of Tepehuanes, Topia, Canelas, Otaez, and Santiago Papasquiaro, the latter comprising the largest surface area (Figure 1a).
The predominant climate is temperate with rains in the summer. The mean annual precipitation ranges between 1000 and 1200 mm, with a mean annual temperature of 5 °C to 18 °C; the minimum temperature is –6 °C in January and the maximum is 28 °C in May [23,24] (Figure 1c). According to the World Reference Base for Soil Resources 2014, the predominant soil associations are Leptosol, Cambisol, Luvisol, Regosol, and Phaeozem [25]. The dominant vegetation type is pine–oak forest [26]. The minimum altitude is 1787 m a.s.l. and the maximum altitude is found at the “El Nevado” mountain, with 3028 m a.s.l. [27] (Figure 1a).

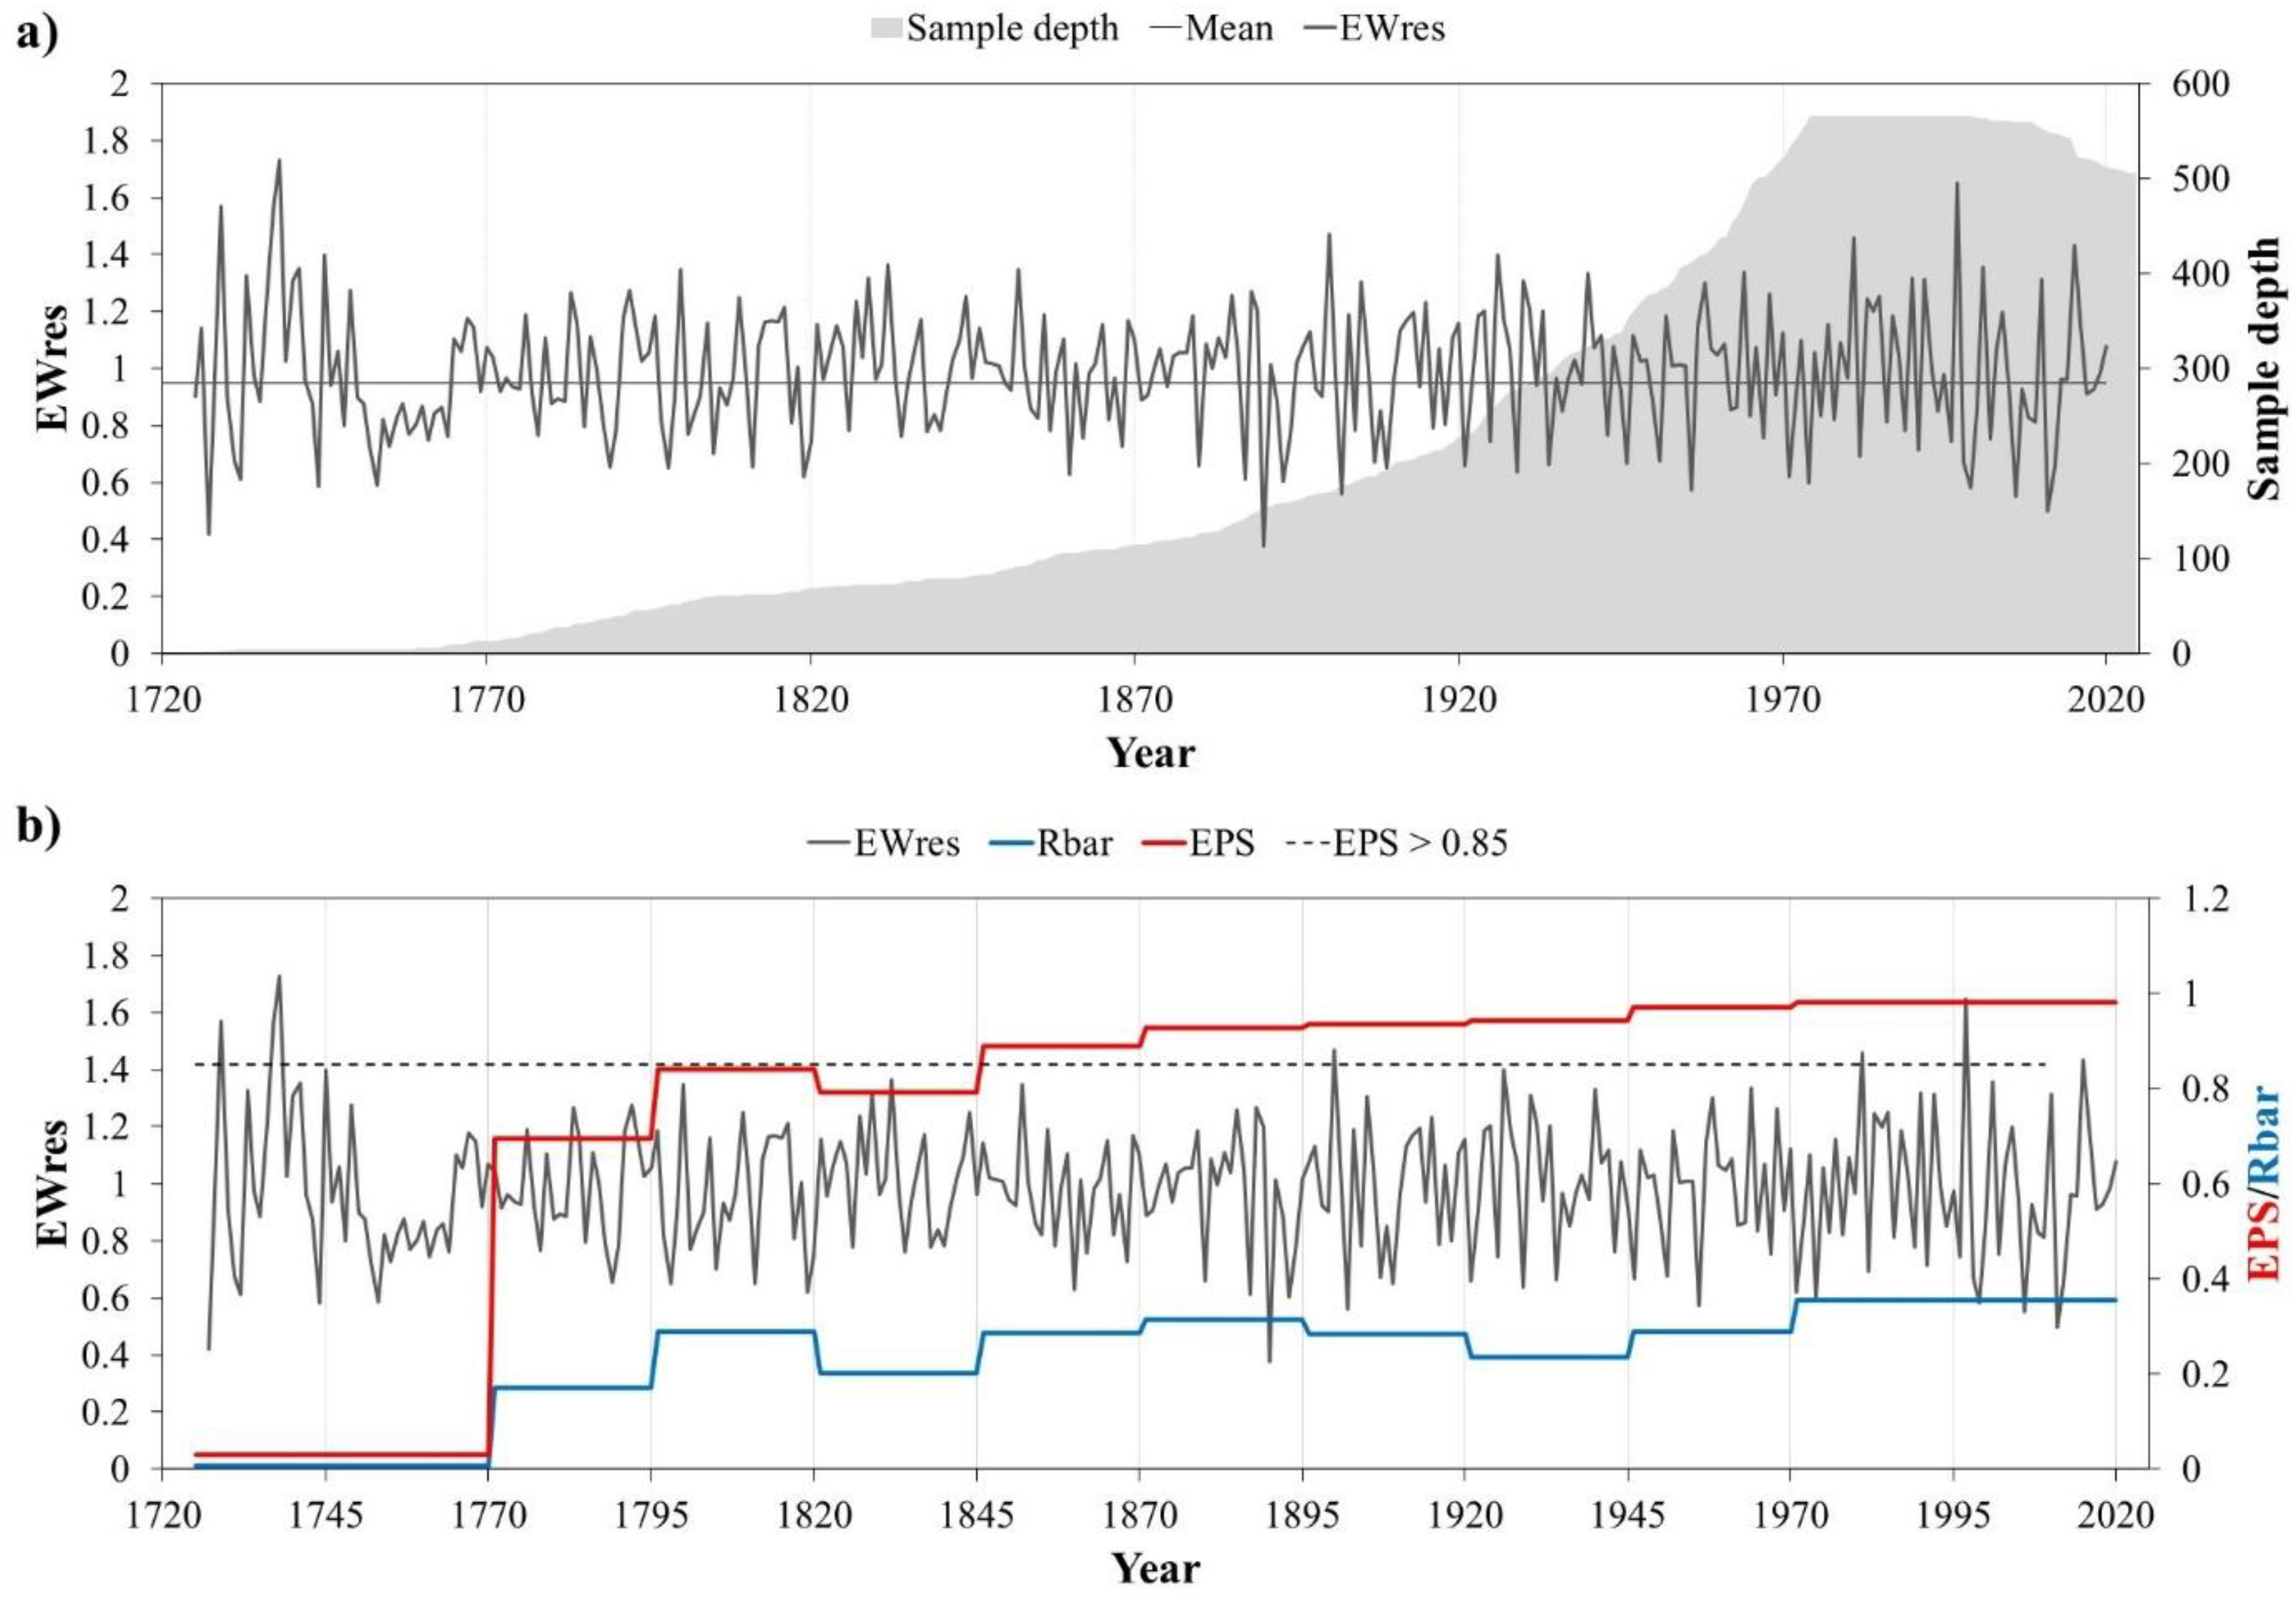
2.1. Development of Chronologies

From five to eight cross–sections were extracted from 50 P. durangensis trees, the first at ground level, and then every 30 cm until reaching the diameter at breast height (DBH). The remaining sections were extracted every 2.5 m until the tip. A total of 286 cross–sections was obtained. By measuring two radii of each cross–section, a total of 572 series was generated.
Samples were processed and dated according to standard dendrochronological techniques [28]. Total ring width, earlywood, and latewood were measured using a sliding-stage Velmex measuring system to the nearest 0.001 mm. The dating quality was checked with the COFECHA program, including only dendrochronological series with intercorrelation values greater than 0.328 (p < 0.01) [29]. Although cross-sections of the same tree were correlated, having between five and eight sections per tree ensured that the horizontal and vertical variation of tree rings was captured. This was a more complete assessment of growth of each tree, which could produce better correlations between dendrochronological series and detect a better response to environmental factors.
The chronologies were constructed by removing biological (competition, suppression, and release) and geometric (tree aging and stem growth) trends unrelated to climate. This process consisted of the adjustment of negative exponential functions to the series of measurements of TRW, EW, and LW to obtain standardized and residual series. The standardization process allowed the transformation of the ring widths into dimensionless indices, preserving the highest frequency portion of the climate signal [30]. This procedure was performed using the dplR library package [31] in R studio software [32]. The quality of the chronology was assessed through the mean, standard deviation (SD), mean sensitivity (MS), and series intercorrelation (SI) [33]. Additionally, to assess the reliability of the chronology over time, a running expressed population signal (EPS) and the mean inter-series correlation (Rbar) [34], was calculated using a 50-year moving window with 25-year overlaps.

2.2. Climate Data Gathering and SPEI Calculation

Climatic data were gathered from the 10121-Los Altares meteorological station (24°53′38.4″ N, 106°7′15.59″ W, 2490 m a.s.l.), located 10 km from the study area (Figure 1). The precipitation (pp), maximum temperature (Tmax), minimum temperature (Tmin), and mean temperature (Tmean) records of the station covered a total of 47 years (1973–2019).
The SPEI was calculated using the SPEI package in R (Available online: http://sac.csic.es/spei, accessed on 1 May 2022) based on temperature and precipitation data for the period 1974–2019. This produced SPEI values for time scales of 3, 6, 9, and 12 months (cumulative drought) to identify the scale with the greatest correlation between the SPEI and the chronologies obtained. SPEI values regularly range between –3 and 3, where negative values indicate periods of drought and positive values indicate wet periods [5].

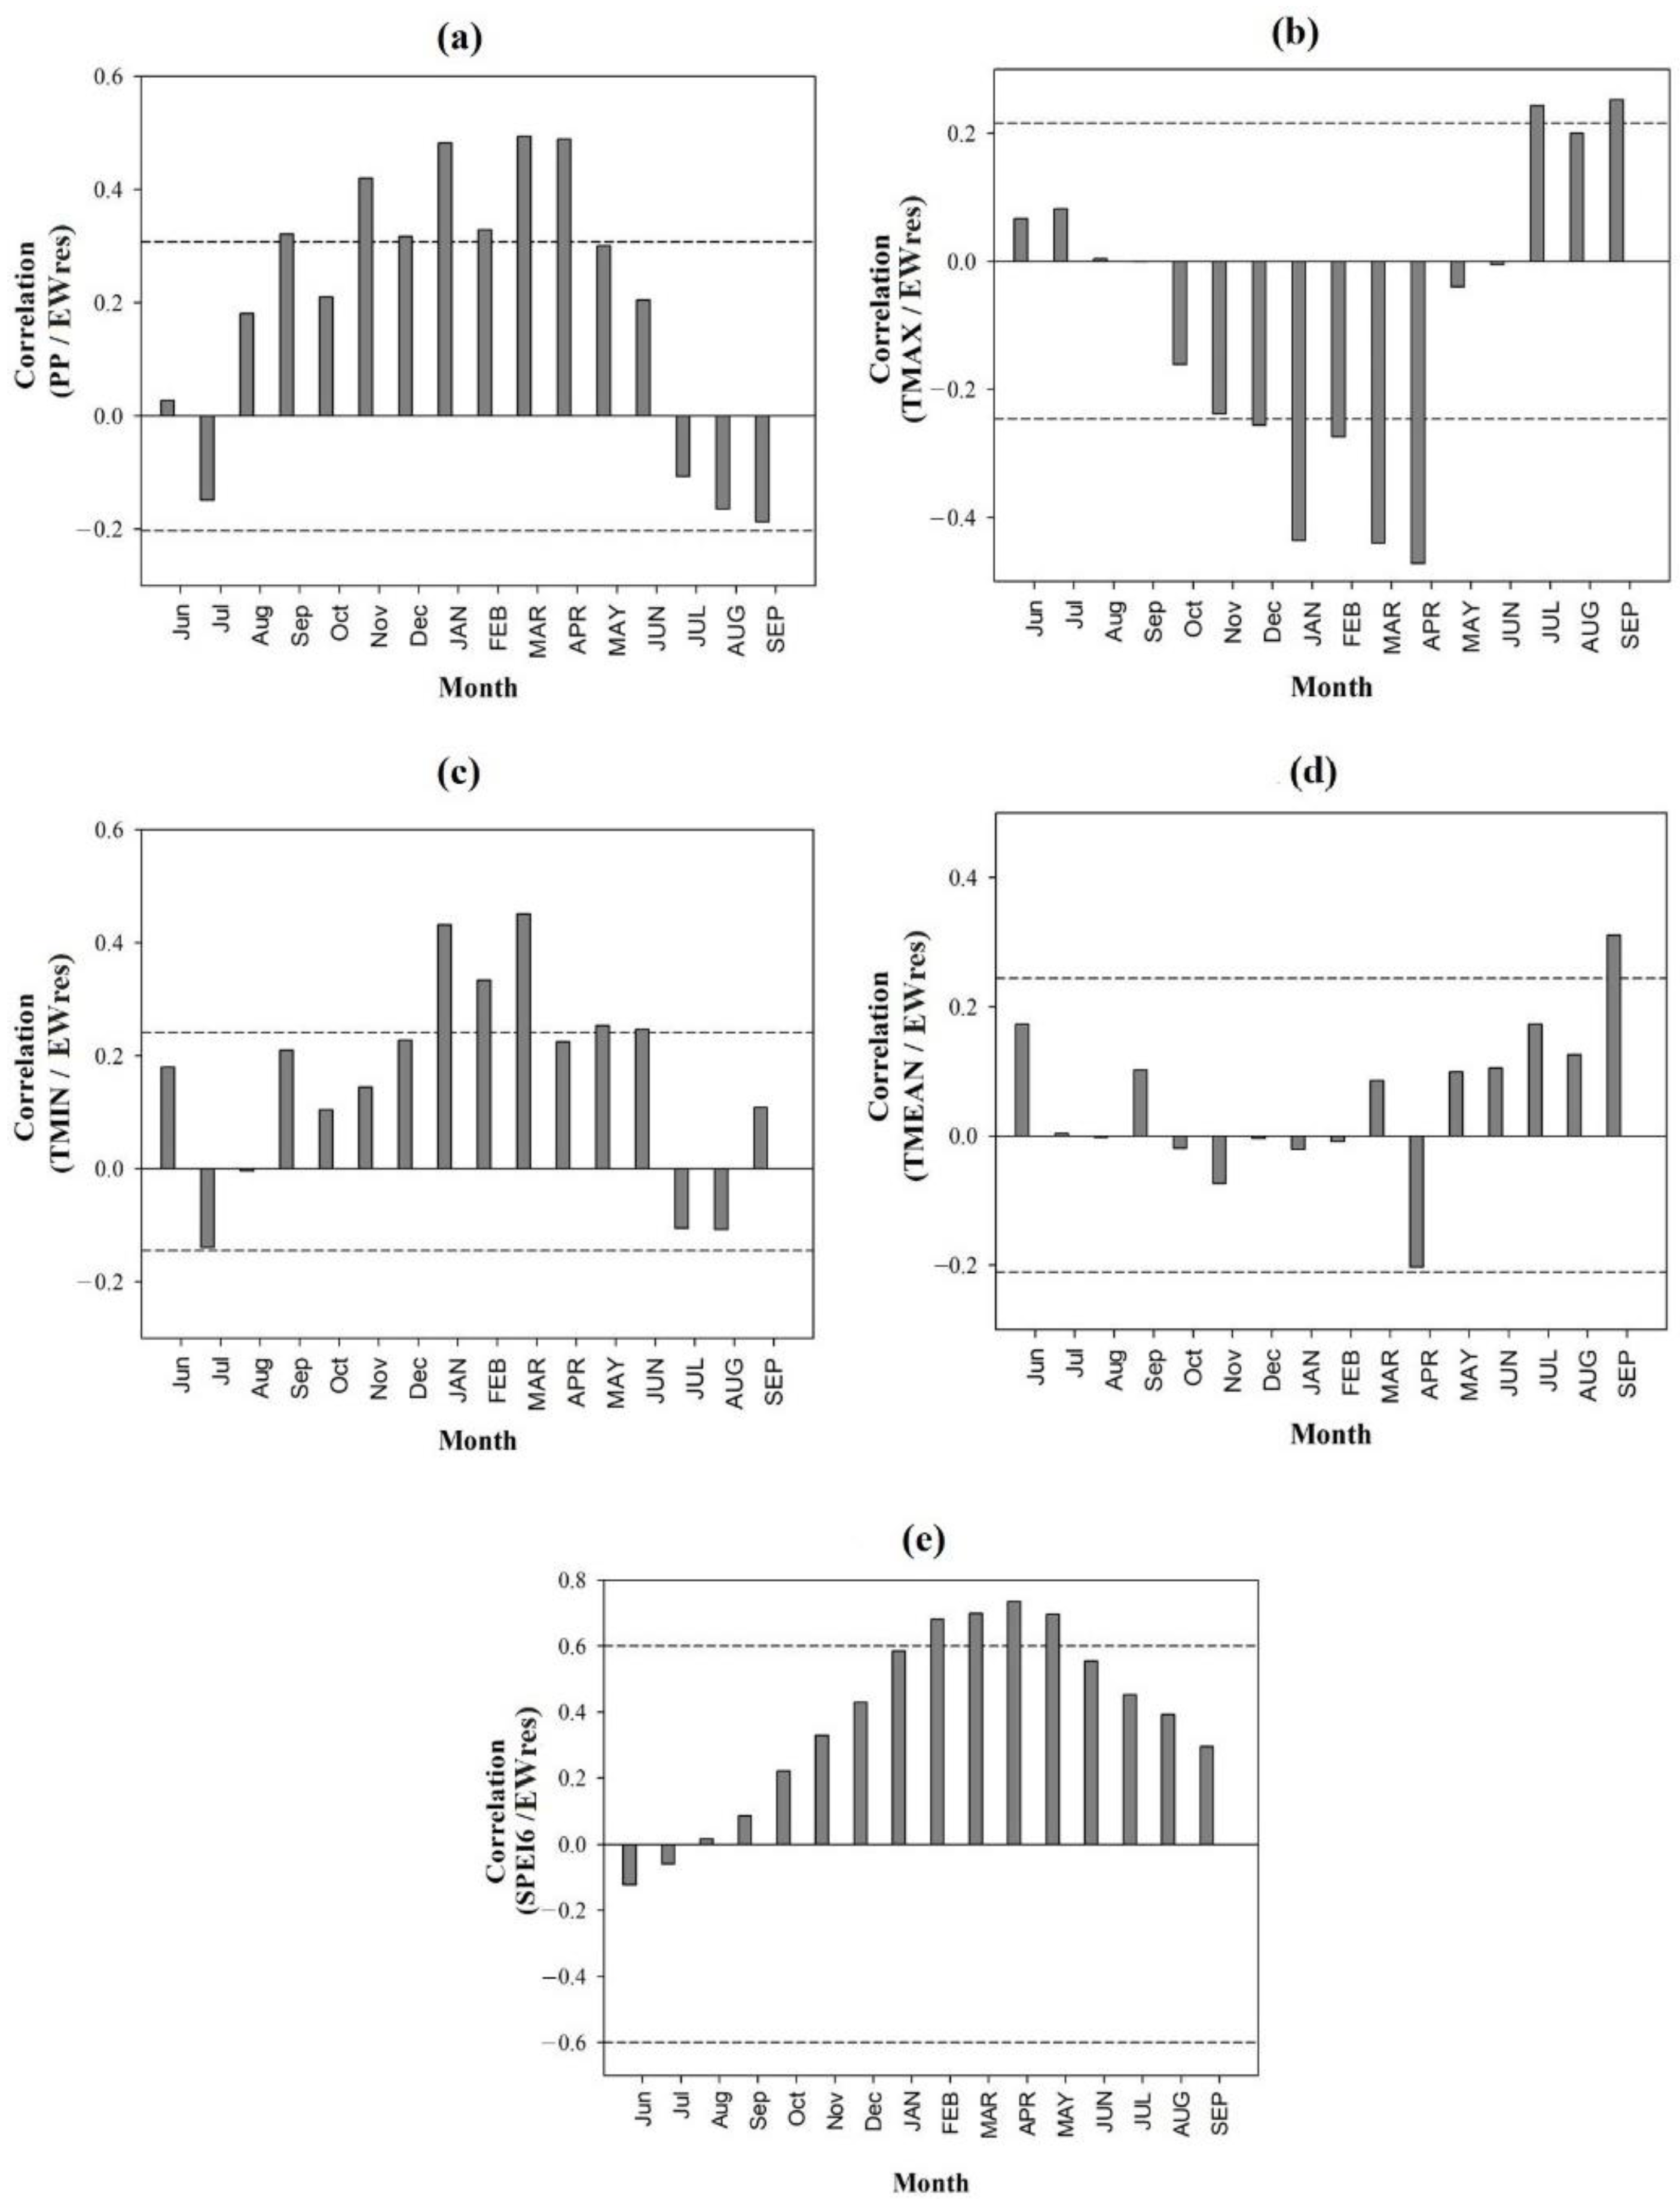
2.3. Correlation Analysis and Response Function

The monthly and seasonal relationships of climatic variables with total ring width, earlywood and latewood chronologies of P. durangensis were evaluated using the seascorr function, initially developed in MATLAB [35], and later included in the treeclim package in R studio software [32]. For this analysis, we conducted 1000 iterations based on a stationary bootstrap resampling process, whereby 95% confidence intervals were calculated considering a 5% significance level [36]. Correlations were tested seasonally from June of the previous growth year to September of the current growth year, based on the fact that the weather conditions in the year before the growing season significantly influence the development of annual tree rings [37].

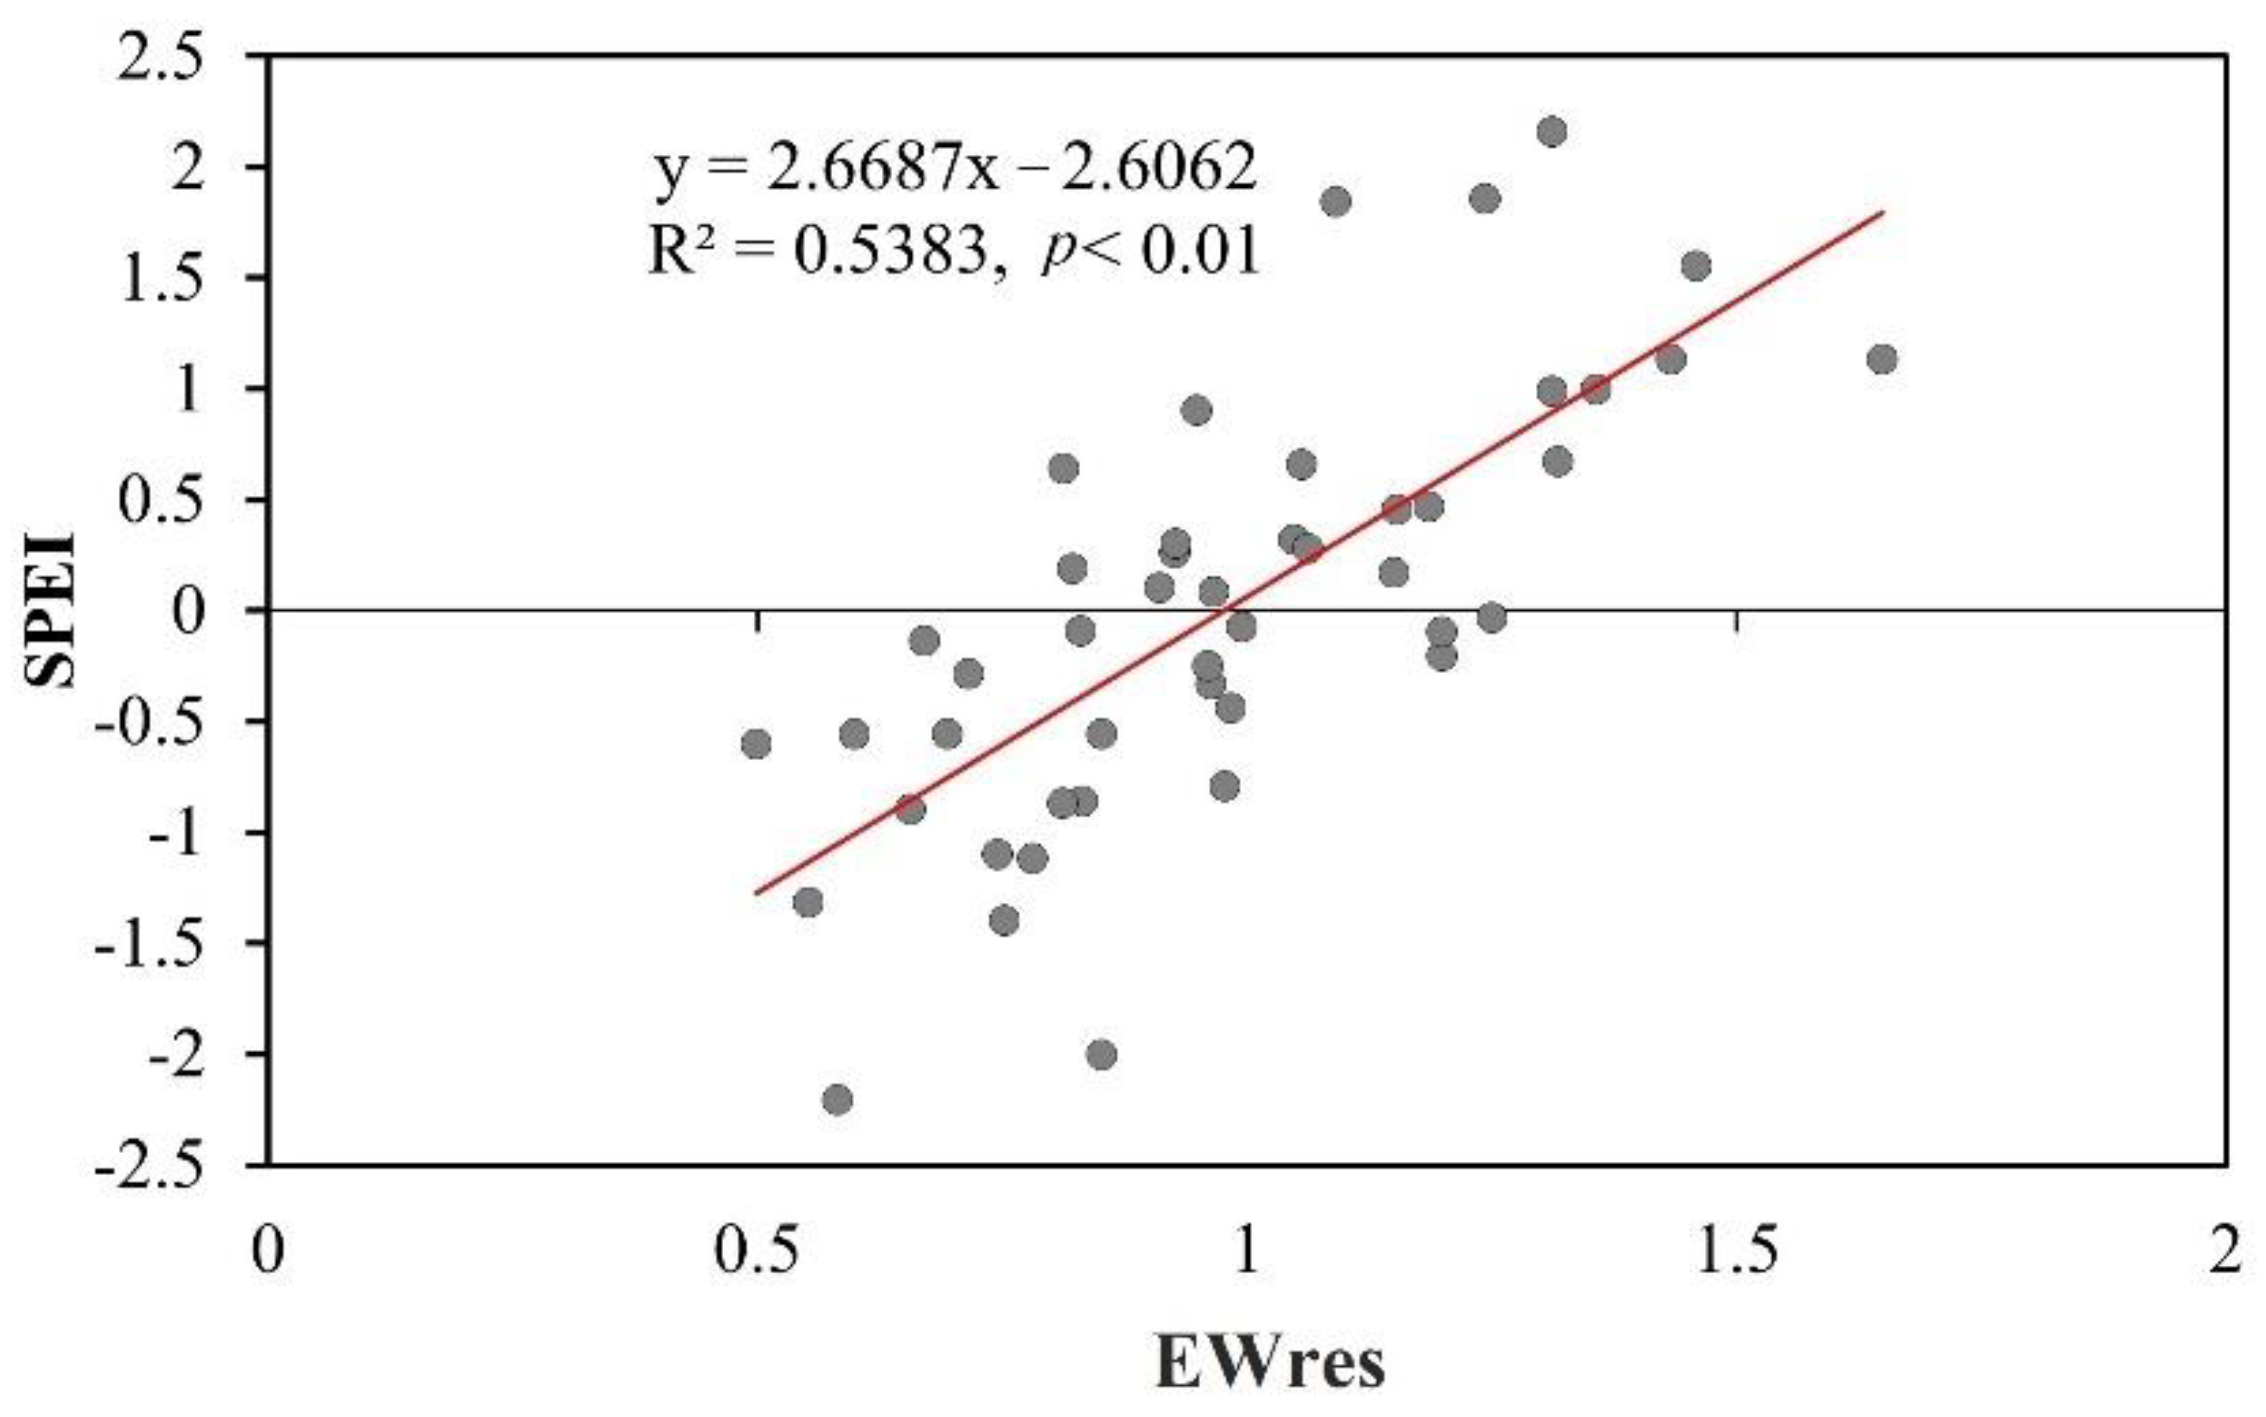
2.4. Reconstruction Model Calibration and Verification

The stability of the reconstruction model was tested by splitting the total chronology into two subperiods: the first for calibration (1974–1995, 22 years) and the second for verification (1995–2017, 22 years). The process was developed through the VFY subroutine of the Dendrochronology Program Library (DPL) at the University of Arizona, using as references the significance of the Pearson correlation value (r), reduction of error (RE), coefficient of efficiency (CE) [38], t-value (tV) [39], sign test (ST), and first-negative difference [30].

2.5. Comparison with Other Drought Indices

The reconstructed SPEI was compared with other drought indices, such as the Standardized Precipitation Index (SPI) and the Palmer Drought Severity Index (PDSI). Instrumental and reconstructed SPI data were obtained from the North American Seasonal Precipitation Atlas (NASPA) page (Available online: http://drought.memphis.edu/NASPA/Default.aspx#, accessed on 1 May 2022) [40]; instrumental and reconstructed PDSI data were downloaded from the Mexican Drought Atlas (Available online: http://drought.memphis.edu/MXDA/Extract.aspx, accessed on 1 May 2022) [18].

2.6. Spatial Representativeness of the Reconstructed SPEI

To understand the regional representativeness of the SPEI6FM reconstruction, a field spatial correlation was performed between reconstructed SPEI6FM data and baseline 6-month cumulative SPEI data of the Global Drought Monitor in KNMI climate explorer (Available online: https://climexp.knmi.nl/start.cgi?id=someone@somewhere, accessed on 1 May 2022).

2.7. Ocean–Atmosphere Circulation Modes

The influence of ocean–atmosphere circulation patterns on reconstructed droughts was explored through a Pearson correlation analysis between the ring-width chronology, the Multivariate El Niño Southern Oscillation (ENSO) Index (MEI) [41,42], and the Pacific Decadal Oscillation (PDO) Index [43]. MEI data were obtained from the National Office of Oceanic and Atmospheric Administration (NOAA) website (Available online: https://psl.noaa.gov/data/climateindices/list/, accessed on 1 May 2022); PDO data were obtained from the Climate Data Guide website (Available online: http://research.jisao.washington.edu/pdo/PDO.latest, accessed on 1 May 2022). A Multi-taper power spectrum analysis [44] was carried out to understand reconstructed SPEI in the frequency domain. Additionally, the periods in which the reconstruction showed significant frequencies were identified with a wavelet spectral analysis using the dplR library [31] in R studio software [32].

3. Results

3.1. Total Ring Width, Earlywood, and Latewood Chronologies

Dendrochronological statistics corresponding to the total ring width (TRW), earlywood (EW), and latewood (LW) series were obtained for the standard (std) and residual (res) forms. TRW and EW showed the maximum value of EPS = 0.99, in both cases, with a minimum difference of rbt = 0.62 (TRW) and 0.61 (EW). However, the MS of EW (0.39) was higher (Table 1).
The EWres was selected for the present study because it showed a greater association with calculated SPEI data (Table 2).
The 572 analyzed growth series of P. durangensis were used to build a dendrochronological series for 296 years (1725 to 2020) (Figure 2a). The EPS value based on the number of trees and radii per tree indicated that the 1725–1795 period had an EPS lower than the critical value of 0.85, while the 1795–2020 period exceeded this critical value, indicating that this last period was more suitable for reconstruction purposes. The Rbar values exceed 0.3 in the periods of 1795–2020 (Figure 2b).

3.2. Relationship between Tree Growth and Climate

The correlation analysis between the records of climatic variables for 1974–2019 (46 years) and the EWres chronology showed a positive association with precipitation from November of the previous year to April of the current growth year (r = 0.42, p < 0.05). Tmax showed the greatest negative association for March and April of the current growth year (r = −0.455, p < 0.05). Tmin was positively associated with the period from January to March of the current growth year (r = 0.40, p < 0.05). Tmean showed a positive association in September (r = 0.31, p < 0.05) of the current growth year. The SPEI calculated for a six-month period (SPEI6) showed the greatest positive association from February to May (r = 0.70, p < 0.01) of the current growth year. This result confirms the working hypothesis that P. durangensis is sufficiently sensitive to drought events, so that the evolution of its radial growth is closely correlated with the SPEI (Figure 3).
The EWres of P. durangensis showed positive responses to the SPEI, i.e., the earlywood indices increased when drought severity decreased, with the highest correlation values observed for a cumulative six-month period and from February to May (r = 0.68–0.73, p < 0.01) (Figure 4).

3.3. SPEI Reconstruction

The cumulative SPEI on a six-month scale was calculated for the February–May period (SPEI6FM) of the Los Altares meteorological station, which was strongly associated with tree growth. Therefore, a linear regression model was developed to reconstruct SPEI6FM for the period 1725–2020 (296 years).
Using a simple linear regression analysis, a transfer function was established between the earlywood index chronology of P. durangensis and SPEI6FM, resulting in Equation (1) (Figure 5).
SPEI 6 FM = 2.6062 + 2.6687 × X i
where: SPEI6FM is the six-month cumulative SPEI for February–May and Xi is the value of EWres for the year i.
Regarding the calibration and verification process, it is worth mentioning that the correlations were positive for both periods. Since the verification analysis performed for the subperiod 1996–2019 showed that all parameters were statistically different from zero at the 5% significance level (Table 3), we proceeded to develop the reconstruction model.
The reconstructed SPEI6FM values covered 296 years (1725–2020), in which high interannual and multi-annual variability was detected. The mean reconstructed SPEI6FM value was 0.023 with a standard deviation (SD) of ± 0.585. Triangles represent the years showing a value above the upper limit of the standard deviation, defined as wet years; circles mark years below the lower SD limit, considered periods of extreme drought (Figure 6a).
Of the 296 years analyzed, 54 years (18%) were classified as wet, 48 years (16%) as drought, and 194 years (66%) as normal. The last century of the period analyzed showed an increase in the number and frequency of droughts. The first century (1725–1824) had 15 years of extreme drought; the second century (1825–1924) had 12 years of extreme drought, and the last century (1925–2020) had 21 years of extreme drought. Of note, in the last century, we observed droughts lasting two to three years (1945–1946, 1950–1951, 1971–1972, 1998–2000, 2008–2009, and 2011–2012) (Figure 6a).
In the graphical relationship between the observed and reconstructed SPEI6FM, as well as the division into the subperiods used for calibration (1974–1996) and verification (1997–2020), the similarity between both chronologies is highlighted, particularly in the verification period where the reconstructed SPEI accounts for 58% of the observed SPEI variability (Figure 6b).

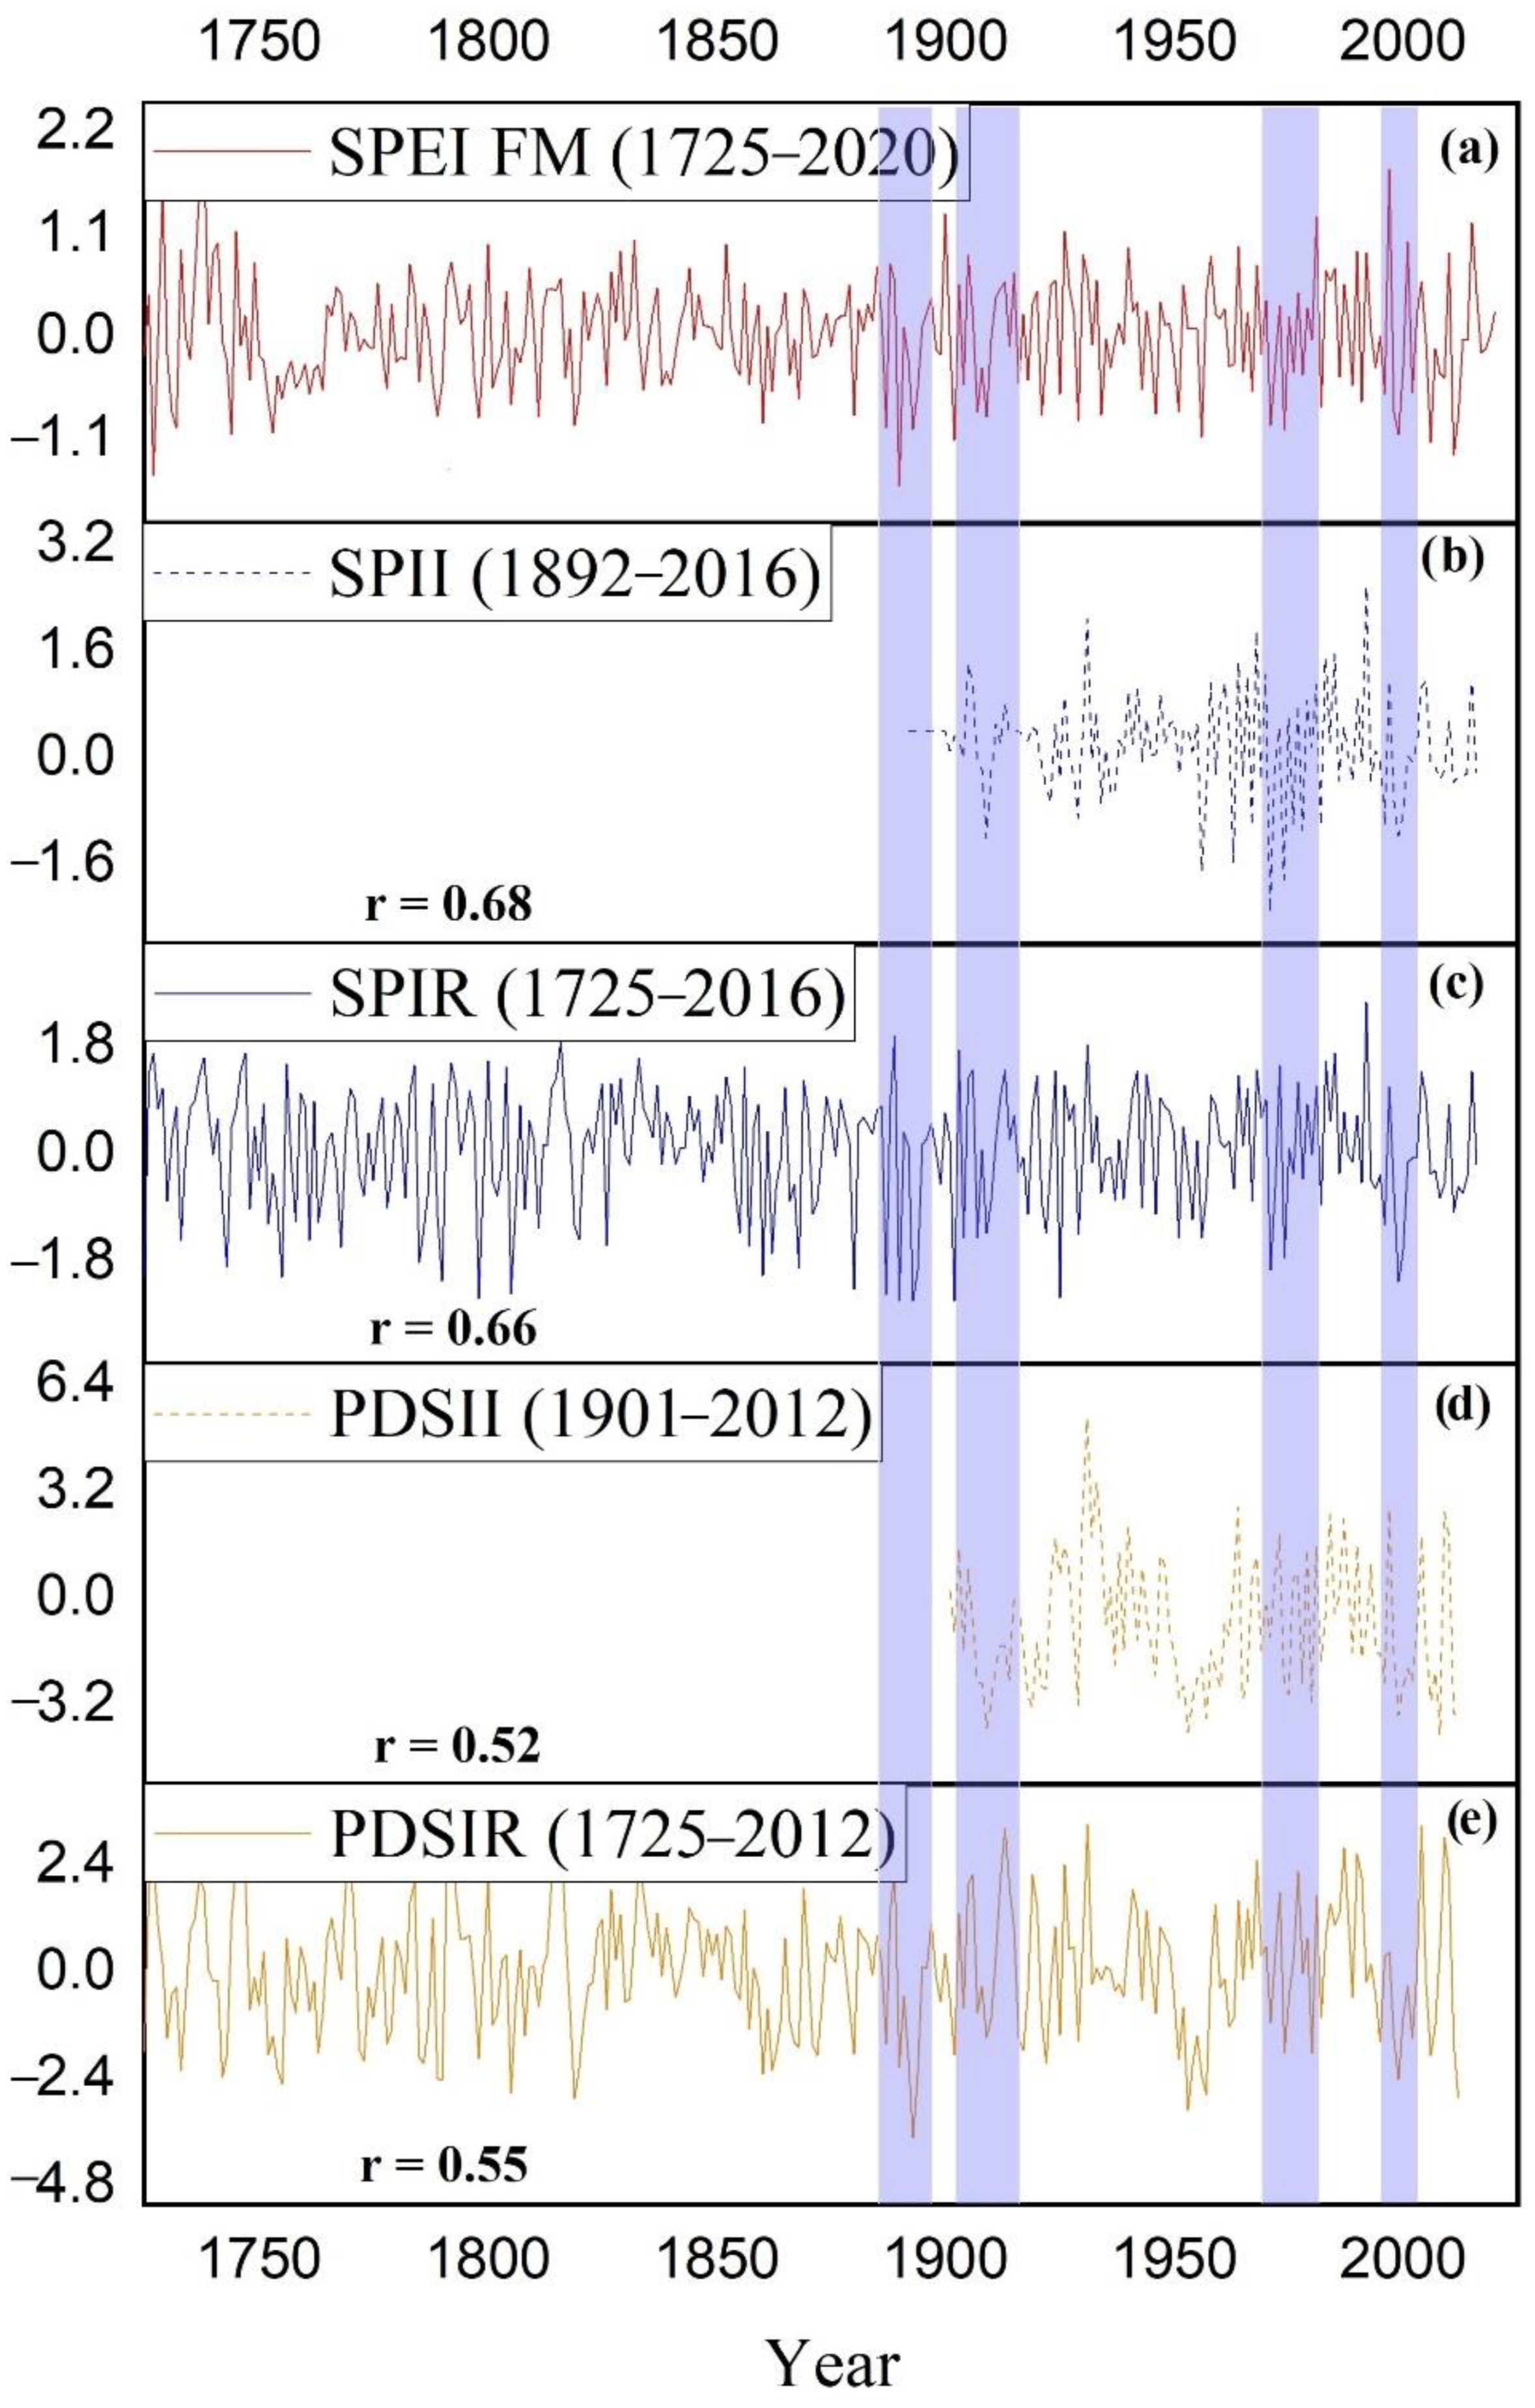
3.4. Comparison of the Reconstructed SPEI with Other Drought Indices

The relationship between our drought reconstruction and other corresponding products using different drought indices was statistically significant (p < 0.05), and may suggest that severe droughts were more frequent in the past century than earlier in the records (blue shaded lines in Figure 7).
The field spatial correlation showed positive and higher than 0.5 in a large area of north-ern Mexico and even the southwestern United States, indicating high representativeness of the reconstructed SPEI6FM for a large part of that region. Figure 8 shows the results for February–May because these were used to reconstruct this variable to represent the study area for northern Mexico.

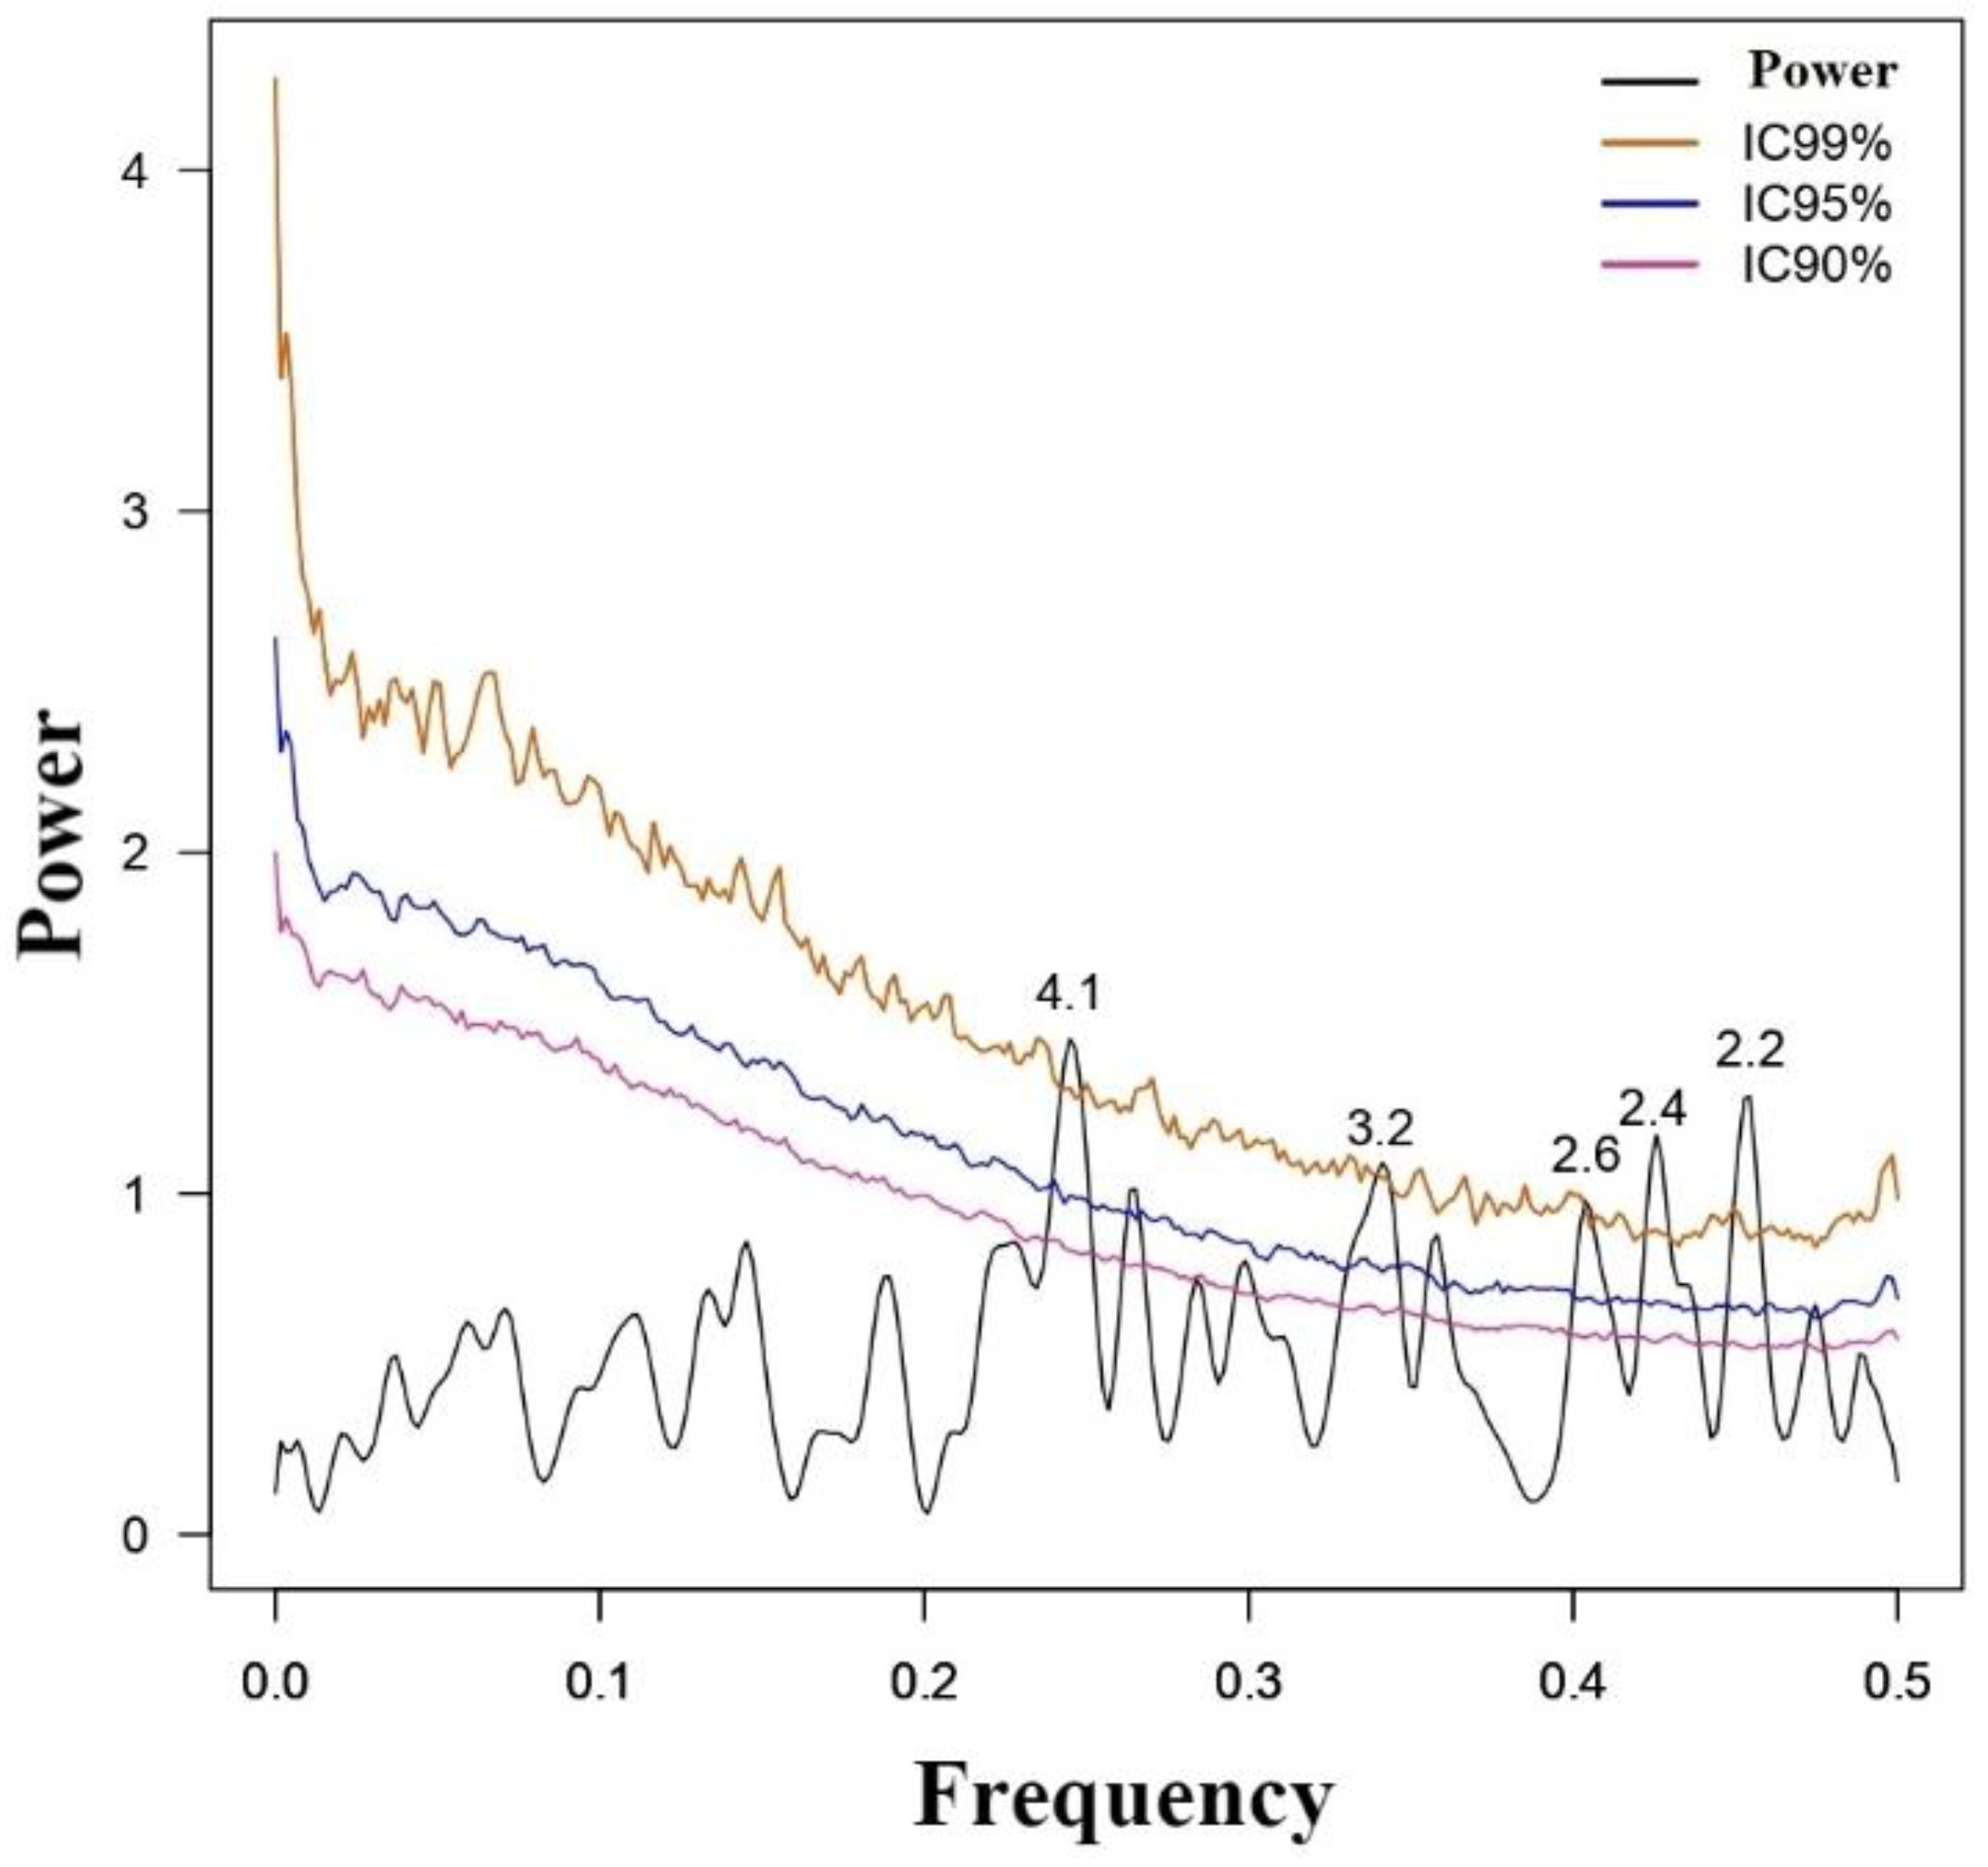
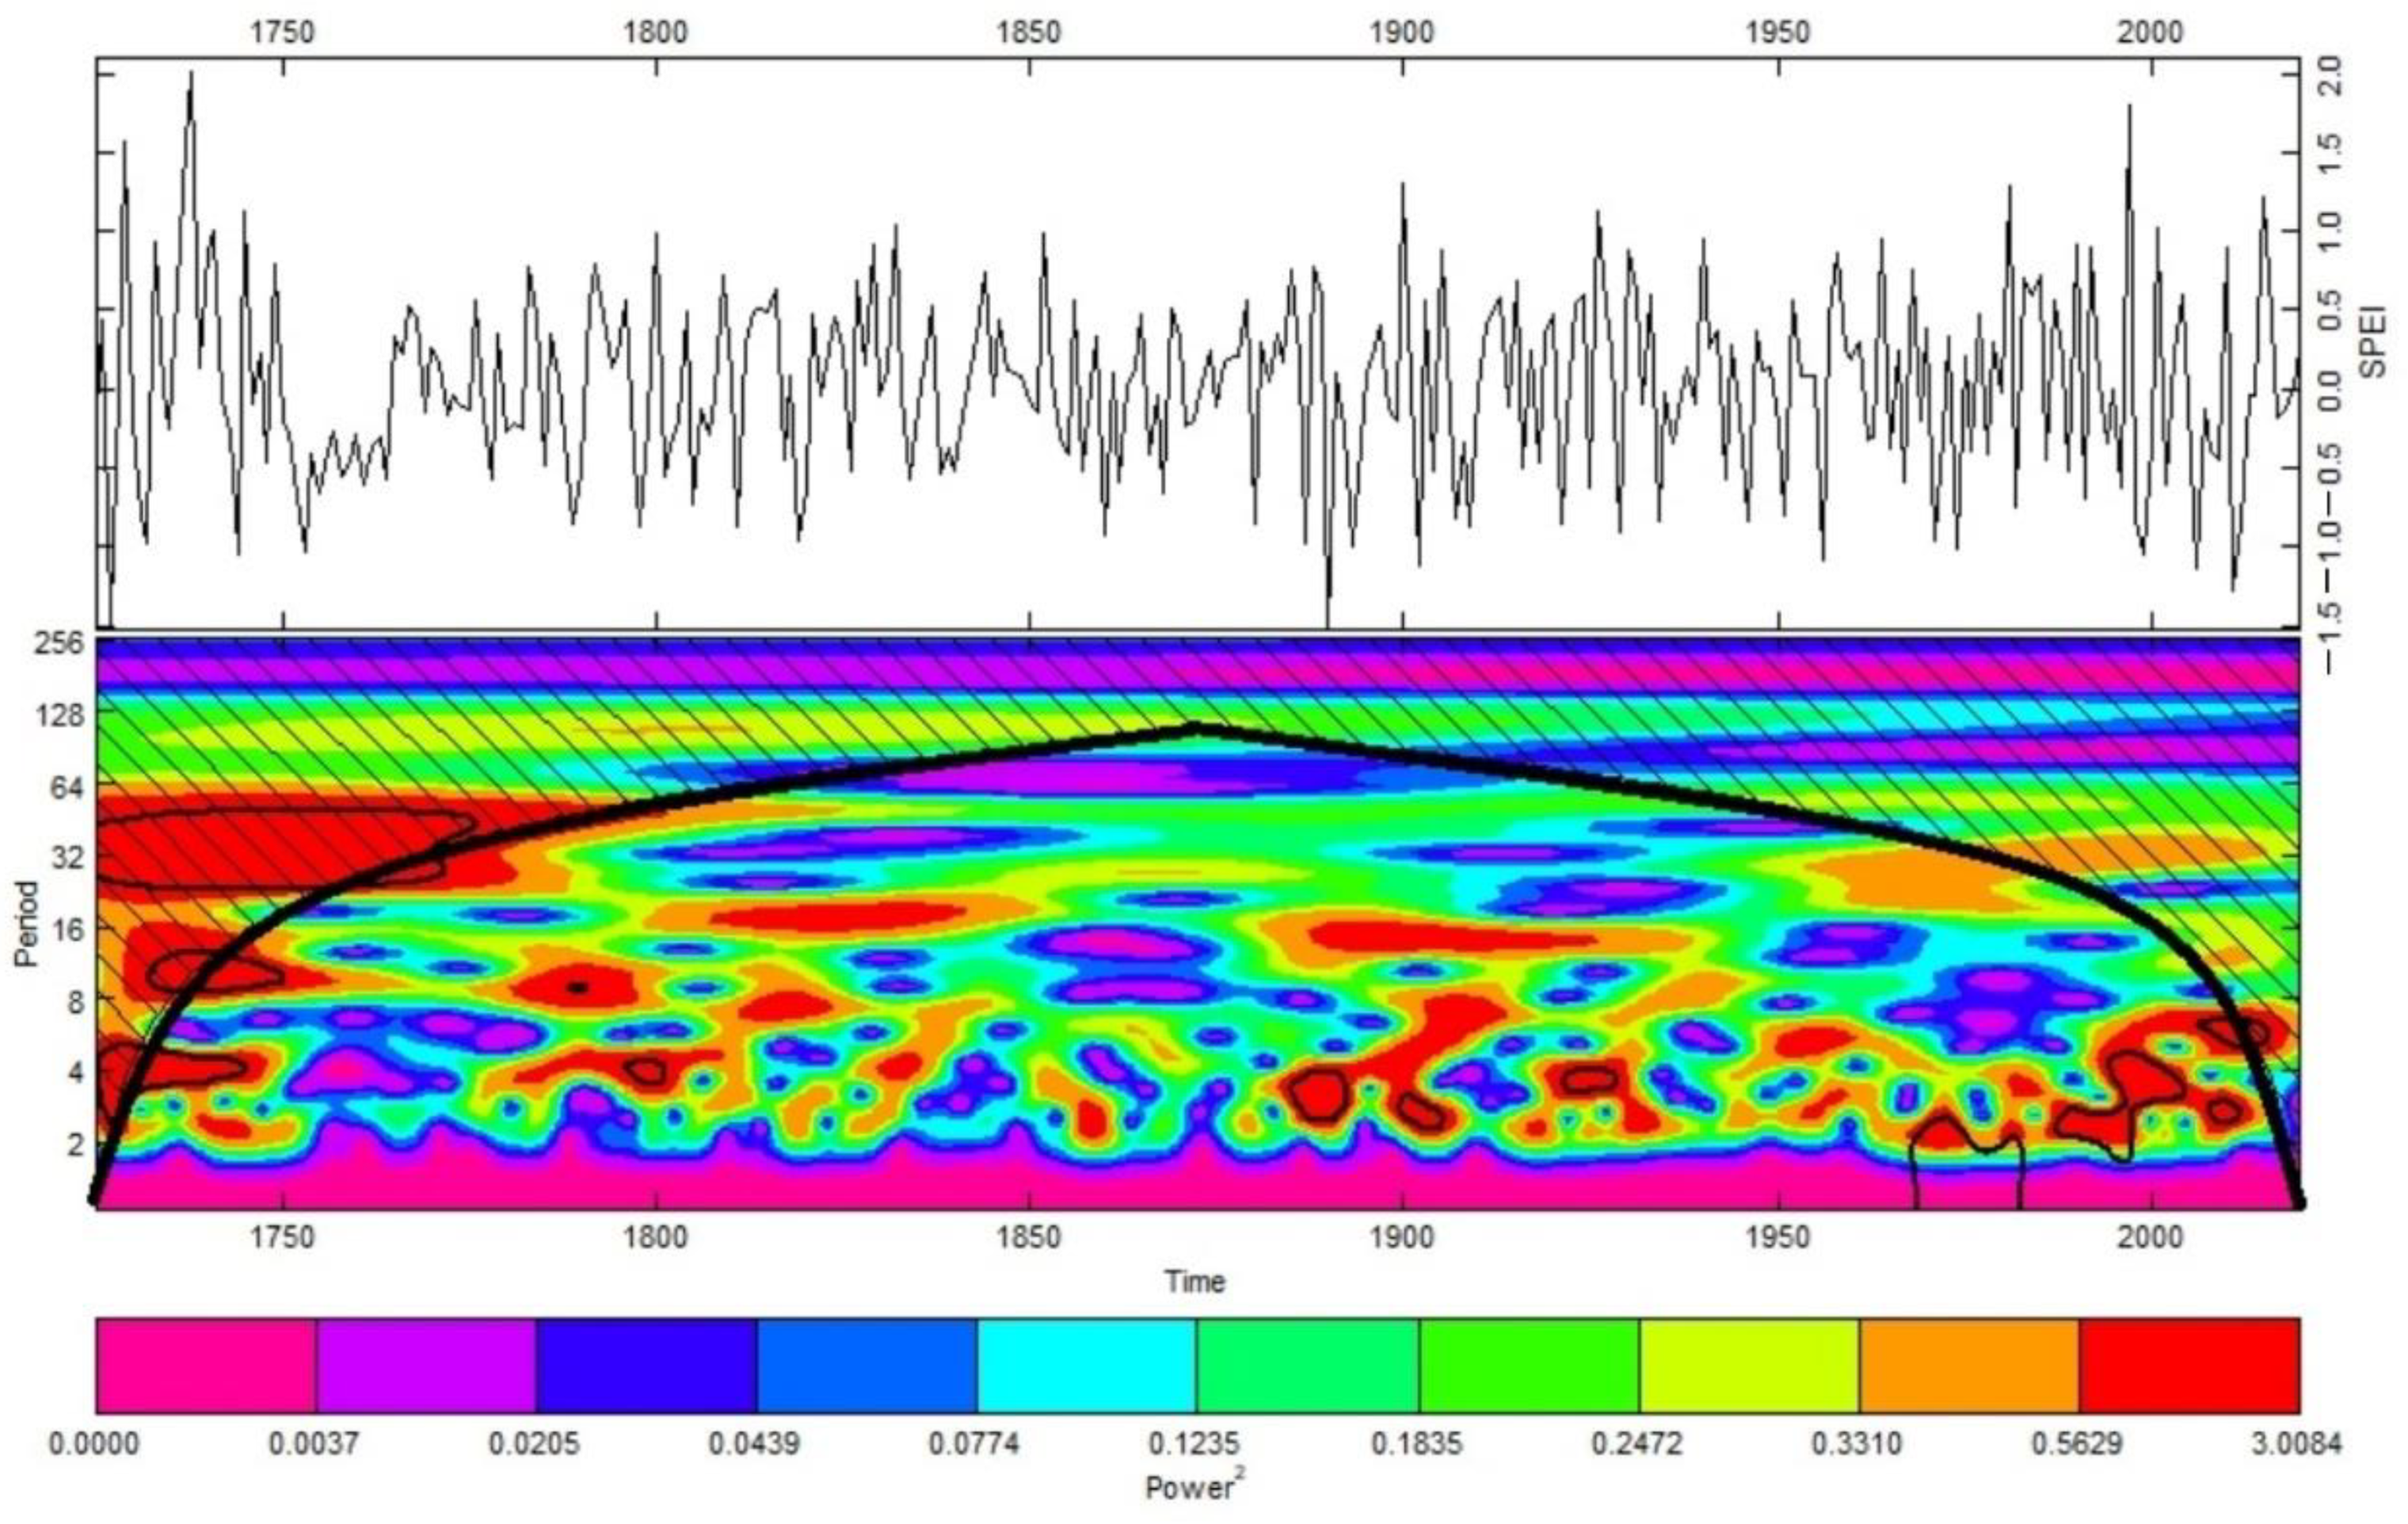
Influence of Ocean-Atmosphere Phenomena

The associations between the reconstructed SPEI6FM and ENSO through the mean MEI from February to May (1979–2020) yielded an r-value of 0.386 (p < 0.05) and through the mean PDO from February to May, an r-value of 0.385 (p < 0.05). The power spectral analysis of the reconstructed SPEI chronology detected significant (p < 0.01) high-frequency peaks of 4.1, 3.2, 2.6, 2.4, and 2.2 years (Figure 9).
The wavelet power spectral analysis showed significant 4.1-year frequencies in the periods 1725–1748, 1796–1801, 1921–1929, and 1994–2005. Frequencies of 2 to 3 years were observed in 1886–1891, 1899–1905, 1971–1974, 1986–1994, and 2011–2013 (Figure 10).

4. Discussion

P. durangensis is one of the most important timber species for forest harvesting in the Sierra Madre Occidental (SMO), mainly because of the high timber quality [45,46]. Consequently, this species has been harvested extensively, to the extent that it is currently listed as “Near Threatened” by the International Union for the Conservation of Nature (IUCN) [46,47]. In addition to its valuable timber characteristics, P. durangensis has been proven to have a remarkable dendroclimatic potential [48], with statistics similar to those reported by Irby et al. [49], i.e., an SI of 0.61, and higher than the SI of 0.28 reported by González-Cásares et al. [50]. The SI value of 0.61 calculated in the present study confirms an adequate common response between chronologies. In addition, the estimated EPS based on the number of trees and radii per tree was higher than those reported for species coexisting in nearby sites (0.85) [14,51]. We should recognize that the EPS index is highly dependent on the number of trees and sample size; therefore, the high EPS values are not constant over time, such that the period for reconstruction purposes was established from 1795 to 2020 when the EPS value reached over 0.85. Also, it must be considered that cross-sections from the same tree are correlated, partly explaining the relatively high values of the indicators obtained in the present study. For dendrochronological purposes, two to three wood cores from the same tree should be collected to capture the dominant climate variability. In this study, the number of cross-sections ranged from 5 to 8, equivalent to obtaining 5 to 8 replicates per tree, thus capturing the high- and low–frequency climate variability.
The positive relationship between the earlywood chronology of P. durangensis and precipitation in the cold season (from the previous November to the current April, Figure 4) is consistent with previous studies for other conifers in northern Mexico [17,52]. This is mainly because the growth of conifers in northern Mexico is significantly influenced by precipitation in winter–spring. This period is characterized by low-intensity precipitation that favors water infiltration and storage in the shallow soil, which the tree can efficiently use during the growing season [19,30,53].
The association of EWres with Tmax showed the greatest negative response to the warm conditions in March and April, probably caused by increased respiration and, therefore, evapotranspiration, leading to drought stress [54,55]. On the other hand, Tmin had a positive effect on the growth of P. durangensis under the cold conditions of the current January to March related to low evaporation and higher soil moisture [56]. Consequently, water availability for trees is sufficient to activate the cambium in spring, which is typical in temperate zones [57].
An additional aspect to consider is that trees may be subject to double stress, i.e., two interruptions of cambium activity: one caused by low temperatures in winter and another by drought in summer [57,58]. In this sense, the EWres of P. durangensis showed the greatest positive association with the six-month SPEI (current February to May), suggesting that the development of this growth band occurs in this period and is largely limited by water deficit and evapotranspiration–variables on which the SPEI is based [3].
The reconstruction of SPEIFM identified extreme drought periods (1727–1729, 1731–1734, 1752–1756, 1805–1819, 1860–1862, 1890–1893, 1902–1909, 1934, 1946–1956, 1971–1974, 1998–2000, 2006–2009, and 2011–2012). It is important to mention that some of the drought periods observed here do not match some of the extreme drought events reported for northern Mexico [18,59]. However, in the past century (1900–2000), we detected coincidences between the drought events reconstructed here and some droughts reported in previous studies, such as the droughts of 1890–1909, a period of extensive drought that caused significant damage to crops and livestock due to poor crop yields, affecting much of Mexico [60]. The decade 1946–1956 identified in this study has been reported elsewhere as one of the most extensive droughts having affected northern Mexico [18,61,62] and the southern United States, a country where this has been considered the most severe drought of the past millennium [63]. This scarcity scenario occurred again in 2006–2009, consistent with the results obtained here and in previous investigations [17,64].
The period 2011–2012, identified as a drought event in the present study, has been considered the worst drought in the past 70 years in Mexico, affecting to a large extent the livestock sector [65,66]. It was also an atypical year in terms of the area affected by forest fires [67]. In addition, the low crop yields caused food shortages and poverty, which may have been associated with increased insecurity levels and high migration rates [68].
The close association between the reconstructed SPEI and other drought indices (PDSI and SPI) in their reconstructed and instrumental versions (r > 0.50) underlines the validity of the results obtained here. In addition, it allowed detection of the coincidence in the variation of droughts (Figure 8), particularly the most severe events mentioned above. These results also demonstrate the effectiveness of tree rings in identifying the trend and intensity of historical droughts [18,40].
The spatial field correlation of the reconstructed SPEI6FM showed a close association (r > 0.6) with the global SPEI 06 data sets (February to May, Figure 9), indicating high representativeness for much of northern Mexico and parts of the southern United States.
MEI and PDO showed similar associations with the reconstructed SPEI6FM in some cases being greater than the reports by other authors who assessed the association between these indices of ocean–atmosphere phenomena and ring–width index chronologies [17,19,69]. The high frequency peaks (2–4 years) identified through spectral analysis coincided with the range of ENSO (<10 years) [70,71], within which the driest periods affecting northern Mexico have occurred [59]. Although the wavelet analysis showed only sporadic periodicities at frequencies below 4.1 years, this result is important as other authors such as Castruita-Esparza et al. [72] and Martinez-Sifuentes et al. [12] have found that climate variability for northwest Mexico has a memory effect of between 3 and 5 years. This result may indicate the need for more research in this direction.

5. Conclusions

The earlywood residual dendrochronology of Pinus durangensis Martinez was significantly related to the six-month cumulative SPEI of the period February-May. This association allowed for the reconstruction of SPEI6FM for a total of 296 years (1725–2020). In addition, this reconstruction made it possible to identify the increase in the recurrence of droughts since 1880.
The climate response analysis indicated that growth in P. durangensis is positively influenced by seasonal winter-spring precipitation and low temperatures. However, the negative association of growth with maximum temperature and the SPEI at different scales indicates the high susceptibility of this species to drought over short time scales. This, together with the rising temperatures resulting from global warming, may affect the ecological stability of the populations of this species in the region.
Climatic instability, coupled with the excessive exploitation of P. durangensis, has brought this species to near-threatened status. Therefore, we recommend conducting further studies to address the growth and population dynamics of P. durangensis and its response to climate change.

Author Contributions

Conceptualization, C.C.-A., J.V.-D. and G.Q.-B.; data curation, C.C.-A. and G.Q.-B.; formal analysis, C.C.-A.; funding acquisition, J.V.-D. and G.Q.-B.; methodology, C.C.-A. and J.V.-D.; resources, J.V.-D. and G.Q.-B.; writing—original draft, C.C.-A.; writing—review and editing, C.C.-A., J.V.-D., G.Q.-B., A.G.-G. and J.G.A.-Á. All authors have read and agreed to the published version of the manuscript.

Funding

This research was funded by project of the Sectoral Research Fund for Education No. 283134/CB 2016-1 “Red dendrocronológica mexicana: aplicaciones hidroclimáticas y ecológicas”. Gerónimo Quiñonez-Barraza obtained financing for field work.

Institutional Review Board Statement

Not applicable.

Informed Consent Statement

Not applicable.

Data Availability Statement

Not applicable.

Acknowledgments

The first author expresses thanks to CONACYT for her doctoral-awarded scholarship; as well as project of the Sectoral Research Fund for Education No. 283134/CB 2016-1 “Red dendrocronológica mexicana: aplicaciones hidroclimáticas y ecológicas”. We are thankful to the authorities and technical staff of Ejido San Diego de Tezains for the facilities and support provided in the field sampling. María Elena Sánchez-Salazar translated the manuscript into English.

Conflicts of Interest

The authors declare no conflict of interest.

References

  1. Trenberth, K.; Overpeck, J.; Solomon, S. Exploring Drought and Its Implications for the Future. Eos Trans. Am. Geophys. Union 2004, 85, 27. [Google Scholar] [CrossRef]
  2. IPCC. The Physical Science Basis. In Contribution of Working Group I to the Fifth Assessment Report of the Intergovernmental Panel on Climate Change; Stocker, T.F., Qin, D., Plattner, G.-K., Tignor, M., Allen, S.K., Boschung, J., Nauels, A., Xia, Y., Bex, V., Midgley, P.M., Eds.; Cambridge University Press: Cambridge, UK, 2013. [Google Scholar]
  3. Ma, Y.; Liu, Y.; Song, H.; Sun, J.; Lei, Y.; Wang, Y. A Standardized Precipitation Evapotranspiration Index Reconstruction in the Taihe Mountains Using Tree-Ring Widths for the Last 283 Years. PLoS ONE 2015, 10, e0133605. [Google Scholar] [CrossRef] [PubMed]
  4. Wilhite, D.A.; Glantz, M.H. Understanding: The Drought Phenomenon: The Role of Definitions. Water Int. 1985, 10, 111–120. [Google Scholar] [CrossRef] [Green Version]
  5. Vicente-Serrano, S.M.; Beguería, S.; López-Moreno, J.I. A Multiscalar Drought Index Sensitive to Global Warming: The Standardized Precipitation Evapotranspiration Index. J. Clim. 2010, 23, 1696–1718. [Google Scholar] [CrossRef] [Green Version]
  6. Eslamian, S.; Ostad-Ali-Askari, K.; Singh, V.; Dalezios, N.; Ghane, M.; Yihdego, Y.; Matouq, M. A Review of Drought Indices. Int. J. Constr. Res. Civ. Eng. 2017, 3, 48–66. [Google Scholar] [CrossRef]
  7. Doughty, C.E.; Metcalfe, D.B.; Girardin, C.A.J.; Amézquita, F.F.; Cabrera, D.G.; Huasco, W.H.; Silva-Espejo, J.E.; Araujo-Murakami, A.; da Costa, M.C.; Rocha, W.; et al. Drought Impact on Forest Carbon Dynamics and Fluxes in Amazonia. Nature 2015, 519, 78–82. [Google Scholar] [CrossRef] [Green Version]
  8. Stephens, S.L.; Agee, J.K.; Fule, P.Z.; North, M.P.; Romme, W.H.; Swetnam, T.W.; Turner, M.G. Managing Forests and Fire in Changing Climates. Science 2013, 342, 41–42. [Google Scholar] [CrossRef] [PubMed]
  9. Mukherjee, S.; Mishra, A.; Trenberth, K.E. Climate Change and Drought: A Perspective on Drought Indices. Curr. Clim. Chang. Rep. 2018, 4, 145–163. [Google Scholar] [CrossRef]
  10. Villanueva-Díaz, J.; Cerano Paredes, J.; Stahle, D.W.; Constante García, V.; Vázquez Salem, L.; Estrada Ávalos, J.; Benavides Solorio, J.d.D. Árboles Longevos de México. Rev. Mex. Cienc. For. 2010, 1, 7–30. [Google Scholar]
  11. Osorio-Osorio, J.A.; Astudillo-Sánchez, C.-C.; Villanueva-Díaz, J.; Soria-Díaz, L.; Vargas-Tristán, V. Reconstrucción Histórica de La Precipitación En La Reserva de La Biosfera El Cielo, México, Mediante Anillos de Crecimiento En Taxodium Mucronatum (Cupressaceae). Rev. Biol. Trop. 2020, 68, 818–832. [Google Scholar] [CrossRef]
  12. Martínez-Sifuentes, A.R.; Villanueva-Díaz, J.; Correa-Díaz, A.; Estrada-Ávalos, J.; Trucíos-Caciano, R.; Estrada-Arellano, J.R.; Cardoza-Martínez, G.F.; Garza-Martínez, M.Á. Dendroclimatic Reconstruction of Precipitation and Temperature for the Mayo River Basin in Northwestern Mexico. Trees 2022, 36, 835–847. [Google Scholar] [CrossRef]
  13. Villanueva-Diaz, J.; Stahle, D.W.; Luckman, B.H.; Cerano-Paredes, J.; Therrell, M.D.; Cleaveland, M.K.; Cornejo-Oviedo, E. Winter-Spring Precipitation Reconstructions from Tree Rings for Northeast Mexico. Clim. Chang. 2007, 83, 117–131. [Google Scholar] [CrossRef]
  14. Villanueva-Díaz, J.; Martínez-Sifuentes, A.R.; Quiñonez-Barraza, G.; Estrada-Ávalos; Perez-Evangelista, E.R.; del Rocío Reyes-Camarillo, F.; Reyes-Camarillo, R. Annual Radial Growth and Climatic Response of Quercus Crassifolia Bonpl. in Northwestern Durango, Mexico. Trees 2021, 35, 783–798. [Google Scholar] [CrossRef]
  15. Villanueva-Díaz, J.; Martínez-Sifuentes, A.-R.; Reyes-Camarillo, F.-R.; Estrada-Ávalos, J. Reconstrucción de Precipitación y Temperatura Con Anillos de Crecimiento Anual Del Ciprés Taxodium Mucronatum (Taxodiaceae) En Coahuila, México. Rev. Biol. Trop. 2021, 69, 302–316. [Google Scholar] [CrossRef]
  16. Brito-Castillo, L.; Díaz-Castro, S.; Salinas-Zavala, C.A.; Douglas, A.V. Reconstruction of Long-Term Winter Streamflow in the Gulf of California Continental Watershed. J. Hydrol. 2003, 278, 39–50. [Google Scholar] [CrossRef]
  17. Martínez-Sifuentes, A.R.; Villanueva-Díaz, J.; Carlón-Allende, T.; Estrada-Ávalos, J. 243 Years of Reconstructed Streamflow Volume and Identification of Extreme Hydroclimatic Events in the Conchos River Basin, Chihuahua, Mexico. Trees 2020, 34, 1347–1361. [Google Scholar] [CrossRef]
  18. Stahle, D.W.; Cook, E.R.; Burnette, D.J.; Villanueva, J.; Cerano, J.; Burns, J.N.; Griffin, D.; Cook, B.I.; Acuña, R.; Torbenson, M.C.A.; et al. The Mexican Drought Atlas: Tree-Ring Reconstructions of the Soil Moisture Balance during the Late Pre-Hispanic, Colonial, and Modern Eras. Quat. Sci. Rev. 2016, 149, 34–60. [Google Scholar] [CrossRef] [Green Version]
  19. Villanueva-Díaz, J.; Stahle, D.W.; Therrell, M.D.; Beramendi-Orosco, L.; Estrada-Ávalos, J.; Martínez-Sifuentes, A.R.; Astudillo-Sánchez, C.C.; Cervantes-Martínez, R.; Cerano-Paredes, J. The Climatic Response of Baldcypress (Taxodium mucronatum Ten.) in San Luis Potosi, Mexico. Trees 2020, 34, 623–635. [Google Scholar] [CrossRef]
  20. Zargar, A.; Sadiq, R.; Naser, B.; Khan, F.I. A Review of Drought Indices. Environ. Rev. 2011, 19, 333–349. [Google Scholar] [CrossRef]
  21. Wells, N.; Goddard, S.; Hayes, M.J. A Self-Calibrating Palmer Drought Severity Index. J. Clim. 2004, 17, 2335–2351. [Google Scholar] [CrossRef]
  22. Hayes, M.J.; Svoboda, M.D.; Wiihite, D.A.; Vanyarkho, O.V. Monitoring the 1996 Drought Using the Standardized Precipitation Index. Bull. Am. Meteorol. Soc. 1999, 80, 429–438. [Google Scholar] [CrossRef] [Green Version]
  23. García, M.E. Modificaciones Al Sistema de Clasificación Climática de Köppen, 4th ed.; Instituto de Geografía, Ed.; Universidad Nacional Autónoma de México: Mexico City, Mexico, 1981. [Google Scholar]
  24. Quiñonez-Barraza, G.; Zhao, D.; De Los Santos Posadas, H.M.; Corral-Rivas, J.J. Considering Neighborhood Effects Improves Individual Dbh Growth Models for Natural Mixed-Species Forests in Mexico. Ann. For. Sci. 2018, 75, 78. [Google Scholar] [CrossRef] [Green Version]
  25. FAO. World Reference Base for Soil Resources 2014; FAO: Rome, Italy, 2015. [Google Scholar]
  26. González, E.M.; Márquez, L.M.A. Vegetación y Ecorregiones de Durango; Plaza y Valdés: Mexico City, Mexico, 2007. [Google Scholar]
  27. INEGI. Continuo Mexicano de Elevaciones (CEM) 3.0 [Mexican Continuous Elevation 3.0]; INEGI: Aguascalientes, Mexico, 2013.
  28. Stokes, M.A.; Smiley, T.L. An Introduction to Tree Ring Dating; University of Chicago Press: Chicago, IL, USA, 1968. [Google Scholar]
  29. Holmes, R.L.; Adams, R.K.; Fritts, H.C. Tree-Ring Chronologies of Western North America: California, Eastern Oregon and Northern Great Basin with Procedures Used in the Chronology Development Work Including Users Manuals for Computer Programs COFECHA and ARSTAN; Laboratory of Tree-Ring Research, University of Arizona: Tucson, AZ, USA, 1986. [Google Scholar]
  30. Fritts, H.C. Tree Rings and Climate; Academic Press: London, UK; New York, NY, USA, 1976. [Google Scholar]
  31. Bunn, A.G. A Dendrochronology Program Library in R (DplR). Dendrochronologia 2008, 26, 115–124. [Google Scholar] [CrossRef]
  32. R Core Team. R: A Language and Environment for Statistical Computing; R Foundation for Statistical Computing 2020; R Core Team: Vienna, Austria, 2020. [Google Scholar]
  33. Briffa, K.; Jones, P.D. Basic Chronology Statistics and Assessment. In Methods of Dendrochronology: Applications in the Environmental Sciences; Cook, E.R., Kairiukstis, L.A., Eds.; Kluwer Academic Publishers: Dordrech, The Netherlands, 1990; pp. 137–162. [Google Scholar]
  34. Wigley, T.M.L.; Briffa, K.R.; Jones, P.D. On the Average Value of Correlated Time Series, with Applications in Dendroclimatology and Hydrometeorology. J. Appl. Meteorol. Climatol. 1984, 23, 201–213. [Google Scholar] [CrossRef]
  35. Meko, D.M.; Touchan, R.; Anchukaitis, K.J. Seascorr: A MATLAB Program for Identifying the Seasonal Climate Signal in an Annual Tree-Ring Time Series. Comput. Geosci. 2011, 37, 1234–1241. [Google Scholar] [CrossRef]
  36. Zang, C.; Biondi, F. Treeclim: An R Package for the Numerical Calibration of Proxy-Climate Relationships. Ecography 2015, 38, 431–436. [Google Scholar] [CrossRef]
  37. Cleaveland, M.K.; Stahle, D.W.; Therrell, M.D.; Villanueva-Diaz, J.; Burns, B.T. Tree-Ring Reconstructed Winter Precipitation and Tropical Teleconnections in Durango, Mexico. Clim. Chang. 2003, 59, 369–388. [Google Scholar] [CrossRef]
  38. Cook, E.R.; Meko, D.M.; Stahle, D.W.; Cleaveland, M.K. Drought Reconstructions for the Continental United States. J. Clim. 1999, 12, 1145–1162. [Google Scholar] [CrossRef] [Green Version]
  39. Steel, R.; Torrie, J. Principles and Procedures of Statistics. A Biometrical Approach, 2nd ed.; McGraw-Hill: New York, NY, USA, 1980. [Google Scholar]
  40. Stahle, D.W.; Cook, E.R.; Burnette, D.J.; Torbenson, M.C.A.; Howard, I.M.; Griffin, D.; Diaz, J.V.; Cook, B.I.; Williams, A.P.; Watson, E.; et al. Dynamics, Variability, and Change in Seasonal Precipitation Reconstructions for North America. J. Clim. 2020, 33, 3173–3195. [Google Scholar] [CrossRef]
  41. Wolter, K.; Timlin, M.S. El Niño/Southern Oscillation Behaviour since 1871 as Diagnosed in an Extended Multivariate ENSO Index (MEI.Ext). Int. J. Climatol. 2011, 31, 1074–1087. [Google Scholar] [CrossRef]
  42. Zhang, T.; Hoell, A.; Perlwitz, J.; Eischeid, J.; Murray, D.; Hoerling, M.; Hamill, T.M. Towards Probabilistic Multivariate ENSO Monitoring. Geophys. Res. Lett. 2019, 46, 10532–10540. [Google Scholar] [CrossRef]
  43. Zhang, Y.; Wallace, J.M.; Battisti, D.S. ENSO-like Interdecadal Variability: 1900–93. J. Clim. 1997, 10, 1004–1020. [Google Scholar] [CrossRef]
  44. Mann, M.E.; Lees, J.M. Robust Estimation of Background Noise and Signal Detection in Climatic Time Series. Clim. Chang. 1996, 33, 409–445. [Google Scholar] [CrossRef]
  45. Perry, J.P. The Pines of México and Central America; Timber Press, Inc.: Portland, OR, USA, 1991. [Google Scholar]
  46. Hernández-Velasco, J.; Hernández-Díaz, J.C.; Fladung, M.; Cañadas-López, Á.; Prieto-Ruíz, J.Á.; Wehenkel, C. Spatial Genetic Structure in Four Pinus Species in the Sierra Madre Occidental, Durango, Mexico. Can. J. For. Res. 2016, 47, 73–80. [Google Scholar] [CrossRef]
  47. Simental-Rodriguez, S.L.; Pérez-Luna, A.; Hernández-Díaz, J.C.; Jaramillo-Correa, J.P.; López-Sánchez, C.A.; Flores-Rentería, L.; Carrillo-Parra, A.; Wehenkel, C. Modelling Shifts and Contraction of Seed Zones in Two Mexican Pine Species by Using Molecular Markers. Forests 2021, 12, 570. [Google Scholar] [CrossRef]
  48. Díaz-Ramírez, B.; Villanueva-Díaz, J.; Cerano-Paredes, J. Reconstrucción de La Precipitación Estacional Con Anillos de Crecimiento Para La Región Hidrológica Presidio-San Pedro. Madera Bosques 2016, 22, 111–123. [Google Scholar] [CrossRef] [Green Version]
  49. Irby, C.M.; Fulé, P.Z.; Yocom, L.L.; Villanueva Díaz, J. Dendrochronological Reconstruction of Long-Term Precipitation Patterns in Basaseachi National Park, Chihuahua, Mexico. Madera Bosques 2013, 19, 92–105. [Google Scholar]
  50. González-Cásares, M.; Pompa-García, M.; Camarero, J.J. Differences in Climate–Growth Relationship Indicate Diverse Drought Tolerances among Five Pine Species Coexisting in Northwestern Mexico. Trees 2017, 31, 531–544. [Google Scholar] [CrossRef]
  51. Acosta-Hernández, A.C.; Padilla-Martínez, J.R.; Hernández-Díaz, J.C.; Prieto-Ruiz, J.A.; Goche-Telles, J.R.; Nájera-Luna, J.A.; Pompa-García, M. Influence of Climate on Carbon Sequestration in Conifers Growing under Contrasting Hydro-Climatic Conditions. Forests 2020, 11, 1134. [Google Scholar] [CrossRef]
  52. González-Elizondo, M.; González-Elizondo, M.d.S.; Villanueva Díaz, J.; Cerano Paredes, J. Evaluación Del Potencial Dendroclimático de Pinus Lumholtzii B.L. Rob. & Fernald. Rev. Mex. Cienc. For. 2017, 8, 28–54. [Google Scholar]
  53. Aguirre-Díaz, G.J.; Labarthe-Hernández, G. Fissure Ignimbrites: Fissure-Source Origin for Voluminous Ignimbrites of the Sierra Madre Occidental and Its Relationship with Basin and Range Faulting. Geology 2003, 31, 773–776. [Google Scholar] [CrossRef]
  54. Wang, Y.; Feng, Q.; Kang, X. Tree-Ring-Based Reconstruction of Temperature Variability (1445–2011) for the Upper Reaches of the Heihe River Basin, Northwest China. J. Arid Land 2016, 8, 60–76. [Google Scholar] [CrossRef] [Green Version]
  55. Zhou, H.; Chen, Y.; Zhu, C.; Li, Z.; Fang, G.; Li, Y.; Fu, A. Climate Change May Accelerate the Decline of Desert Riparian Forest in the Lower Tarim River, Northwestern China: Evidence from Tree-Rings of Populus Euphratica. Ecol. Indic. 2020, 111, 105997. [Google Scholar] [CrossRef]
  56. Chávez-Gándara, M.P.; Cerano-Paredes, J.; Nájera-Luna, J.A.; Pereda-Breceda, V.; Esquivel-Arriaga, G.; Cervantes-Martínez, R.; Cambrón-Sandoval, V.H.; Cruz-Cobos, F.; Corral-Rivas, S. Reconstrucción de La Precipitación Invierno-Primavera Con Base En Anillos de Crecimiento de Árboles Para La Región de San Dimas, Durango, México. Bosque 2017, 38, 387–399. [Google Scholar] [CrossRef] [Green Version]
  57. de Luis, M.; Gričar, J.; Čufar, K.; Raventós, J. Seasonal Dynamics of Wood Formation in Pinus Halepensis from Dry and Semi-Arid Ecosystems in Spain. IAWA J. 2007, 28, 389–404. [Google Scholar] [CrossRef] [Green Version]
  58. Cherubini, P.; Gartner, B.L.; Tognetti, R.; Bräker, O.U.; Schoch, W.; Innes, J.L. Identification, Measurement and Interpretation of Tree Rings in Woody Species from Mediterranean Climates. Biol. Rev. 2003, 78, 119–148. [Google Scholar] [CrossRef] [PubMed] [Green Version]
  59. Cerano-Paredes, J.; Villanueva Díaz, J.; Valdez Cepeda, R.D.; Méndez González, J.; Constante García, V. Sequías Reconstruidas En Los Últimos 600 Años Para El Noreste de México. Rev. Mex. Cienc. Agrícolas 2011, 2, 235–249. [Google Scholar]
  60. Florescano, M.E. Análisis Histórico de Las Sequías En México; Secretaría de Agricultura y Recursos Hidráulicos (SARH): Mexico City, Mexico, 1980. [Google Scholar]
  61. Villanueva-Díaz, J.; Cerano-Paredes, J.; Estrada-Ávalos, J. Reconstrucción de Precipitación Estacional de Pseudotsuga Menziesii (Mirb.) Franco En Sierra La Madera, Cuatrociénegas, Coahuila. Rev. Mex. Cienc. For. 2008, 33, 17–35. [Google Scholar]
  62. Cerano-Paredes, J.; Villanueva-Díaz, J.; Fulé, P.Z.; Arreola Ávila, J.G.; Sánchez Cohen, I.; Valdez Cepeda, R.D. Reconstrucción de 350 Años de Precipitación Para El Suroeste de Chihuahua, México. Madera Bosques 2009, 15, 27–44. [Google Scholar] [CrossRef] [Green Version]
  63. Grissino-Mayer, H.D. Tree-Ring Reconstruction of Climate and Fire History at El Malpais National Monument New Mexico; The University of Arizona: Tucson, AZ, USA, 1995. [Google Scholar]
  64. Woodhouse, C.A.; Stahle, D.W.; Díaz, J.V. Rio Grande and Rio Conchos Water Supply Variability over the Past 500 Years. Clim. Res. 2012, 51, 147–158. [Google Scholar] [CrossRef] [Green Version]
  65. Ortega-Gaucin, D.; Pérez, M.L.; Cortés, F.I.A. Drought Risk Management in Mexico: Progress and Challenges. Int. J. Saf. Secur. Eng. 2016, 6, 161–170. [Google Scholar] [CrossRef] [Green Version]
  66. Murray-Tortarolo, G.N.; Jaramillo, V.J. The Impact of Extreme Weather Events on Livestock Populations: The Case of the 2011 Drought in Mexico. Clim. Chang. 2019, 153, 79–89. [Google Scholar] [CrossRef]
  67. Zúñiga-Vásquez, J.M.; Cisneros-González, D.; Pompa-García, M. Drought Regulates the Burned Forest Areas in Mexico: The Case of 2011, a Record Year. Geocarto Int. 2019, 34, 560–573. [Google Scholar] [CrossRef]
  68. Colunga, M.; Rivera, F. Drought and Mexico-US Migration. In The State of Environmental Migration; Gemenne, F., Brücker, P., Ionesco, D., Eds.; IDDRI: Paris, France, 2011; pp. 91–106. [Google Scholar]
  69. Carlón-Allende, T.; Villanueva Díaz, J.; Soto Castro, G.; Mendoza, M.E.; Macías, J.L. Tree Rings as Indicators of Climatic Variation in the Trans-Mexican Volcanic Belt, Central Mexico. Ecol. Indic. 2021, 120, 106920. [Google Scholar] [CrossRef]
  70. Seaguer, R.; Ting, M.; Davis, M.; Cane, M.; Naik, N.; Nakamura, J.; Li, C.; Cook, E.; Stahle, D.W. Mexican Drought: An Observational Modeling and Tree Ring Study of Variability and Climate Change. Atmósfera 2009, 22, 1–31. [Google Scholar]
  71. Bruun, J.T.; Allen, J.I.; Smyth, T.J. Heartbeat of the Southern Oscillation Explains ENSO Climatic Resonances. J. Geophys. Res. Ocean. 2017, 122, 6746–6772. [Google Scholar] [CrossRef] [Green Version]
  72. Castruita-Esparza, L.U.; Silva, L.C.R.; Gómez-Guerrero, A.; Villanueva-Díaz, J.; Correa-Díaz, A.; Horwath, W.R. Coping With Extreme Events: Growth and Water-Use Efficiency of Trees in Western Mexico During the Driest and Wettest Periods of the Past One Hundred Sixty Years. J. Geophys. Res. Biogeosciences 2019, 124, 3419–3431. [Google Scholar] [CrossRef]
Figure 1. (a) Location of the study area; (b) photograph of a Pinus durangensis specimen; (c) mean monthly weather conditions from 1973 to 2019.
Forests 13 01233 g001
Figure 2. (a) Earlywood residual chronology (EWres) of Pinus durangensis (gray line). The black horizontal line represents the average index value that shows the interannual variability for the period 1725–2020; the gray shaded area represents the number of radii used to produce each annual index value (right y-axis). (b) Earlywood residual chronology (EWres) of Pinus durangensis (gray line). The running EPS was calculated based on the number of sampled trees and is represented by a red line and the minimum EPS of 0.85 is represented by the black horizontal dotted line. The running Rbar is represented in a blue line.
Forests 13 01233 g002
Figure 3. Correlations between the earlywood residual chronology (EWres) and the monthly climatic variables (a) precipitation, (b) maximum temperature, (c) minimum temperature, (d) mean temperature, and (e) SPEI calculated on a 6-month cumulative scale. Months in lowercase indicate the previous year, while months in uppercase correspond to the current growth year. Climate data were obtained for the period 1974–2019 (46 years). The dotted horizontal lines indicate the level of significance (p < 0.05). For the SPEI association with the EWres the level of significance was p < 0.01.
Forests 13 01233 g003
Figure 4. Drought–growth association calculated for Pinus durangensis by relating the SPEI drought index to the earlywood residual chronology. The value was assigned to the last month of the SPEI cumulative period.
Forests 13 01233 g004
Figure 5. Scatterplot of the linear regression model showing the variability of the earlywood residual chronology (EWres) with the six-month cumulative SPEI from February to May 1974–2019 (46 years).
Forests 13 01233 g005
Figure 6. (a) Reconstructed SPEI for the western region of the State of Durango during 1725–2020; (b) comparison between observed SPEI (dashed line) and reconstructed SPEI (gray line). Triangles denote wet years and black dots represent extreme drought events. The vertical red line indicates the year in which the instrumental SPEI was split for calibration and verification purposes.
Forests 13 01233 g006
Figure 7. Temporal variation for different drought indices, reconstructed SPEI (a), instrumental SPI (b), reconstructed SPI [40] (c), instrumental PDSI (d), and reconstructed PDSI [18] (e). Pearson’s correlation coefficients (r) between drought indices and SPEI6FM are indicated in every panel. The blue shaded lines represent periods of common severe droughts in the different analyzed indices and the reconstructed SPEI.
Forests 13 01233 g007
Figure 8. Spatial correlation between the reconstructed SPEI6FM and the six-month cumulative SPEI of the Global Drought Monitor for the months used in the reconstruction: (a) February, (b) March, (c) April, and (d) May.
Forests 13 01233 g008
Figure 9. Power spectral analysis for the six-month reconstructed SPEI (February–May). Values above the confidence limits are significant.
Forests 13 01233 g009
Figure 10. Wavelet coherence analysis for six-month reconstructed SPEI (February–May). Perimeters marked with a thick dark line within the cone of influence indicate significant areas (p < 0.05).
Forests 13 01233 g010
Table 1. Dendrochronological statistics for total ring width, earlywood, and latewood chronologies.
ChronologyDendrochronological Statistics
MeanSDEPSSIMSAC1
TRWstd0.950.270.990.620.350.51
EWstd0.950.290.990.610.390.50
LWstd 0.950.220.980.440.370.49
TRWres0.980.210.990.620.35−0.08
EWres0.980.220.990.610.39−0.05
LWres0.980.180.980.440.370.02
TRW, total ring width chronology; EW, earlywood chronology; LW, latewood chronology; std, standard chronologies; res, residual chronologies; SD, standard deviation; EPS, expressed population signal; SI, series intercorrelation; MS, mean sensitivity; and AC1, first-order autocorrelation.
Table 2. Correlation between SPEI values calculated on a 6-month cumulative scale and standard and residual chronologies of Pinus durangensis.
ChronologyFebruaryMarchAprilMay
TRWstd0.660.660.650.62
EWstd0.670.660.670.64
LWstd0.600.600.560.52
TRWres0.680.710.730.69
EWres *0.680.700.740.70
LWres0.680.690.670.62
* Refers to the chronology with greater association with calculated SPEI data. All values were significant (p < 0.01).
Table 3. Statistics for the validation process of the seasonal SPEI from February to May of the current growth year.
PeriodrtVSTFNDRECEDW
Calibration
(1974–1996)
0.7073.037430.4760.4761.865
Verification
(1997–2019)
0.7633.979550.6260.626
r, Pearson’s correlation coefficient; tV, t-value; ST, sign test; FND, first negative difference; RE, reduction of error; CE, coefficient of efficiency; and DW, Durbin–Watson coefficient. The significance in both periods was maintained at 5% (p < 0.05). All values were significant (p < 0.05).
Publisher’s Note: MDPI stays neutral with regard to jurisdictional claims in published maps and institutional affiliations.

