Article

Management of Recreational Forests in the Romanian Carpathians

by
Gheorghe-Marian Tudoran
1,*,
Avram Cicșa
1,2,
Maria Cicșa (Boroeanu)
1 and
Alexandru-Claudiu Dobre
1,2
1
Department of Forest Engineering, Faculty of Silviculture and Forest Engineering, “Transilvania” University, Forest Management Planning and Terrestrial Measurements, 500123 Brașov, Romania
2
“Marin Drăcea” Romanian National Institute for Research and Development in Forestry, Department of Forest Monitoring, 128 Eroilor Blvd., 077190 Voluntari, Romania
*
Author to whom correspondence should be addressed.
Forests 2022, 13(9), 1369; https://doi.org/10.3390/f13091369
Submission received: 27 July 2022 / Revised: 23 August 2022 / Accepted: 24 August 2022 / Published: 27 August 2022
(This article belongs to the Special Issue Forest Ecosystem Services and Landscape Design)

Abstract

:
Research Highlights: Forests, due to their aesthetic properties, have huge recreational potential, but their management must take into account the requirements of all parties interested in these services. Background and Objectives: We sought to determine the main indicators that characterize the structural diversity of a recreational mountain forest, with relevance for the management of these forests, given that they fulfill multiple functions. Materials and Methods: The structure of 446 stands was investigated and the Shannon (H) diversity index was applied at the level of species (Hsp), age (Hage), tree diameter (Hdg), and tree height (Hhg). Results: Beech occupied 49% of the forest area and fir and spruce 16% each. Generations of trees older than 100 years occupied 71% of the forest area and those older than 150 years occupied 10%. At an age of 120 years, the beech reached a diameter (d, at breast height) of 45 cm and the fir 52 cm. At the forest level, Hsp had a value of 1.63, Hdg of 3.17, and Hhg of 2.76. At the stand level, Hsp reached 1.54, while Hdg and Hhg reached 1.72. Mixed beech–coniferous stands had the greatest diversity. High values of 1.00 for Hsp were determined for 18% of the stands, for Hdg 38%, and for Hhg 35%. Conclusions: Stand structures are in a continuous state of change, so diversity indices can be used to monitor structural and species diversities and to evaluate the recreational potential of stands and forests. A compatibility between the aesthetic qualities of Romanian forests, which is a priority, and the other protection and production services they offer can be achieved by leading the forest stands toward a selection system.

1. Introduction

In recent decades, there has been an increasing demand for ecotourism and outdoor recreation. Society is much more concerned about health, well-being, and recreational activities [1,2] as a result of the accentuated urbanization that has created a certain distance between man and nature. The forest has become an important element due to its social and ecological value. The recreation function is especially relevant in areas close to large cities [3,4,5]. It has been noted that the surface area of cities is directly correlated to the need for recreation in their neighboring forests [5]. Therefore, the recreational landscape depends mainly on forest management, which aims to maintain and improve the quality of recreational resources [6]. However, recreational activities can often have negative effects. For example, trails can lead to the fragmentation of habitats, and the presence of humans can bring important changes in the behavior, and even the physiology, of wild animals [2]; all these, including land use change, are also related to natural hazards [7]. However, frequent visits to green areas would inspire the perception of the natural environment, being an important driver in improving the ecological paradigm [8].
The importance of the recreation function brings many concerns in the management of forests because more and more emphasis is placed on the integration of society’s preferences in making management decisions [3]. Numerous studies have presented the role of the recreation function in forest management, and also the public’s preferences on the structure of stands [3,4,5,9,10,11,12]. The management can improve the quality of resources and recreational opportunities for users to achieve the desired recreation experiences [6]. It needs to consider the compromise between tourism–recreation function and other ecosystem services [13]. The very wide range of land and forest ecosystems, however, provide multiple ecosystem services (ES) that do not have proper valuation indicators and, therefore, have limited use for planning and management [14]. Thus, planning decisions regarding ES could be more effective for improving overall resource quality [15].
The public’s preferences are often based on cultural and regional differences; for example, in Central Europe, high-density mixed stands are preferred, whereas in Scandinavia, less-dense mixed forests are preferred [16]. The recreation location index, by comparing regional rates to a standardized reference region, also provides information for future planning decisions [17]. In general, mixed stands are preferred by the public, compared to monocultures [9,11,18,19,20]. However, monocultures are preferred when they are old. Visual variation is one of the factors followed by the public, and it depends on the size of the tree, the crown density of the stand, the predominant species, or the presence of undergrowth [11]. Increasing recognition of the important role that forests play in providing goods and services leads, through management practices, to the diversification of stand structure and development of mixed structures [21,22,23]. Stands with irregular structures, an uneven spatial distribution of the trees, and with a broad range of diameter categories are often preferred by the public [3]. Mature stands are preferred over young ones because young stands are associated with a higher density, which interferes with visibility and gives the impression of being unsafe to the public. In general, the public prefers semi-open forests, with large trees and little undergrowth [9,10,24]. Stands that have a diversified structure, in terms of tree height, are also preferred over even-aged ones with similar heights.
The species is also a factor that influences public preferences. Several studies have shown that mixed deciduous stands are more appreciated, especially by young people [3], as opposed to conifers [10]. Mixed multi-layered broadleaves and coniferous forests also have a higher dust retention effect compared to single-layered forests [25]. Evergreen mixtures in the winter season increase forest effectiveness and reduce the concentration of particulate matter [26]. Trails that contain a greater diversity of stands are more appreciated than those with a low visual diversity, which are considered monotonous [11], with the aesthetic quality of the forest being the one visually assessed by the public [27]. The public also prefers spaces as little affected by humans as possible, with a high degree of naturalness and a natural structure, over those affected by humans [12]. Thus, management plans must also be developed for the sustainability of endemic species affected by climate variability [28].
On the other hand, dead wood is one of the elements that is less appreciated by the public, even if it is very important in biodiversity conservation [9,24]. Thus, a compromise is necessary to balance the aesthetic value of forests and the conservation of forest biodiversity. Additionally, dense undergrowth or other elements associated with a high conservation value are less appreciated [24]. In Europe, the development phase of stands provides the greatest contribution to their ultimate recreational value [10].
Another factor that is taken into account by the public is the accessibility of the forest, with those that are close to pathways being preferred, but with a reduced number of tourists so as to enhance the feeling of a natural forest [3]. The necessary money or funding of an individual to cover recreation expenses, as well as the distance the forest is located [29] or the day of the week and weather conditions [30], also affects recreation participation and causes variations in recreation constraints [1].
The Carpathian Mountains have a high potential for recreation, thanks to the old-growth forests, the flora, and also the high density of cultural heritage [31]. An essential characteristic of the management, in Romania, of the forests intensely requested by tourists is the preservation of their natural, unaltered framework, produced through an uneven, or relatively uneven, structure selection system [32].
In Romania, the need for recreation has increased in recent years, and tourism has become an important element in the country’s economy. This is why society’s preferences concerning the structure and management of forests should represent an increasing concern, especially in the case of forests with high recreational value. Tourism can have a significant economic value, bearing in mind that a considerable increase in the number of tourists can compensate for losses caused by a reduction in, or even the absence of, silvicultural interventions. Thus, a good way forward would be the integration of nature-based tourism with traditional forestry, especially in areas where there is a high percentage of forests with recreational functions [33].
If the public expresses its preferences for forests through their structural parameters, then these parameters can be expressed as indices for evaluating and monitoring the recreational potential of forests. The considered objective of this study was to determine the values of the main indicators that characterize the structure and species diversity of mountain recreational forests, which are relevant for forest management in terms of fulfilling multiple functions.

2. Materials and Methods
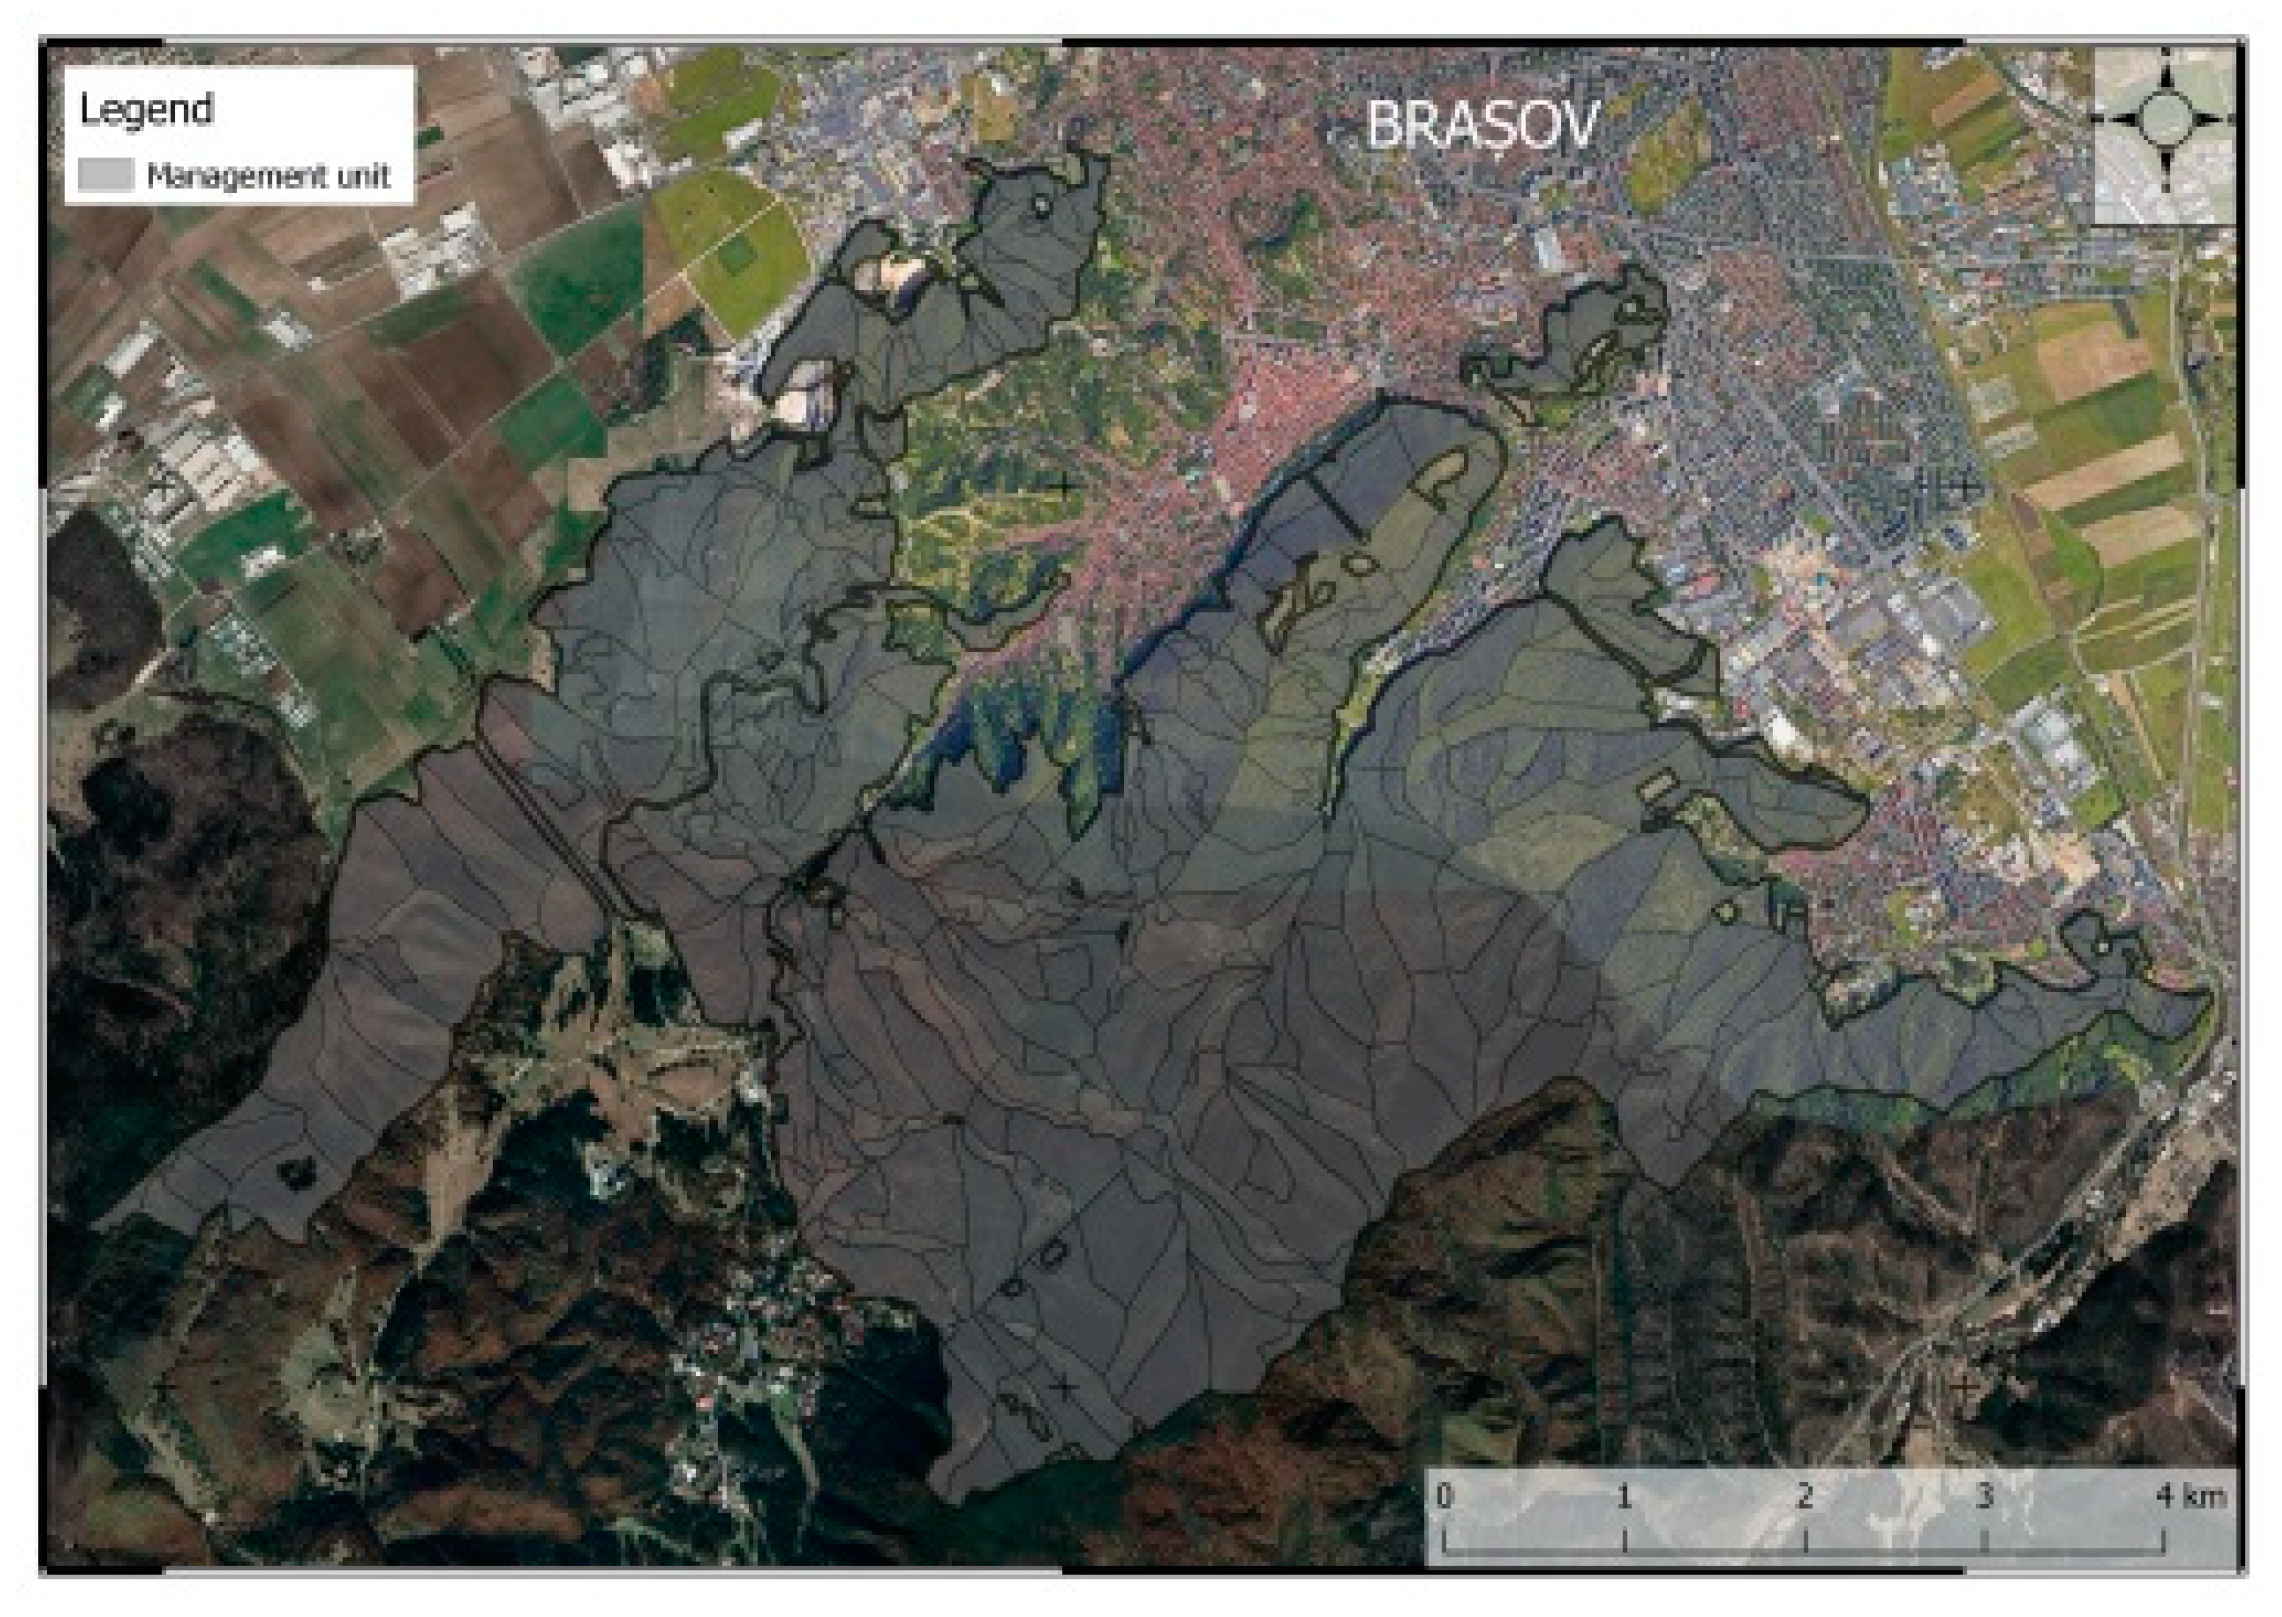
2.1. Study Area

The studied forest, with an area of 2923.6 ha, was located in the Postăvarul Massif of the Romanian Carpathians, in the proximity of Brașov city (Figure 1). The forest covered altitudes of between 700 and 1400 m. The most frequently encountered relief was slope, with inclinations of between 20 and 35º and varied aspects. The average multi-annual temperature of the studied area was between 5 and 7.8 °C, with precipitation between 750 and 950 mm. The forest has been integrated into a management unit and was characterized by a management plan that has been developed since 1890.

2.2. Field Measurements

Data on the structure of the stands were recorded through field measurements. The measurements were carried out in the spring of 2022 and represent a sequel to the measurements carried out in this forest in 2020 [34]. Management plan maps were used to identify the forest boundaries. The terrain was traversed via perpendicular transects, following the lines of valleys and ridges, in order to describe as many stands as possible. The transects were not materialized on the ground, but the coordinates of the points in the stands where the measurements were taken were recorded. To obtain descriptions, a Bitterlich survey was placed in each of 466 stands. In the stands, the surveys were placed in representative areas, after each stand had been fully traversed so as to obtain an overview of its structure [35]. In all, 7129 trees were counted. We worked with multiplication factors 1 and 2, depending on the development stage of the stand, the diameter of the trees, and the crown density of the stand. In multi-aged stands, the measurements were carried out over several generations. In one generation, we included trees of the same age and with differences of, at most, 25 years. The age of each generation was determined by increment cores extracted from the average trees. For even-aged stands, the ages were taken from the management plan. For example, for an even-aged stand made up of three species, each of which being 80 years old, three species were considered, representing three variables that we named generations. If 120-year-old trees were identified for a species, they formed a fourth generation. Thus, for that stand, three species and four generations were considered. In the study, these representative trees were labeled “sp.” or “age-sp.”. To quantify the effect of age on the structure, only the age of the variables was analyzed. For the example given above, only two age classes were considered—80 and 120 years. In the study, the age class was denoted by “age”. For each species or generation, the mean tree (considering the basal area) was identified and its diameter determined (i.e., the quadratic mean diameter, denoted by dg), based on the tree diameters measured in the Bitterlich circle. The mean height (i.e., the height corresponding to the diameter dg), denoted by hg, was also determined. For the measurements, we used a Criterion RD 1000 device and a Vertex laser.
To characterize the structure of the stands and represent the 3D profiles, we fully inventoried stands of sessile oak–beech, beech, and mixed beech–fir formations over 4 ha. For all trees with diameters greater than 1 cm, the diameters and heights were measured and their coordinates determined [34].
We took information about the existing forest types in the area and the target compositions from inventories carried out in 2020 [34]. The forest types and target compositions we identified in the area were:
  • Mixed spruce–fir forest with herbaceous mull plants: 40%–50% Pa, 30%–40% Aa, 10%–20% Fs, App, and Ap;
  • Fir forest with herbaceous mull plants: 70%–80% Aa, 10%–20% Fs, 10% App and Ap;
  • Mixed beech–fir stands: 50%–60% Aa, 30%–40% Fs, 10% App, Ap, and Fe;
  • Mixed beech–spruce–fir forest: 30%–40% Pa, 30%–40% Aa, 30% Fs and App; and
  • Beech forest with herbaceous mull plants: 70%–80% Fs, 10%–20% Aa, 10% App, Ap, Fe and Pra
  • (AaAbies alba Mill.; ApAcer platanoides L.; AppAcer pseudoplatanus L.; FeFraxinus excelsior L.; FsFagus sylvatica L.; PaPicea abies Karst.; PraPrunus avium L.)

2.3. Data Analysis

The basal areas determined in the Bitterlich surveys were used to establish the proportion of species (“sp.”), generations (“age-sp.”), age classes (“age”), mean-diameter classes, dg (i.e., classes of mean diameters with the same dg values), and mean-height classes, hg (i.e., average-height classes with the same hg values). The proportions were used to determine the Shannon index (H) through the known relationship H = −∑ (pi*ln [pi]), where p is the proportion of species i, in terms of the variables [36] at the stand level and the whole management unit level (i.e., the forest). This calculation resulted in H values for the: diversity of species (Hsp.); diversity of generations and species (Hage-sp.); diversity of age classes (Hage); diversity of mean diameters at the generation and species level (Hdg); and diversity of mean heights at the generation and species level (Hhg). The evenness (E = H/ln S, where S is the number of species, in terms of the frequency of the variables) was also determined for each of the five variables (i.e., age-sp., sp., age, dg and hg). For fir, 26 generations (i.e., age) were determined, whereas for alder, there were only two. At the forest level, 257 generations (i.e., age-sp.), 25 species (i.e., sp.), 35 age classes (i.e., age), 41 diameter classes (i.e., dg), and 34 height classes (i.e., hg) were determined. These values were considered frequencies for determining the H index. Using the values of the H and E indices, maps were generated that can be used in management decision making.

3. Results

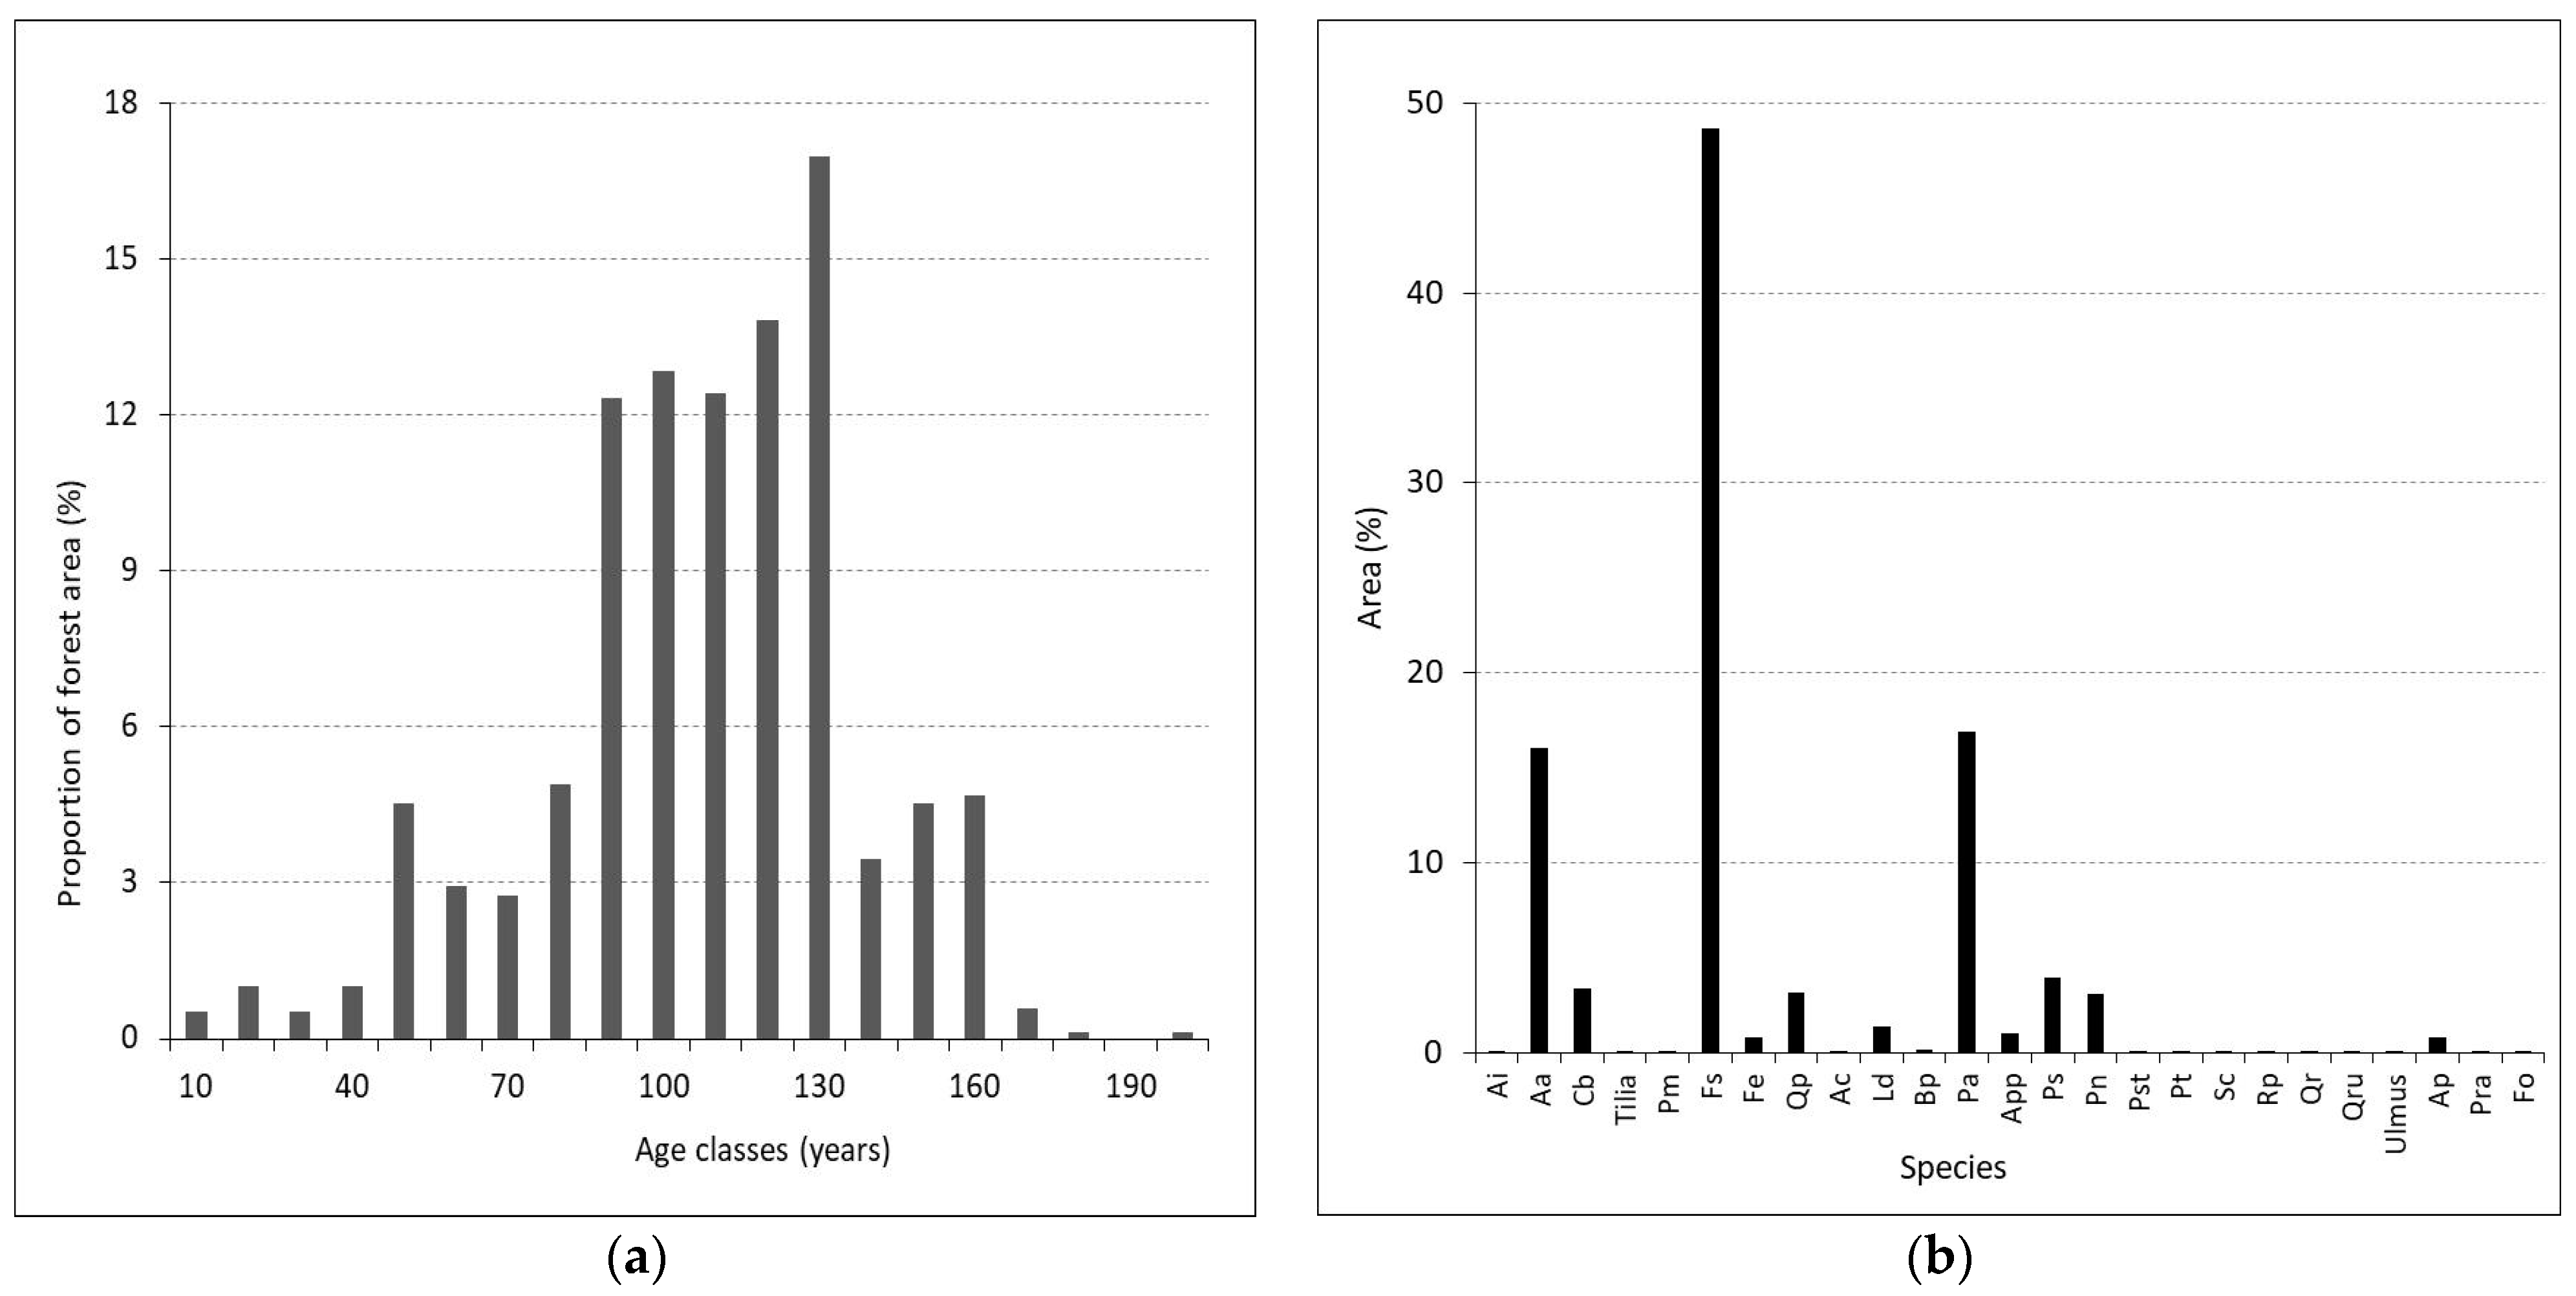
3.1. Stand Structure and Forest Composition

For the investigated forest, the recreation function was the main priority. The capacity of the forest to provide favorable conditions for recreational activities (art, relaxation, tourism, fun, and rest) can be examined through the prism of its structural characteristics. These characteristics are analyzed below.
The age of the stand was a specific characteristic of the silvicultural system age class forest. In the investigated forest, young and middle-aged stands occupied 18% of the forest area, while another 11% was occupied by stands between 85 and 100 years old. The aesthetic value of a forest increases with stand age, and stands over 100 years old had a fairly large share of the forest area at 71% (Figure 2a). Advanced age was also associated with stand density, which frequently presented values of between 0.6 and 0.8. At these densities, the trees have rich crowns, but these are transparent enough to allow the sun to create light and shadow inside the stand, which enhances the aesthetic effect. However, aesthetic properties can also be found in young stands where there is systematic intervention. Such interventions are essential for ensuring forest stability and for leading stands toward a target composition.
The composition of the studied forest was 59% deciduous and 41% conifer. Due to the site conditions, the management unit allowed for the development of a large number of species. The natural spread of species was determined by the site conditions. However, the largest share was held by beech (48%), followed by fir (16%) and spruce (16%). Pine had an 8% share and larch 1% (Figure 2b).
The pines, larch, red oak, black locust, Douglas fir, and a percentage of the spruce were planted (accounting for 12% of the area of the management unit), with the other species coming from natural regeneration. The pines and larches were introduced 120 years ago, on rocky, calcareous land with superficial soil. They were rarely mixed with other species, and then only in stands close to the city of Braşov, being introduced for their aesthetic effect. Beech forms cheerful stands, thanks to the lighter foliage, the greater brightness, and the varied shapes of the trees. Together with fir, beech forms pleasant stands for visitors, due to the rich variation in shapes and colors. Variations in the proportions of the species in the mixture, and the presence of disseminated resinous species in the pure stands of beech, maple, sycamore, and cherry, reduced the monotony of the stands.

3.1.1. Target Composition

The basic criterion for the selection and promotion of species is the forest site itself, with favorable site conditions dictating the species being introduced. In this sense, information is required on the health and vitality of the trees and seedlings. In the last decade, there have been reports on the drying of pine trees. This drying has also manifested in fir, in forest sites located on the upper parts of sunny slopes, as well as in spruce, at altitudes below 1000 m. This has led to silvicultural interventions that have reduced the proportions of these trees in the last decade. Forest types identified in the management unit content and the economic criterion recommend maintaining a high proportion of fir, on favorable sites, especially since it is already quite well represented in the seedling composition. Thus, for the future, at the management unit level, there will be a tendency toward a composition of 49% Fs; 33% Aa; 12% Pa, Ld, Pn, and Ps; 3% App, Ap, and Fe; 2% Qp; and 1% Ac, Cb, Pra, Fo, and other deciduous (Ulmus spp., Tilia spp.) (Tudoran et al., 2021). With respect to the forest site criterion and the natural regeneration of the stands, the conditions for maintaining the stability of the stands have been created.

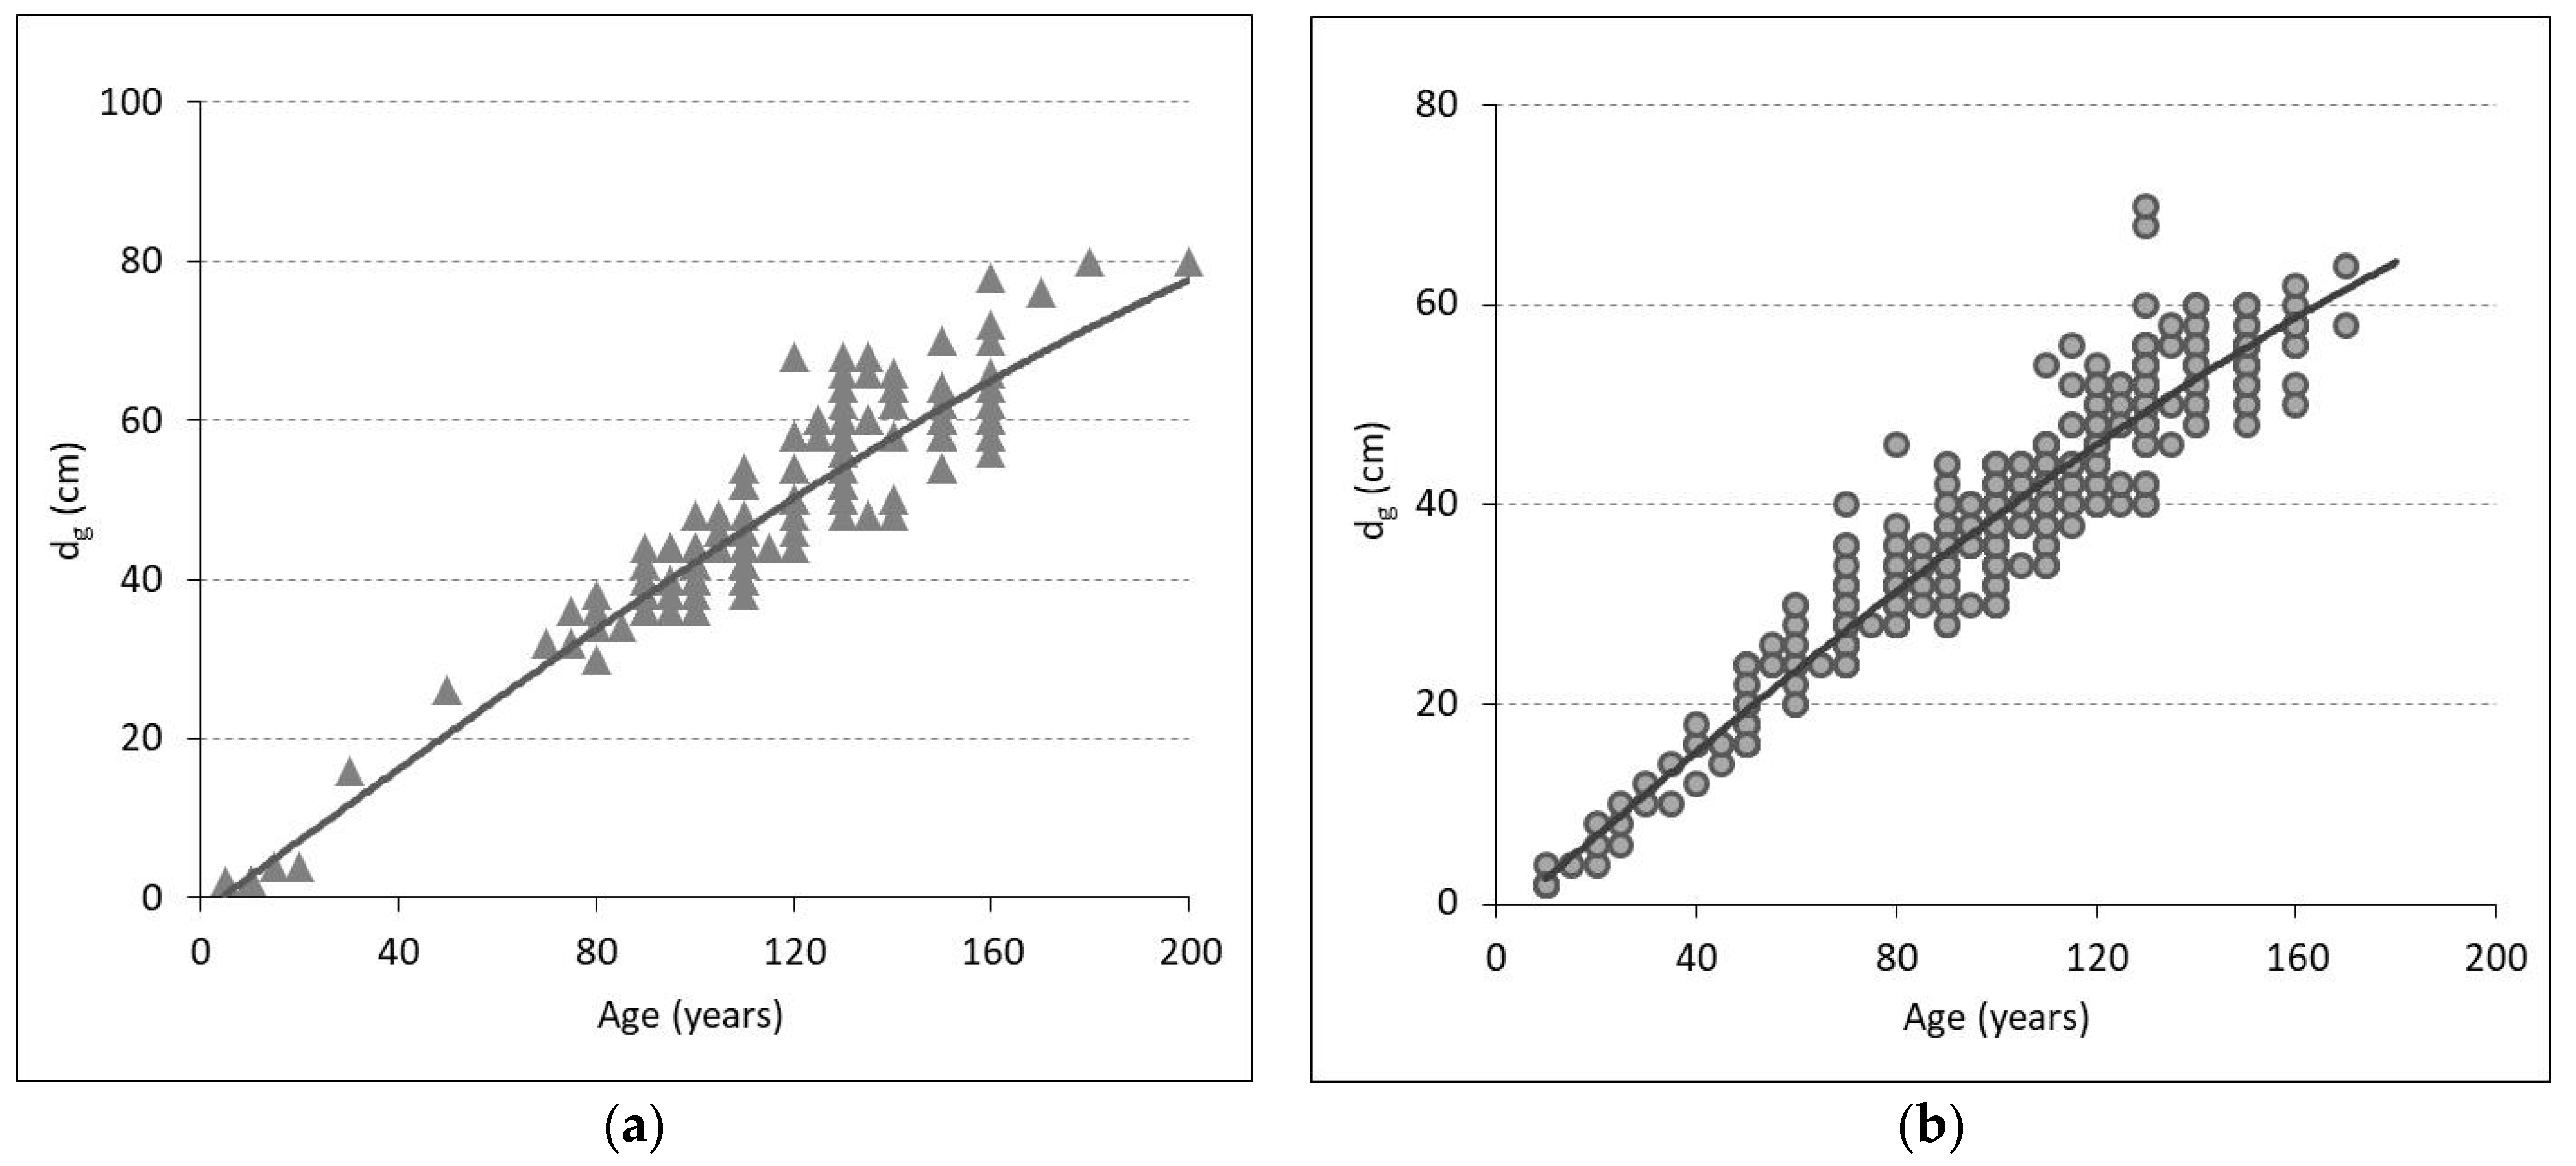
3.1.2. Tree Dimensions for Exploitability

In this forest, the production of wood mass must also be taken into account. According to the management plan, the cutting age has been set at 120 years in the silvicultural system age class forest for the beech, mixed fir–beech, and mixed beech–coniferous stands. The sessile oak stands also reach 140 years old. In forests with protective functions, such as these, these ages can be increased by up to 20 years. At the age of 120 years, on high-productivity sites, the beech reached a diameter of 45 cm in the stands and the fir a mean diameter of 52 cm (Figure 3).
Mean diameter when considering the basal area (i.e., dg) was estimated between 88 and 90% of the age variation, with the estimated parameters being significant (p < 0.05). The graphs show the mean diameters of fir and beech species, based on their age. The mean diameters provide information about the diameters of the trees that made up the highest percentage in the stands. These diameters are specific to stands located in high-productivity sites that have undergone interventions (the average density at the management unit level being 0.70). The diameter values were estimated with a mean absolute error of between 2.93 (beech) and 3.55 (fir) and a root mean square error of between 3.92 (beech) and 4.67 (fir), using a polynomial model of the form y = ax3 + bx2 + cx +d, with the parameters in Table 1.
In the model, x represents the species age. The model can be used for stands with age between 10 and 200 years (200 years for fir and 180 years for beech). The beech has a larger sample size compared to fir, which explains the reduced standard error values.
The young stands on which the model is based have a low proportion in the studied forest (Figure 2a). Thus, the statistical indicators lead to weaker arguments supporting the model. However, the model was considered as it fits the observed data and reflects the growth and development processes of the investigated stands. The dg values predicted by the model have a normal variation related to age and site conditions.

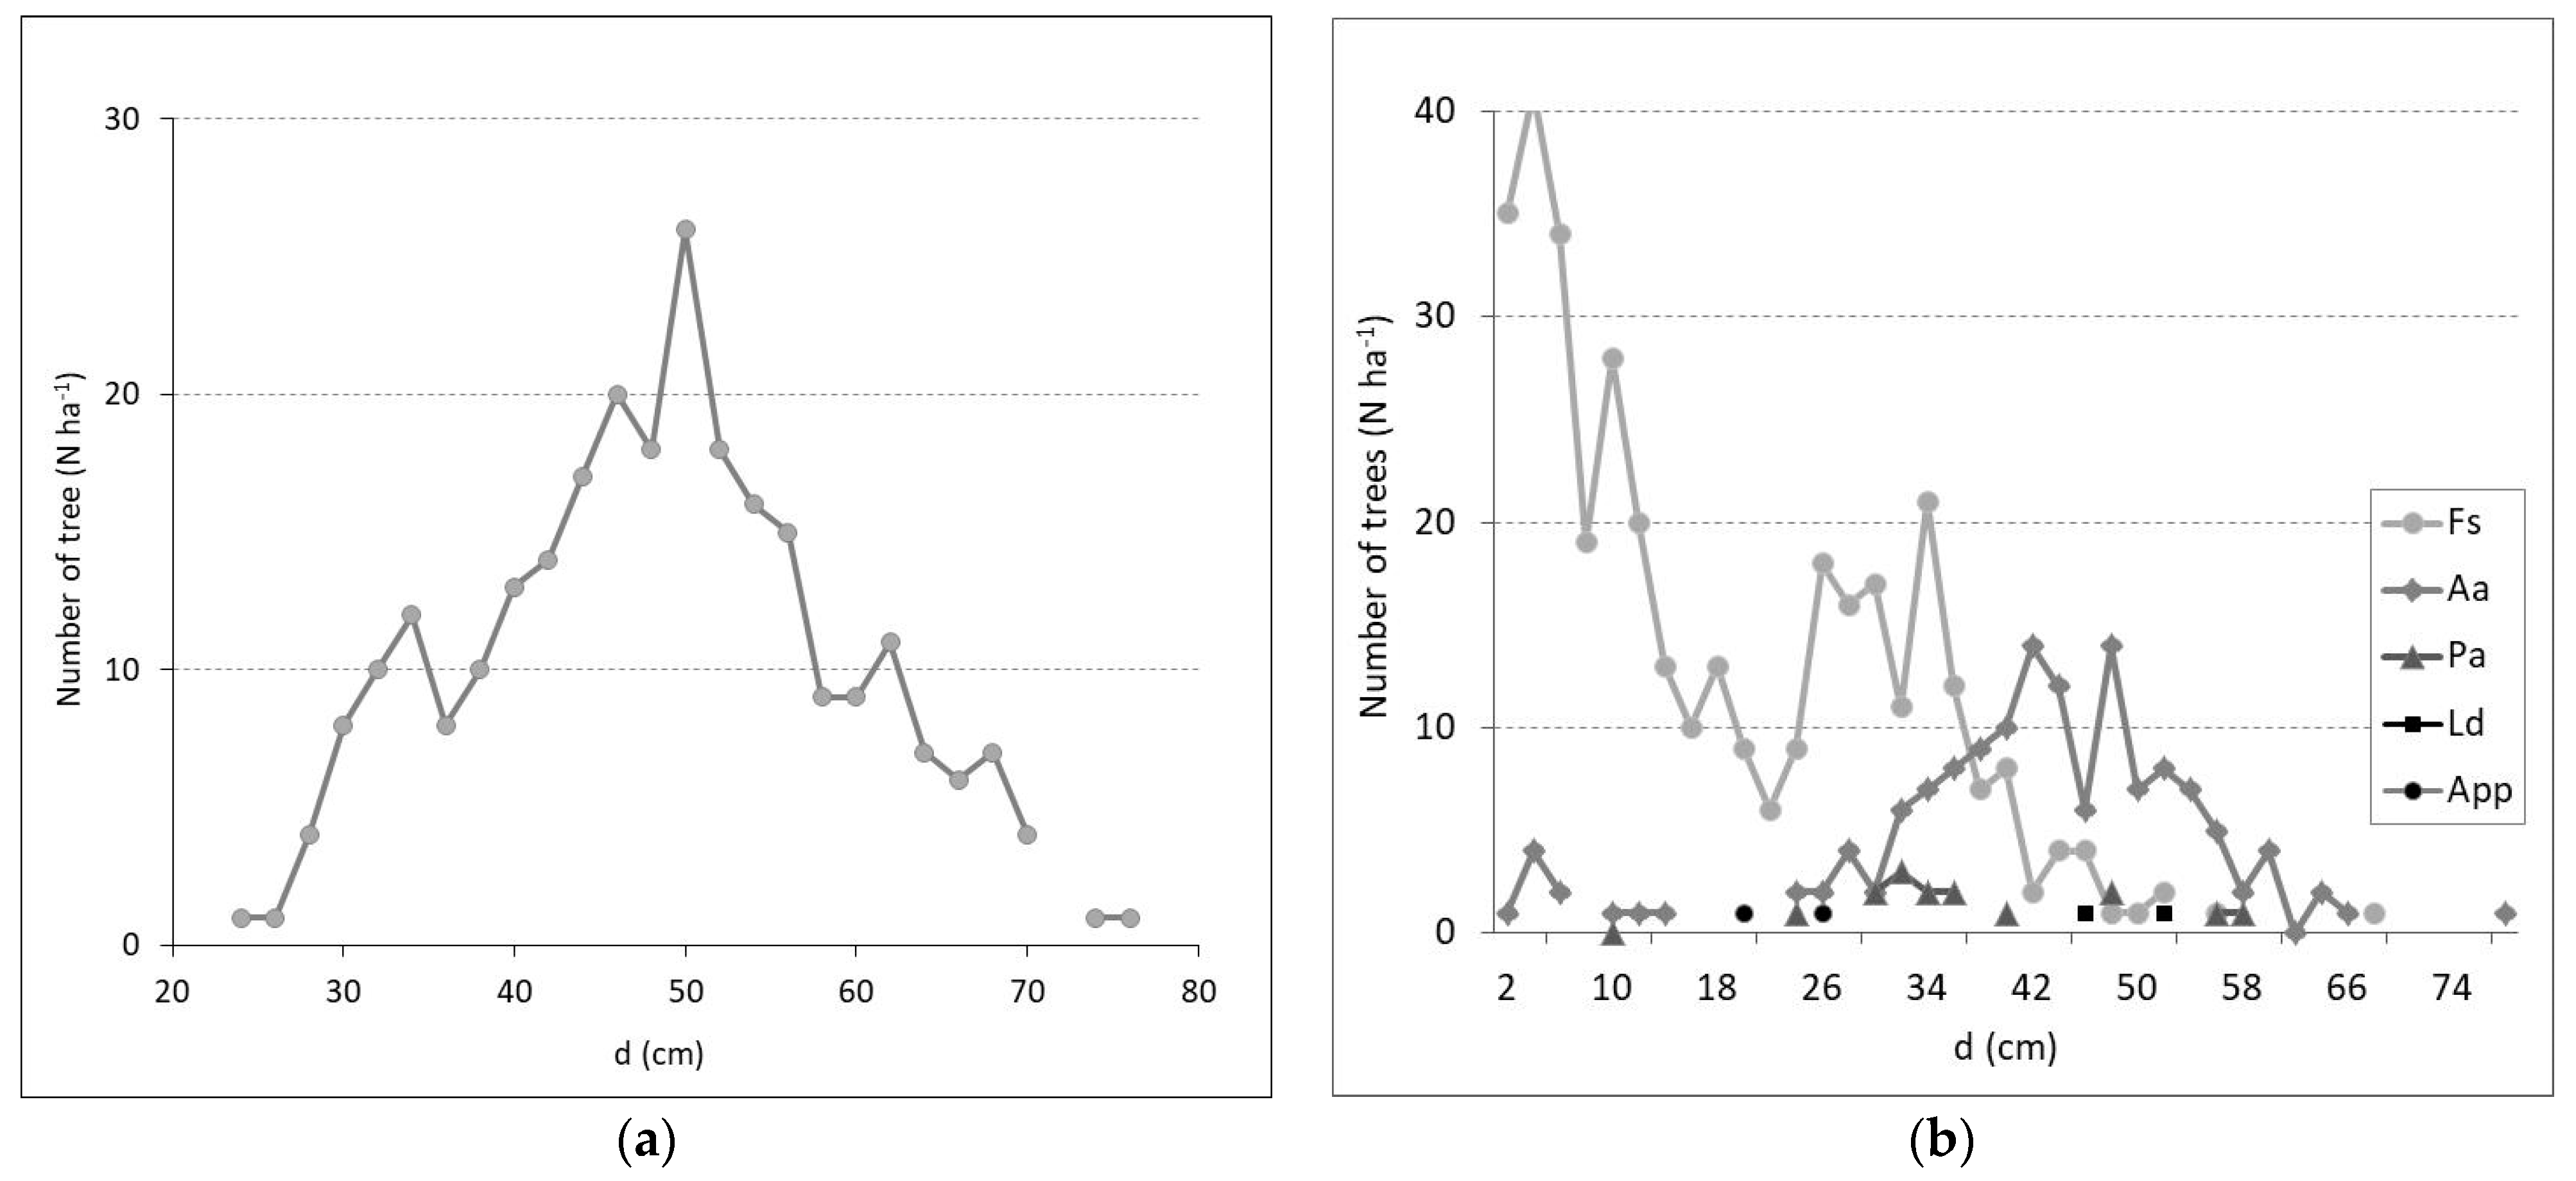
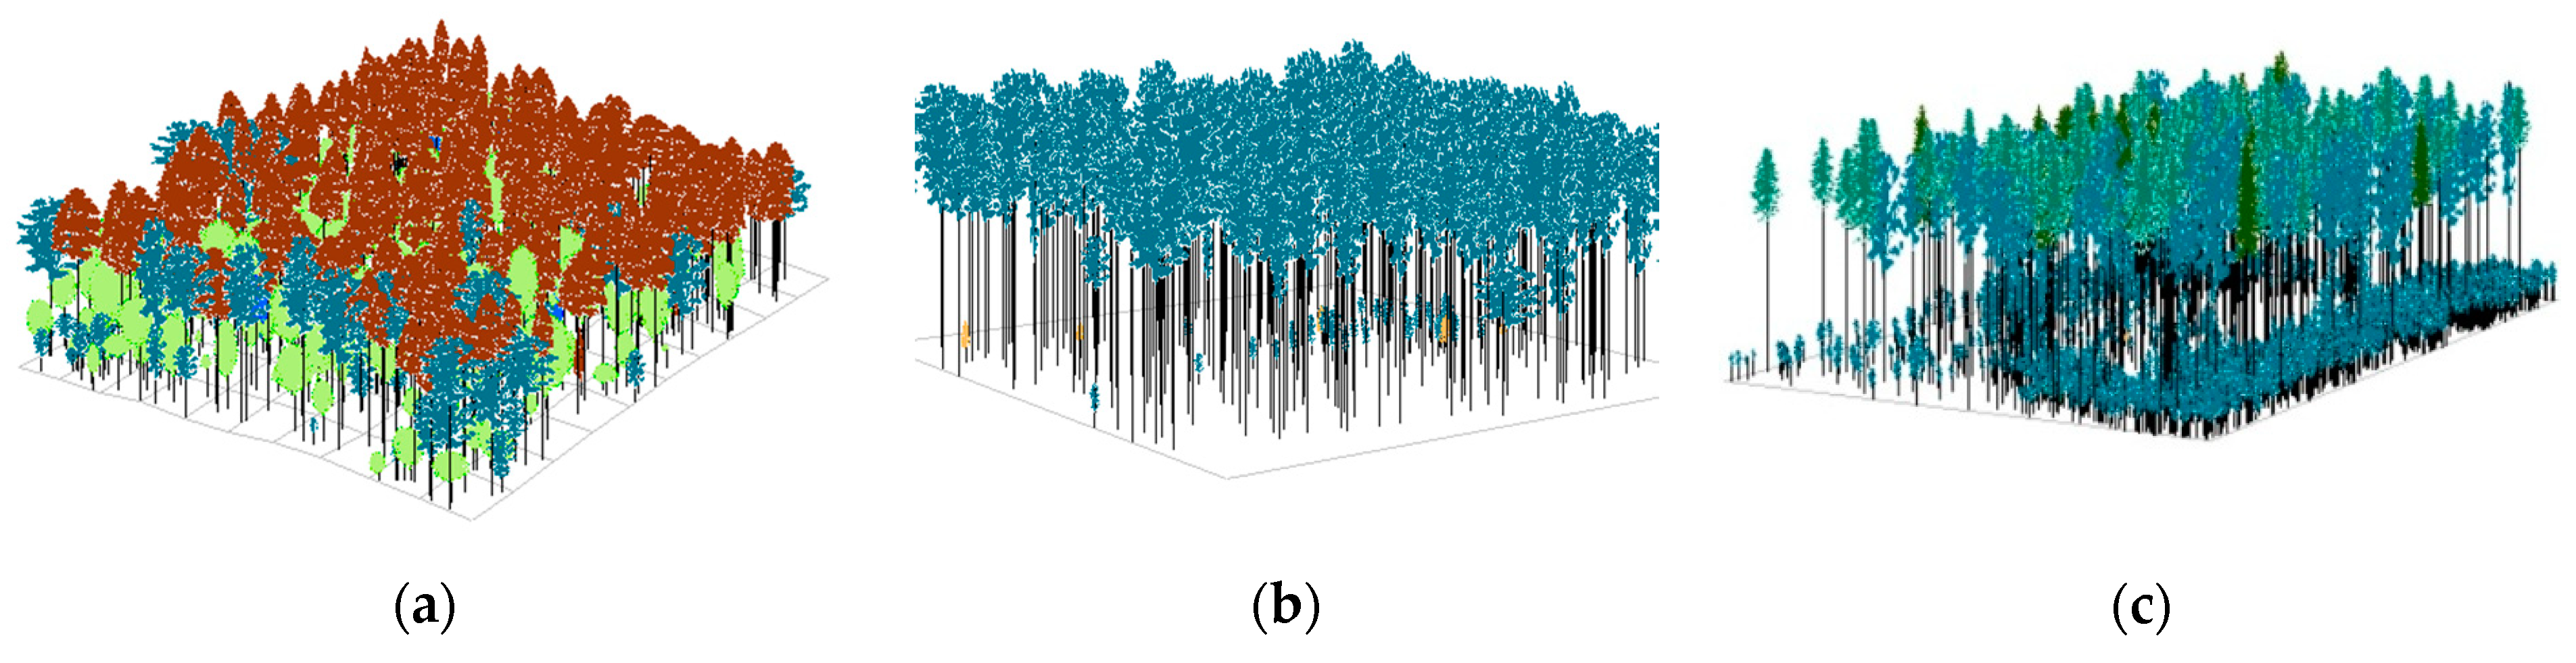
3.1.3. Vertical Stand and Forest Structures

Vertical stand and forest structures are essential components pursued by forest management. The stands in the studied management unit have evolved toward various structures as a result of the silvicultural interventions carried out, but also because of their development. The most common was the multi-aged structure, which presents a wide range of diameter variation (Figure 4), in which two or three generations of trees can be distinguished.
An analysis at the entire-forest level showed that the stands had crowns in the overstorey on 72% of the forest area (Table 2). This is a favorable structure that fully satisfies the aesthetic requirements. Beech was the most well-represented species at all storey levels, whereas fir, as shown by the structure of the age classes (Figure 2b), was present only in the upper storey. Currently, fir is only at the seedling and sapling stages in the mature and exploitable stands. The overstorey is of most interest from both the aesthetic and economic points of view.

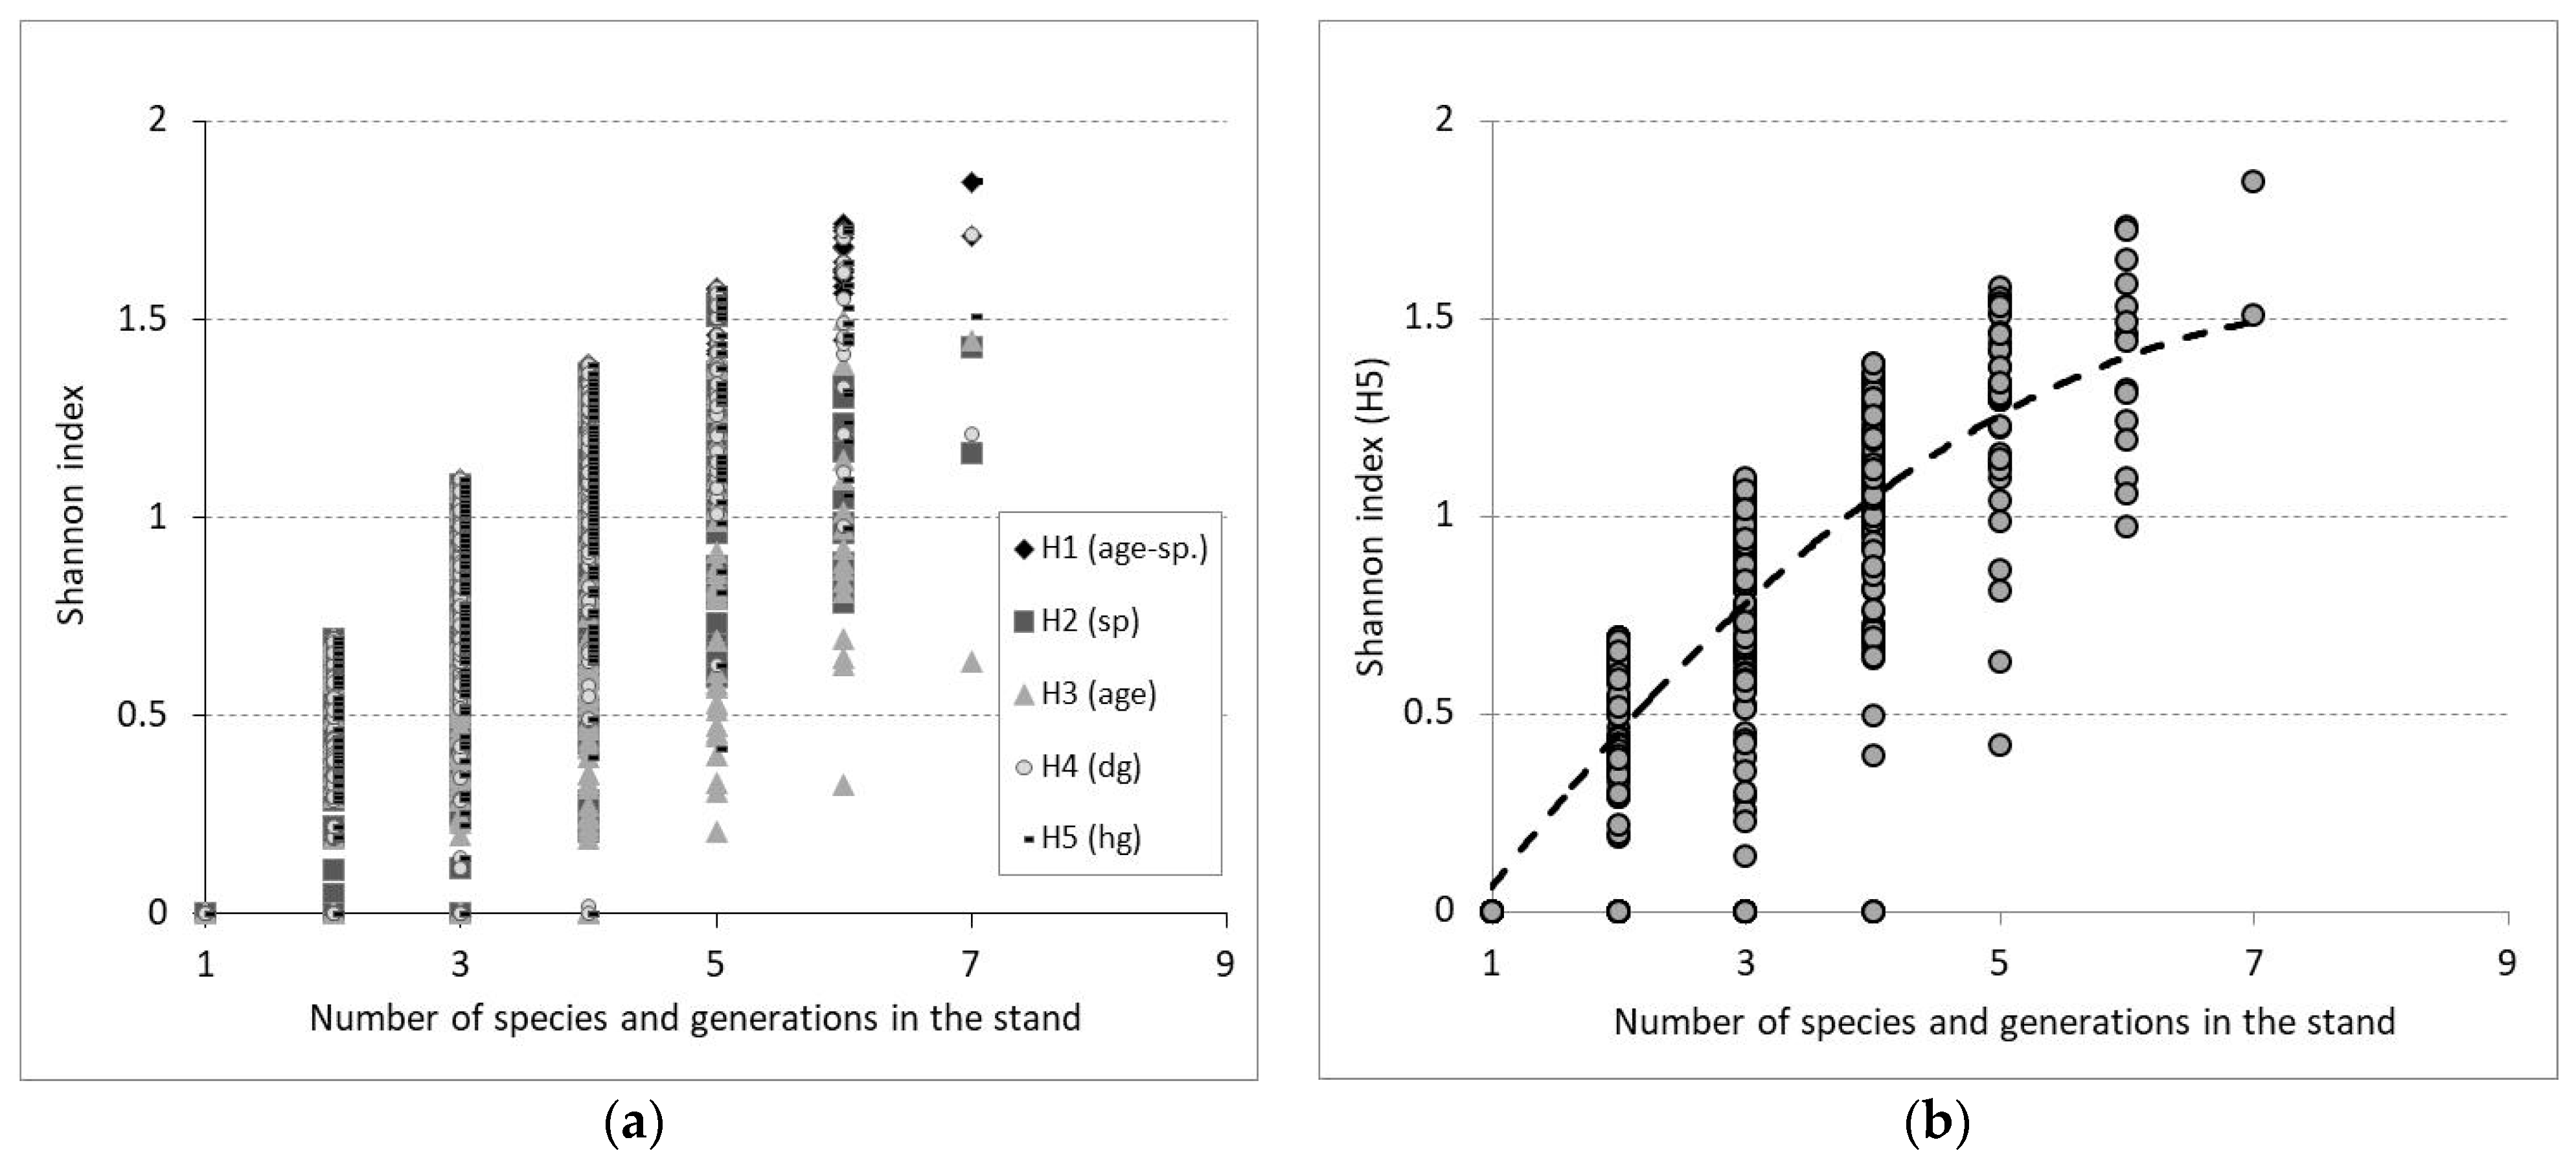
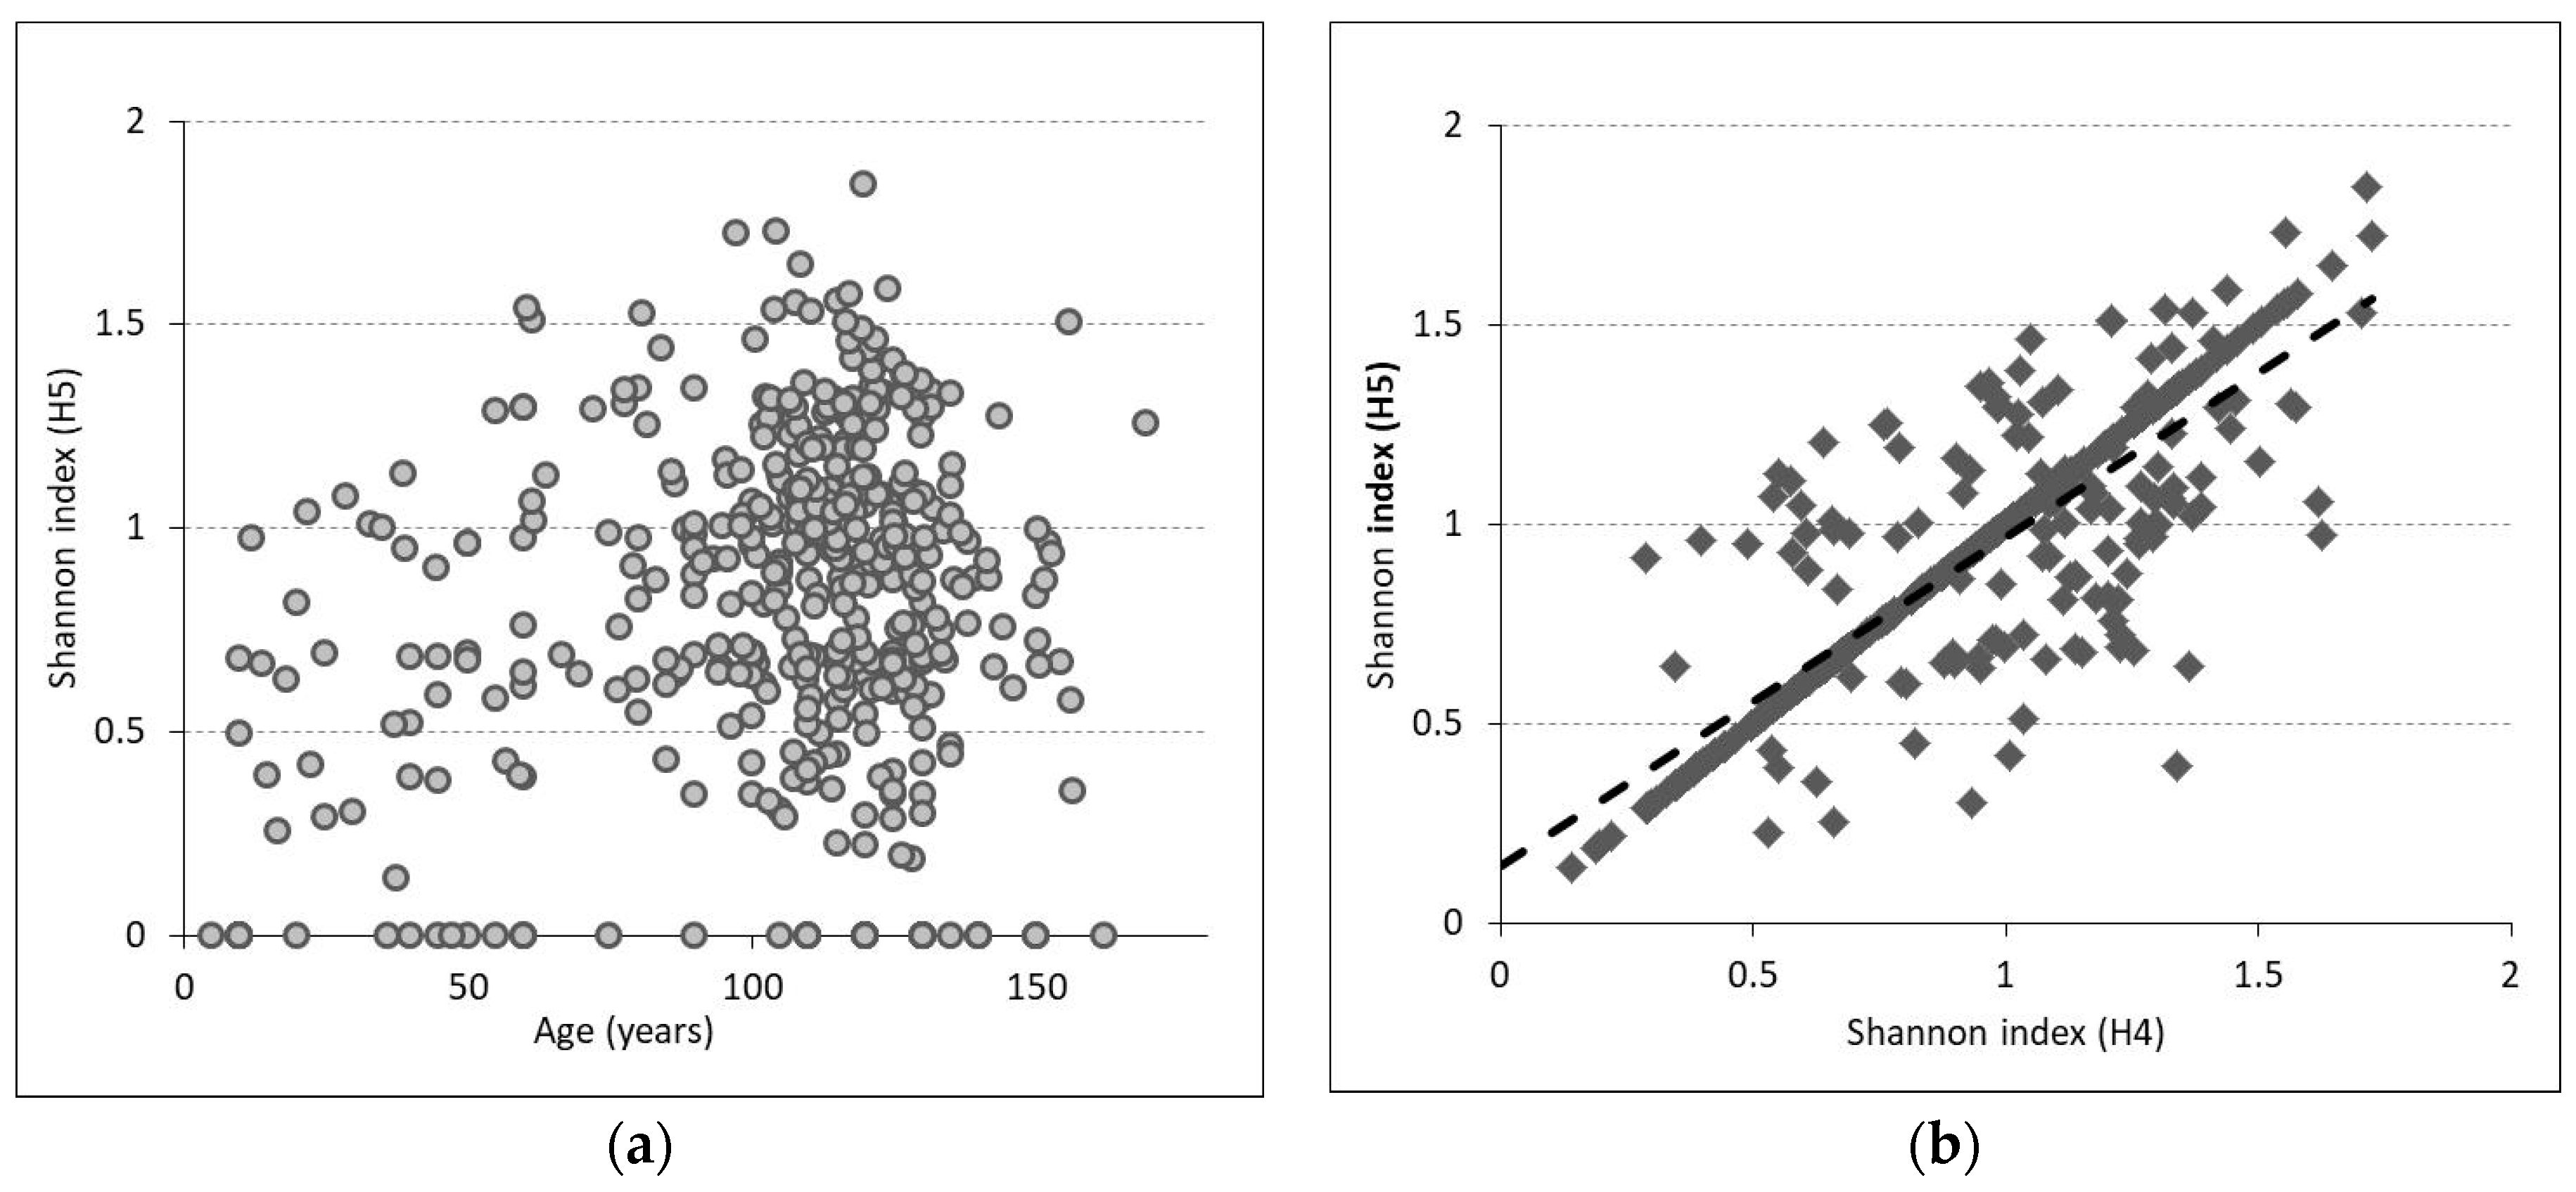
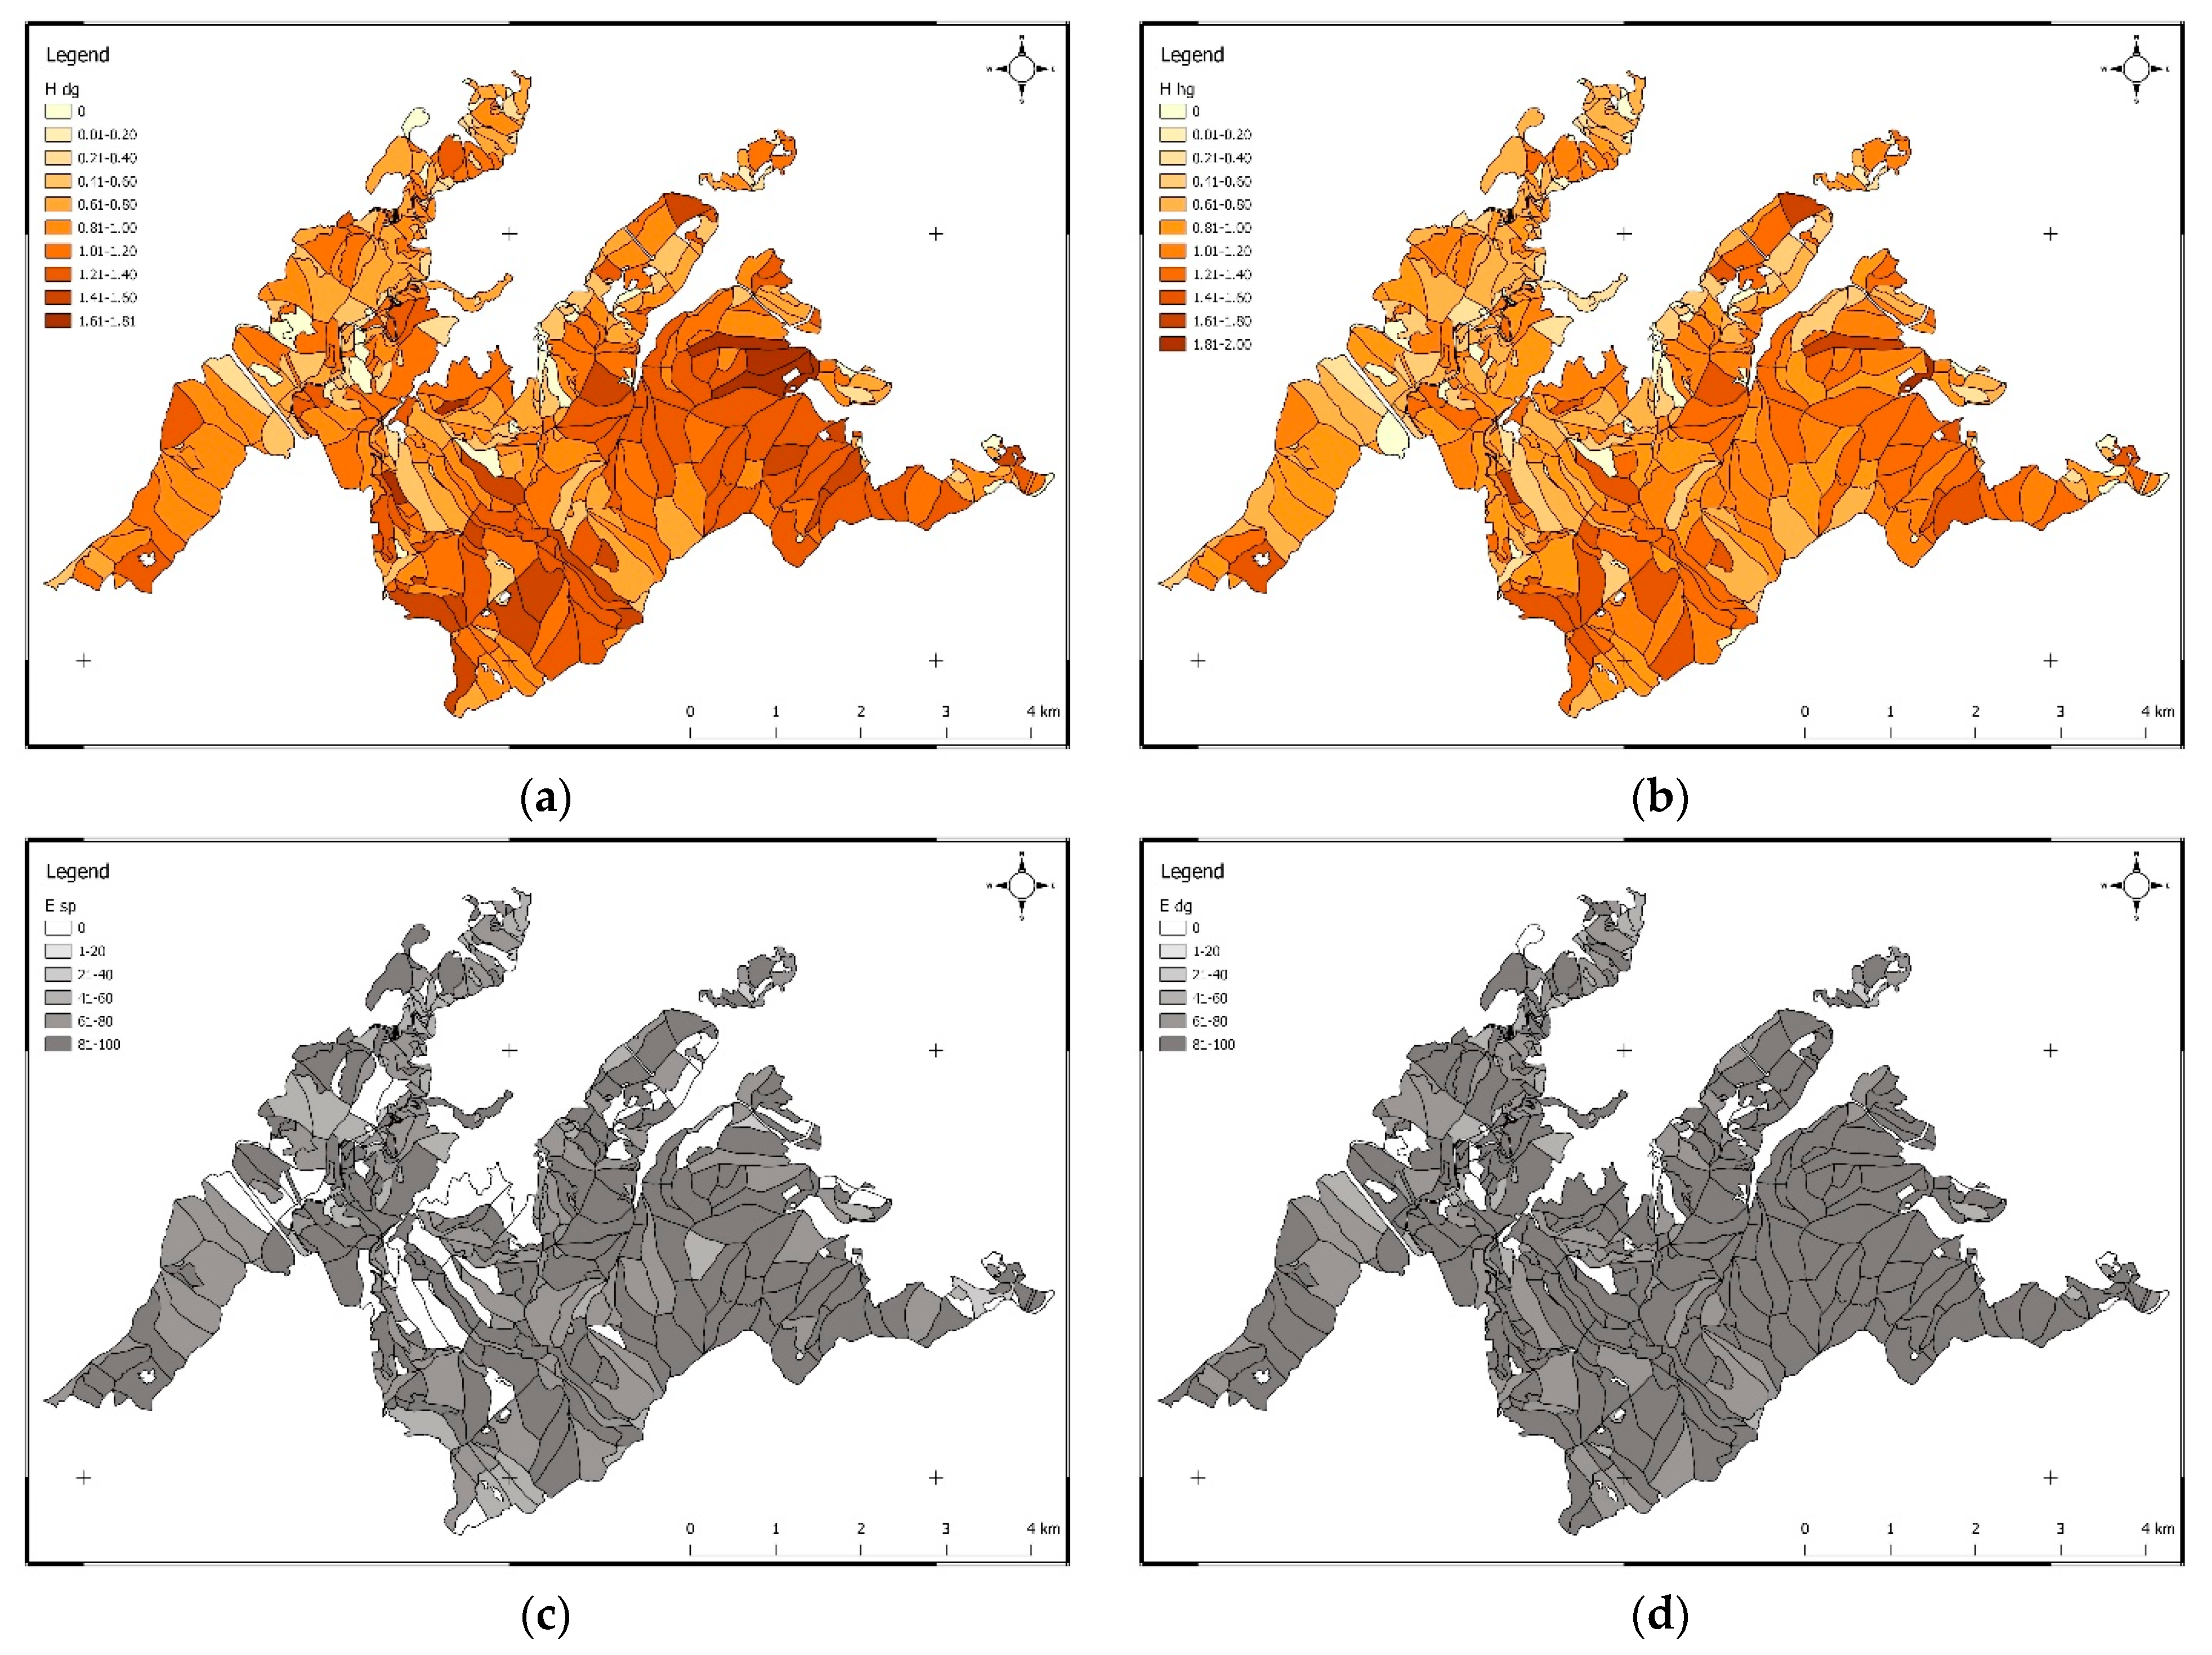
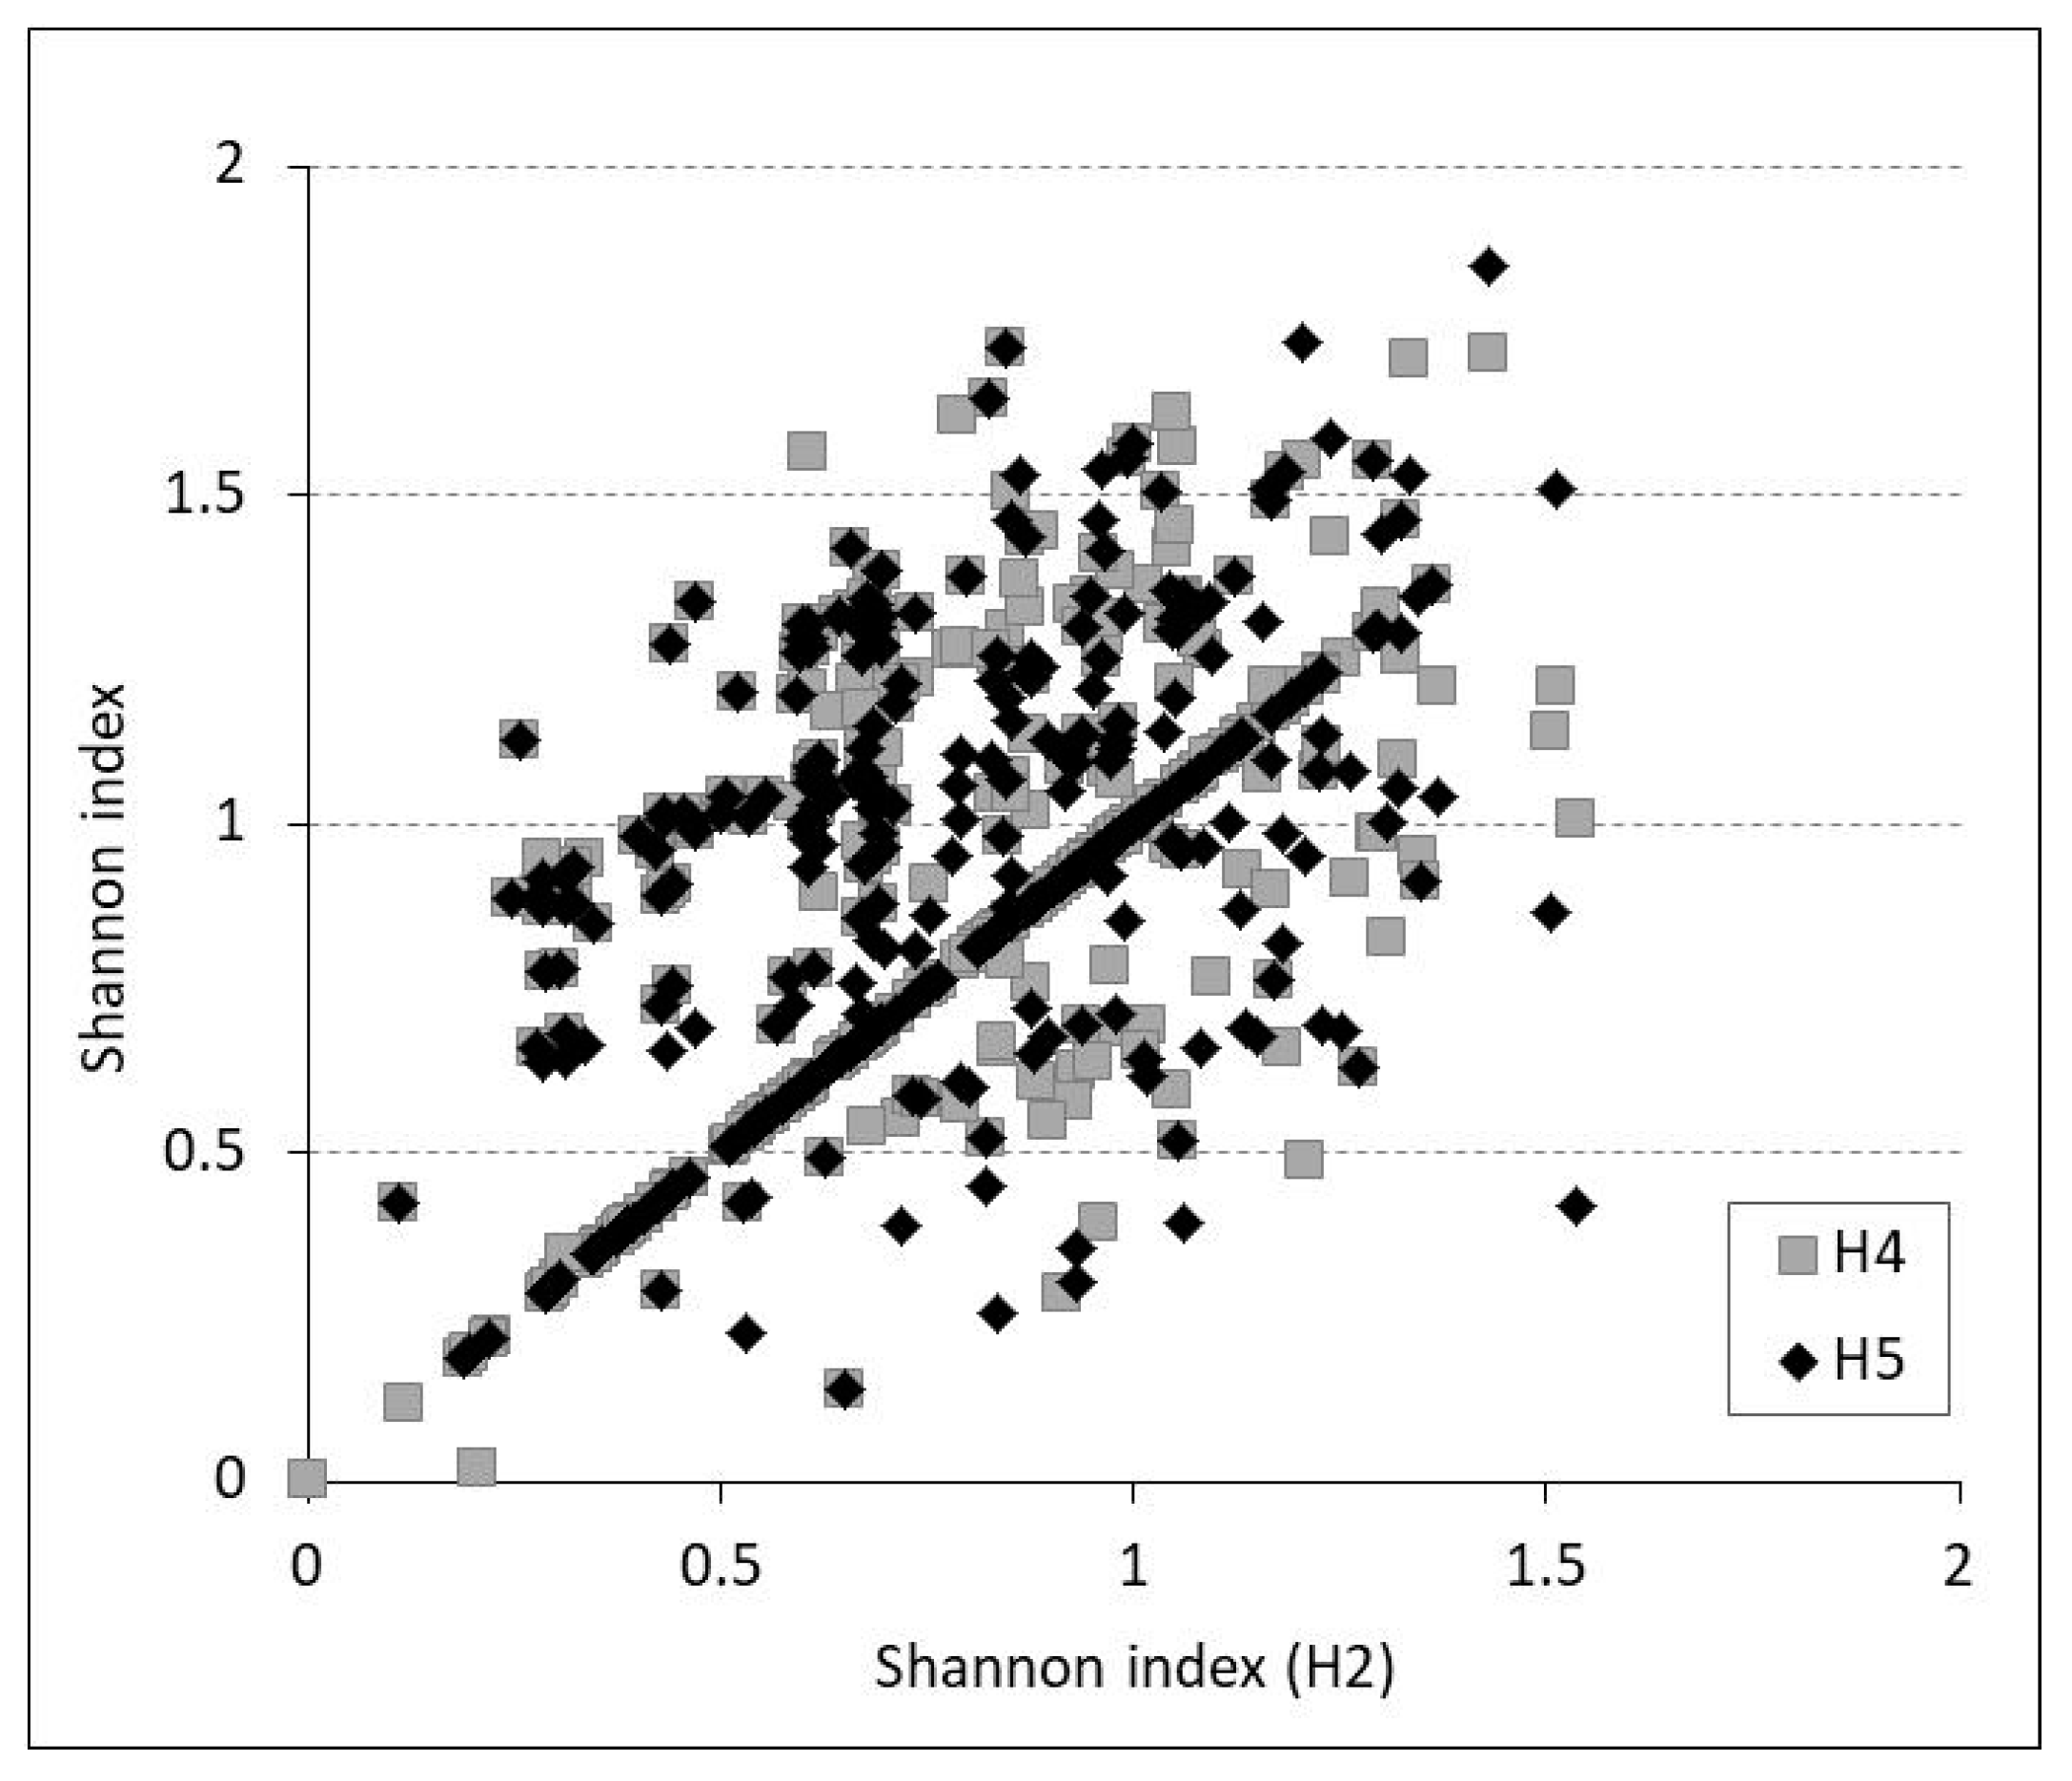
3.2. Structural and Species Diversity

Species diversity is preferred in stands with recreational functions, and this was determined at both the management unit and stand levels. For the management unit, the H-index values ranged between 1.63 (H2) and 4.19 (H1) (Table 3). The percentage of species was very unbalanced in the management unit, as indicated by the low E-index value (in the case of H2). In the stands, the highest H-index value (H1 = 1.85) came from an old stand composed of several generations (60–150 years). Species diversity was characterized by a maximum value of 1.54, which was determined from a 20-year-old stand, but one that was made up of five species. The diversity indices of the mean diameters and heights had values of 1.72 and were also found in species mixtures. At the level of the species and generations making up the stands, basal area had balanced proportions, as suggested by the high E-index values (95%).
At the crown level, the species diversity was greater in the understorey (Table 4). If the overstorey area was reduced, the biodiversity was also reduced, with the percentage of species in this storey being much different.
The value of the H indices, in the case of all variables (species, generation, age, dg and hg), depends on their frequency (Figure 5a) and proportion. It is expected that in different species, the values of those variables differ. However, for example, in the case of H5, even if there are several species in the stand, if they have the same mean height, the value of H5 is equal to 0. On the contrary, at different heights, the value of H5 increases (Figure 5b).
For each variable (tree generations and species, only generation or species, dg, and hg), the proportion of the basal area was used. In general, the frequency of the variables favorably influenced the H-index values; however, the closest relationship was determined when the species frequency, in terms of generations, was used (R2 = 69%–86%).
The characteristics of the stands (age, dg, and hg) had little influence on the H index (Figure 6a). However, an increase in diameter diversity (H4) may also cause an increase in height (H5) (Figure 6b). The same relationship was noted between H2 and H5.
The age, mean diameter, and mean height of the stands did not have a significant influence on the H-index values by diameter (H4) or height (H5). However, 61% (273) of the stands had the same H-index values, indicating the diversity in diameter (H4) and height (H5). Thus, 70% of the H4 variation was reproduced by the relationship expressed in (b).
At the stand level, the indices had different values. A value of 0 for all indices was obtained in the case of pure and even-aged stands, with their values increasing as the structure became more complicated, horizontally and vertically, and the proportion of variables became more balanced. For example, in the sessile oak–beech stands (Figure 7a), although made up of five species, the percentage of sessile oak was 76%, which caused a reduction in H2, with beech stands (Figure 7b) showing H2 = 0. In the mixed beech–fir stands (Figure 7c), the mean height for each species and generation showed different values and, therefore, H5 had a higher value (1.06), and also a reduced value due to the much different proportions of species and generations.
Figure 7. Structure of (a) mixed sessile oak–beech stands, (b) beech stands, and (c) mixed beech–fir stands. See Table 5 for the characteristics used.
Forests 13 01369 g007
Table 5. Characteristics used in Figure 7.
Stand(a)(b)(c)
Basal area (m2 ha−1)34.652.036.0
Age limits (years)90–120110–15090–120
H index
H1 (E)0.77(48)0.67 (97)1.05 (76)
H2 (E)0.77 (48)0 (0)0.87 (79)
H3 (E)0.31 (45)0.31 (45)0.21 (31)
H4 (E)0.77 (48)0.67 (97)1.06 (76)
H5 (E)0.77 (48)0.67 (97)1.06 (76)
For the same stand, the H-index values differed in relation to the frequency of the variables and their proportion in the mixture. For the sessile oak–beech stands, the lowest H-index value was determined at the level of tree age, and the highest at the level of species, with sessile oak having a percentage of 74%. In the beech stands, being pure, the H-index value was 0, although the diversity H index was 0.67 in the structure of the stand because two generations of trees were present. In mixed beech–coniferous stands, the mixture of species was more balanced, with the value of the Shannon index reaching 1.06 (for diameter and height).

3.3. Management Decisions

In exploitable stands past the cutting age, the stand structure had closed vertically and the stand acquired more and more the character of an uneven-aged structure. These conditions were contributed to by the cuttings carried out to extract the dry coniferous trees, as well as gaps created by windfalls, after which an abundant youth of beech and fir became installed (Figure 4b). The management-planned volume established for harvesting from the stands was largely extracted by unplanned cuttings. Carrying out regeneration cuttings within the limits imposed in order to achieve a normal growing stock by age class is contradictory to the current state of the stands. Currently, at the management unit level, the stands that have reached cutting age occupy more than 50% of the forest area (most being beech and mixed beech–fir stands). These require interventions, although these stands have a special aesthetic value and should be maintained. Interventions have also been imposed by the presence of seedlings, which have developed large percentages of coverage in the stands. Thus, the regeneration cuttings of the group–shelterwood system, with a period of 40 years, carried out up to now, no longer conform to the characteristics of the current structures. Rational and sustainable management of the forest must satisfy both aesthetic demands and economic requirements. Thus, we consider that the current structures meet the conditions to be directed toward uneven-aged structures, which can satisfy both the requirements of visitors and of wood production. Of course, fellings would transform the character of the current structures toward the selection system. Additionally, not all stands lend themselves to the application of such cuttings. However, an alternation of structures, with different degrees of complexity (even- and uneven-aged), would be welcome and would satisfy the requirements of all categories of visitors. As one of the most intensively visited areas, transformation cuttings toward the selection system must be applied to those stands closest to the city of Brașov as a priority.
The H-index values provided information on the characteristics of the current structures of the stands. The most diversified structures were found in mixed beech–coniferous stands, which showed high index values. The H4 and H5 indices highlighted a high structural diversity of the stands at the tree diameter and height levels. Thematic maps were generated from these H-index values (Figure 8). Recreational activity areas, rest areas, and tourist routes in the forest can be located in relation to the H-index values and the visitors’ preferences. The studied forest offers structural conditions that satisfy the various preferences of its visitors. The ridge trails provide the possibility of observing a varied range of structures, since the ridges are the boundaries that separate the stands and the stands have different structures. At the same time, these routes offer viewpoints out over the city and the surrounding mountains. The slope routes can be extended in different areas so that they cross stands with different biodiversity indices. Such trails are especially preferred by visitors who are passionate about the intimate environment of the forest. Routes with high biodiversity indices, affected as little as possible by silvicultural interventions, reveal the natural beauty of the forest and are the most preferred by naturalists and artists.
Silvicultural interventions must not produce visible changes in the structures of the stands, but should contribute to variations in the shapes and sizes of the trees and to the spatial groupings of trees of different sizes in order to ensure broad variety in the stands.

4. Discussion

4.1. Structural Diversity

The age class structures of the studied stands are favorable from an aesthetic point of view, but from the point of view of wood production, they are not characteristic of a normal growing stock. The stands are rich in species, resulting from the evolution of the stands and the management method applied. The largest share is held by beech, and its proportion will remain high in the future. In the future composition of the forest, however, the aim is to reduce the proportion of pines and spruce [34], these being more sensitive to climate warming. Beech remains the most stable species, more resistant to climate change than spruce [37]. The natural forest type has guided Romanian management plans for decades, but in recreational forests, the aesthetic effect generated by mixtures of species that can thrive in this forest site, that are favorable for wood production and preferred by visitors, must be capitalized on. Special effects, by contrast, can be created by clumps of one species in stands of another species, such as pine or larch in beech stands. Spruce, with its high and regular crowns, contrasts well with the rich crowns and shapes of beech trees. Thus, the aesthetic properties of stands can be increased by the introduction of other species into pure stands, even if they are disseminated [38,39]. The mixing of species also leads to an increase in the stability of stands, and it is well known that mixing species under changing climatic conditions can lead to a distribution of risk and to the stabilization of growth [37].
The aesthetic value of stands can be increased through their management at advanced ages. A combination of social and economic interests requires the management of stands up to such ages, but without exceeding a rational limit. This limit is guided by whether the trees are maintaining their vitality and capacity for regeneration, and the wood assortment harvested through regeneration cuttings is retaining its quality. Under the conditions in the investigated forest, the high proportion of exploitable stands that should undergo regeneration cuttings could affect the forest’s ability to continuously provide ecosystem services. In a study carried out in northern Finland, in which the main trade-offs between tourism and forestry were analyzed, the percentage of old-growth stands was 11% of the total forest area and the average volume of old-growth stands was 76.9 m3 ha−1, with the age of these stands being 158 years [33]. In other studies, the optimal stand volume value for recreational activities is between 80 and 200 m3 ha−1 [40].
The H index is a measure of diversity and takes into account species richness and evenness of species distribution [36], so its value increases with the number of species [41]. The determination of the H index at the level of stand characteristics, as component elements of the forest, led to different diversity index values. It is worth noting the high H-index values determined at the management unit level for the mean diameter of the stands (H4 = 3.17), with this calculation being based on the species and generations that made up the stands. A diversity of diameters also determines a diversity of heights. However, H5 was lower, at 2.76, than H4. This is because, in mixtures, the crowns of different species of different generations occur in the same plane and do not contribute to an increase in H5. The species diversity was highlighted by an H-index value of 1.63, resulting from a weight of very different species in the forest structure.
At the stand level, the highest H-index value indicating species diversity (H2) was determined to be 1.54, with the diameter (H4) and height (H5) diversities reaching 1.72. Both H4 and H5 were favorably influenced by an increase in the number of species (Figure 9).
At the stand level, the diversity H index showed the proportion of participation of species in the different height categories (0–50, 50–80, and 80%–100%) of the stands varied. Thus, in mixed Norway spruce–European beech stands, a participation of 90% of the trees in the first layer led to a diversity index of 1.00, with a balanced participation of the trees at those levels producing an index of 1.65 [42].
Following the application of different types of thinnings, the H-index values regarding species diversity increased from 0.53 (before thinning) to 0.64 (after thinning), and from 0.50 to 0.61 in the case of selective thinnings [43]. Forest site conditions and, of course, the characteristics of the stands also contributed to the change in diversity [41].
Diversity increases with stand volume. The natural factors that determine or affect diversity are altitude, slope, latitude, site quality, forest formation, stand volume, and quadratic mean diameter at breast height [41]. Quadratic mean diameter has a positive relationship with species diversity for large trees (d > 12.7 cm). For these trees, an average Shannon index value of 1.26 was determined, while for those with diameters of between 2.5 and 12.7 cm, this value was 0.89 [41].

4.2. Management Planning of Recreational Forests

Recreational forests fulfil multiple functions and, as such, their management must be designed to achieve the established objectives, since the forests are located in the most varied site conditions and are made up of different forest formations. Management regulations must be adapted to meet the recreational requirements as a matter of priority, without, however, disturbing the provision of other ecosystem services. Further expansion of tourism in traditionally forested areas could also compensate for the restrictions imposed on these forests to conserve recreation resources [33]. Therefore, along with the biodiversity of forests that fulfil production functions, landscape level should be of equal research interest [44]. The management of recreational forests also differs in relation to the specific function intensity of different recreational areas within the forest and the stand’s conditions. When planning management measures, at stand and forest level, the following relationship should be considered: management goals–assigned functions–structure–management measures. This process is repeated every 10 years, when the management adjust its decisions to the new requirements and challenges.
A systematic management approach [45] involves creating recreation areas of interest to different categories of visitors. In areas where recreation has a higher priority, there are a number of other developments within the forest that alternate with the forest landscape, frequented by tourists. Overall, these areas differ from typical forest biocenoses. Management measures should particularly promote the aesthetic qualities of trees and species diversity. In the other recreational areas, alongside the aesthetic principle, importance is also attached to the other principles of forest management which lead to the preservation of the natural features of the forest in order to ensure multiple requirements. The measures promoted through the forests’ management should aim to restore the natural stands and forest structure as a condition for their stability in order to consistently provide ecosystem services.
In management planning of recreational forests, easily observable biodiversity indicators such as structural variables (e.g., old stands, large trees, and canopy cover) are of particular importance [44]. In general, indicators that characterize stand structure are easier to assess by the managers, as management is applied at the stand level [44].
For the studied recreational forests, the provisions of the management planning can be summarized in the measures presented in Table 6.

5. Conclusions

Effective management of recreational forests with multiple functions must take into account the requirements of all the factors that benefit from the ecosystem services of these forests. The recreational value of a forest can be expressed by the H index, applied to the structural characteristics of the stands and the forest. High H-index values are found in forests with complex horizontal and vertical structures. The management of stands toward specific compositions of natural forest types does not necessarily lead to an increase in species diversity. This is the case in beech and spruce stands. However, in such formations, the diversity of the stands can increase in the vertical plane. Given the current structural conditions of the stands, we recommend directing them toward uneven-aged structures, where the forest management undertakes transformation to selection system cuttings. This would harmoniously combine aesthetic and economic interests. During the application of the management plan, the cuttings could be dispersed throughout the forest and could have reduced intensities, thereby going unnoticed by visitors and creating the impression that the stands always remain the same. In complex, uneven-aged structures, the shapes of the different species and sizes of trees, in the presence of sunlight, would blend harmoniously and create an aesthetic appearance that would satisfy even the most demanding of aesthetic requirements. In terms of the wood production ratio, the advantages of the selection system are already known. Stand structures are in continuous transformation and so the values of their diversity indices vary during stand development. Structural diversity indices, however, offer the possibility of assessing and monitoring stand recreational values.

Author Contributions

Conceptualization, G.-M.T.; Data curation, G.-M.T., A.C., M.C. and A.-C.D.; Investigation, G.-M.T., A.C., M.C. and A.-C.D.; Methodology, G.-M.T.; Validation, G.-M.T., A.C., M.C. and A.-C.D.; Writing—original draft, G.-M.T.; Writing—review and editing, G.-M.T., M.C. and A.-C.D. All authors have read and agreed to the published version of the manuscript.

Funding

This research received no external funding.

Data Availability Statement

Not applicable.

Acknowledgments

The authors thank RPLP Kronstadt for giving us access to the forest database.

Conflicts of Interest

The authors declare no conflict of interest.

References

  1. Fredman, P.; Romild, U.; Yuan, M.; Wolf-Watz, D. Latent demand and time contextual constraints to outdoor recreation in Sweden. Forests 2012, 3, 1. [Google Scholar] [CrossRef]
  2. Bötsch, Y.; Tablado, Z.; Scherl, D.; Kéry, M.; Graf, R.F.; Jenni, L. Effect of recreational trails on forest birds: Human presence matters. Front. Ecol. Evol. 2018, 6, 175. [Google Scholar] [CrossRef]
  3. De Meo, I.; Paletto, A.; Cantiani, M.G. The attractiveness of forests: Preferences and perceptions in a mountain community in Italy. Ann. For. Res. 2015, 58, 145–156. [Google Scholar] [CrossRef]
  4. Blattert, C.; Lemm, R.; Thees, O.; Lexer, M.J.; Hanewinkel, M. Management of ecosystem services in mountain forests: Review of indicators and value functions for model based multi-criteria decision analysis. Ecol. Indic. 2017, 79, 391–409. [Google Scholar] [CrossRef]
  5. Dudek, T. Recreational potential as an indicator of accessibility control in protected mountain forest areas. J. Mt. Sci. 2017, 14, 1419–1427. [Google Scholar] [CrossRef]
  6. Sievänen, T. Recreation: Inventory, monitoring and management. In Encyclopedia of Forest Sciences; Burley, J., Evans, J., Youngquist, J.A., Eds.; Elsevier: Amsterdam, The Netherlands, 2004; pp. 958–964. [Google Scholar] [CrossRef]
  7. Ciobotaru, A.-M.; Patel, N.; Pintilii, R.-D. Tree cover loss in the Mediterranean region—An increasingly serious environmental issue. Forests 2021, 12, 1341. [Google Scholar] [CrossRef]
  8. Kim, D.; Avenzora, R.; Lee, J.H. Exploring the outdoor recreational behavior and new environmental paradigm among urban forest visitors in Korea, Taiwan and Indonesia. Forests 2021, 12, 1651. [Google Scholar] [CrossRef]
  9. Gundersen, V.S.; Frivold, L.H. Public preferences for forest structures: A review of quantitative surveys from Finland, Norway and Sweden. Urban For. Urban Green. 2008, 7, 241–258. [Google Scholar] [CrossRef]
  10. Edwards, D.M.; Jay, M.; Jensen, F.S.; Lucas, B.; Marzano, M.; Montagné, C.; Weiss, G. Public preferences across Europe for different forest stand types as sites for recreation. Ecol. Soc. 2012, 17, 22. [Google Scholar] [CrossRef] [Green Version]
  11. Filyushkina, A.; Agimass, F.; Lundhede, T.; Strange, N.; Jacobsen, J.B. Preferences for variation in forest characteristics: Does diversity between stands matter? Ecol. Econ. 2017, 140, 22–29. [Google Scholar] [CrossRef]
  12. Nigussie, S.; Liu, L.; Yeshitela, K. Indicator development for assessing recreational ecosystem service capacity of urban green spaces–A participatory approach. Ecol. Indic. 2021, 121, 107026. [Google Scholar] [CrossRef]
  13. Sergiacomi, C.; Vuletić, D.; Paletto, A.; Barbierato, E.; Fagarazzi, C. Exploring National Park Visitors’ Judgements from Social Media: The Case Study of Plitvice Lakes National Park. Forests 2022, 13, 717. [Google Scholar]
  14. La Rosa, D.; Spyra, M.; Inostroza, M. Indicators of Cultural Ecosystem Services for urban planning: A review. Ecol. Indic. 2016, 61, 74–89. [Google Scholar] [CrossRef]
  15. Pleasant, M.M.; Gray, S.A.; Fernandes, A.; Hunter, N.; Ford, D. Managing cultural ecosystem services. Ecosyst. Serv. 2014, 8, 141–147. [Google Scholar]
  16. Jurmalis, E.; Libiete, Z. Developing a framework for characterizing recreational potential of forest areas using weighted criteria analysis. In Research for Rural Development, Proceeding of the Annual 25th International Scientific Conference, Jelgava, Latvia, 15–17 May 2019; Latvia University of Life Sciences and Technologies: Jelgava, Latvia; pp. 89–94. [CrossRef]
  17. Oftedal, A.; Davenport, M.; Schneider, I.E.; Zerger, C.; Schreurs, B.; Vogel, M. An Ecosystem Approach to Recreation Location Quotients. Forests 2011, 2, 993–1012. [Google Scholar] [CrossRef]
  18. Abildtrup, J.; Garcia, S.; Olsen, S.B.; Stenger, A. Spatial preference heterogeneity in forest recreation. Ecol. Econ. 2013, 92, 67–77. [Google Scholar] [CrossRef]
  19. Termansen, M.; Zandersen, M.; McClean, C.J. Spatial substitution patterns in forest recreation. Reg. Sci. Urban Econ. 2008, 38, 81–97. [Google Scholar] [CrossRef]
  20. Felton, A.; Felton, A.M.; Wam, H.K.; Witzell, J.; Wallgren, M.; Löf, M.; Sonesson, J.; Lindbladh, M.; Björkman, C.; Blennow, K.; et al. Forest biodiversity and ecosystem services from spruce-birch mixtures: The potential importance of tree spatial arrangement. Environ. Chall. 2022, 6, 100407. [Google Scholar] [CrossRef]
  21. Pach, M.; Sansone, D.; Ponette, Q.; Barreiro, S.; Mason, B.; Bravo-Oviedo, A.; Löf, M.; Bravo, F.; Pretzsch, H.; Lesi´nski, J.; et al. Silviculture of mixed forests: A European Overview of Current Practices and Challenges. In Managing Forest Ecosystems: The Challenge of Climate Change; Springer International Publishing: Cham, Switzerland, 2018; Volume 31, pp. 185–253. [Google Scholar]
  22. Battles, J.J.; Shlisky, A.J.; Barrett, R.H.; Heald, R.C.; Allen-Diaz, B.H. The effects of forest management on plant species diversity in a Sierran conifer forest. For. Ecol. Manag. 2001, 146, 211–222. [Google Scholar] [CrossRef]
  23. Decocq, G.; Aubert, M.; Dupont, F.; Alard, D.; Saguez, R.; Wattez-Franger, A.; De-Foucalt, B.; Delelis-Dusollier, A.; Bardat, J. Plant diversity in a managed temperate deciduous forest: Understorey response to two silvicultural systems. J. Appl. Ecol. 2004, 41, 1065–1079. [Google Scholar]
  24. Heyman, E. Analysing recreational values and management effects in an urban forest with the visitor-employed photography method. Urban For. Urban Green. 2012, 11, 267–277. [Google Scholar] [CrossRef]
  25. Jiang, B.; Sun, C.; Mu, S.; Zhao, Z.; Chen, Y.; Lin, Y.; Qiu, L.; Gao, T. Differences in Airborne Particulate Matter Concentration in Urban Green Spaces with Different Spatial Structures in Xi’an. China. Forests 2022, 13, 14. [Google Scholar] [CrossRef]
  26. Hoppa, A.; Sikorska, D.; Przybysz, A.; Melon, M.; Sikorski, P. The Role of Trees in Winter Air Purification on Children’s Routes to School. Forests 2022, 13, 40. [Google Scholar] [CrossRef]
  27. Mundher, R.; Abu Bakar, S.; Maulan, S.; Mohd Yusof, M.J.; Al-Sharaa, A.; Aziz, A.; Gao, H. Aesthetic Quality Assessment of Landscapes as a Model for Urban Forest Areas: A Systematic Literature Review. Forests 2022, 13, 991. [Google Scholar] [CrossRef]
  28. Kinho, J.; Arini, D.I.D.; Abdulah, L.; Susanti, R.; Irawan, A.; Yulianti, M.; Subarudi, S.; Imanuddin, R.; Wardani, M.; Denny, D.; et al. Habitat Characteristics of Magnolia Based on Spatial Analysis: Landscape Protection to Conserve Endemic and Endangered Magnolia sulawesiana Brambach, Noot., and Culmsee. Forests 2022, 13, 802. [Google Scholar] [CrossRef]
  29. Grebner, D.L.; Bettinger, P.; Siry, J.P. Introduction to Forestry and Natural Resources; Academic Press: Cambridge, MA, USA, 2014; pp. 173–197. [Google Scholar]
  30. Aikoh, T.; Abe, R.; Kohsaka, R.; Iwata, M.; Shoji, Y. Factors Influencing Visitors to Suburban Open Space Areas near a Northern Japanese City. Forests 2012, 3, 155–165. [Google Scholar] [CrossRef]
  31. Komossa, F.; van der Zanden, E.H.; Schulp, C.J.; Verburg, P.H. Mapping landscape potential for outdoor recreation using different archetypical recreation user groups in the European Union. Ecol. Indic. 2018, 85, 105–116. [Google Scholar] [CrossRef]
  32. Pătrășcoiu, N.; Dima, V.; Teodoreanu, E.; Gherbanovski, E. Cercetări Privind Influenţa Structurii Arboretelor Asupra Funcţiilor de Interes Social in Structuri Optime pentru Păduri cu Funcţii de Protecţie; I.C.A.S.: Bucureşti, Romania, 1981; pp. 67–89. [Google Scholar]
  33. Ahtikoski, A.; Tuulentie, S.; Hallikainen, V.; Nivala, V.; Vatanen, E.; Tyrväinen, L.; Salminen, H. Potential trade-offs between nature-based tourism and forestry, a case study in Northern Finland. Forests 2011, 2, 894–912. [Google Scholar] [CrossRef]
  34. Tudoran, G.-M.; Cicșa, A.; Boroeanu, M.; Dobre, A.-C.; Pascu, I.-S. Forest Dynamics after Five Decades of Management in the Romanian Carpathians. Forests 2021, 12, 783. [Google Scholar] [CrossRef]
  35. Tudoran, G.M.; Zotta, M. Adapting the planning and management of Norway spruce forests in mountain areas of Romania to environmental conditions including climate change. Sci. Total Environ. 2020, 698, 133761. [Google Scholar] [CrossRef]
  36. Shannon, C.E.; Weaver, W. The Mathematical Theory of Communication; The University of Illinois Press: Urbana, IL, USA, 1949; pp. 1–117. [Google Scholar]
  37. Pretzsch, H. Transitioning monocultures to complex forest stands in Central Europe: Principles and practice. In Achieving Sustainable Management of Boreal and Temperate Forests; Burleigh Dodds Science Publishing: Cambridge, UK, 2019; pp. 355–396. [Google Scholar]
  38. Rucăreanu, N.; Leahu, I. Amenajarea Pădurilor; Editura Ceres: Bucureşti, Rmania, 1982; pp. 356–450. [Google Scholar]
  39. Leahu, I. Amenajarea Pădurilor; Editura Didactică şi Pedagogică: Bucureşti, Romania, 2001; pp. 436–498. [Google Scholar]
  40. Kellomäki, S. Recreational potential of a forest stand. Silva Fenn. 1978, 12, 5001. [Google Scholar] [CrossRef]
  41. Polyakov, M.; Majumdar, I.; Teeter, L. Spatial and temporal analysis of the anthropogenic effects on local diversity of forest trees. For. Ecol. Manag. 2008, 255, 1379–1387. [Google Scholar] [CrossRef]
  42. Pretzsch, H. Forest Dynamics, Growth and Yield; Springer: Berlin, Germany, 2009; pp. 225–328. [Google Scholar]
  43. Marchi, M.; Paletto, A.; Cantiani, P.; Bianchetto, E.; De Meo, I. Comparing thinning system effects on ecosystem services provision in artificial black pine (Pinus nigra JF Arnold) forests. Forests 2018, 9, 188. [Google Scholar] [CrossRef]
  44. Ćosović, M.; Bugalho, M.N.; Thom, D.; Borges, J.G. Stand Structural Characteristics Are the Most Practical Biodiversity Indicators for Forest Management Planning in Europe. Forests 2020, 11, 343. [Google Scholar] [CrossRef]
  45. Hruza, P.; Pelikán, P.; Olišarová, L. Single-Track Bike Trails in the Moravian Karst as Part of Forest Recreation. Forests 2021, 12, 1601. [Google Scholar] [CrossRef]
Figure 1. Location of the studied forest management unit.
Forests 13 01369 g001
Figure 2. (a) Forest age structure and (b) proportion of species (% of area) identified in the forest composition. The age class division used was based on the ages of the trees of the different species. Each age class included generations of trees in the stands. Ai—Alnus incana L.; AaAbies alba Mill.; CbCarpinus betulus L.; TiliaTilia spp. L.; PmPseudotsuga menziesii; FsFagus sylvatica L.; FeFraxinus excelsior L.; QpQuercus petraea L.; LdLarix decidua Mill.; BpBetula pendula Roth; PaPicea abies Karst.; AppAcer pseudoplatanus L.; PsPinus sylvestris L.; PnPinus nigra Arn.; PstPinus strobus L.; PtPopulus tremula L.; RpRobinia pseudoacacia L.; QrQuercus robur L.; QruQuercus rubra L.; UlmusUlmus spp. L.; ApAcer platanoides L.; PraPrunus avium L.; FoFraxinus ornus L. A fairly large percentage (71%) of the stands were over 100 years old. Species of this age, and occurring in the largest proportions, were beech, fir, and spruce. Sessile oak, pine, larch, sycamore, and other species were additions to these, in smaller proportions.
Forests 13 01369 g002
Figure 3. Diameter development, in terms of productivity, in (a) silver fir and (b) European beech stands.
Forests 13 01369 g003
Figure 4. Number of trees vs. diameter distribution in (a) a beech stand (aged 140 years) and (b) a mixed beech–fir stand (aged 120 years). FsFagus sylvatica L.; AaAbies alba Mill.; PaPicea abies Karst.; LdLarix decidua Mill.; App–Acer pseudoplatanus L. The beech stand had a greater variation in diameter. This was a closed stand (with a stand crown density of 1.0). Although it was a pure stand, the sizes of the trees and straightness and quality of the trunks made an impression. This stand is accessible on the tourist route, and is greatly appreciated and much-frequented by tourists. A young generation of trees was already developing in the mixed beech–fir stand, the young firs most often being in the seedling stage and growing vigorously, already providing 40% coverage. This is an accessible stand, positioned on the tourist route, and offering an illustration of the transition between generations resulting from management measures designed through management plans and applied by the forest district.
Forests 13 01369 g004
Figure 5. Shannon index calculated at the management unit level for (a) the stand characteristics (426 stands) and (b) the mean height of the stands.
Forests 13 01369 g005
Figure 6. (a) Variation in the Shannon index (H5) in relation to stand age, and (b) Shannon diversity calculated at the level of the mean diameter and height of the stands.
Forests 13 01369 g006
Figure 8. Stand distribution maps in relation to the (a) Hdg values, (b) Hhg values, (c) Esp. distribution, and (d) Edg values.
Forests 13 01369 g008
Figure 9. Relationship between diversity indices. In 49% (204) of the studied stands, it appeared that the increase in diversity in the stands in the vertical plane resulted from the increase in species diversity (H2).
Forests 13 01369 g009
Table 1. Parameter estimates.
SpeciesCoefficientsParameterStd. Error
Fira−1.66 × 10−64.13 × 10−6
b7.73 × 10−50.001192
c0.44780.100443
d−1.783912.600612
Beecha−2.65 × 10−62.82 × 10−6
b0.0001990.000776
c0.4093870.065054
d−1.339471.672826
Table 2. Characteristics of the forest, differentiated by canopy layer (overstorey, midstorey, and understorey).
Canopy LayerProportion of Species
(% of Basal Area)
Basal Area
(m2 ha−1)
Growing Stock
(m3 ha−1)
Age (Years)dg
(cm)
hg
(m)
hp
(m)
Understorey45% Fs, 20% Cb, 13% Pn, 5% Pa, 4% App, 3% Ld, 6% Aa, 8% other species0.74 (Pn)–15.62 (Pa)7 (Ld)–72.7 (Pa)5 (Aa)–95 (Cb)2 (Aa)–24 (Pn)2 (Aa)–12 (Pa)0 (Aa)–5 (Fs)
Total310.747.43311.58.31.5
Midstorey49% Fs, 11% Cb, 10% Qp, 7% Pa, 6% Ps, 3% Fe,
14% other species
14.94 (Cb)–39.48 (Pa)144.8 (Cb)–374.1 (Aa)30 (Aa)–160 (Qp) 14.0 (Cb)–60 (Qp)13 (Aa)–24 (Pa)0 (Aa)–16 (Pa)
Total2523.97244.88929.720.410
Overstorey48% Fs, 21% Aa, 20% Pa, 4% Ps, 2% Ld, 2% Pn, 1% Qp, 2% other species21.57 (Qp)–39.14 (Pa)301.6 (Qp)–482.8 (Aa)70 (Aa)–200 (Pa) 32.0 (Fs)–84.0 (Pa)25 (Aa)–36 (Pa)8 (Ps)–24 (Pa)
Total7230.5348.511849.029.017.2
FsFagus sylvatica L.; CbCarpinus betulus L.; PnPinus nigra Arn.; PaPicea abies Karst.; AppAcer pseudoplatanus L.; AaAbies alba Mill.; QpQuercus petraea L.; PsPinus sylvestris L.; FeFraxinus excelsior L.; Ld—Larix decidua Mill. Total—average per storey. The basal area of the stands was calculated through Bitterlich. The whole forest was storied. The trees with the highest mean heights were included in the upper storey (hg > 24 m). They also had the largest share of the forest area, and 72% of the basal area, with respect to the volume of the forest. This storey was the best represented, and included trees with mean diameters greater than 37 cm.
Table 3. Shannon index per management unit.
Shannon Index H1
(age-sp.)
H2
(sp.)
H3
(age)
H4
(dg)
H5
(hg)
General (management-unit) level
Value4.191.632.763.172.76
Evenness (%)7651788576
Frequency of the variable25725354134
Stand level
Maximum value 1.851.541.501.721.72
Evenness (%)9595939696
Frequency 75366
To calculate the Shannon index, the species and their tree generations (H1); only the species (H2); only the tree generations, regardless of species (H3); the mean diameter (H4); and mean height (H5) were introduced as variables. The proportion of the basal area of the variables was used. The management unit had 2923.6 ha and an average basal area of 28.2 m2 ha−1. The 25 species formed stands of different ages. In different stands, the species had different ages, and they were called generations of trees. If there is a 40-year-old fir in one stand and a 50-year-old fir in another, these generations would be actually age classes (i.e., denoted by “age”). In total, there were 257 of all the generations of all the species. This explains the H-index value of 4.19 at the entire-forest level.
Table 4. Species diversity in the canopy layer at the management unit level.
IndexProportion of Maximum Mean Height (hg) of the Stands (%)
0–3334–6667–1000–5051–8081–100
H21.852.02.152.132.11.64
E778086817866
The maximum hg of the stands was 36.0 m. Increasing the understorey area changes the share of species in the lower storey through the participation of this storey in a larger proportion of middle-aged stands (hg increases from 12 to 16 m). However, this analysis is much more edifying when carried out at the stand or group of stands levels, and is of interest for the location of recreation areas preferred by tourists.
Table 6. Management goals and silvicultural prescriptions for recreation forest.
Function Intensity of the Recreation AreaHigh-Intensity
Area
Area of
Moderate to Low Intensity
1. Management goalsProtection (recreation,
soil, water, and biodiversity conservation)
Protection and production (timber, valuable timber—veneer, resonance)
2. Type of stand structureVarious structures with aesthetic effects
(H index:
at stand level: H2 > 1.5;
H3, H4 and H5 > 0.3; E > 40
at level forest: H2 > 1.5;
H3, H4 and H5 > 0.3; E > 40)
Multi-aged and uneven-aged structures
(H index:
at stand level: H2, H3, H4 and H5 > 0.7;
E > 70
at forest level: H2, H3, H4 and H5 > 2.5;
E > 70)
3. Silvicultural systemCuttings to maintain the functional structure of the stands and the aesthetic effects of trees
Tending operations
Selection system (cuttings of transformation to selection system)
Group shelterwood system with regeneration period of 40–60 years (in mixed beech–coniferous stands and beech stands)
Tending operations
4. Method of regeneration Natural regeneration ± artificial regeneration by plantingNatural regeneration
5. Felling age of stands (cycle for forest) (years)


Rotation (years)/target diameter (cm)
-


10/-
110–130: spruce stands
120–140: mixed beech–coniferous stands and beech stands
150–180 (200) (for valuable timber: veneer and resonance)

10/60–100 (Pa and Aa); 60–90 (Fs)
6. Target composition Forest type composition ± mixtures of species (with aesthetic qualities) to the site adaptedForest type composition
7. Structure by age classes -Even distribution of stands of different ages (mosaic of stands of different ages) (in silvicultural system age class forest)
8. Future structure:
by age classes

by diameter classes
-Normal distribution by age classes (in silvicultural system age class forest)
Normal distribution by diameter class (in selection system)
The limits of felling ages refer to stands located in lower- to higher-productivity sites and are provided by technical norms on silvicultural systems of Romania (2000).
Publisher’s Note: MDPI stays neutral with regard to jurisdictional claims in published maps and institutional affiliations.

