Article

The Relationships of Supporting Services and Regulating Services in National Forest City

1
School of Geography, South China Normal University, Guangzhou 510631, China
2
Guangdong Academy of Forestry, Guangzhou 510520, China
*
Author to whom correspondence should be addressed.
Forests 2022, 13(9), 1368; https://doi.org/10.3390/f13091368
Submission received: 8 July 2022 / Revised: 17 August 2022 / Accepted: 24 August 2022 / Published: 27 August 2022
(This article belongs to the Special Issue Multiple-Use and Ecosystem Services of Forests)

Abstract

:
The establishment of national forest city (NFC) is to regulate the urban climate and realize the integrated development of urban and rural areas. We explored the changes and relationships between ecosystem supporting services and regulating services before and after the construction of NFC in the Pearl River Delta urban agglomeration (PRD). InVEST and CASA models were used to evaluate five ecosystem services (ESs), and correlation analysis was used to analyze the relationship between ESs. The results showed that (1) Construction land increased significantly from 2005 to 2020, while cultivated land decreased the most, followed by woodland. (2) All ESs except NPP decreased from 2005 to 2020 in the PRD. (3) There was a synergistic relationship between supporting service and regulating service, and their internal services are positively correlated. This study proved the guaranteed effect of supporting services on regulating services, and we found that the construction of NFC can restrain the decline of ESs. Based on the above results, we proposed nature- based solutions for the development of forest cities.

1. Introduction

Ecosystem services (ESs) refer to the benefits that humans derive directly or indirectly from nature [1]. ESs provide raw materials for production and living, as well as regulate climate, eliminate pollution and enrich humans’ spiritual world [1,2,3]. The most widely used ESs classification includes the four categories of provision service, supporting service, regulating service and cultural service proposed by Millennium Ecosystem Services Assessment in 2005 [4]. Integrating ESs into urban planning and management is of great significance for urban sustainable development [5].
For more effective urban management and greater benefits of ecosystem services, it is necessary to clarify the relationship between various ecosystem services [6,7]. Trade-offs and synergies are two primary relations in ESs, which have been favored by researchers [6,8,9,10,11]. The relationship between provision service and regulating service has been discussed in many aspects, such as the trade-offs of food production with regulating services and the trade-offs among water-related ESs [6,12]. However, as far as we know, few studies have explored the relationship between supporting services and regulating services. Supporting services were often neglected because they do not directly contribute to human well-being [13,14]. Supporting services have been pointed out by researchers to have guaranteed utility for three types of services [14,15]. Therefore, it is necessary to explore the trade-off between supporting services and other services.
The national forest city (NFC) refers to a city whose urban ecosystem is dominated by forest vegetation, and whose urban ecological construction has achieved urban-rural integration development [16]. NFC must meet dozens of indicators, such as urban green coverage, per capita area of parks, native tree species and forest health [17]. The construction of NFC focuses on the creation and connection of green spaces such as parks and woodlands. Green space has been proven to reduce the urban heat island effect and absorb carbon emissions [3,18], which belong to ecosystem regulation services. Therefore, it is necessary to explore the regulating services and supporting services of NFC. China began the construction of NFC in 2004. The Pearl River Delta urban agglomeration (PRD) had become the first national forest city agglomeration in China by 2020, and all nine cities have been identified as NFC. At the same time, the PRD is one of the three major urban agglomerations in China, with rapid economic development and a dense population [19]. As urban agglomeration has gradually become the main form of urbanization in China, exploring the supporting services and regulating services of forest urban agglomeration in the PRD can provide effective references for the development of other forest cities in China.
Supporting services are fundamental to ecosystems; net primary productivity (NPP) and habitat quality were selected to estimate supporting service. Habitat quality is a key indicator of biodiversity, which has been affected severely by urbanization and human activities [20,21]. NPP is one of the important parts of the surface carbon cycle, which directly reflects the production capacity of vegetation communities under natural environmental conditions and represents the quality of terrestrial ecosystems [22,23]. Regulating services play a key role for human-beings, and resilient cities, carbon storage, water purification and soil retention were selected to depict regulating services [6,12]. In this study, we used the Integrated Valuation of Ecosystem Services and Trade-off model (InVEST) to calculate grid ESs, which was developed by Stanford University and has been widely used to evaluate multiple ESs [7]. The Carnegie–Ames–Stanford–Approach (CASA) model, which is one of the most studied and applied NPP remote sensing inversion models, was used to calculate NPP [24].
Overall, this study aims to provide a better understanding of the interactions between supporting service and regulating service, and the management choices in urban and landscape planning in NFC. The specific objectives were to: (1) evaluate supporting service and regulating service in 2005 and 2020, (2) map the temporal change of supporting service and regulating service, and (3) explore the relationship between supporting service and regulating service and provide some effective references for effective construction of forest cities.

2. Materials and Methods

2.1. Study Area

PRD (21.17°–23.55° N, 111.59°–115.25° E) is located in Guangdong Province on the southeast coast of China (Figure 1). It covers 55,368.7 km2 and is composed of nine neighboring cities such as Guangzhou and Shenzhen [25]. PRD has rapid economic development and a dense population. In 2020, the permanent population of the PRD was 78.24 million, and its gross domestic product (GDP) was 1.37 trillion USD, accounting for 62.09% and 80.49% of that of entire Guangdong Province, respectively. The population growth has exceeded 21 million over the past 10 years [26]. The urbanization rate of the PRD maintained an average annual growth rate of 0.8% even though the rate has reached 71.4% [27].
In 2006, Guangzhou started the road of NFC construction and became the first NFC in Guangdong Province in 2008. In 2018, nine cities in the PRD were built into national forest cities, and the PRD was recognized as the first national forest urban agglomeration in China in 2020. This study explored the changes in supporting services and regulating services in PRD before and after the construction of NFC.

2.2. Data Source and Preparation

There are six types of data we used to analyze ESs: (1) The land-use and land-cover (LULC) data were divided into seven types (Table 1), which were acquired from the Data Center for Resources and Environmental Sciences, Chinese Academy of Sciences (http://www.resdc.cn (accessed on 25 April 2021)); (2)The DEM data were obtained from Geospatial Data Cloud (http://www.gscloud.cn (accessed on 7 October 2020)); (3) Meteorological data are interpolated based on data from the China Meteorological Data Center (http://data.cma.cn (accessed on 25 April 2021)); (4) Soil erodibility and rainfall erosivity are calculated by the meteorological data based on methods from previous research [28]; (5) Solar-radiation data and normalized-vegetation index (NDVI) data are from the National Tibetan Plateau Scientific Data Center (https://data.tpdc.ac.cn/zh-hans (accessed on 3 April 2021)); (6) The parameters required by other sub-models are derived from previous research results (listed in the corresponding service calculation process below).

2.3. Quantification of Supporting Services

2.3.1. Habitat Quality

The habitat quality module in InVEST was used to calculate the habitat quality of PRD. In this study, the construction land, cultivated land, bare land, railway and highway were regarded as threat factors, and the threat coefficient was set regarding the existing research to map the habitat quality of the PRD [21,29]. The calculation formula of each grid is as follows:
Q xj = H j ×   [ 1 D x y z ( D x y z + k z ) ]
Q represents the dimensionless habitat quality coefficient. Hj represents the habitat suitability of land-use type j; D x y Z is the total threat level of grid element x on land cover type j, and z is a normalized constant. k is the half-saturation, which is specified as 0.5 in this study. The closer the Q value is to 1, the better the habitat quality is.

2.3.2. NPP

The process-based CASA is used to calculate NPP, which is based on the theory that plant productivity is correlated with the photosynthetically active radiation absorbed or intercepted by green foliage [30,31]. The NDVI, radiation, rainfall and temperature data required by the model are finally calculated by the CASA plug-in in Envi5.1 [23]. The calculation formula is as follows:
N P P ( x , t ) = A P A R × ξ
A P A R = R S G × F P A R × 0.5  
ξ = T ξ × W ξ × ξ m a x
APAR is photosynthetic-effective radiation (MJ/m2 month); ξ is the actual photosynthetic-utilization rate j; RSG is the total solar radiation; FPAR is the absorption ratio of vegetation to incidental-photosynthetic radiation, dimensionless; 0.5 is the ratio of photosynthetic-effective radiation that can be utilized by vegetation to total solar radiation; Tξ represents temperature-stress factor; Wξ is a water-stress factor, ξmax is the maximum light-energy-utilization rate of vegetation.

2.4. Quantification of Regulating Services

2.4.1. Carbon Storage

Carbon storage is regarded as a key indicator of gas regulation and greenhouse control, which can promote the realization of China’s carbon-neutralization goal [16,32]. In this study, carbon storage was evaluated by the carbon module of the InVEST model, and the calculation formula is as follows:
Ctot = Cabove + Cbelow + Csoil + Cdead
Ctot (t) is the total carbon storage, and Cabove, Cbelow, Csoil, Cdead represent carbon reserve of aboveground, vegetation roots, soil and dead organic matter, respectively. The specific parameter of carbon-pool setting referred to the relevant literature and the InVEST user’s guide [33,34].

2.4.2. Soil Retention

Soil retention was calculated by the sediment-delivery ratio module in InVEST, which is based on the revised Universal Soil Loss Equation (USLE). It describes the spatial processes of slope-soil erosion and watershed-sediment transport [31,32]. The calculation formula is as follows:
S R i = R i × K i × L S i × ( 1 C i × P i )  
SRi represents the soil retention on pixel i. Ri is the rainfall-erosivity factor and Ki is the soil-erodibility factor, LSi is the slope-length steepness factor; Ci and Pi are crop-management and support-practice factors, respectively. Biophysical parameters (Table 1) used in this model referred to related papers [31,35]. The results were verified by Wang and Zhou’s articles [33,36].

2.4.3. Phosphorus Export

In this study, the total phosphorus (P) output was used to evaluate the water-quality purification service [6,12]. The Nutrient Delivery Ratio model in InVEST calculates the amount of nutrient element in each pixel and summarizes the P_export in each watershed. The higher the P_export value, the lower the capacity of water purification services [37]. The nutrient export for each pixel is calculated with the following equation:
P export i = l o a d i × N D R i  
P exporti means the P export on pixel i, loadi is the modified nutrient load on pixel I and NDRi is the nutrient-delivery ratio on pixel i. Biophysical parameters (Table 1) used in this paper referred to related papers [6,38,39,40].
Cultivated land: land used to grow crops; Woodland: forest land used to grow trees, shrubs and coastal mangroves; Grassland: land mainly used to grow herbaceous plants; Waterbody: natural and artificial waters land; Wetland: intertidal zone, beaches and marshland; Construction land: urban and rural residential areas and other industrial, mining, transportation land; Bare land: unused land.

2.5. Trade-off Analysis

Spearman correlation analysis was used to identify trade-offs among ESs. When the relationship between two ESs passes the significance test (p < 0.05), and the correlation coefficient is negative, a trade-off is assumed between the two ESs, and the synergy occurs when the correlation coefficient is positive.
We created 3000 random points in the study area and extracted the value of each ES for correlation analysis. The standardized method of Z-score was used to eliminate the influence of unit difference. Considering that P export is a negative index of water purification, we exchanged the negative and positive values after standardization and finally analyzed the correlation between water purification services and other services based on the exchanged results.

3. Results

3.1. Land Use Change

In 2005 and 2020, the main land-use types in PRD were woodland and cultivated land (Figure 2), which, in combination, accounted for more than 70% of the study area. Overall, in the study period, only the area of construction land and grassland increased, and other types of land use showed a downward trend (Table 2).
From the line of image changes, it can be seen that the largest changes in the area of land-use types are construction land and cultivated land. Construction land mainly comes from cultivated land (1433.59 km2), followed by woodland and waterbody (Table 2). The substantial increase of construction land also witnessed the urbanization process of PRD. Cultivated land is mainly converted into waterbody and woodland, which may be due to the implementation of the project of returning farmland to forestland in China [12]. Although the PRD was building NFCs, most of the disappeared woodland was transformed into construction land (235.42 km2); they had to sacrifice it because of its large area and relatively low fees [41].

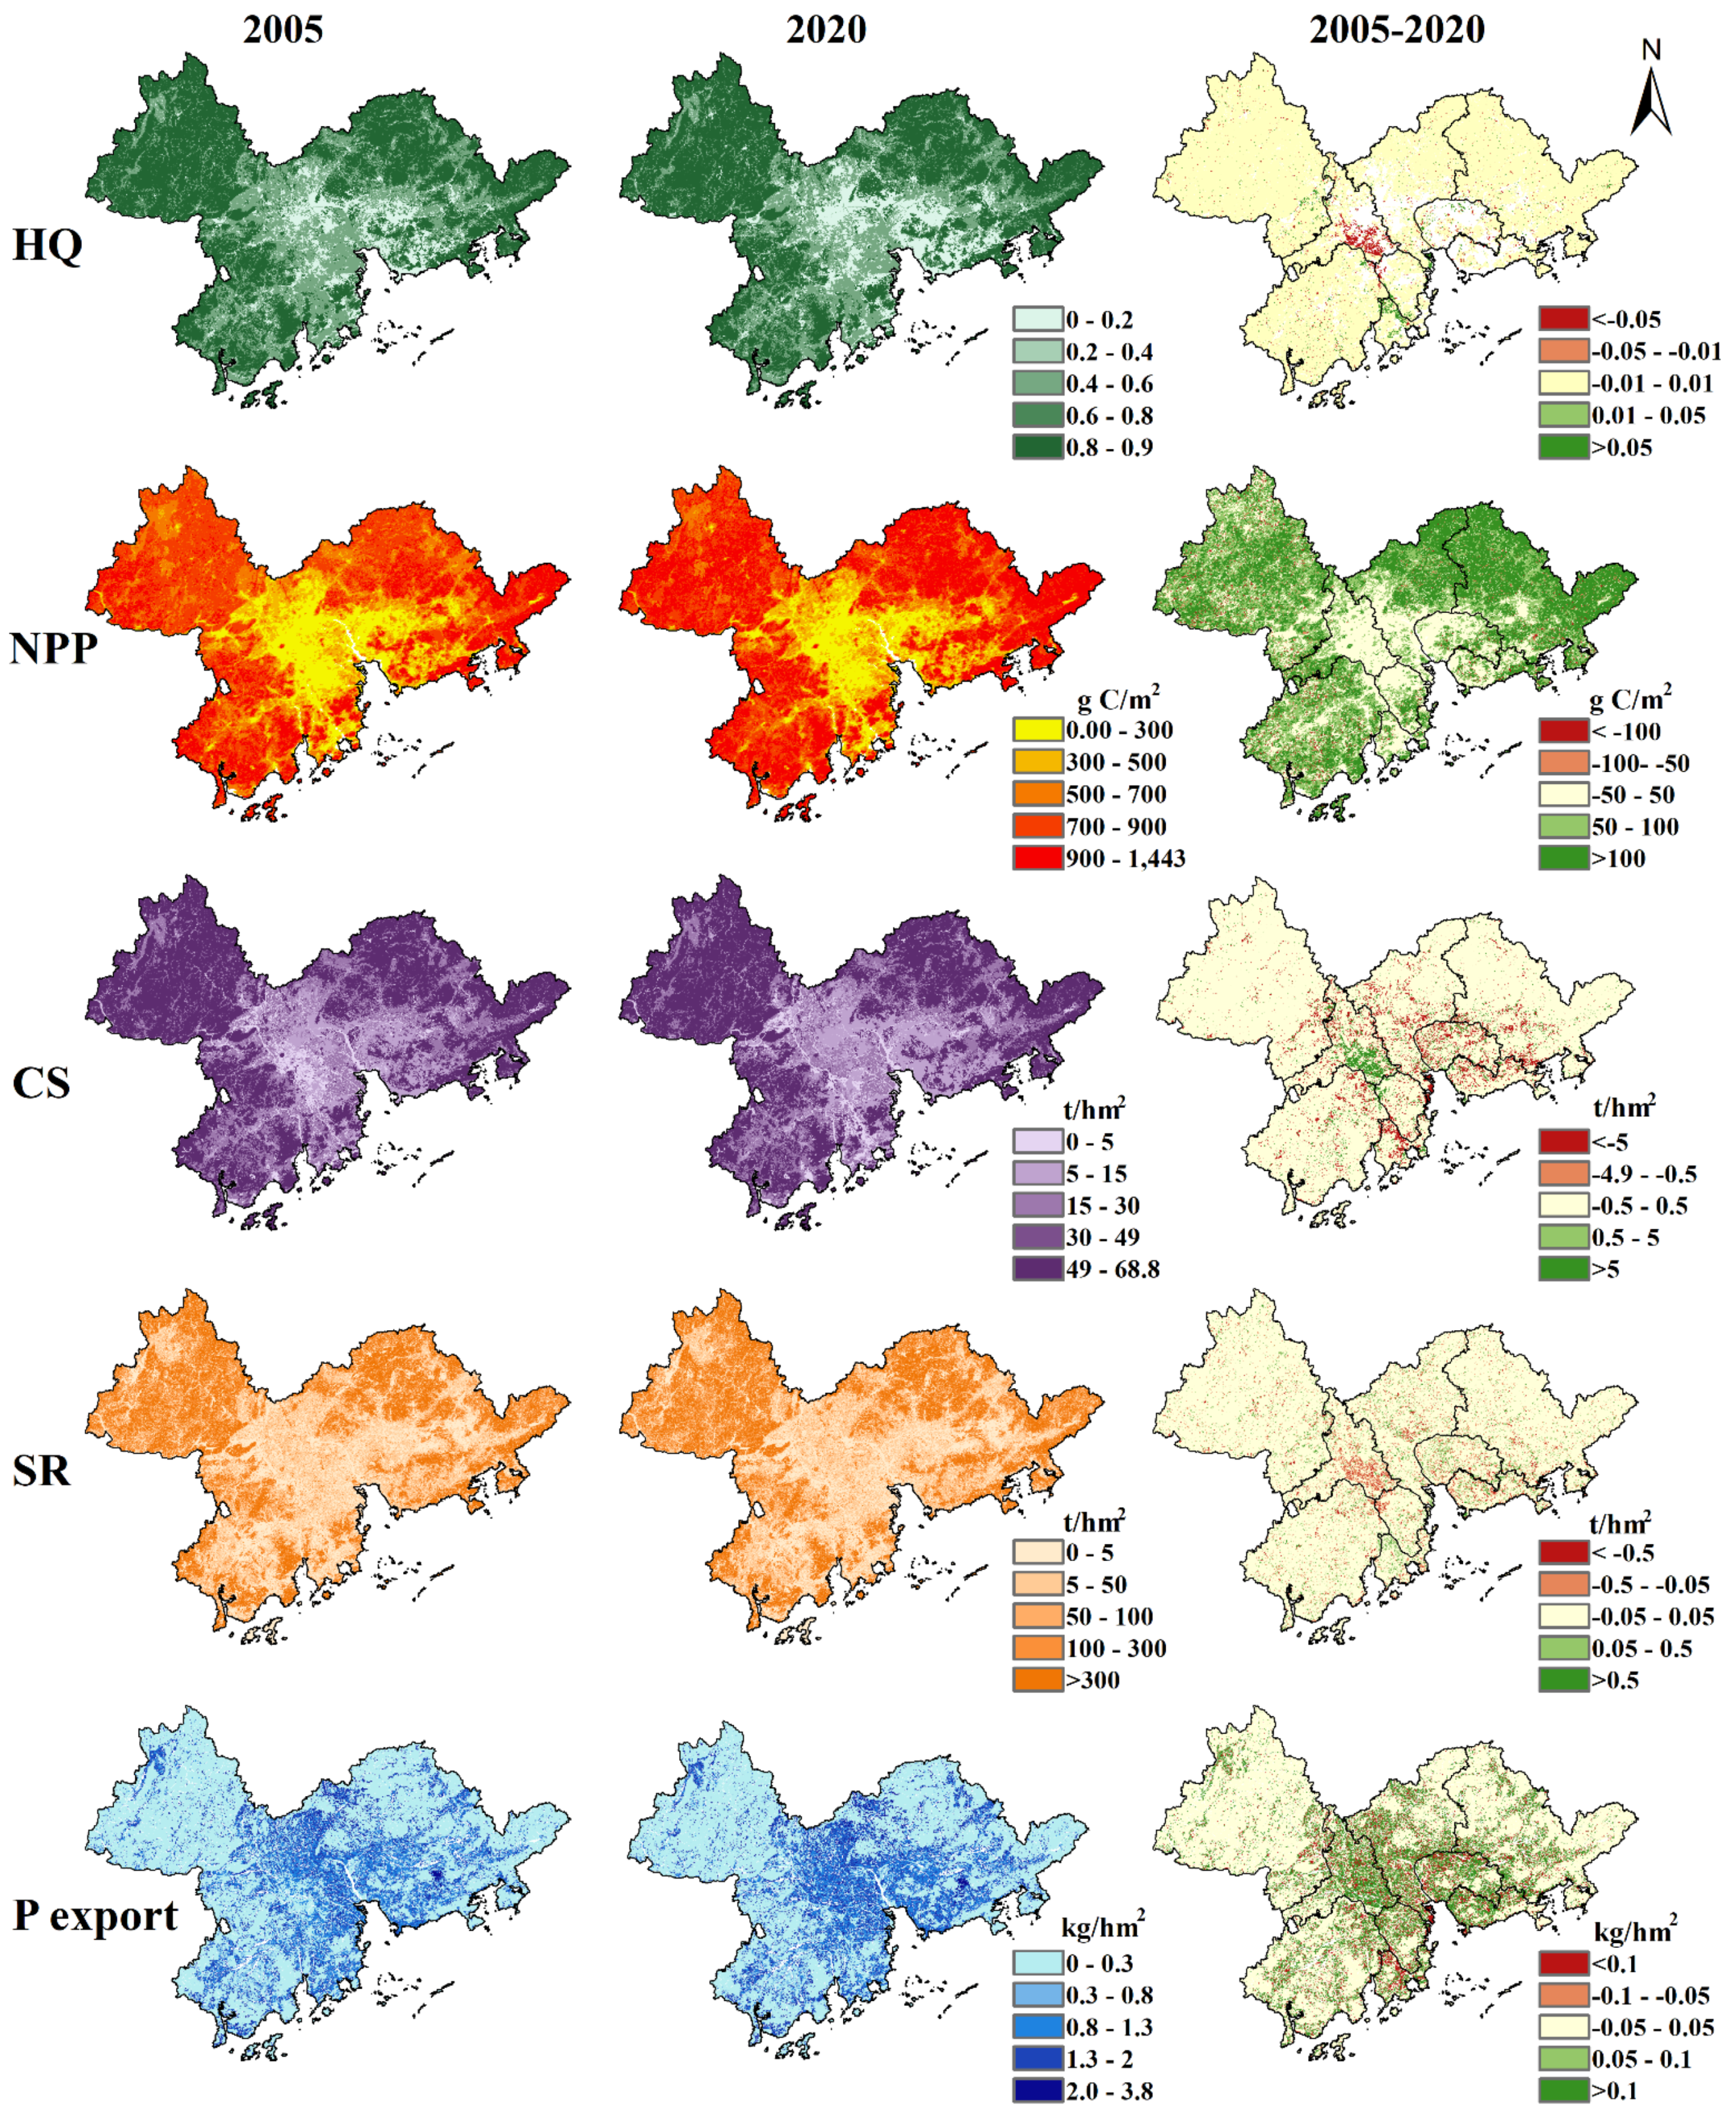
3.2. Temporal-Spatial Distribution of Supporting Services

3.2.1. Habitat Quality

In 2005, the average value of habitat quality in the PRD was 0.64, and the standard deviation was 0.33. The average value of habitat quality in the whole study area had been reduced to 0.62 by 2020, but its regional difference had increased. The low-value area of habitat quality was concentrated in the center of the study area, which mostly overlapped with the construction land. Among the nine cities, Huizhou and Zhaoqing have higher average values of habitat quality (>0.7). Except for Zhuhai, the average value of habitat quality in other cities was decreased during the study period.

3.2.2. NPP

The mean NPP in the PRD region rose from 665.96 g C/m2 in 2005 to 756.70 g C/m2 in 2020. NPP in the central part of the study area is significantly lower than that in the surroundings areas, and its spatial heterogeneity increased. From the average NPP of each NFC, Huizhou and Zhaoqing are higher, while Foshan is the lowest. During the study period, the NPP value added in the central area of the PRD is 50–100 g C/m2, and NPP decreased slightly in a few regions.

3.3. Temporal-Spatial Distribution of Regulating Services

3.3.1. Carbon Storage

The total carbon storage in the PRD showed a downward trend during the study period with an average reduction of 975.30 kg/ha. The central area of the PRD has poor carbon-sequestration capacity, and the average carbon-sequestration capacity in Dongguan, Foshan and Zhongshan is less than 25 t/ha. From 2005 to 2020, the carbon-storage capacity decreased in mostly new construction land, while the carbon-storage capacity of Foshan increased significantly, because the waterbody in Foshan city was changed into land.

3.3.2. Soil Retention

The soil retention in PRD decreased slightly, from 1453.62 × 106 t to 1453.53 × 106 t (Table 3). The spatial difference of soil-retention capacity in the PRD is significant. The soil retention at the edge of the PRD is greater than that in the central area (Figure 3); the total amount of soil retention in Zhaoqing and Huizhou is more than 350 × 106 t. During the study period, the total amount of soil retention in Zhuhai, Foshan and Huizhou deceased greatly, while the total carbon sequestration in Guangzhou increased by 21,957.53 tons.

3.3.3. Water Purification

Total P export in PRD increased from 2236.66 t to 2479.80 t in the past 15 years (Table 3), which indicates that the water-purification capacity of the study area has decreased. The P export in most places was less than 1 kg/ha, and the high-value area of P export was mainly concentrated near the rivers and construction land (Figure 3). During the study period, the P export in most regions of the PRD increased, especially in the central region, while the P export in Zhuhai decreased slightly.

3.4. Trade-Offs among ESs

Correlation analysis shows that supporting services and regulating services show a significant synergistic relationship, and the internal indicator scalars of these two types of services also show a positive correlation (Table 4). The correlation between habitat quality and each regulation service was greater than that between NPP and each regulation service. The correlation coefficient between habitat quality and carbon storage was higher than 0.9 and increased during the study period; all other correlation coefficients decreased.

4. Discussion

4.1. Spatial and Temporal Changes of ESs

Our research evaluated the supporting services and regulating services of PRD before and after the establishment of NFC. In the past 15 years, except for the increase of NPP, the service capacity of other ESs mentioned in this study has decreased. The increase of NPP in the PRD is the same as the changing trend in the Yellow River source area [24]. Climate change is the main factor affecting NPP, and the increase of precipitation can improve the NPP of vegetation [25,42]. Rainfall data input for NPP calculation in this study showed that most months in 2020 were significantly rainier than those in 2005, which also corroborate the results of previous studies on the impact of precipitation changes on NPP.
Land-use change is the main reason for the decrease of ESs [43,44,45]. More and more construction land was needed along with urbanization, so woodland and cultivated-land areas were inevitably reduced as they were relatively large [41]. Therefore, the ESs closely related to green space have declined. It is reported that 80% of the animals and plants survive in forests, but the habitat quality decreased with the reduction of the forest, which is consistent with the study result using Google cloud computing in the same area [1,46]. With the reduction of cultivated land, P export should have decreased [47], but the domestic sewage and industrial sewage in the city increased significantly, increasing the total P export [39]. Although the increase of construction land has led to the shrinkage of vegetation-covered areas, the change of soil retention in the PRD is very small, even the soil retention in Guangzhou has even increased slightly, which is the effect of building NFC [16,48]. It can be seen that the action of building NFC should alleviate the negative effects of rapid urbanization.
From the perspective of spatial differences, the ESs capacity in the middle of the PRD is relatively low, which is closely related to the distribution of forest land and construction land. The vegetation coverage rate of construction land is low, which is not conducive to soil retention and soil-organic-carbon accumulation, so the soil retention and carbon storage are lower than the forest [45]. The distribution of carbon storage is consistent with previous studies on Pinus massoniana forest in the PRD [49]. Topographic change is also an important factor affecting the spatial distribution of soil retention and P export [50,51]. The accumulation of P export value along the river is also since the river is often low-lying. The mountainous areas in the northern part of the PRD are more vulnerable to soil erosion and nutrient loss, while the soil formed on the red-bed parent material in the mountainous areas of Guangdong has higher soil erosion efficiency [50,52].

4.2. Uncertainties of Trade-Offs and Synergies

Our research determined the trade-offs between supporting services and regulating services in the PRD. In previous studies, habitat quality was always synergistic with regulating services [48]. The high-correlation index (r > 0.9) between HQ and CS is mainly due to the InVEST models calculation of these two types of services based on land-use types [37]. However, few studies have explored the relationship between NPP and regulation services. This study found that the two supporting services are positively related to regulating services, which once again verified the support relationship between supporting services and other services [14]. But our results are inconsistent with those of Qiao [53], who analyzed the relationship of NPP with soil retention at different scales. Therefore, scale is a key factor affecting the relationships among ESs.
Over time, most of the above synergies decreased, except for NPP and soil retention, habitat quality and carbon sequestration. The difference of the main driving factors of different ESs lead to the different change speed of various services over time, so the correlation of various services also changed. For example, in the block where the habitat quality is reduced, the soil retention is reduced less due to some policy reasons, and the synergy between them is reduced. Land-use change is also an important factor to explain the relationships among ESs. The cut down of woodland and the increase of construction land led to the significant decrease of HQ, while the NPP increased with the growth of rainfall, so the synergy relationship between them decreased. Therefore, understanding the main drivers of various ESs is very important for controlling the trade-offs and synergies between services.

4.3. Policy Implications and Limits

Supporting services and regulating services are of great significance for urban sustainable development. Although the PRD has been building NFC for the past 15 years, ESs still show a downward trend. However, it cannot be denied that if there had been no action of NFC construction, ESs may have declined faster with the rapid urbanization of the PRD [43,44]. Therefore, the PRD should further strengthen the construction of green infrastructure and strengthen the connectivity of urban green space, which can increase NPP and offset more carbon emissions [18]. Intensively using the construction land, protecting the existing blue and green space, and increasing the green space coverage of artificial surfaces, such as roof greening are needed. In addition, the government should coordinate and strengthen the pollution control of upstream water sources and landslide control, so as to reduce the accumulation of river nutrients and soil erosion. In the future, we will tend to use nature-based methods to maintain ESs. Researchers should continue to explore the main drivers of various ecosystem services in order to apply them in urban management [3].
This study only analyzed the changes and trade-offs of ESs at a single scale, without considering the changes in the relationship between different ESs under the scale effect. Future researchers should analyze the trade-offs of ES at different scales in order to plan more scientific management strategies. We analyzed the relationship between supporting services and regulating services, and the synergy between them verifies the support of supporting services for other ESs to a certain extent, but cultural services and provision services have not been included in this trade-off study with supporting services, so the guaranteed effect of supporting services cannot be fully verified.

5. Conclusions

In this paper, we evaluated the changes in supporting services and regulating services before and after the construction of China’s first national forest urban agglomeration and analyzed the relationship between various services. In the past 15 years, construction land has increased the most, and cultivated land has decreased the most, followed by woodland. During the study period, except for the increase of NPP, other supporting services and regulating services decreased. The change of land use type is the main reason for the reduction of ESs, but the construction of national forest cities has played a buffer role in this reduction. Supporting services and regulation services show a synergistic relationship, and the inner relationship of the two types of services is positively related, but most of the correlation coefficients decrease with time. We put forward suggestions for the sustainable development of ESs from the perspective of nature-based solutions, to provide references for other regions planning to build national forest cities.

Author Contributions

Conceptualization, methodology, software and writing—original draft preparation, Q.Z.; validation, visualization, writing—review and editing, L.Y.; supervision, project administration and funding acquisition, S.X. All authors have read and agreed to the published version of the manuscript.

Funding

This research was funded by the National Natural Science Foundation of China, grant number 41877411.

Data Availability Statement

Not available.

Conflicts of Interest

The authors declare no conflict of interest.

References

  1. Costanza, R.; d’Arge, R.; de Groot, R.; Farber, S.; Grasso, M.; Hannon, B.; Limburg, K.; Naeem, S.; O’Neill, R.V.; Paruelo, J.; et al. The value of the world’s ecosystem services and natural capital. Nature 1997, 387, 253–260. [Google Scholar] [CrossRef]
  2. Haase, D.; Schwarz, N.; Strohbach, M.; Kroll, F.; Seppelt, R. Synergies, Trade-offs, and Losses of Ecosystem Services in Urban Regions an Integrated Multiscale Framework Applied to the Leipzig-Halle Region, Germany. Ecol. Soc. 2012, 17, 22. [Google Scholar] [CrossRef]
  3. Van den Bosch, M.; Sang, Å.O. Urban natural environments as nature-based solutions for improved public health—A systematic review of reviews. Environ. Res. 2017, 158, 373–384. [Google Scholar] [CrossRef] [PubMed]
  4. Hassan, R.; Scholes, R.; Ash, N. Ecosystems and Human Well-Being: Current State and Trends. J. Bacteriol. 2005, 1, 1387–1404. [Google Scholar] [CrossRef]
  5. Cortinovis, C.; Geneletti, D. Ecosystem services in urban plans: What is there, and what is still needed for better decisions. Land Use Policy 2018, 70, 298–312. [Google Scholar] [CrossRef]
  6. Liang, J.; Li, S.; Li, X.; Li, X.; Liu, Q.; Meng, Q.; Lin, A.; Li, J. Trade-off analyses and optimization of water-related ecosystem services (WRESs) based on land use change in a typical agricultural watershed, southern China. J. Clean. Prod. 2021, 279, 123851. [Google Scholar] [CrossRef]
  7. Rimal, B.; Sharma, R.; Kunwar, R.; Keshtkar, H.; Stork, N.E.; Rijal, S.; Rahman, S.A.; Baral, H. Effects of land use and land cover change on ecosystem services in the Koshi River Basin, Eastern Nepal. Ecosyst. Serv. 2019, 38, 100963. [Google Scholar] [CrossRef]
  8. Bai, Y.; Chen, Y.; Alatalo, J.M.; Yang, Z.; Jiang, B. Scale effects on the relationships between land characteristics and ecosystem services—A case study in Taihu Lake Basin, China. Sci. Total Environ. 2020, 716, 137083. [Google Scholar] [CrossRef]
  9. Ruijs, A.; Wossink, A.; Kortelainen, M.; Alkemade, R.; Schulp, C. Trade-off analysis of ecosystem services in Eastern Europe. Ecosyst. Serv. 2014, 4, 82–94. [Google Scholar] [CrossRef]
  10. Karimi, J.D.; Corstanje, R.; Harris, J.A. Bundling ecosystem services at a high resolution in the UK: Trade-offs and synergies in urban landscapes. Landsc. Ecol. 2021, 36, 1817–1835. [Google Scholar] [CrossRef]
  11. Rodríguez, J.P.; Beard, T.D., Jr.; Bennett, E.M.; Cumming, G.S.; Cork, S.J.; Agard, J.; Dobson, A.P.; Peterson, G.D. Trade-offs across Space, Time, and Ecosystem Services. Ecol. Soc. 2006, 11, 28. [Google Scholar] [CrossRef]
  12. Yang, S.; Bai, Y.; Alatalo, J.M.; Wang, H.; Chen, J. Spatio-temporal changes in water-related ecosystem services provision and trade-offs with food production. J. Clean. Prod. 2020, 286, 125316. [Google Scholar] [CrossRef]
  13. Guo, C.Q.; Xu, X.B.; Shu, Q. A review on the assessment methods of supply and demand of ecosystem services. Chin. J. Ecol. 2020, 39, 2086–2096. [Google Scholar] [CrossRef]
  14. Filho, W.L.; Barbir, J.; Sima, M.; Kalbus, A.; Nagy, G.J.; Paletta, A.; Villamizar, A.; Martinez, R.; Azeiteiro, U.M.; Pereira, M.J.; et al. Reviewing the role of ecosystems services in the sustainability of the urban environment: A multi-country analysis. J. Clean. Prod. 2020, 262, 121338. [Google Scholar] [CrossRef]
  15. Maes, J.; Paracchini, M.L.; Zulian, G.; Dunbar, M.B.; Alkemade, R. Synergies and trade-offs between ecosystem service supply, biodiversity, and habitat conservation status in Europe. Biol. Conserv. 2012, 155, 1–12. [Google Scholar] [CrossRef]
  16. Liao, L.; Zhao, C.; Li, X.; Qin, J. Towards low carbon development: The role of forest city constructions in China. Ecol. Indic. 2021, 131, 108199. [Google Scholar] [CrossRef]
  17. Xu, C.; Dong, L.; Yu, C.; Zhang, Y.; Cheng, B. Can forest city construction affect urban air quality? The evidence from the Beijing- Tianjin-Hebei urban agglomeration of China. J. Clean. Prod. 2020, 264, 121607. [Google Scholar] [CrossRef]
  18. Chen, W.Y. The role of urban green infrastructure in offsetting carbon emissions in 35 major Chinese cities: A nationwide estimate. Cities 2015, 44, 112–120. [Google Scholar] [CrossRef]
  19. Wang, S.; Cui, Z.; Lin, J.; Xie, J.; Su, K. The coupling relationship between urbanization and ecological resilience in the Pearl River Delta. J. Geogr. Sci. 2022, 32, 44–64. [Google Scholar] [CrossRef]
  20. Poniatowski, D.; Stuhldreher, G.; Löffler, F.; Fartmann, T. Patch occupancy of grassland specialists: Habitat quality matters more than habitat connectivity. Biol. Conserv. 2018, 225, 237–244. [Google Scholar] [CrossRef]
  21. Zhu, C.; Zhang, X.; Zhou, M.; He, S.; Gan, M.; Yang, L.; Wang, K. Impacts of urbanization and landscape pattern on habitat quality using OLS and GWR models in Hangzhou, China. Ecol. Indic. 2020, 117, 106654. [Google Scholar] [CrossRef]
  22. Li, H.; Ding, J.; Zhang, J.; Yang, Z.; Yang, B.; Zhu, Q.; Peng, C.; Millington, A. Effects of Land Cover Changes on Net Primary Productivity in the Terrestrial Ecosystems of China from 2001 to 2012. Land 2020, 9, 480. [Google Scholar] [CrossRef]
  23. Zhu, W.; Pan, Y.; Zhang, J. Estimation of Net Primary Productivity of Chinese Vegetation Based on Remote Sensing. Chin. J. Plant Ecol. 2007, 31, 413–424. [Google Scholar]
  24. Rong, T.; Long, L.H. Quantitative Assessment of NPP Changes in the Yellow River Source Area from 2001 to 2017. IOP Conf. Ser. Earth Environ. Sci. 2021, 687, 012002. [Google Scholar] [CrossRef]
  25. Zhang, Q.; Sun, X.; Zhang, K.; Liao, Z.; Xu, S. Trade-Offs and Synergies of Ecosystem Services in the Pearl River Delta Urban Agglomeration. Sustainability 2021, 13, 9155. [Google Scholar] [CrossRef]
  26. Yang, X.; Zhao, Y. Guangdong Statistical Yearbook 2021; Statistics Bureau of Guangdong Province: Beijing, China, 2021. [Google Scholar]
  27. Liu, W.; Zhan, J.; Zhao, F.; Yan, H.; Zhang, F.; Wei, X. Impacts of urbanization-induced land-use changes on ecosystem services: A case study of the Pearl River Delta Metropolitan Region, China. Ecol. Indic. 2019, 98, 228–238. [Google Scholar] [CrossRef]
  28. Wu, J.; Cha, X.; Chen, S.; Mao, L.; Huang, B. Variations of Rainfall Erosivity of Different Magnitudes in Shaoguan from 1951 to 2018. J. Soil Water Conserv. 2021, 35, 21–26. [Google Scholar]
  29. Pan, F.; Ji, C.D. Spatial and Temporal Variation of Service Quality of Habitat Quality Ecosystem in Quanzhou Based on InVEST Model. Geomat. Spat. Inf. Technol. 2019, 42, 151–154. [Google Scholar]
  30. Potter, C.S.; Randerson, J.T.; Field, C.B.; Matson, P.A.; Klooster, S.A. Terrestrial Ecosystem Production: A Process Model Based on Global Satellite and Surface Data. Glob. Biogeochem. Cycles 1993, 7, 811–841. [Google Scholar] [CrossRef]
  31. Su, C.; Dong, M.; Fu, B.; Liu, G. Scale effects of sediment retention, water yield, and net primary production: A case-study of the Chinese Loess Plateau. Land Degrad. Dev. 2020, 31, 1408–1421. [Google Scholar] [CrossRef]
  32. Wang, Y.; Pan, J. Building ecological security patterns based on ecosystem services value reconstruction in an arid inland basin: A case study in Ganzhou District, NW China. J. Clean. Prod. 2019, 241, 118337. [Google Scholar] [CrossRef]
  33. Zhou, R.; Lin, M.; Gong, J.; Wu, Z. Spatiotemporal heterogeneity and influencing mechanism of ecosystem services in the Pearl River Delta from the perspective of LUCC. J. Geogr. Sci. 2019, 29, 831–845. [Google Scholar] [CrossRef]
  34. Wu, X.Y.; Zhang, Y.L.; Jiang, W.K. Spatio-Temporal Evolution of Ecosystem Carbon Storage in Guangdong-Hong Kong-Macao Greater Bay Area. Landsc. Archit. 2020, 27, 57–63. [Google Scholar] [CrossRef]
  35. Wang, X.M.; Liu, X.C.; Long, Y.X. Spatial-Temporal Changes and Influencing Factors of Ecosystem Services in Shaoguan City Based on Improved InVEST. J. Soil Water Conserv. 2020, 27, 381–388. [Google Scholar]
  36. Wang, S.; Huang, L.; Xu, X.; Xu, S. Spatial and temporal evolution of ecosystem sercices and its trade-offs and synergies in Guangdong-HongKong-Macao Greater Bay Area. Acta Ecol. Sin. 2020, 40, 8403–8416. [Google Scholar]
  37. Sharp, R.; Tallis, H.T.; Ricketts, T.; Guerry, A.D.; Wood, S.A.; Chaplin-Kramer, R.; Nelson, E.; Ennaanay, D.; Wolny, S.; Olwero, N.; et al. InVEST User’s Guide; The Natural Capital, Project; Stanford University: Stanford, CA, USA; University of Minnesota: Minneapolis, MN, USA; The Nature Conservancy: Arlington County, VA, USA; World Wildlife Fund: Gland, Switzerland, 2018. [Google Scholar]
  38. Han, H.; Luo, X.; You, R.; Luo, X.; Chen, Y. Analysis of water purification function in the Pearl River basin in Guizhou Province using InVEST model. J. Nanjing For. Univ. 2016, 40, 87–92. [Google Scholar]
  39. Liu, R.; Shen, Z.; Ding, X.; Wu, X.; Liu, F. Application of Export Coefficient Model in Simulating Pollution Load of Non- point Sour ce in Upper Reach of Yangtze River Basin. J. Agro-Environ. Sci. 2008, 27, 677–682. [Google Scholar]
  40. Li, J.; Jiang, H.; Bai, Y.; Alatalo, J.M.; Li, X.; Jiang, H.; Liu, G.; Xu, J. Indicators for spatial-temporal comparisons of ecosystem service status between regions: A case study of the Taihu River Basin, China. Ecol. Indic. 2016, 60, 1006–1008. [Google Scholar] [CrossRef]
  41. Arowolo, A.O.; Deng, X.; Olatunji, O.A.; Obayelu, A.E. Assessing changes in the value of ecosystem services in response to land-use/land-cover dynamics in Nigeria. Sci. Total Environ. 2018, 636, 597–609. [Google Scholar] [CrossRef]
  42. Azhdari, Z.; Sardooi, E.R.; Bazrafshan, O.; Zamani, H.; Ramezani, M. Impact of climate change on net primary production (NPP) in south Iran. Environ. Monit. Assess. 2020, 192, 1–16. [Google Scholar] [CrossRef]
  43. Hu, S.; Chen, L.; Li, L.; Wang, B.; Yuan, L.; Cheng, L.; Yu, Z.; Zhang, T. Spatiotemporal Dynamics of Ecosystem Service Value Determined by Land-Use Changes in the Urbanization of Anhui Province, China. Int. J. Environ. Res. Public Health 2019, 16, 5104. [Google Scholar] [CrossRef] [PubMed]
  44. Wang, W.; Wu, T.; Li, Y.; Xie, S.; Han, B.; Zheng, H.; Ouyang, Z. Urbanization Impacts on Natural Habitat and Ecosystem Services in the Guangdong-Hong Kong-Macao “Megacity”. Sustainability 2020, 12, 6675. [Google Scholar] [CrossRef]
  45. Zhang, X.Y.; Chen, X.M.; Wei, H.; Lin, M.Z. Effect to urbanization on soil organic carbon fractions and carbon pool management index in remnant evergreen broad-leave forests of the Pearl River Delta. J. Soil Water Conserv. 2017, 31, 184–190. [Google Scholar] [CrossRef]
  46. Wang, Y.; Zhao, Y.; Wu, J. Dynamic monitoring of long time series of ecological quality in urban agglomerations using Google Earth Engine cloud computing: A case study of the Guangdong-Hong Kong-Macao Greater Bay Area, China. Acta Ecol. Sin. 2020, 40, 90–102. [Google Scholar]
  47. Fu, Q.; Li, B.; Hou, Y.; Bi, X.; Zhang, X. Effects of land use and climate change on ecosystem services in Central Asia’s arid regions: A case study in Altay Prefecture, China. Sci. Total Environ. 2017, 607, 633–646. [Google Scholar] [CrossRef] [PubMed]
  48. Wang, Y.; Dai, E. Spatial-temporal changes in ecosystem services and the trade-off relationship in mountain regions: A case study of Hengduan Mountain region in Southwest China. J. Clean. Prod. 2020, 264, 121573. [Google Scholar] [CrossRef]
  49. Chen, H.; Zhang, W.; Gilliam, F.; Liu, L.; Huang, J.; Zhang, T.; Wang, W.; Mo, J. Changes in soil carbon sequestration in Pinus massoniana forests along an urban-to-rural gradient of southern China. Biogeosciences 2013, 10, 6609–6616. [Google Scholar] [CrossRef]
  50. Wang, L.; Zheng, F.; Liu, G.; Zhang, X.J.; Wilson, G.V.; Shi, H.; Liu, X. Seasonal changes of soil erosion and its spatial distribution on a long gentle hillslope in the Chinese Mollisol region. Int. Soil Water Conserv. Res. 2021, 9, 394–404. [Google Scholar] [CrossRef]
  51. Yang, C.; Su, Z.A.; Fan, J.R.; Fang, H.D.; Shi, L.T.; Zhang, J.H.; He, Z.Y.; Zhou, T.; Wang, X.Y. Simulation of the landform change process on a purple soil slope due to tillage erosion and water erosion using UAV technology. J. Mt. Sci. 2020, 17, 1333–1344. [Google Scholar] [CrossRef]
  52. Yan, L.-B.; Kasanin-Grubin, M. Land degradation and management of red beds in China:Two case studies. J. Mt. Sci. 2019, 16, 2591–2604. [Google Scholar] [CrossRef]
  53. Qiao, X.; Gu, Y.; Zou, C.; Xu, D.; Wang, L.; Ye, X.; Yang, Y.; Huang, X. Temporal variation and spatial scale dependency of the trade-offs and synergies among multiple ecosystem services in the Taihu Lake Basin of China. Sci. Total Environ. 2018, 651, 218–229. [Google Scholar] [CrossRef] [PubMed]
Figure 1. Location of the study area. DEM: Digital elevation model.
Forests 13 01368 g001
Figure 2. LULC of PRD in 2005 and 2020.
Forests 13 01368 g002
Figure 3. Spatial distribution of ESs in 2005 and 2020. Note: HQ: habitat quality; CS: carbon storage; SR: soil retention.
Forests 13 01368 g003
Table 1. Biophysical data used in the InVEST model.
LULCHjCaboveCbelowCsoilCdeadLoad_pEff_pCrit_lenUsle_cUsle_p
Cultivated land0.561.510.82.24.680.3250.260.15
Woodland0.9215.222.57200.0150.83000.010.7
Grassland0.72.19.59.9920.10.481500.060.6
Waterbody0.500000.0010.0515000.2
Wetland0.8530.752040.0050.815000.2
Construction land0.310.15030.05100.20.16
Bare land0.201500.510.051011
Hj: Habitat suitability for each land use type; Cabove, Cbelow, Csoil, and Cdead represent carbon reserve of aboveground, vegetation roots, soil and dead organic matter, respectively; load_p: nutrient loading in kg/ha/year for each land-use type; eff_p: the maximum retention efficiency for each land-use type (between 0 and 1); crit_len: the distance after which it is assumed that a patch of a particular land-use type retains nutrients at its maximum capacity (m); usle_c: cover-management factor for the USLE (between 0 and 1); usle_p: support practice factor for the USLE (value between 0 and 1).
Table 2. LULC transition matrix for PRD, 2005–2020 (units = km2).
YearLULC2005
Cultivated LandWoodlandGrasslandWaterbodyWetlandConstructionBare LandClass Total
2020Cultivated land10,762.32277.8516.45524.086.79433.180.6112,040.92
Woodland241.8728,334.6451.1962.805.05235.421.4829,043.57
Grassland31.6782.14839.3814.061.8047.940.061030.35
Waterbody567.77131.9915.162834.6438.14143.730.553774.31
Wetland6.215.780.4422.6634.930.901.6679.75
Construction1433.59684.6156.41454.979.855241.277.477948.17
Bare land0.150.210.030.030.000.034.735.77
Class Total13,057.1829,543.23980.543948.12116.896121.6916.63
Image Difference−1016.26−499.6749.82−173.82−37.141826.48−10.86
Table 3. Supporting services and regulating services in 2005 and 2020.
TitleHQ_MeanNPP_MeanCSSoil RetentionP export
2005202020052020200520202005202020052020
Unit//gC/m2gC/m2×105 kg×105 kg×106 t×106 ttt
PRD0.640.62665.96756.702361.342319.201453.621453.532236.662479.80
Guangzhou0.560.54578.03675.52269.91260.67166.67166.69443.68476.82
Shenzhen0.460.41621.97688.5864.6460.0041.1441.14106.72129.15
Foshan0.450.39396.44450.6887.2688.7632.9032.87210.77285.84
Dongguan0.360.31426.87480.3858.6051.6726.6126.61155.33176.61
Huizhou0.710.70766.45898.52568.34560.54358.26358.24394.38432.16
Zhongshan0.430.40435.51490.1339.5238.2018.2318.22115.61124.39
Zhuhai0.480.49553.16617.1742.5841.1023.0523.0285.1279.72
Jiangmen0.650.64731.21814.91397.86392.52223.54223.54381.36411.42
Zhaoqing0.780.77740.48826.36832.64825.74563.22563.21343.68363.71
Table 4. Spearman’s correlation coefficient among ESs.
External rInternal r
ES-ES20052020ES-ES20052020
HQ-CS0.934 **0.937 **HQ-NPP0.696 **0.650 **
HQ-SR0.564 **0.555 **CS-SR0.593 **0.583 **
HQ-WP0.683 **0.681 **CS-WP0.463 **0.463 **
NPP-CS0.722 **0.679 **SR-WP0.193 **0.178 **
NPP-SR0.570 **0.579 **
NPP-WP0.342 **0.307 **
External r: correlation coefficients between two types of ESs; Internal r: correlation coefficients within single type ESs; HQ: habitat quality; CS: carbon storage; SR: soil retention; WP: water purification. ** represents the significant correlation at the level of 0.01 (double-tailed).
Publisher’s Note: MDPI stays neutral with regard to jurisdictional claims in published maps and institutional affiliations.

