Article

Environmental and Plant-Derived Controls on the Seasonality and Partitioning of Soil Respiration in an American Sycamore (Platanus occidentalis) Bioenergy Plantation Grown at Different Planting Densities

1
Ministry of Environment, Urbanization and Climate Change, General Directorate of Combating Desertification and Erosion, 06530 Ankara, Turkey
2
Department of Forestry and Environmental Resources, NC State University, Raleigh, NC 27695, USA
3
Department of Ecosystem Science and Management, Texas A&M University, College Station, TX 77843, USA
4
Nicholas School of the Environment, Duke University, Durham, NC 27708, USA
5
Department of Statistics, NC State University, Raleigh, NC 27695, USA
6
Department of Crop and Soil Science, NC State University, Raleigh, NC 27695, USA
*
Author to whom correspondence should be addressed.
Forests 2022, 13(8), 1286; https://doi.org/10.3390/f13081286
Submission received: 11 July 2022 / Revised: 28 July 2022 / Accepted: 12 August 2022 / Published: 14 August 2022
(This article belongs to the Special Issue Multiple-Use and Ecosystem Services of Forests)

Abstract

:
Bioenergy is one of the most considered alternatives to fossil fuels. Short-rotation woody crops (SRWCs) as bioenergy sources are capable of alleviating energy constraints and sequestering atmospheric CO2. However, studies investigating soil carbon (C) dynamics at SWRC plantations are scarce. We studied American sycamore (Platanus occidentalis) as a model tree species for SRWC at different planting densities ((1) 0.5 × 2.0 m (10,000 trees·ha−1 or tph), (2) 1.0 × 2.0 m (5000 tph), and (3) 2.0 × 2.0 m (2500 tph)) to examine seasonal variation in total soil respiration (Rtotal), partitioned into heterotrophic (Rh) and autotrophic (Ra) respiration, and we evaluated climatic and biological controls on soil respiration. Rtotal and Rh exhibited larger seasonal variation than Ra (p < 0.05). During the nongrowing seasons, the average Rtotal was 0.60 ± 0.21 g·C·m−2·day−1 in winter and 1.41 ± 0.73 g·C·m−2·day−1 in fall. During the growing season, Rtotal was 2–7 times higher in spring (3.49 ± 1.44 g·C·m−2·day−1) and summer (4.01 ± 1.17 g·C·m−2·day−1) than winter. Average Rtotal was 2.30 ± 0.63 g·C·m−2·day−1 in 2500 tph, 2.43 ± 0.64 g·C·m−2·day−1 in 5000 tph, and 2.41 ± 0.75 g·C·m−2·day−1 in 10,000 tph treatments. Average Rh was 1.72 ± 0.40 g·C·m−2·day−1 in 2500 tph, 1.57 ± 0.39 g·C·m−2·day−1 in 5000 tph, and 1.93 ± 0.64 g·C·m−2·day−1 in 10,000 tph, whereas Ra had the lowest rates, with 0.59 ± 0.53 g·C·m−2·day−1 in 2500 tph, 0.86 ± 0.51 g·C·m−2·d−1 in 5000 tph, and 0.48 ± 0.34 g·C·m−2·day−1 in 10,000 tph treatments. Rh had a greater contribution to Rtotal (63%–80%) compared to Ra (20%–37%). Soil temperature was highly correlated to Rtotal (R2 = 0.92) and Rh (R2 = 0.77), while the correlation to Ra was weak (R2 = 0.21). Rtotal, Rh, and Ra significantly declined with soil water content extremes (e.g., <20% or >50%). Total root biomass in winter (469 ± 127 g·C·m−2) was smaller than in summer (616 ± 161 g·C·m−2), and the relationship of total root biomass to Rtotal, Rh, and Ra was only significant during the growing seasons (R2 = 0.12 to 0.50). The litterfall in 5000 tph (121 ± 16 g DW·m−2) did not differ (p > 0.05) from the 2500 tph (108 ± 16 g DW·m−2) or 10,000 tph (132 ± 16 g DW·m−2) treatments. In no circumstances were Rtotal, Rh, and Ra significantly correlated with litterfall amount across planting densities and seasons (p > 0.05). Overall, our results show that Rtotal in American sycamore SRWC is dominated by the heterotrophic component (Rh), is strongly correlated to soil environmental conditions, and can be minimized by planting at a certain tree density (5000 tph).

1. Introduction

Bioenergy has become one of the most considered energy sources as an alternative to fossil fuels, with potential to promote agricultural and environmental sustainability by reducing carbon (C) emissions [1,2,3]. The US Department of Energy characterizes short-rotation woody crops (SRWCs), in addition to perennial herbaceous crops, as capable of alleviating energy constraints and helping to decrease atmospheric CO2 levels [4]. SRWC tree species grown as bioenergy feedstocks can be produced without depleting food supplies, have a net positive energy balance, and contribute to the reduction in greenhouse gas emissions and soil restoration [5]. The most popular SRWC species are poplar (Populus spp.), willow (Salix spp.), sweetgum (Liquidambar styraciflua), black locust (Robinia pseudoacacia), Eucalyptus spp., silver maple (Acer saccharinum L.), and sycamore (Platanus occidentalis) [6]. Although Populus and Salix genera have been the most widely investigated SRWCs in many regions of the US, many species of these genera are not native to the Southeastern USA. These species cannot survive in marginal lands, summer droughts, and high temperatures [7], unlike American sycamore, which is native to the southeastern USA and is viable across a wide range of environmental conditions. American sycamore is a promising species for SRWC culture. It shows high resilience to degraded agricultural soils and has been shown to produce 30% more aboveground biomass than sweetgum plantations under low-intensity management [8].
While many researchers have studied the aboveground productivity of SRWC species, investigation of soil C dynamics of SRWCs is less common. Soil respiration is an important component of the global C budget and is responsible for up to 25% of the land–atmosphere CO2 exchange [9]. Therefore, changes in soil respiration due to land management may have significant implications for atmospheric CO2 concentration [10,11]. Autotrophic respiration from roots and heterotrophic respiration from the decomposition of litter and soil organic matter by soil microorganisms are the two main components of soil respiration [12,13]. The contribution of autotrophic respiration to total soil respiration ranges between 10% and 90% [14,15]. Partitioning root and microbial contributions to soil respiration is complicated [16], but crucial for calculating the C budgets of vegetation and the turnover rate of soil organic matter [17]. There have been three main approaches to differentiating heterotrophic from autotrophic respiration in field studies, including component integration, root exclusion studies, and isotope tracing [14,18]. Among these, the root exclusion method has been recognized as a simple, but effective approach considering the difficulty in measuring root respiration in situ [17]. The root exclusion method entails little disturbance to the trees and has been widely used to provide insights on separating root respiration from soil microbial respiration [17,19]. It is also suitable for maintaining most field conditions and easy to apply under experimental conditions (Li et al., 2010).
Among factors controlling soil respiration, soil temperature [20,21,22] and soil water content [23] are dominant. As the climate warms, there is the potential for heterotrophic respiration to increase, with implications for feedbacks to atmospheric CO2 concentration. Low soil water content limits substrate C availability to microbial communities and, thus, reduces soil respiration [24,25]. However, high soil water content reduces soil respiration by blocking CO2 transport because of low soil effective porosity and diffusion [23,26].
Soil respiration is >90% a biological process; hence, plant-derived factors are important determinants [27]. Roots and microorganisms depend on substrate supply assimilated by plants that are eventually incorporated back into the soil as litter. Autotrophic respiration is closely linked to fine root biomass, and heterotrophic respiration is positively correlated with annual litter production [28].
However, despite the importance of biological control of soil respiration, empirical models have often disregarded biotic factors and focused more on climate variables, since vegetation productivity and climate are correlated, and their effects on soil respiration cannot be disentangled [27]. Nevertheless, it was reported that it is possible to separate climatic and biological effects on soil respiration, and that a biologically driven model explained sixfold more variance of soil respiration than a climate-driven model [27,29]. Disentangling climate and biological effects on soil respiration is still under debate [30,31,32].
The degree to which soil respiration in bioenergy plantations is climate-driven or biologically driven requires further investigation.
Contrasting findings on the main determinants of soil respiration are only correlative relationships, obscured by the background correlation between productivity and climate. A key question arises as to whether soil respiration and its components respond differently to changing environmental and biological conditions [12,13]. Quantitatively describing environmental and biological factor impacts on soil respiration is necessary to improve models of soil respiration [16,33,34].
SRWC tree planting density controls the degree of aboveground vegetation cover, affecting light penetration and associated weed development [35]. The selection of planting density has important economic consequences, as it impacts rotation length and establishment costs [36]. Studies regarding fast-growing species have shown that low-density tree planting has strong positive effects on individual stem diameter, volume, and quality [37,38]. High-density tree planting requires a larger initial financial commitment, but will result in faster site occupation, shading out competing plants and reducing weed control requirements [8]. Growing American sycamore at a higher planting density resulted in smaller individual trees in addition to higher total aboveground biomass production [39], yet how it affects soil C cycling is still unclear.
Planting density effects on soil respiration of sycamore SRWC have not been studied extensively. However, a study in SRWC of Populus and Salix showed that higher planting density was associated with higher total soil respiration rates compared to lower planting density [40]. Lastly, quantitative information on the seasonal changes in soil respiration and its partitioning in bioenergy SRWC is lacking.
To address these knowledge gaps of soil C cycling in SRWC, we conducted a year-long field study using a 4 year old American sycamore plantation at three different planting densities under a low-input regime in the Piedmont region of central North Carolina. We aimed to quantify total soil respiration (Rtotal), partitioned into heterotrophic (Rh) and autotrophic (Ra) components, and we examined the effects of planting density and seasonality on soil CO2 efflux. We also determined the major environmental and plant-mediated drivers of Rtotal, Rh, and Ra. We hypothesized that (1) Rtotal, Rh, and Ra would be higher during the growing season than in the nongrowing season due to higher soil temperature, adequate soil moisture, higher root biomass, and higher litterfall production, (2) that the contribution of Rh to Rtotal would be greater than Ra, (3) that the influence of soil temperature would be more significant than that of the soil water content (SWC), and (4) that environmental factors (e.g., soil temperature and SWC would have a greater effect on soil respiration than plant controls (e.g., root biomass and litterfall).

2. Materials and Methods

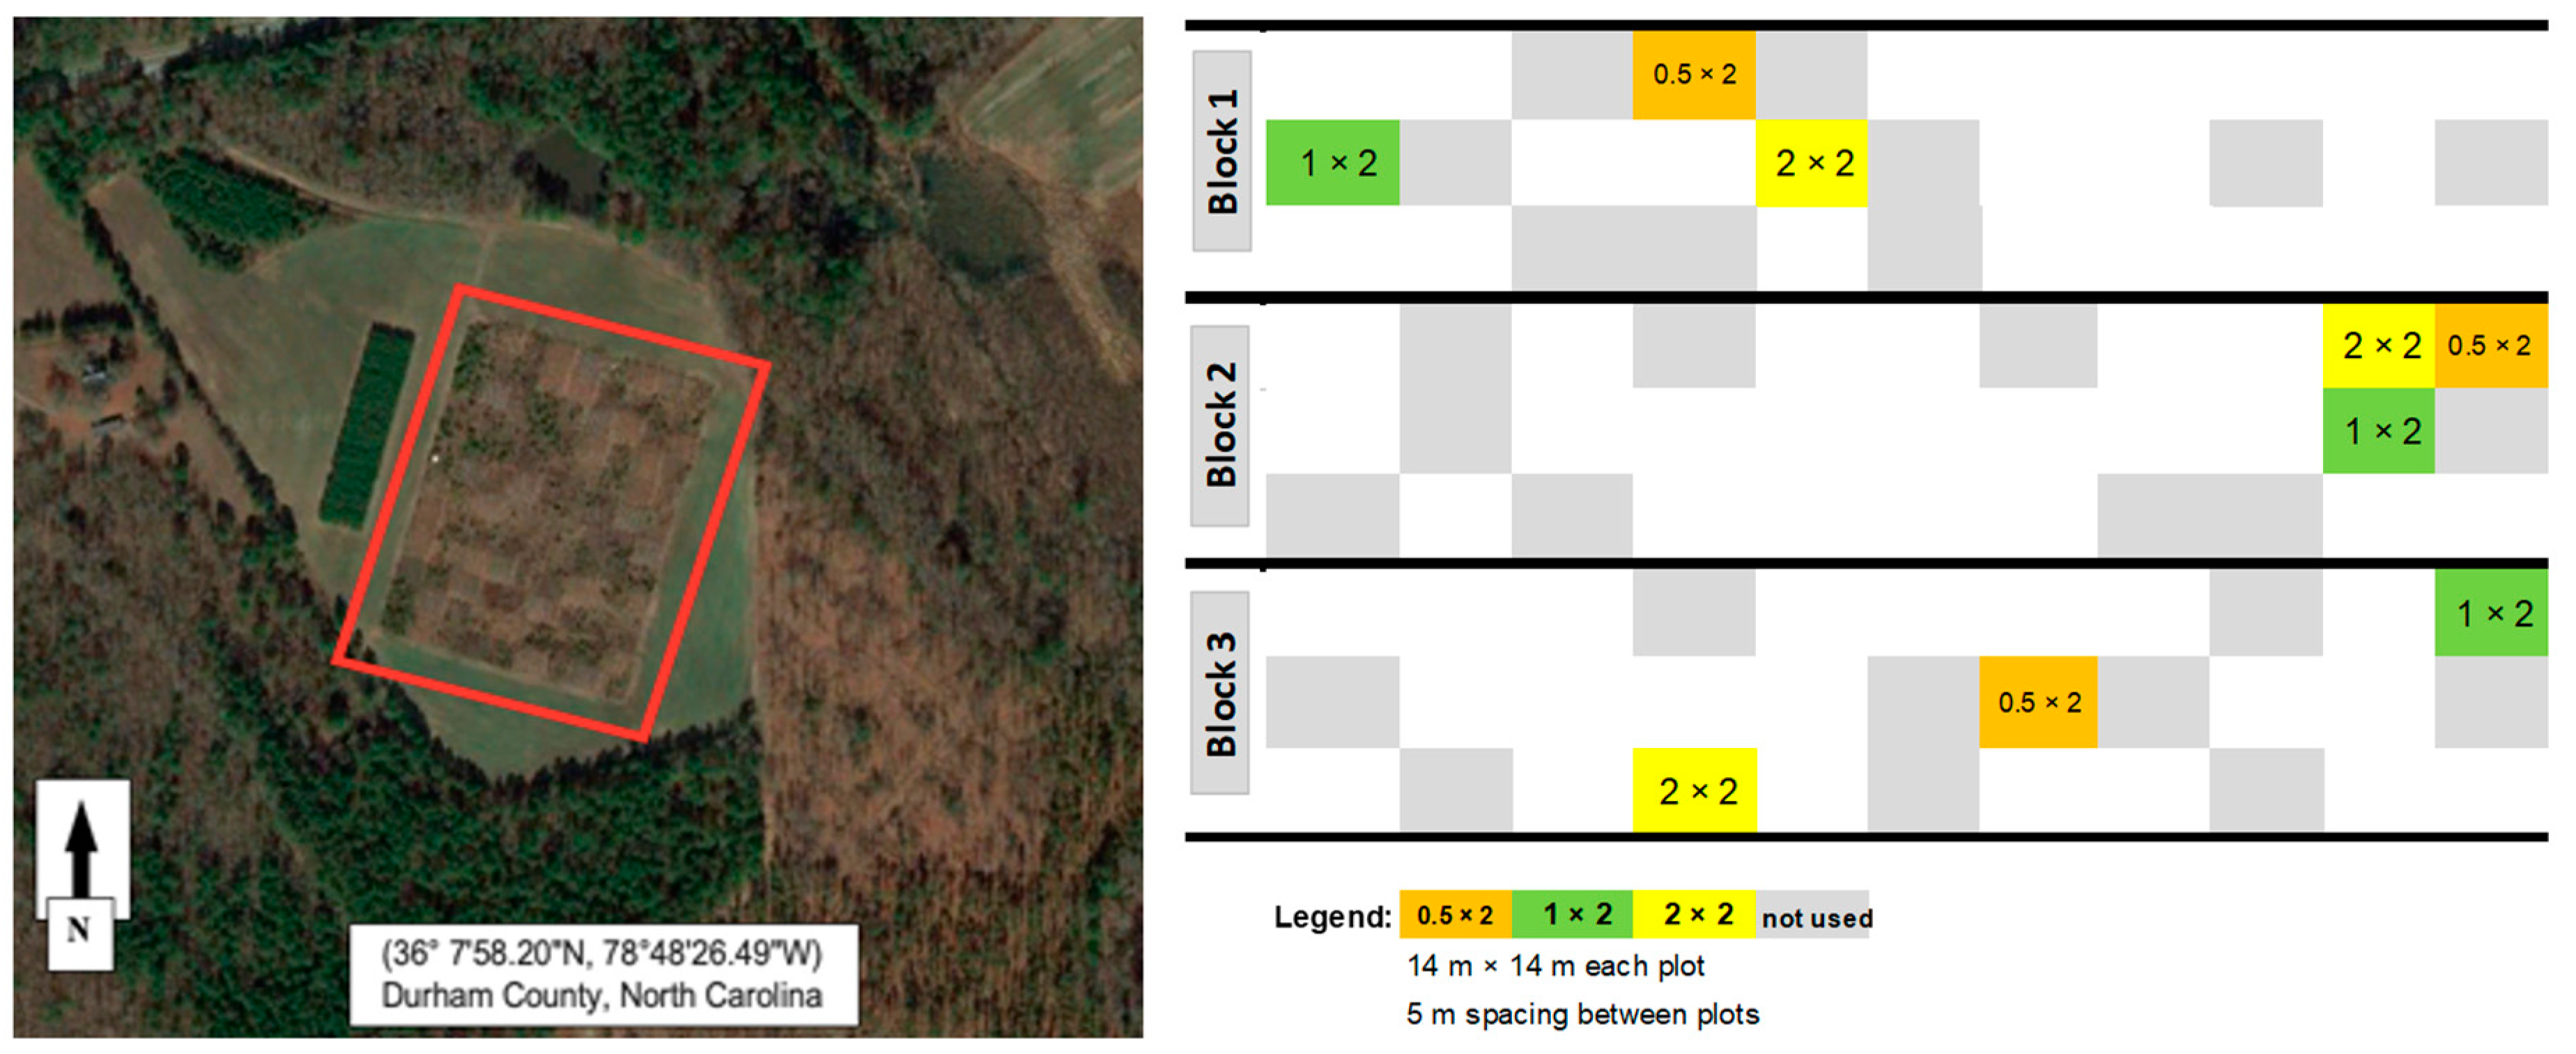
2.1. Site Description

This study was conducted at a North Carolina Department of Agriculture and Consumer Services research station near Butner, North Carolina (36°7′58.20″ N, 78°48′26.49″ W) (Figure 1) in a bioenergy field trial in its second rotation, following coppicing in 2014. At this site, elevation is approximately 86 m above sea level, mean annual precipitation is 1412 mm, and mean temperature is 21.0 °C in summer and 7.8 °C in winter. The soil is mapped as Creedmoor sandy loam with 13% clay, 25% silt, and 62% sand texture (https://websoilsurvey.sc.egov.usda.gov/) accessed on 15 June 2017. During the first rotation cycle, bare-root American sycamore (Platanus occidentalis L.) seedlings were purchased from the North Carolina Forest Service and hand-planted in winter 2010 [39]. During the first growing season, weed competition was controlled by glyphosate herbicide and mowing between the tree rows to aid tree establishment, but no other inputs were applied thereafter. Trees were harvested after the fourth growing season in winter 2013–2014. For the current study, sampling was conducted from July 2017 to August 2018, at which time the second-rotation trees were 3 years old.

2.2. Experimental Design

The experiment was set up as a randomized complete block design of factorial treatments of planting density (three levels), replicated three times (Figure 1) [39]. Seasons were defined as winter (January–March), spring (April–June), summer (July–September), and fall (October–December). The planting density treatments were (1) 0.5 × 2.0 m (10,000 trees·ha−1 or tph), (2) 1.0 × 2.0 m (5000 tph), and (3) 2.0 × 2.0 m (2500 tph). Each of the three planting density treatments was replicated three times for a total of nine plots dispersed across three blocks.

2.3. Soil Respiration Measurements

We used the nested collar approach to partition total soil respiration into heterotrophic and autotrophic components [41]. We used three pairs of randomly located shallow collars per plot, one set measuring bulk soil only (i.e., total soil respiration) and the other measuring soil in which living roots had been severed by insertion of deep collars around the shallow collars (i.e., heterotrophic soil respiration). Dimensions of the shallow collars were 10.4 cm diameter and 5.0 cm height, inserted 2.0 cm into the soil. Dimensions of the deep collars were 15.4 cm diameter and 35.0 cm height, inserted 30.0 cm into the soil. All soil respiration collars were installed in mid-May 2017. To reduce disturbance-induced CO2 efflux, collars were installed at least 1.5 months before the soil respiration measurements began. No vegetation was allowed to grow near each deep collar setup to prevent roots from entering below. All soil respiration measurements were made with a portable gas exchange system (PP Systems EGM-4 CO2 Gas Analyzer, Amesbury, MA, USA). Total soil respiration (Rtotal) and heterotrophic respiration (Rh) measurements occurred twice monthly from July 2017 through August 2018. Measurements from each of the three blocks were taken between 9:00 a.m. and 2:00 p.m. using the EGM-4 Gas Analyzer. Three subsample measurements were taken in each plot for Rtotal and Rh, for a total of six measurements per treatment plot. A single plot mean for each efflux component was calculated from the three subsample measurements. Autotrophic respiration (Ra) was estimated as the difference between Rtotal and Rh.

2.4. Meteorological Measurements

Individual spot measurements of soil temperature (5 cm depth) and soil water content (SWC) (0–12 cm depth) were taken adjacent to shallow collars and inside the deep collars at each subsample location following the Rtotal and Rh measurements. Soil temperature at 10 cm depth was measured using a digital thermometer and soil water content was measured using a Field Scout TDR 300 (Spectrum Technologies, Aurora, IL, USA) with 12 cm long soil probes. Precipitation data were obtained from the nearest US Weather Service station in Butner, North Carolina.

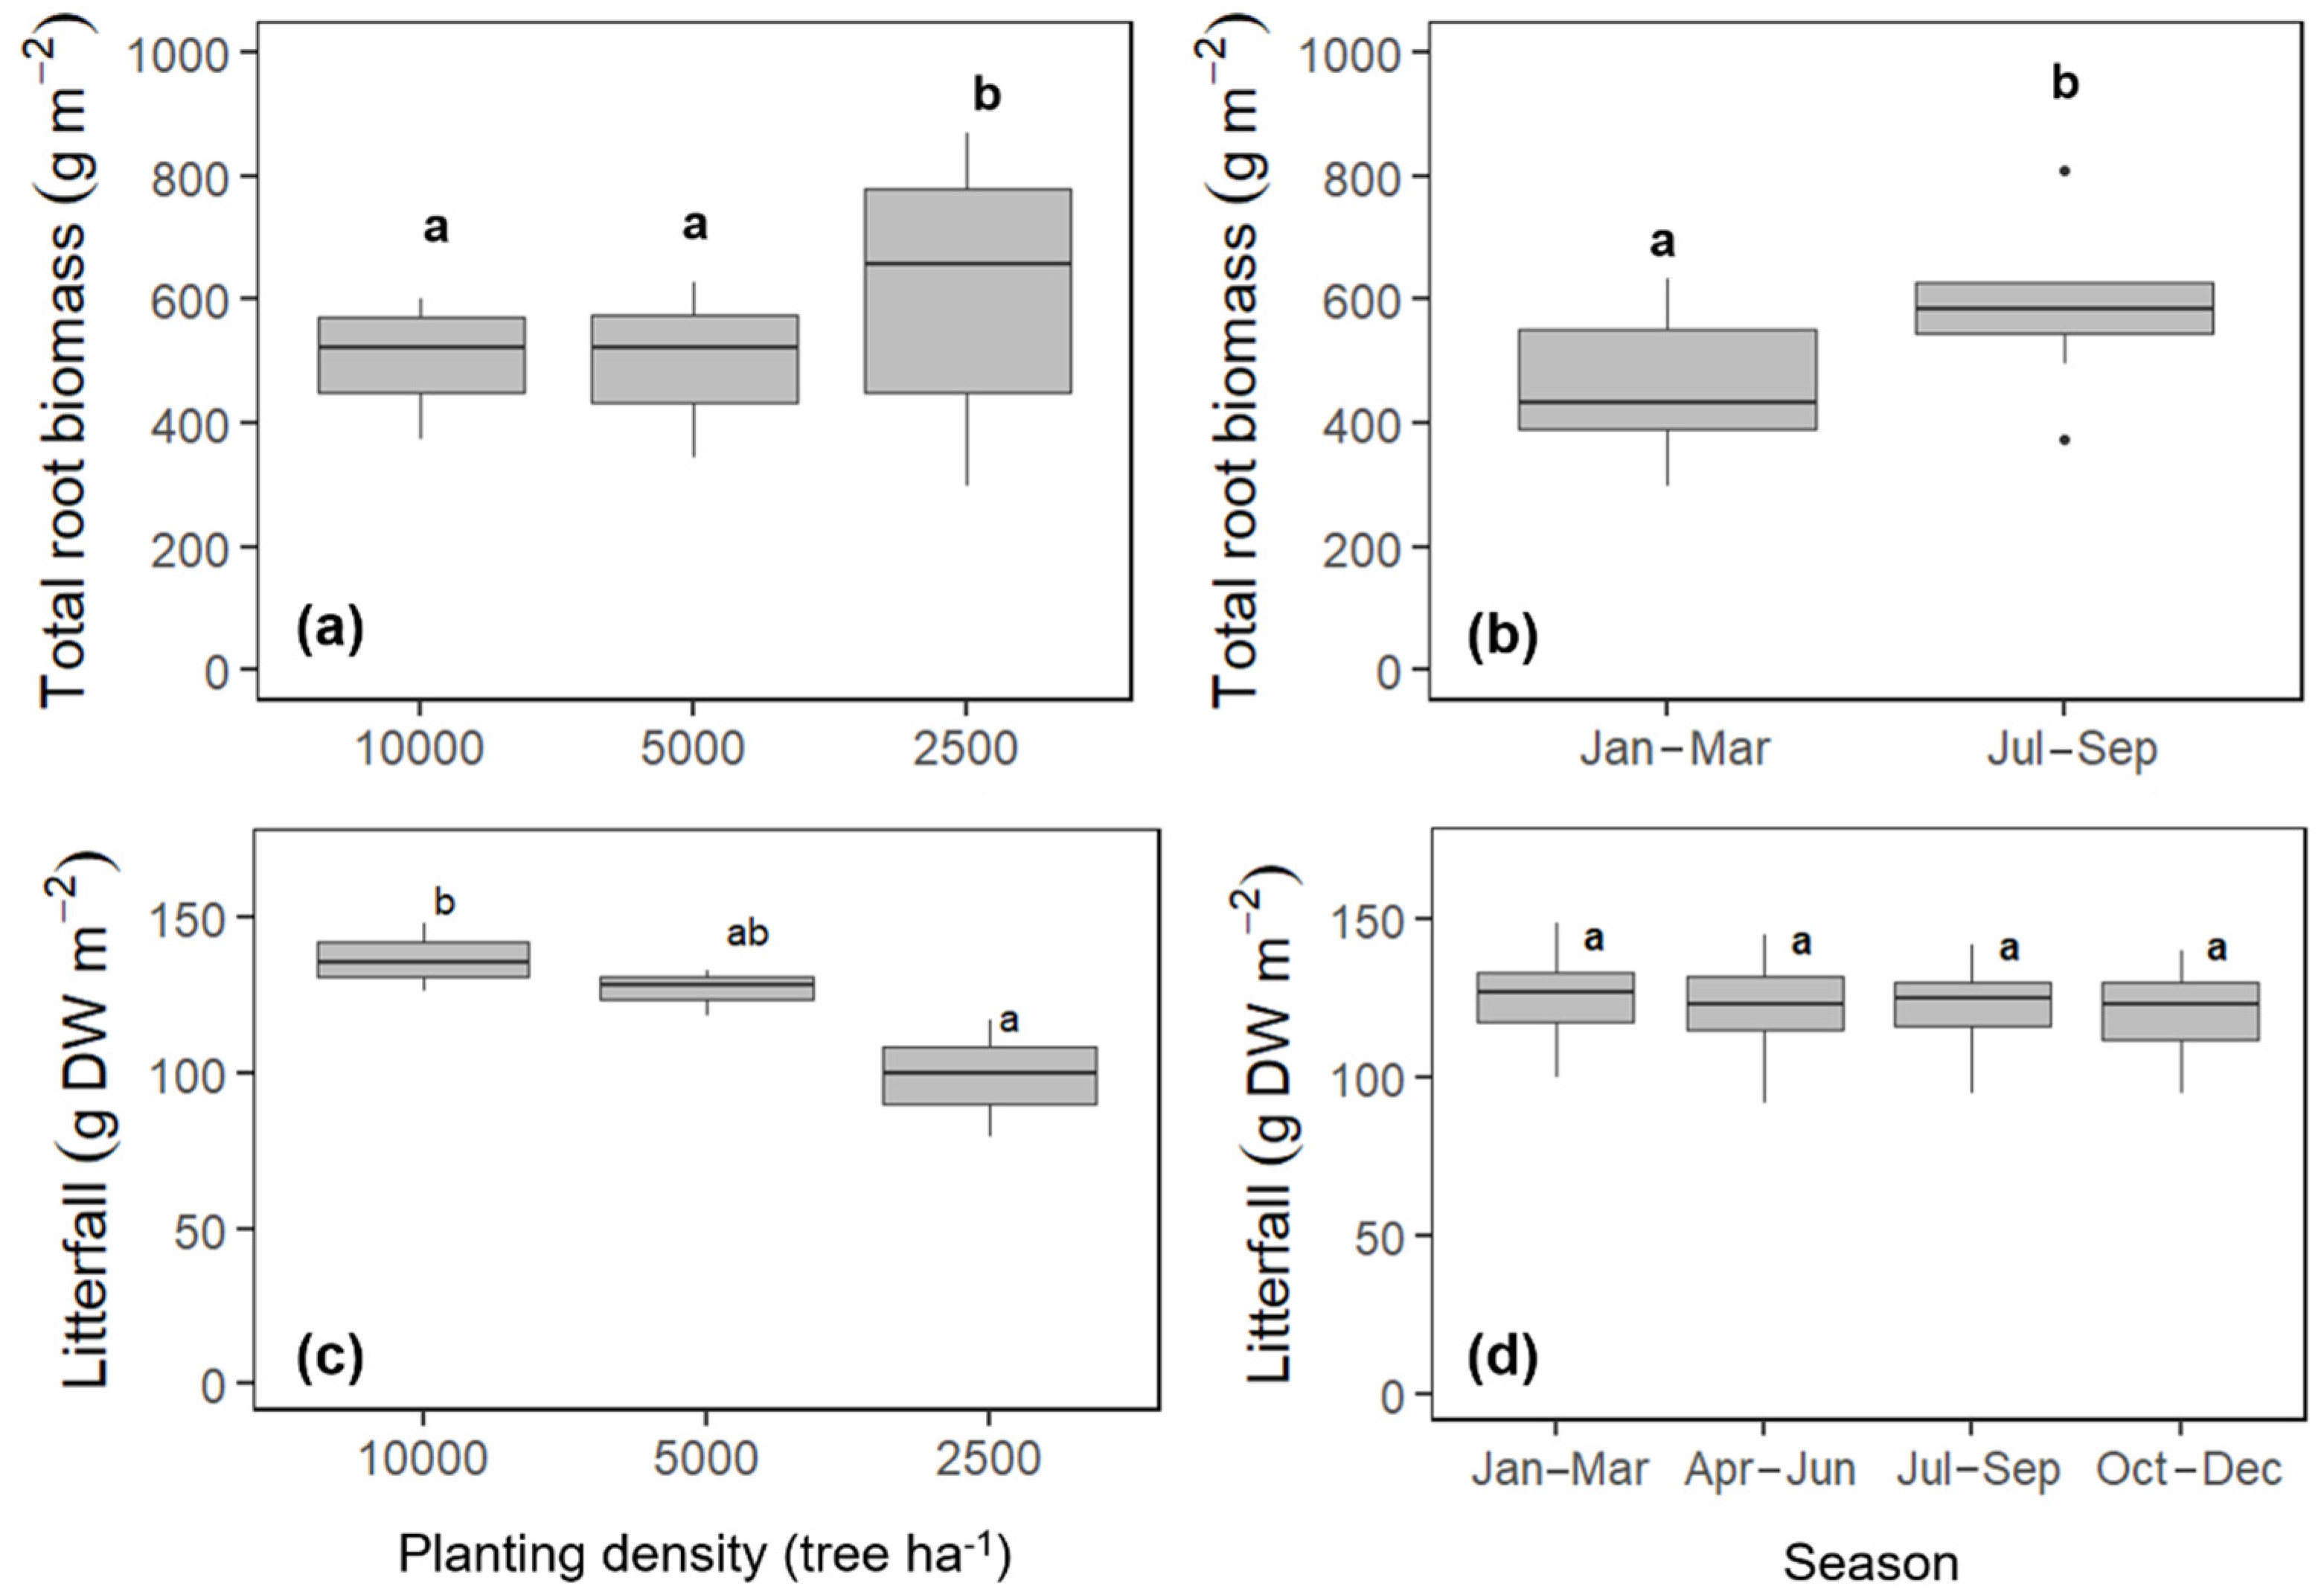
2.5. Root Biomass and Litterfall

Total root biomass was estimated by obtaining five soil cores (5 cm diameter × 15 cm deep) from each of the nine plots in August 2017 (summer data) and February 2018 (winter data). Soil samples were soaked in water to loosen attached soil particles. Roots and organic matter were extracted manually by wet sieving using a 2 mm mesh sieve. Roots/organic matter were dried at 70 °C for 3 days and then weighed. Total root biomass is the combined coarse and fine roots extracted after sieving. Litterfall was collected from July 2017 to January 2018, at the same time the soil respiration measurements were taken. Litterfall was collected monthly using a single round collector (2500 cm2) suspended above the forest floor and randomly located in each plot. The collected surface litters were stored in paper bags and dried to constant mass at 70 °C in the lab.

2.6. Data Analysis

The field study was set up as a randomized complete block design of tree planting density, replicated three times. Before analysis, all variables were checked for normal distributions and homogeneity of variance, and appropriate transformations were applied to meet assumptions of ANOVA. Significant differences for all statistical tests were evaluated at the level of α = 0.05. The Tukey HSD Test was used for post hoc comparisons of means. Linear relationships were examined with a locally weighted linear regression in the ggplot2 package. All analyses were processed in R version 4.1.2 [42].

3. Results

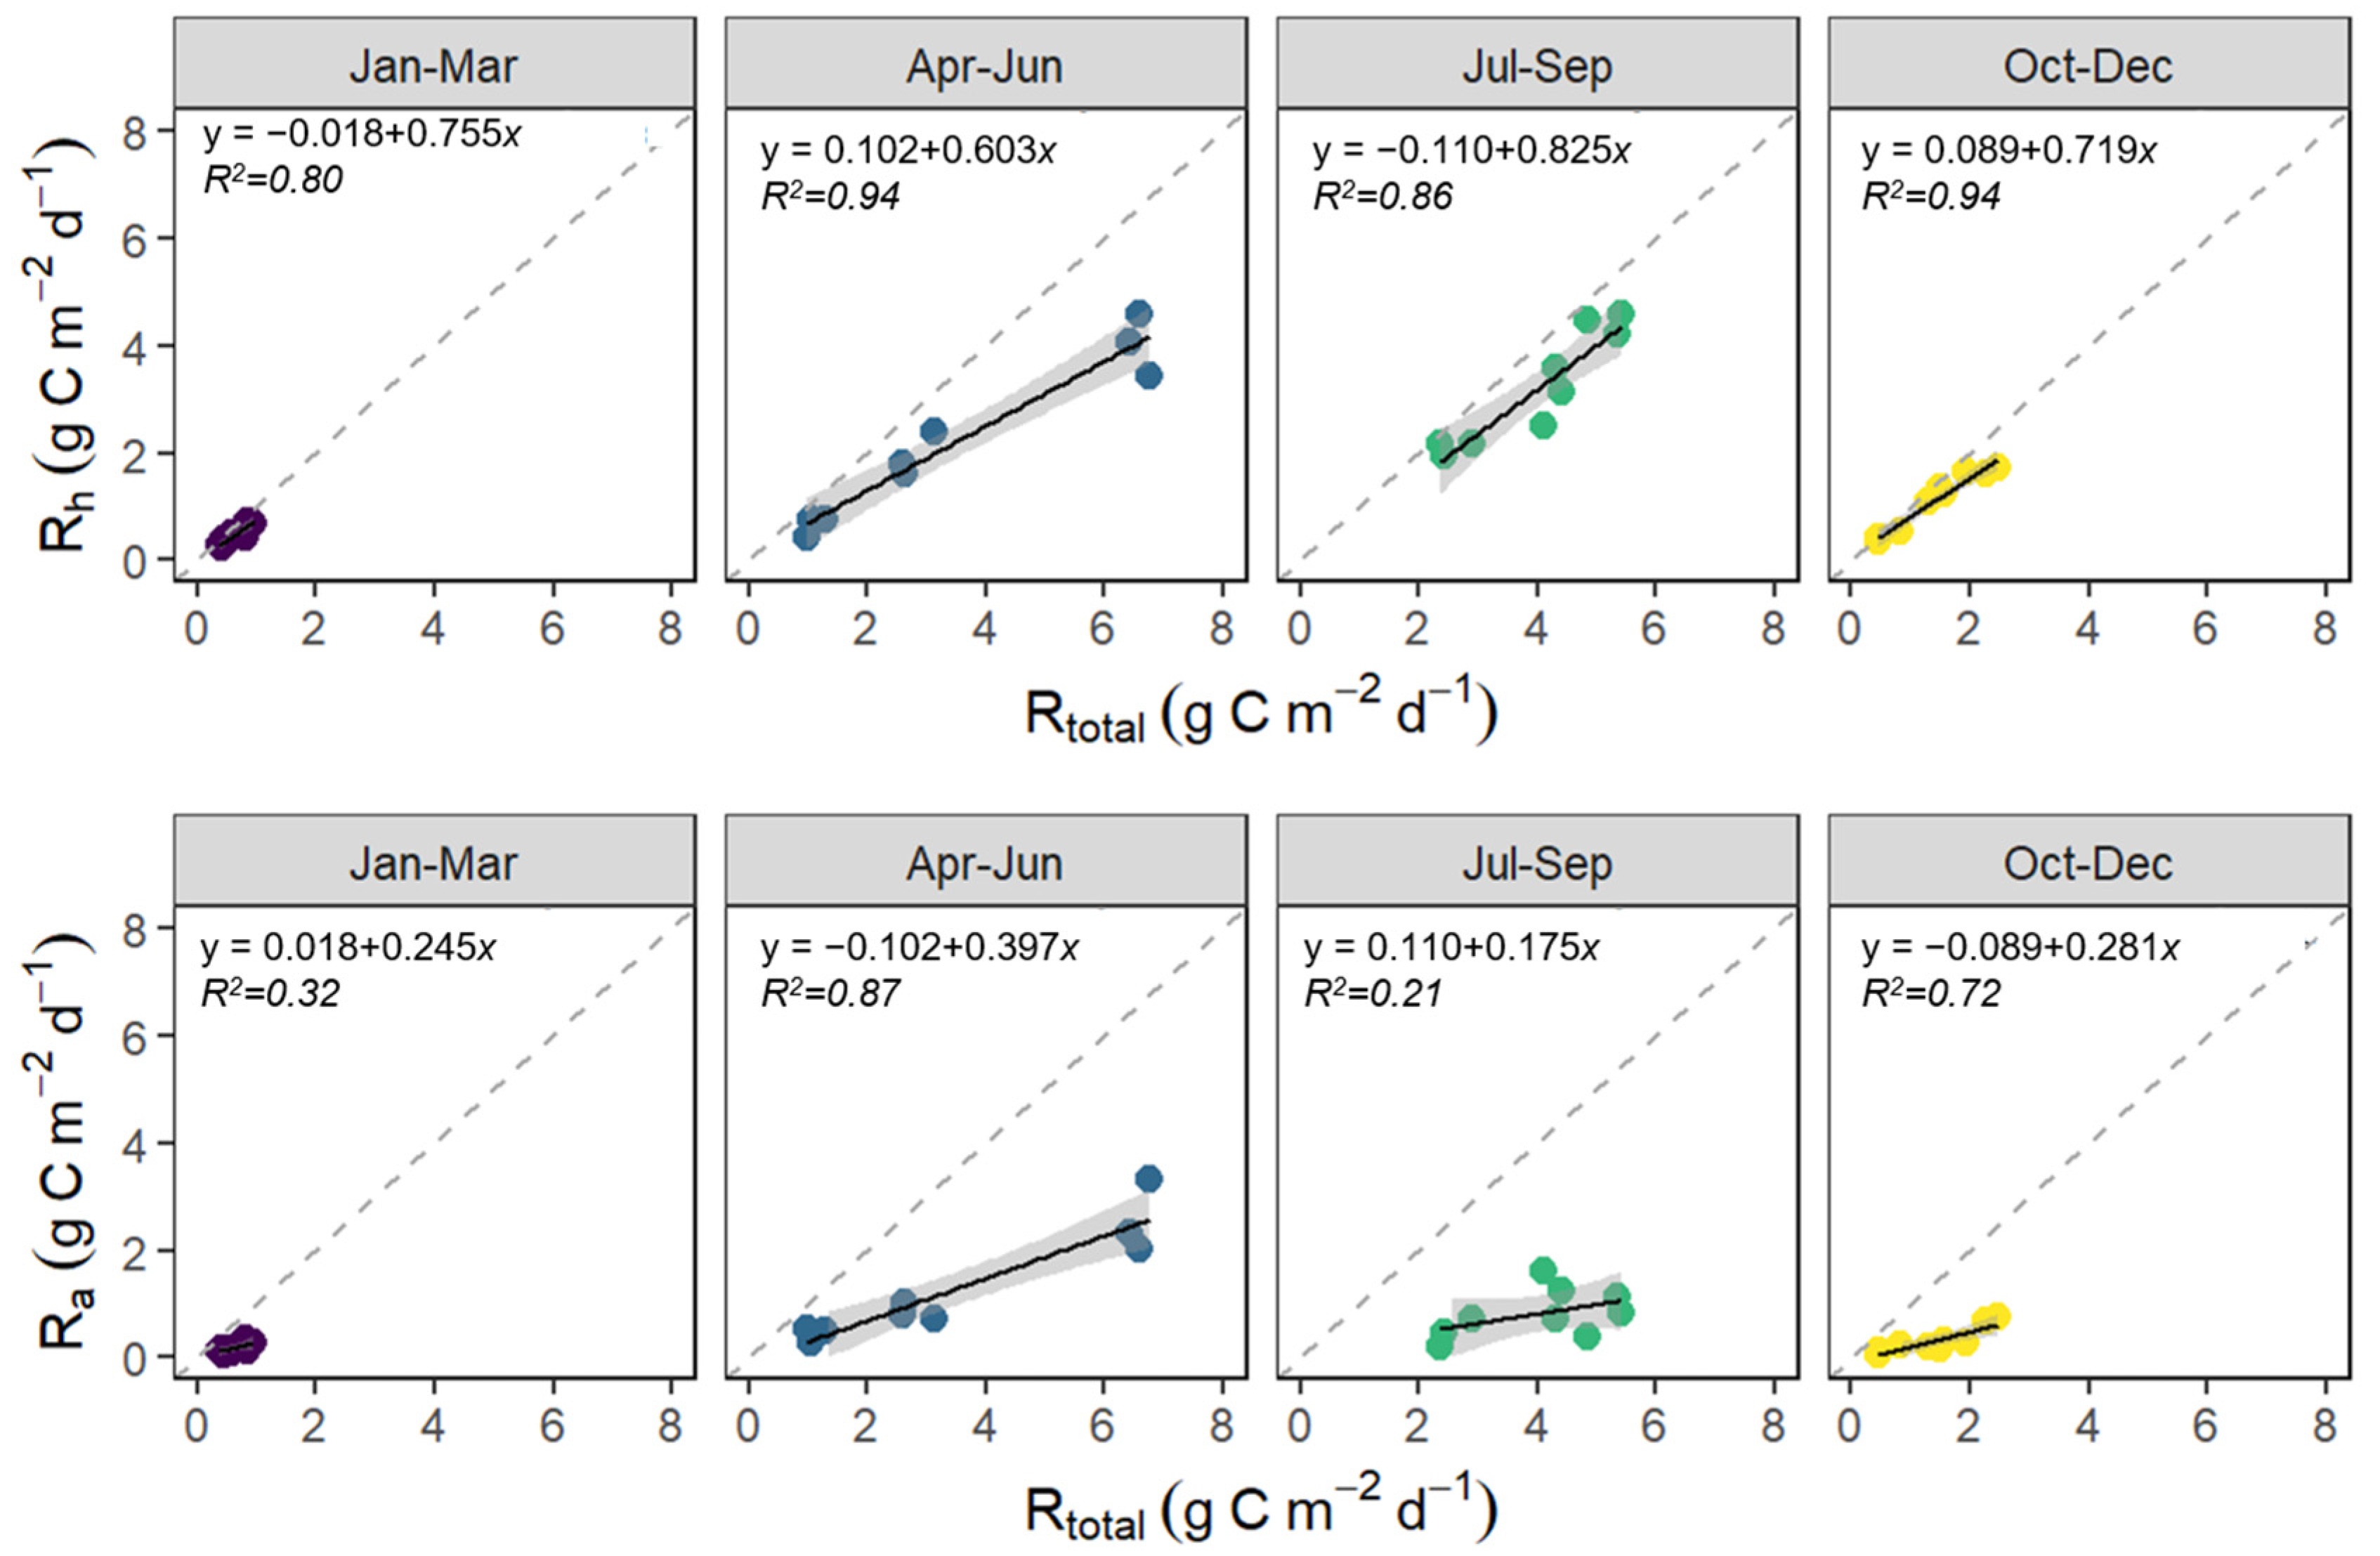
3.1. Seasonal Variation in Rtotal, Rh, and Ra

A very distinct seasonal trend was observed in Rtotal, Rh, and Ra. All soil respiration components were at their lowest during winter (January–March), gradually increased in spring (April–June), and remained relatively high during summer (July–September), before gradually decreasing toward fall (October–December) (Table 1). During the nongrowing season, the average Rtotal was 0.60 ± 0.21 g·C·m−2·day−1 in winter and 1.42 ± 0.29 g·C·m−2·day−1 in fall. However, the average Rtotal was 2–5 times higher in spring (3.50 ± 1.09 g·C·m−2·day−1) and 3–7 times higher in summer (4.01 ± 1.11 g·C·m−2·day−1) compared to the nongrowing season values. Average Rh was 0.43 ± 0.17 g·C·m−2·day−1 in winter, 1.11 ± 0.21 g·C·m−2·day−1 in fall, 2.21 ± 0.62 g·C·m−2·day−1 in spring, and 3.20 ± 0.89 g·C·m−2·day−1 in summer. Average Ra was 0.17 ± 0.18 g·C·m−2·day−1, 1.28 ± 0.85 g·C·m−2·day−1, 0.81 ± 0.60 g·C·m−2·day−1, and 0.31 ± 0.20 g·C·m−2·day−1 in winter, spring, summer, and fall, respectively. In general, all respiration components across all treatments between the winter and fall and between the spring and summer were not statistically different (p > 0.05, Table 1).

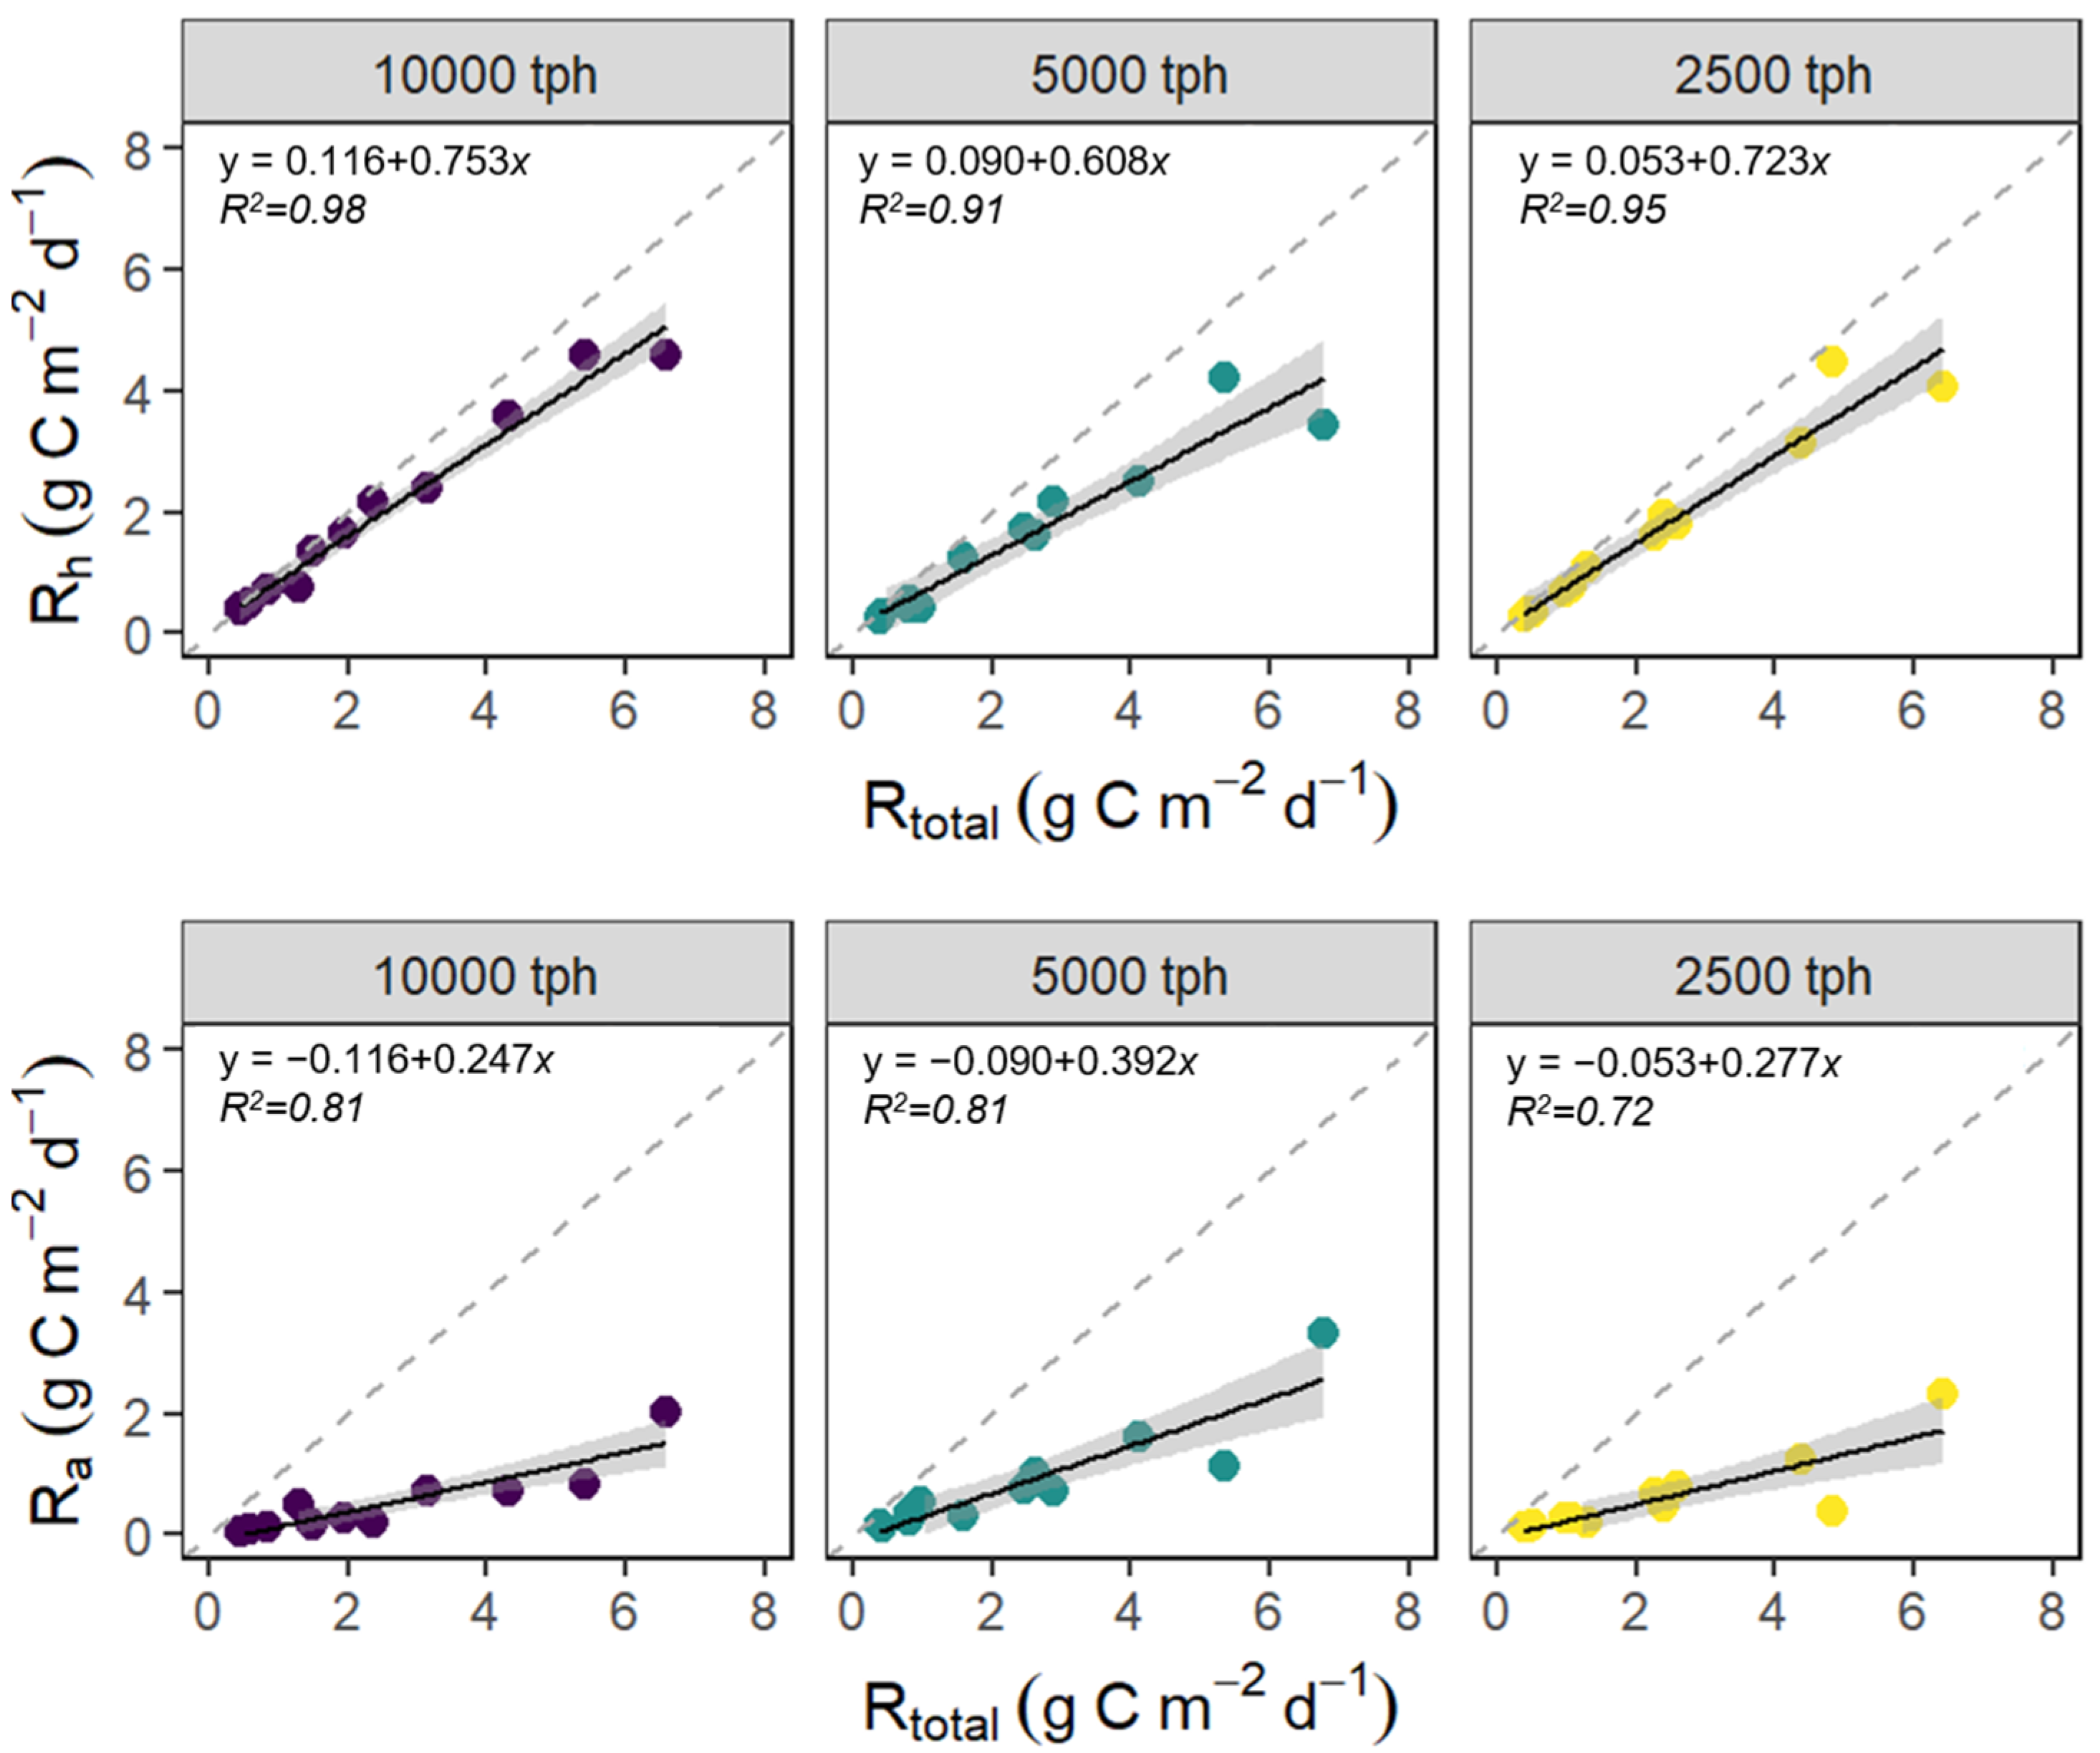
3.2. Variation in Rtotal, Rh, and Ra due to Planting Density

Average Rtotal was 2.30 ± 0.63 g·C·m−2·day−1 in 2500 tph, 2.43 ± 0.64 g·C·m−2·day−1 in 5000 tph, and 2.41 ± 0.75 g·C·m−2·day−1 in 10,000 tph treatments (Table 1). Average Rh was 1.72 ± 0.40 g·C·m−2·day−1 in 2500 tph, 1.57 ± 0.39 g·C·m−2·day−1 in 5000 tph, and 1.93 ± 0.64 g·C·m−2·day−1 in 10,000 tph, whereas Ra had the lowest rates, with 0.59 ± 0.53 g·C·m−2·day−1 in 2500 tph, 0.86 ± 0.51 g·C·m−2·day−1 in 5000 tph, and 0.48 ± 0.34 g·C·m−2·day−1 in 10,000 tph treatments. There were no significant differences in Rtotal at different planting densities (p > 0.05). Only Rh and Ra in 10,000 tph and 5000 tph were statistically different (p < 0.05), showing the lowest Rh at 5000 tph and the lowest Ra at 10,000 tph (Table 1).

3.3. The Contribution of Rh and Ra to Rtotal

Seasonally, heterotrophic respiration contributed 63%–78% of the total soil respiration, while autotrophic respiration contributed 20%–36% (Figure 2), indicating that Rh was the primary driver of Rtotal (p < 0.05). Regression of Rh on Rtotal produced R2 from 0.82 to 0.96 seasonally (Figure 2), while the Ra to Rtotal relationship correlated well during the leaf expansion season in April–June (R2 = 0.87) and during leaf senescence in October–December (R2 = 0.72). Interestingly, the Ra–Rtotal relationship was weakest in summer (July–September; R2 = 0.21).
Estimates based on planting density treatment effect showed that heterotrophic respiration contributed 65%–80% of Rtotal leaving the contribution of Ra to be only 20%–35% (Figure 3). As a result, Rtotal could be explained better by Rh than Ra regardless of planting density (p < 0.05). The Rh–Rtotal linear relationship based on planting density produced R2 from 0.91 to 0.98, while the Ra–Rtotal relationship only ranged from R2 = 0.72 to R2 = 0.81.

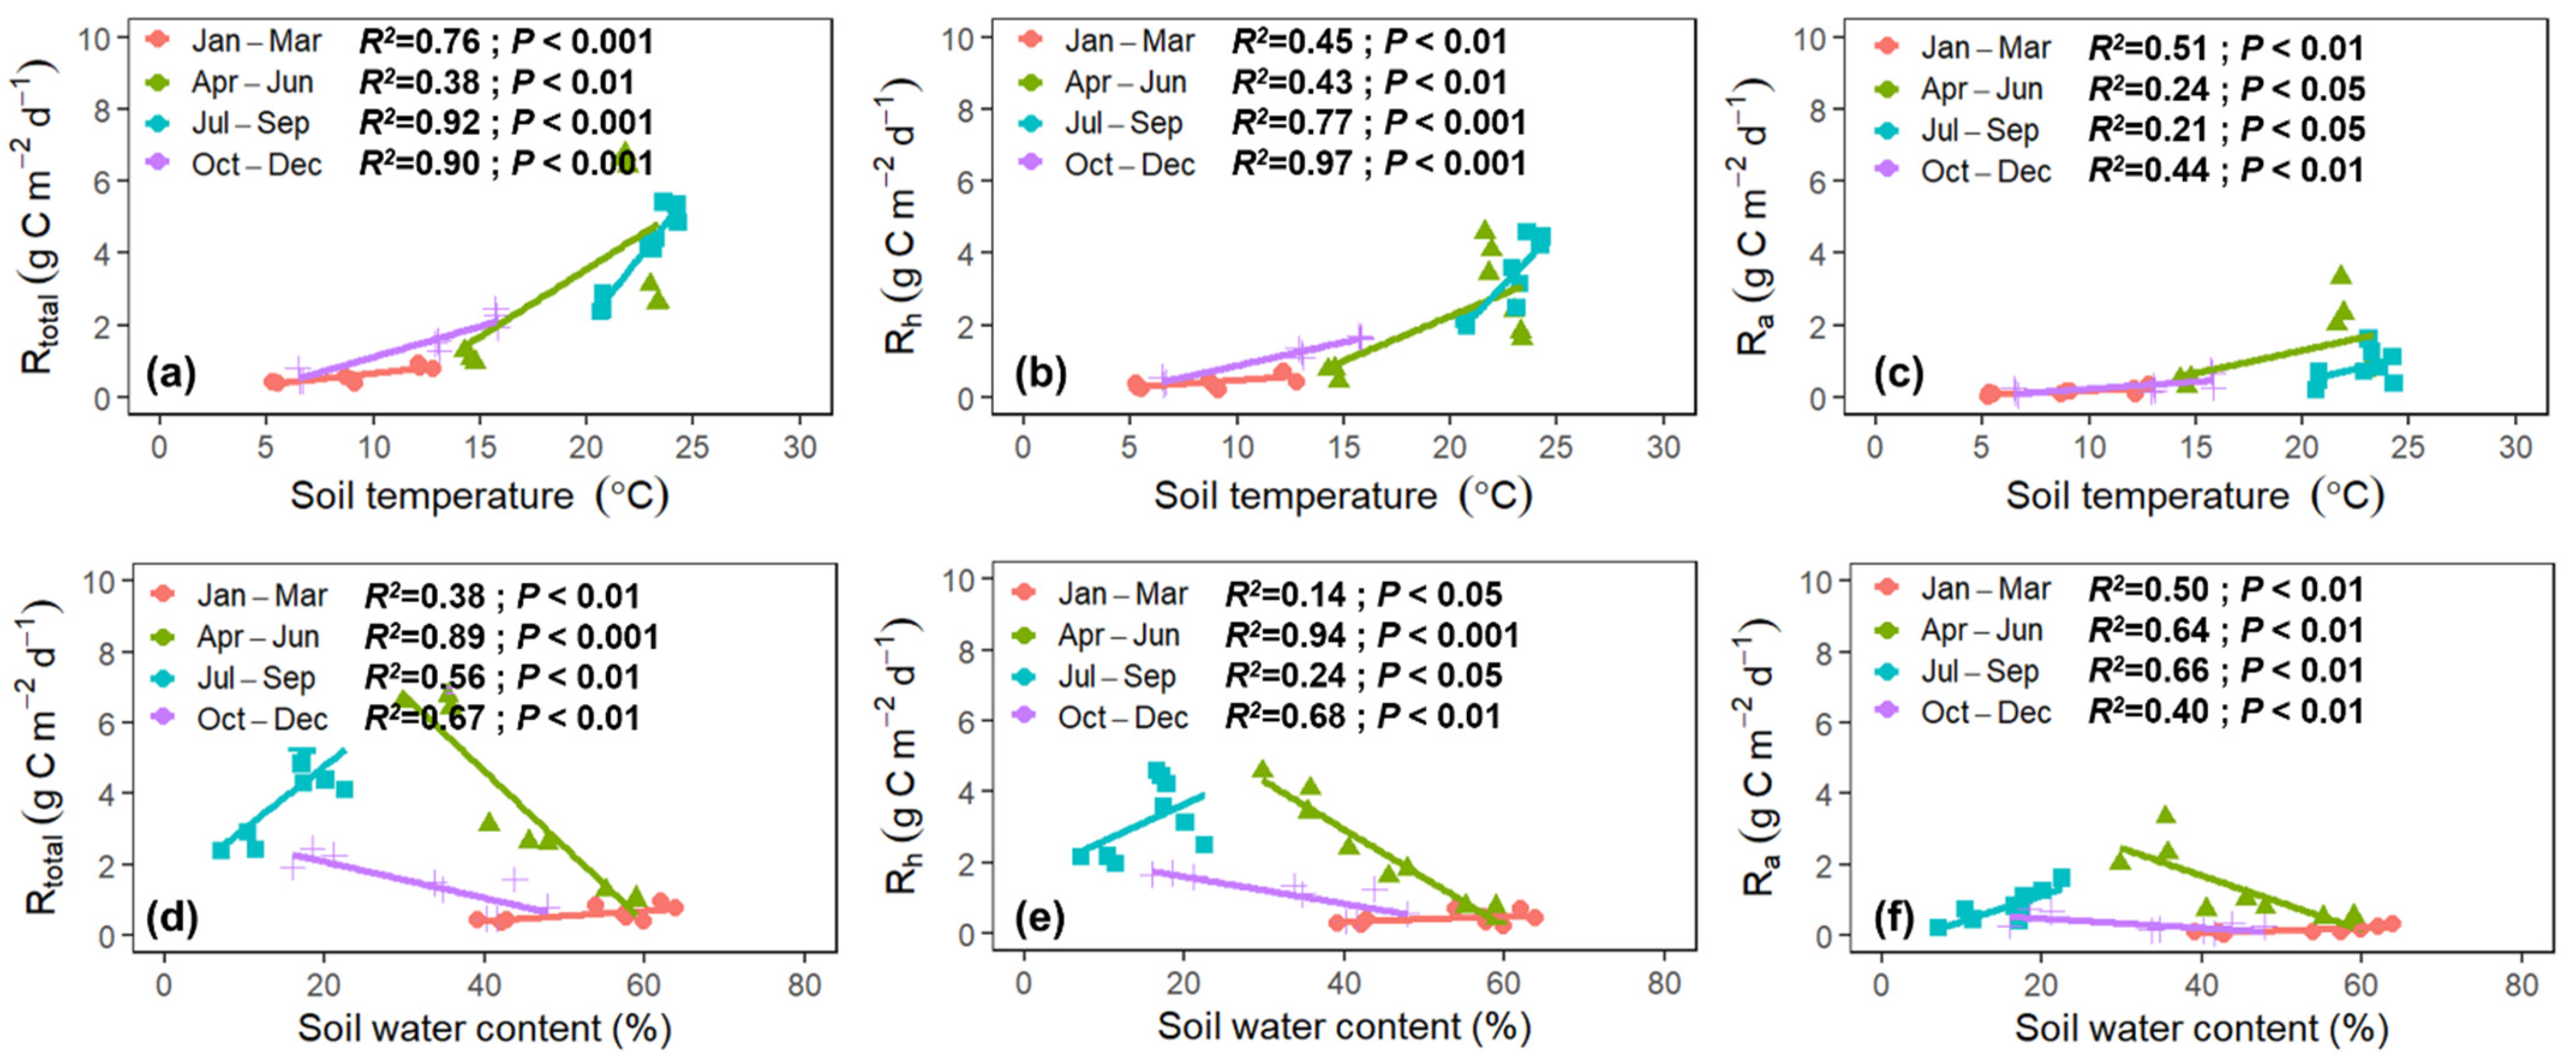
3.4. Environmental Drivers of Rtotal, Rh, and Ra

Soil respiration was strongly correlated to soil temperature regardless of the season. However, the Rtotal–soil temperature relationship during the bud break and leaf expansion period (April–June) was weaker (R2 = 0.38) compared to the remaining seasons (R2 = 0.76 to 0.92, Figure 4a). During the peak of summer in July–September, the Rtotal–soil temperature relationship was the strongest (R2 = 0.92). The effect of soil temperature on heterotrophic respiration was greatest during the fall when sycamore had shed leaves (R2 = 0.97), but it was weakest during winter (R2 = 0.45) and spring (R2 = 0.43) (Figure 4b). The Ra–soil temperature relationship was strongest during winter (R2 = 0.51) and fall (R2 = 0.44). However, during the growing season (April to September), soil temperature only explained about 20% of the variation in Ra (Figure 4c). Overall, the relationship of soil temperature across all seasons was R2 = 0.70, R2 = 0.71, and R2 = 0.39 for Rtotal, Rh, and Ra, respectively.
Soil water content had a significant effect on Rtotal, Rh, and Ra (p < 0.05) across all seasons, but the strength of the relationship was highly variable, ranging from R2 = 0.14 to R2 = 0.94 (Figure 4d–f). During the growing season, there was a distinct pattern of increasing soil respiration when soil water content was within the range of 25%–40% SWC. However, Rtotal, Rh, and Ra were relatively low at extremes of soil water content, such as in summer when SWC dropped below 25% or when it exceeded 50% in winter. Across the whole seasons, the soil moisture–soil respiration relationship was R2 = 0.32, R2 = 0.43, and R2 = 0.07 for Rtotal, Rh, and Ra, respectively.
To remove any possible confounding effects of soil temperature on soil water content, we normalized Rtotal, Rh, and Ra by soil temperature. Linear models were created to determine the residuals from soil temperature and Rtotal, Rh, and Ra relationships. The residuals were used to analyze the relationship of soil temperature-normalized Rtotal, Rh, and Ra with SWC during a given period. We found that the correlation of soil water content to Tsoil-normalized Rtotal decreased from R2 = 0.32 to R2 = 0.04 after normalization (Supplemental Figure S1). The Tsoil-normalized Rh correlation also decreased by half from R2 = 0.44 to R2 = 0.24.

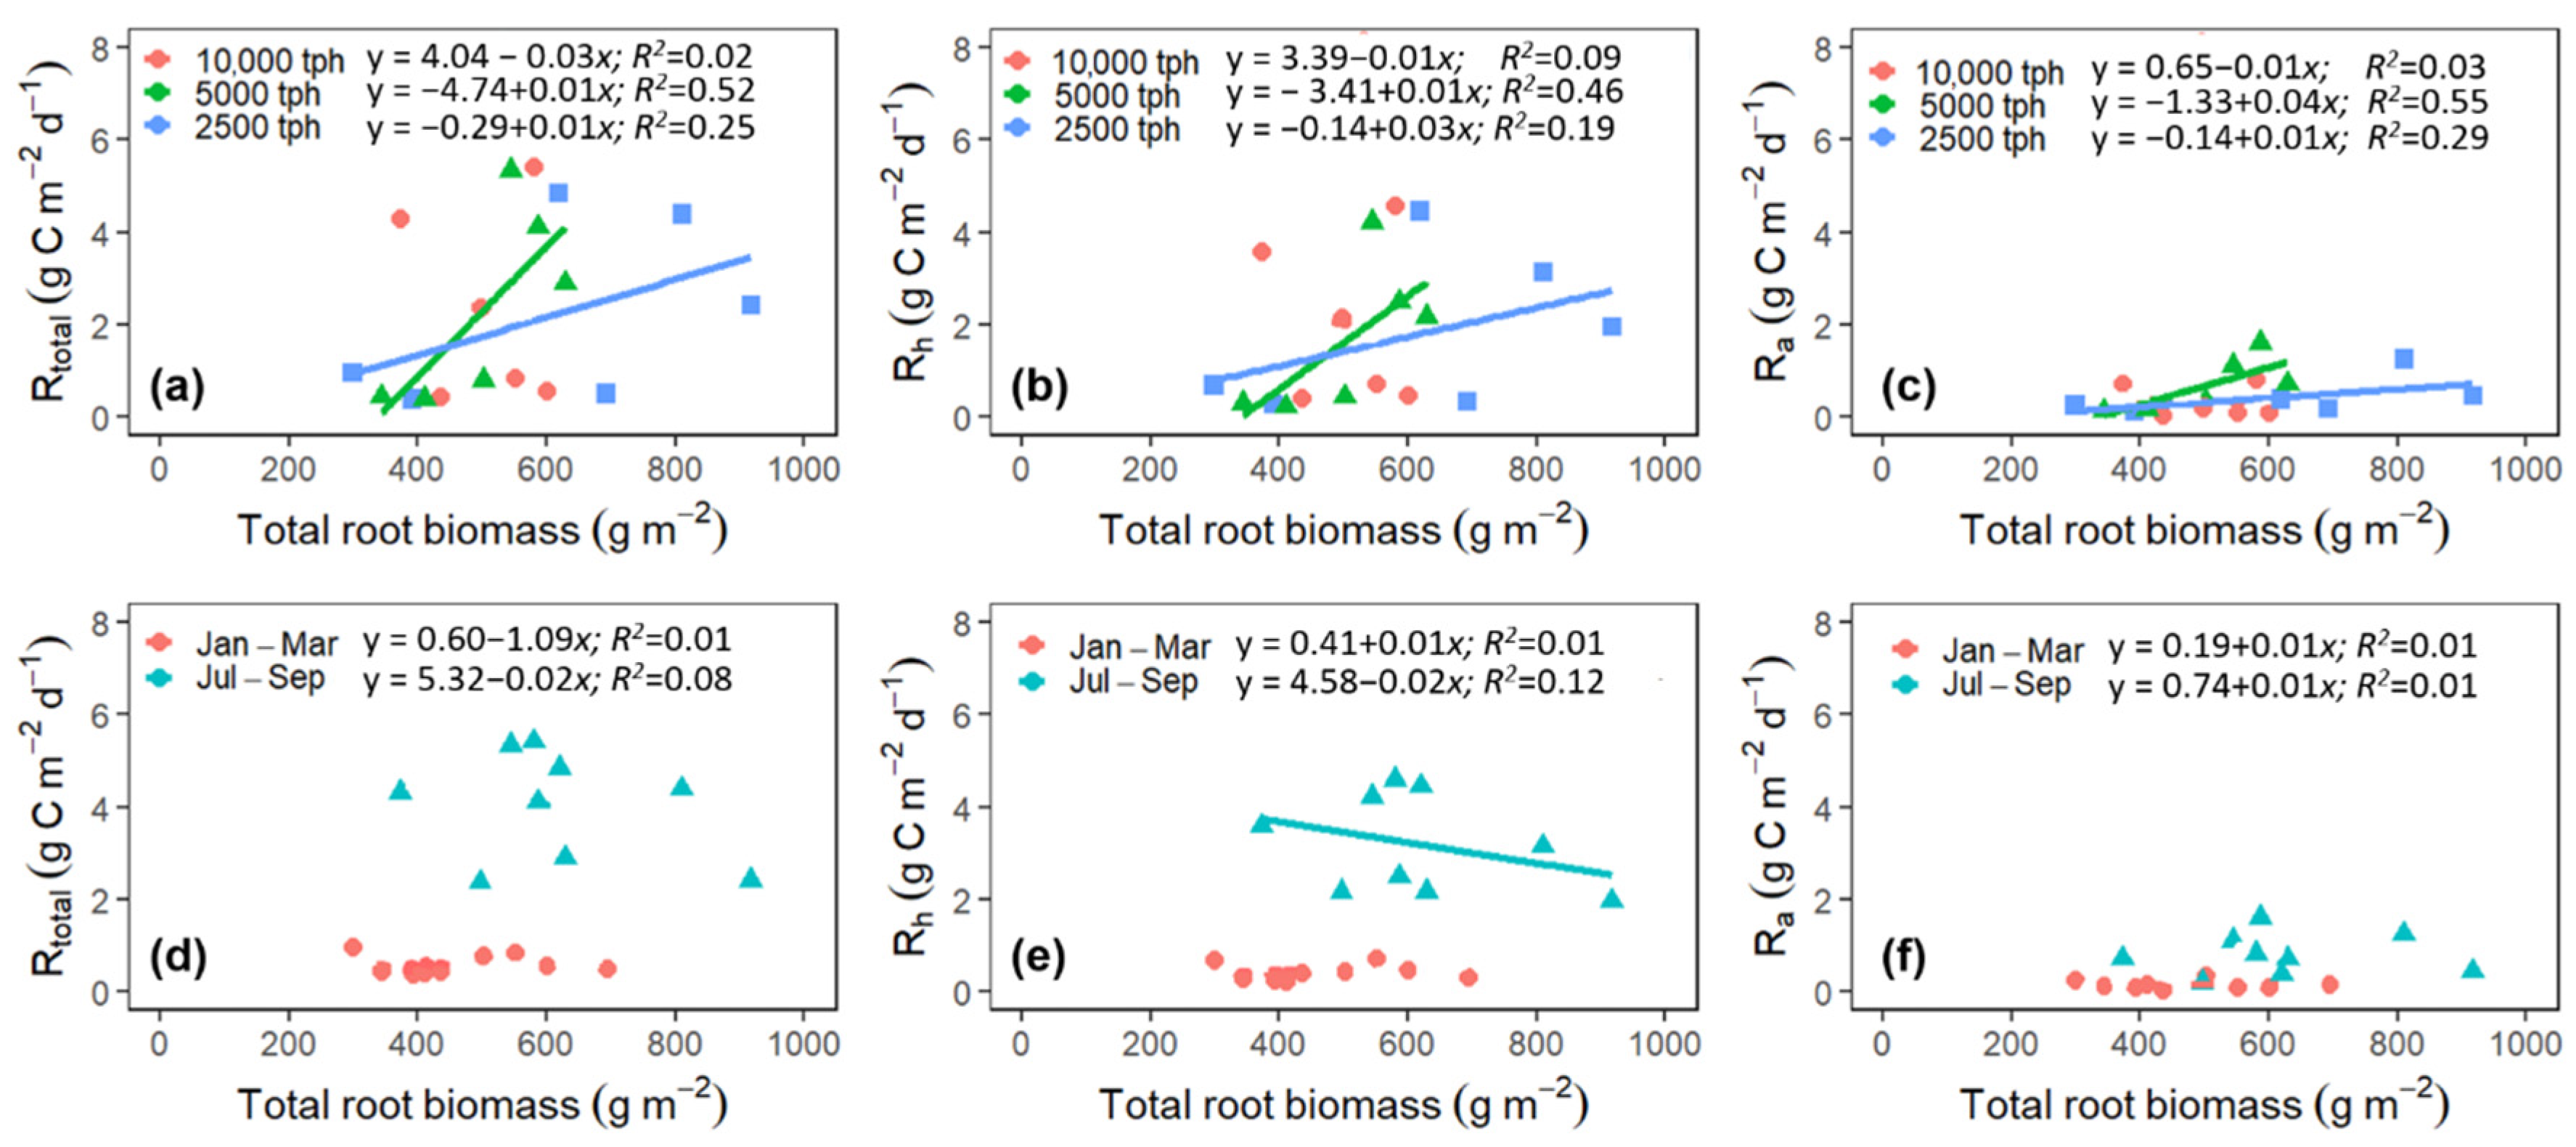
3.5. Plant-Mediated Drivers of Rtotal, Rh, and Ra

The average total root biomass in 10,000 tph (505 ± 88 g·m−2) and 5000 tph (502 ± 108 g·m−2) treatments was not statistically different (p > 0.05). However, the average total root biomass in widely spaced 2500 tph (621 ± 238 g·m−2) was higher than the other two planting densities (p < 0.05), indicating lower root production of sycamore in narrow-spaced planting density treatments (Figure 5a). Meanwhile, the total root biomass measured during the summer (616 ± 161 g·m−2) was higher than in winter (469 ± 127 g·m−2) (Figure 5b), and the difference was significant (p < 0.05).
The annual litter collected in 2500 tph sycamore treatment yielded the lowest amount (average 108 ± 21 g DW·m−2), while the highest was observed in 10,000 tph (132 ± 13 g DW·m−2), and the difference was significant. The litterfall in 5000 tph (121 ± 16 g DW·m−2) did not differ (p > 0.05) from the 2500 tph or 10,000 tph treatments (Figure 5c).
Collectively, these results suggest that the maximum root biomass was achieved at 2500 tph, while maximum litter production was achieved at higher planting densities (10,000 tph and 5000 tph).
The positive linear relationship of total root biomass to Rtotal, Rh, and Ra explained about half of the variation and was highest at 5000 tph with R2 = 0.52, R2 = 0.46, and R2 = 0.55, respectively (Figure 6). However, there was no significant total biomass–soil respiration relationship in 10,000 tph plots (Figure 6a–c). Seasonally, the total root biomass–soil respiration relationships were mainly insignificant (p > 0.05) except for Rh during the summer months where the Rh–total root biomass relationship was significant but weak (R2 = 0.12, Figure 6e). However, in no circumstances were Rtotal, Rh, and Ra significantly correlated with litterfall amount across planting densities and seasons (p > 0.05).

4. Discussion

4.1. Limitations and Uncertainties

We caution that, due to the shallow insertion of our nested collars, we could not ensure that this cut-root method would fully eliminate root respiration; however, it is a method that has been widely used and, thus, provides a tested means of comparison [42]. Despite the absence of a more sophisticated way of soil respiration partitioning, our study presents a simplistic partitioning approach to separate heterotrophic respiration from bulk soil respiration and estimate the autotrophic component, and we examined planting density and seasonal effects in American Sycamore SRWC grown as a bioenergy feedstock.

4.2. Seasonal Variation in Rtotal, Rh, and Ra

Results from this study indicate that Rtotal and Rh exhibited large seasonal variation (p < 0.05, Figure 2), consistent with other studies [26,43,44,45,46]. The seasonal variation of Rtotal and Rh exhibited a similar pattern, while there was less seasonal variation in Ra. Microbial respiration is the primary pathway of total soil respiration and has been shown to have a great deal of seasonal variability [43,45,47,48]. These seasonal variations have been associated with plant growth stage, soil type, and environmental conditions [49,50]. Rtotal, Rh, and Ra rates were relatively high in June to August and lowest in winter months (January to March), supporting our hypothesis of higher soil respiration rates during the growing season. Similar seasonal patterns were found in studies conducted in grassland and cropland ecosystems [16]. However, Ra declined in July as root respiration may have been restricted by relatively low root development or even root senescence, as has been shown for pine forests at this time of year in North Carolina [51], while Rh rapidly increased due to increasing soil temperature and potential root litter inputs.

4.3. Variation in Rtotal, Rh, and Ra as Affected by Planting Density

Although we found no differences in total soil respiration across planting densities, Rh in 5000 tph treatment (1.57 ± 0.39 g·C·m−2·day−1) was significantly lower than in 10,000 tph (1.97 ± 0.64 g·C·m−2·day−1) (p < 0.05), consistent with another study that showed maximum microbial soil respiration at higher (narrow-spaced) tree planting density [48]. The addition of more soil organic carbon through litterfall is high in narrower spacing, leading to enhanced soil organic decomposition and microbial activities, thus improving soil microbial respiration. Nonetheless, soil respiration in different plant densities might result from the differences in root litter inputs, nutrients, water, temperature, etc., as well as the interactions among them [17].
Soil respiration can be also related to photosynthetic activity, and respiratory activity and plant productivity have been shown to be coupled [52,53]. Root-derived carbon respiration and leaf area index (LAI) can be used as predictive parameters to determine this coupling [54]. Although we did not measure LAI in this study, it did not differ significantly between treatments [54]. However, individual tree root systems may express different carbon respiration patterns, and rates have been shown to be highly variable dependent on planting density [54,55] and indirectly influenced by the turnover rates [54]. A higher productivity in narrow spacing results in a higher litterfall, leading to high soil respiratory activity. More work is needed to elucidate the role of root systems in soil respiration as affected by planting density.

4.4. The Contribution of Rh and Ra to Rtotal

Rh, having a similar pattern as Rtotal (figure not shown), may be attributed to the fact that Rh accounted for a relatively high proportion of Rtotal compared to Ra. Rh was the primary contributor to total soil respiration in our study, accounting for 63%–78% annually. This supports our hypothesis that the contribution of Rh to Rtotal would be greater than Ra. Similar studies that showed higher Rh than Ra include studies of Eucalyptus regnans plantations in Melbourne, Australia [56], Armeniaca sibirica plantations in Mount Taihang, China [57], and Leymus chinensis plantation in China [17]. Among short-rotation woody crops of Populus spp. and Salix spp. in Lochristi, Belgium, higher Rh than Ra was found [40]. Meanwhile, the contribution of Ra to Rtotal in our study was only 20%–35%. This proportion is within the range reported in other studies [17,27,58,59].
The contribution of Rh to Rtotal in our study was high during the growing period when soil temperature was high, consistent with other studies showing that soil respiration changes seasonally with soil temperature and often decreases with decreasing soil water in the summer [60]. Planting density also influences the contribution of Rh and Ra to Rtotal. In our case, higher planting density (10,000 tph and 5000 tph) had higher Rtotal and Rh, thus resulting in higher Rh contribution to the total soil respiration. This is in agreement with the Populus and Salix SRWC study, which showed that higher planting density was associated with higher total soil respiration rates compared to lower planting density [40].

4.5. Responses of Rtotal, Rh, and Ra to Soil Temperature and Water Content

In this study, soil temperature accounted for most of the seasonal variation in Rtotal, Rh, and Ra compared to soil water content, as we hypothesized. This result is consistent with other studies [17,61]. A study on American sycamore in a relatively humid and wet southeastern US site supported the notion that this species may be more nutrient-limited than moisture limited [6,8]. Peaks of Rtotal, Rh, and Ra occurring during the summer season were likely induced by the increase in soil temperature and decomposition of litter, thus enhancing soil respiration [46,62].
The weak relationships of soil temperature to Rtotal (R2 = 0.38), Rh (R2 = 0.43), and Ra (R2 = 0.24) during spring (April–June) occurred because of the large variability in Rtotal, Rh, and Ra with soil temperature (Figure 4). We also suspect that substrate availability may have decreased over the course of winter, thus becoming a limiting factor in spring as the soil temperature warmed, leading to apparent lower temperature sensitivity. Correlations in spring may have been weakened because of masking by other environmental variables (e.g., PAR and soil water content) and other biological drivers (photosynthesis, root biomass production, LAI, phenology, etc.) [21,27]. During spring, trees are transitioning from a period of dormancy before leaf initiation commences. During winter, Rtotal, Rh, and Ra were at their lowest, which might also be explained by dramatically decreased soil temperature. Our results show that there are conditions under which soil temperature may not be the primary driver of soil respiration. Microbes can experience substrate limitation and limited activity under dry conditions, and some conditions might induce stress responses [63]. Therefore, models should consider varying seasonal parameters corresponding to the major environmental and biological drivers for an accurate representation of seasonal dynamics of soil respiration.
Several studies have shown that soil water content has a limited impact on soil respiration, except during extremes of saturation or water deficits [14,17,64,65]. We found a positive correlation between soil water content and Rtotal, Rh, and Ra during the peak of the growing season when soil water content was below 30% (Figure 4d,e,f). Rtotal, Rh, and Ra significantly declined when the SWC was below 20%. Another study showed that heterotrophic respiration declined above a threshold of about 26% SWC [66], although the response could generally vary depending on soil type. Soil water content above this threshold could reduce the diffusion of oxygen and, thus, impede microbial activity. In contrast, when soils are very dry, metabolic activity increases with increasing water availability [52,66,67]. These results highlight the potential of American sycamore SRWC to counter soil C losses via decreased soil respiration at times of drier soils and future warmer climate. We also found a reduction in Rtotal, Rh, and Ra when SWC was above 50%–60% (Figure 6d,e,f). When soils are too wet, oxygen deficiencies inhibit aerobic respiration, which generally occurs when soils are 50%–80% saturated [65,68].
Other studies have shown that Rh and Ra respond differently to soil temperature and soil water content [17,69], which is consistent with the current study. Rh is primarily driven by soil temperature, soil water [45,70], and substrate availability, while Ra is primarily affected by root biomass and photosynthesis [71]. Consistent with these results, our study showed that average soil temperature across all seasons was positively correlated to Rtotal (R2 = 0.70) and Rh (R2 = 0.71), while the relationship of Ra with soil temperature was weak (R2 = 0.39), suggesting greater biological control of Ra rather than environmental control (Figure 4a,b,c).
The effects of soil temperature and soil water on Rtotal can be confounded [33,72,73,74]. The singular effects of soil water content may be distinguishable in ecosystems with little seasonal variation in soil temperature, such as in tropical ecosystems [72,75]; however, in temperate systems, it may be difficult to distinguish between them. Although the soil temperature in our study showed high seasonal fluctuations ranging from 8.86 to 22.62 °C, the effects of soil water content on soil respiration components were less apparent. This is due mainly to the fact that our experiment is located in a mesic climate with topography that decreases limitation from low soil water content, even during dry periods [39] although water stress may develop during extended droughts. The role of soil temperature as the main driver of soil respiration at our site, especially during the growing seasons, indicates that higher soil respiratory processes and higher soil C losses may occur in American sycamore SRWC as soil temperature increases.

4.6. Responses of Rtotal, Rh, and Ra to Root Biomass and Litterfall

The close proximity of the trees and high productivity in 10,000 tph and 5000 tph treatments [39,76] could explain why the total root biomass of American sycamore trees at low planting density (2500 tph) was higher than the closely spaced trees, as pointed out by a study previously conducted at the site [39]. However, 10,000 tph and 5000 tph appear to be the optimal planting density with regard to maximizing aboveground wood production relative to the number of trees planted and, therefore, the cost of the establishment [39,76]. A separate study reported that varying planting density might induce changes in soil properties and environmental factors, e.g., quantities of microorganisms, soil water content, and soil temperature, which might confound the interpretation of effects of planting density on root biomass [17]. Seasonal patterns of soil respiration are strongly correlated with biotic variables, such as root biomass [77]. These variables may influence total soil respiration mainly by controlling Rh and Ra. Although the relationships of total root biomass with Rtotal, Rh, and Ra in our study were only significant during the growing season, the coefficient of determination was relatively low across seasons and planting densities (R2 = 0.12 to 0.50). These weak correlations indicate the prevailing control of environmental factors over biological parameters in American sycamore SRWC in North Carolina.
There is a contention that soil respiration is highly proportional to root biomass, which has been argued in the literature [17]. In our study, the coefficients of determination between Rtotal, Rh, and Ra and total root biomass across planting densities during the growing season ranged from R2 = 0.19 to 0.55 (and less during the nongrowing season), indicating a much weaker relationship between root biomass and soil respiration than has been reported. The large unexplained variance in our case means that other factors were important in determining soil CO2 efflux. Thus, there are situations in which the assumption that root biomass is always the primary driver of soil respiration needs to be tempered, and other factors should be considered.
The highest rate of litterfall in this study was observed at the narrowest spacing (10,000 tph, p < 0.05), which is consistent with several studies reporting larger litter-derived organic C and N in narrower tree spacing [48,56]. However, in our study, there was no instance in which litter inputs significantly affected Rtotal, Rh, and Ra (R2 < 0.007, p > 0.05), suggesting that a direct pathway of freshly added organic matter to the soil posed a weaker link to soil respiration rates. A study of numerous forests worldwide also found a poor correlation between litterfall and soil respiration [78]. Although only marginally significant differences were found in litterfall across seasons and planting densities in our study, these results imply that root respiration, decomposition of root-derived litter, or decomposition of older soil organic matter contributed more to soil respiration relative to decomposition of immediately derived aboveground litter inputs.
Overall, biological controls over soil respiration components varied from R2 = 0.02–R2 = 0.55 for total root biomass and were less than R2 = 0.02 for litterfall. Environmental control varied from R2 = 0.14 to R2 = 0.94 for soil temperature and from R2 = 0.14 to R2 = 0.94 for SWC. Clearly, environmental factors had a greater effect on soil respiration than biological controls at our American sycamore SRWC field trial in central North Carolina, supporting our hypothesis.

5. Conclusions

Our study showed that total soil respiration in an American sycamore bioenergy SRWC system was governed largely by heterotrophic respiration relative to autotrophic respiration. Total and heterotrophic respiration showed large seasonal variabilities, primarily driven by soil environmental conditions, especially temperature. The lowest heterotrophic respiration occurred at the narrower spacing (5000 tph) compared to wider-spaced tree planting (2500 tph). Thus, the 5000 tph planting density may be an optimum spacing for American sycamore plantation establishment in so far as soil CO2 efflux reduction is concerned.
This study is also consistent with the common finding that soil temperature explains most of the seasonal variation in total soil respiration, as well as heterotrophic and autotrophic respiration, while soil water content is a secondary factor (in non-water-limited environments). However, our study found that soil water extremes (either too dry or too wet) decreased soil respiration rates. These results imply that soil respiration in American sycamore SRWC may only be subtly enhanced during conditions of dryer soils (e.g., drought), enhancing the environmental sustainability and C benefits of this bioenergy production system. Our study contributes to the growing need for scientific investigations regarding the sustainability of wood-based bioenergy systems and provides important data on the drivers of soil respiration that will improve C cycle modeling of American sycamore SRWC.

Supplementary Materials

The following supporting information can be downloaded at: https://www.mdpi.com/article/10.3390/f13081286/s1, Figure S1: Linear relationship between temperature-normalized total soil respiration (Rtotal), heterotrophic respiration (Rh), and autotrophic respiration (Ra) and soil water content. Each season is assigned with different colors. Black line is the linear regression. Average soil respiration per month was used in the analysis.

Author Contributions

Conceptualization, S.M., A.N. and J.K.; methodology, S.M., A.N., K.J.M., D.A.D., J.H. and J.K.; software, S.M. and M.A.; validation, S.M. and J.K.; formal analysis, S.M., M.A., O.I., D.H. and M.K.; investigation, S.M., A.N., K.J.M. and J.K.; resources, J.K.; data curation, S.M., M.A., O.I., D.H. and M.K.; writing—original draft preparation, S.M. and M.A.; writing—review and editing, S.M., M.A., A.N., K.J.M., O.I., D.A.D., J.H. and J.K.; visualization, S.M. and M.A.; supervision, A.N., D.A.D., J.H. and J.K.; project administration, A.N., D.A.D., J.H. and J.K.; funding acquisition, J.K. All authors have read and agreed to the published version of the manuscript.

Funding

Funding for this project was provided by USDA CSREES Rural Development Program 2009-10001-05311, USDA NIFA 2010-34458-21103, and the North Carolina Department of Agriculture and Consumer Services/North Carolina Bioenergy Research Initiative award 17-072-4028.

Institutional Review Board Statement

Not applicable.

Informed Consent Statement

Not applicable.

Data Availability Statement

Not applicable.

Acknowledgments

Significant in-kind and logistical support was provided by the NCDACS Oxford Tobacco Research Station, which made the project possible.

Conflicts of Interest

The authors declare no conflict of interest.

References

  1. Manolis, E.N.; Zagas, T.D.; Poravou, C.A.; Zagas, D.T. Biomass Assessment for Sustainable Bioenergy Utilization in a Mediterranean Forest Ecosystem in Northwest Greece. Ecol. Eng. 2016, 91, 537–544. [Google Scholar] [CrossRef]
  2. Lee, R.A.; Lavoie, J.M. From First- to Third-Generation Biofuels: Challenges of Producing a Commodity from a Biomass of Increasing Complexity. Anim. Front. 2013, 3, 6–11. [Google Scholar] [CrossRef]
  3. Ross, D.J.; Tate, K.R.; Scott, N.A.; Wilde, R.H.; Rodda, N.J.; Townsend, J.A. Afforestation of Pastures with Pinus Radiata Influences Soil Carbon and Nitrogen. Aust. J. Soil Res. 2002, 40, 1303–1318. [Google Scholar] [CrossRef]
  4. McLaughlin, S.B.; Walsh, M.E. Evaluating Environmental Consequences of Producing Herbaceous Crops for Bioenergy. Biomass Bioenergy 1998, 14, 317–324. [Google Scholar] [CrossRef]
  5. Liptow, C.; Tillman, A.M.; Janssen, M.; Wallberg, O.; Taylor, G.A. Ethylene Based on Woody Biomass—What Are Environmental Key Issues of a Possible Future Swedish Production on Industrial Scale. Int. J. Life Cycle Assess. 2013, 18, 1071–1081. [Google Scholar] [CrossRef]
  6. Brinks, J.S.; Lhotka, J.M.; Barton, C.D.; Warner, R.C.; Agouridis, C.T. Effects of Fertilization and Irrigation on American Sycamore and Black Locust Planted on a Reclaimed Surface Mine in Appalachia. For. Ecol. Manag. 2011, 261, 640–648. [Google Scholar] [CrossRef]
  7. Ghezehei, S.B.; Nichols, E.G.; Hazel, D.W. Early Clonal Survival and Growth of Poplars Grown on North Carolina Piedmont and Mountain Marginal Lands. Bioenergy Res. 2016, 9, 548–558. [Google Scholar] [CrossRef]
  8. Davis, A.A.; Trettin, C.C. Sycamore and Sweetgum Plantation Productivity on Former Agricultural Land in South Carolina. Biomass Bioenergy 2006, 30, 769–777. [Google Scholar] [CrossRef]
  9. Bouwman, A.F. Biology and Fertility of Soils: Editorial. Biol. Fertil. Soils 1998, 30, 269. [Google Scholar] [CrossRef]
  10. Veenendaal, E.M.; Kolle, O.; Lloyd, J. Seasonal Variation in Energy Fluxes and Carbon Dioxide Exchange for a Broad-Leaved Semi-Arid Savanna (Mopane Woodland) in Southern Africa. Glob. Change Biol. 2004, 10, 318–328. [Google Scholar] [CrossRef]
  11. Kane, E.S.; Valentine, D.W.; Schuur, E.A.G.; Dutta, K. Soil Carbon Stabilization along Climate and Stand Productivity Gradients in Black Spruce Forests of Interior Alaska. Can. J. For. Res. 2005, 35, 2118–2129. [Google Scholar] [CrossRef]
  12. Boone, R.D.; Nadelhoffert, K.J.; Canary, J.D.; Kaye, J.P. Sensitivity of Soil Respiration. Nature 1998, 396, 570–572. [Google Scholar] [CrossRef]
  13. Epron, D.; Le Dantec, V.; Dufrene, E.; Granier, A. Seasonal Dynamics of Soil Carbon Dioxide Efflux and Simulated Rhizosphere Respiration in a Beech Forest. Tree Physiol. 2001, 21, 145–152. [Google Scholar] [CrossRef] [PubMed]
  14. Hanson, P.J.; Edwards, N.T.; Garten, C.T.; Andrews, J.A. Separating Root and Soil Microbial Contributions to Soil Respiration: A Review of Mehtods and Observations. Biogeochemistry 2000, 48, 115–146. [Google Scholar] [CrossRef]
  15. Raich, J.W.; Tufekcioglu, A. Vegetation and Soil Respiration: Correlations and Controls. Biogeochemistry 2000, 48, 71–90. [Google Scholar] [CrossRef]
  16. Li, X.; Fu, H.; Guo, D.; Li, X.; Wan, C. Partitioning Soil Respiration and Assessing the Carbon Balance in a Setaria Italica (L.) Beauv. Cropland on the Loess Plateau, Northern China. Soil Biol. Biochem. 2010, 42, 337–346. [Google Scholar] [CrossRef]
  17. Jia, B.; Zhou, G.; Wang, F.; Wang, Y.; Yuan, W.; Zhou, L. Partitioning Root and Microbial Contributions to Soil Respiration in Leymus Chinensis Populations. Soil Biol. Biochem. 2006, 38, 653–660. [Google Scholar] [CrossRef]
  18. Subke, J.A.; Inglima, I.; Cotrufo, M.F. Trends and Methodological Impacts in Soil CO2 Efflux Partitioning: A Metaanalytical Review. Glob. Change Biol. 2006, 12, 921–943. [Google Scholar] [CrossRef]
  19. Aguilos, M.; Takagi, K.; Liang, N.; Watanabe, Y.; Teramoto, M.; Goto, S.; Takahashi, Y.; Mukai, H.; Sasa, K. Sustained Large Stimulation of Soil Heterotrophic Respiration Rate and Its Temperature Sensitivity by Soil Warming in a Cool-Temperate Forested Peatland. Tellus Ser. B Chem. Phys. Meteorol. 2013, 65, 20792. [Google Scholar] [CrossRef]
  20. Lloyd, J.; Taylor, J.A. On the Temperature Dependence of Soil Respiration. 1994. Available online: http://www.Jstor.Org/Stable/2389824 (accessed on 15 December 2021).
  21. Raich, J.W.; Schlesinger, W.H. The Global Carbon Dioxide Flux in Soil Respiration and Its Relationship to Vegetation and Climate. Tellus B 1992, 44, 81–99. [Google Scholar] [CrossRef]
  22. Aguilos, M.; Takagi, K.; Liang, N.; Watanabe, Y.; Goto, S.; Takahashi, Y.; Mukai, H.; Sasa, K. Soil Warming in a Cool-Temperate Mixed Forest with Peat Soil Enhanced Heterotrophic and Basal Respiration Rates but Q10 Remained Unchanged. Biogeosciences Discuss. 2011, 8, 6415–6445. [Google Scholar] [CrossRef]
  23. Davidson, E.A.; Verchot, L.V.; Cattanio, J.H.; Ackerman, I.L.; Carvalho, J.E.M. Effects of Soil Water Content on Soil Respiration in Forests and Cattle Pastures of Eastern Amazonia. Biogeochemistry 2000, 48, 53–69. [Google Scholar] [CrossRef]
  24. Curiel Yuste, J.; Ma, S.; Baldocchi, D.D. Plant-Soil Interactions and Acclimation to Temperature of Microbial-Mediated Soil Respiration May Affect Predictions of Soil CO2 Efflux. Biogeochemistry 2009, 98, 127–138. [Google Scholar] [CrossRef]
  25. Xu, M.; Qi, Y. Spatial and Seasonal Variations of Q10 Determined by Soil Respiration Measurements at a Sierra Nevadan Forest. Glob. Biogeochem. Cycles 2001, 15, 687–696. [Google Scholar] [CrossRef]
  26. Gaumont-Guay, D.; Black, T.A.; Griffis, T.J.; Barr, A.G.; Jassal, R.S.; Nesic, Z. Interpreting the Dependence of Soil Respiration on Soil Temperature and Water Content in a Boreal Aspen Stand. Agric. For. Meteorol. 2006, 140, 220–235. [Google Scholar] [CrossRef]
  27. Reichstein, M.; Beer, C. Soil Respiration across Scales: The Importance of a Model-Data Integration Framework for Data Interpretation. J. Plant Nutr. Soil Sci. 2008, 171, 344–354. [Google Scholar] [CrossRef]
  28. Sheng, H.; Yang, Y.; Yang, Z.; Chen, G.; Xie, J.; Guo, J.; Zou, S. The Dynamic Response of Soil Respiration to Land-Use Changes in Subtropical China. Glob. Change Biol. 2010, 16, 1107–1121. [Google Scholar] [CrossRef]
  29. Reichstein, M.; Rey, A.; Freibauer, A.; Tenhunen, J.; Valentini, R.; Banza, J.; Casals, P.; Cheng, Y.; Grünzweig, J.M.; Irvine, J.; et al. Modeling Temporal and Large-Scale Spatial Variability of Soil Respiration from Soil Water Availability, Temperature and Vegetation Productivity Indices. Glob. Biogeochem. Cycles 2003, 17, 1–15. [Google Scholar] [CrossRef]
  30. Raich, J.W.; Potter, C.S.; Bhagawati, D. Interannual Variability in Global Soil Respiration, 1980–1994. Glob. Change Biol. 2002, 8, 800–812. [Google Scholar] [CrossRef]
  31. Janssens, I.A.; Lankreijer, H.; Matteucci, G.; Kowalski, A.S.; Buchmann, N.; Epron, D.; Pilegaard, K.; Kutsch, W.; Longdoz, B.; Grünwald, T.; et al. Productivity Overshadows Temperature in Determining Soil and Ecosystem Respiration across European Forests. Glob. Change Biol. 2001, 7, 269–278. [Google Scholar] [CrossRef]
  32. Bond-Lamberty, B.; Bronson, D.; Bladyka, E.; Gower, S.T. Corrigendum to “A Comparison of Trenched Plot Techniques for Partitioning Soil Respiration” [Soil Biol. Biochem. 43 (10) (2011) 2108-2114]. Soil Biol. Biochem. 2012, 47, 220. [Google Scholar] [CrossRef]
  33. Aguilos, M.; Takagi, K.; Liang, N.; Ueyama, M.; Fukuzawa, K.; Nomura, M.; Kishida, O.; Fukazawa, T.; Takahashi, H.; Kotsuka, C.; et al. Dynamics of Ecosystem Carbon Balance Recovering from a Clear-Cutting in a Cool-Temperate Forest. Agric. For. Meteorol. 2014, 197, 26–39. [Google Scholar] [CrossRef]
  34. Li, X.; King, J.S. An Improved Method for Measuring the Production, Mortality and Decomposition of Extramatrical Mycelia of Ectomycorrhizal Fungi in Forests. Soil Biol. Biochem. 2018, 116, 360–368. [Google Scholar] [CrossRef]
  35. Remaury, A.; Guittonny, M.; Rickson, J. The Effect of Tree Planting Density on the Relative Development of Weeds and Hybrid Poplars on Revegetated Mine Slopes Vulnerable to Erosion. New For. 2019, 50, 555–572. [Google Scholar] [CrossRef]
  36. Mead, D.J. Opportunities for Improving Plantation Productivity. How Much? How Quickly? How Realistic? Biomass Bioenergy 2005, 28, 249–266. [Google Scholar] [CrossRef]
  37. Rabot, E.; Wiesmeier, M.; Schlüter, S.; Vogel, H.J. Soil Structure as an Indicator of Soil Functions: A Review. Geoderma 2018, 314, 122–137. [Google Scholar] [CrossRef]
  38. McIvor, I.R.; Douglas, G.B.; Benavides, R. Coarse Root Growth of Veronese Poplar Trees Varies with Position on an Erodible Slope in New Zealand. Agrofor. Syst. 2009, 76, 251–264. [Google Scholar] [CrossRef]
  39. Domec, J.C.; Ashley, E.; Fischer, M.; Noormets, A.; Boone, J.; Williamson, J.C.; King, J.S. Productivity, Biomass Partitioning, and Energy Yield of Low-Input Short-Rotation American Sycamore (Platanus Occidentalis, L.) Grown on Marginal Land: Effects of Planting Density and Simulated Drought. Bioenergy Res. 2017, 10, 903–914. [Google Scholar] [CrossRef]
  40. Berhongaray, G.; Janssens, I.A.; King, J.S.; Ceulemans, R. Fine Root Biomass and Turnover of Two Fast-Growing Poplar Genotypes in a Short-Rotation Coppice Culture. Plant Soil 2013, 373, 269–283. [Google Scholar] [CrossRef]
  41. McElligott, K.M.; Seiler, J.R.; Strahm, B.D. Partitioning Soil Respiration across Four Age Classes of Loblolly Pine (Pinus Taeda, L.) on the Virginia Piedmont. For. Ecol. Manag. 2016, 378, 173–180. [Google Scholar] [CrossRef]
  42. R Core Team. R: A Language and Environment for Statistical Computing; R Core Team: Vienna, Austria, 2021. [Google Scholar]
  43. Fang, C.; Moncrieff, J.B.; Gholz, H.L.; Clark, K.L. Soil CO2 Efflux and Its Spatial Variation in a Florida Slash Pine Plantation. Plant Soil 1998, 205, 135–146. [Google Scholar] [CrossRef]
  44. Xu, M.; Qi, Y. Soil-Surface CO2 Efflux and Its Spatial and Temporal Variations in a Young Ponderosa Pine Plantation in Northern California. Glob. Change Biol. 2001, 7, 667–677. [Google Scholar] [CrossRef]
  45. Wang, C.; Yang, J.; Zhang, Q. Soil Respiration in Six Temperate Forests in China. Glob. Change Biol. 2006, 12, 2103–2114. [Google Scholar] [CrossRef]
  46. Chang, S.X.; Shi, Z.; Thomas, B.R. Soil Respiration and Its Temperature Sensitivity in Agricultural and Afforested Poplar Plantation Systems in Northern Alberta. Biol. Fertil. Soils 2016, 52, 629–641. [Google Scholar] [CrossRef]
  47. Gaumont-Guay, D.; Black, T.A.; Griffis, T.J.; Barr, A.G.; Morgenstern, K.; Jassal, R.S.; Nesic, Z. Influence of Temperature and Drought on Seasonal and Interannual Variations of Soil, Bole and Ecosystem Respiration in a Boreal Aspen Stand. Agric. For. Meteorol. 2006, 140, 203–219. [Google Scholar] [CrossRef]
  48. Chander, K.; Goyal, S.; Nandal, D.P.; Kapoor, K.K. Soil Organic Matter, Microbial Biomass and Enzyme Activities in a Tropical Agroforestry System; Springer-Verlag: Berlin/Heidelberg, Germany, 1998; Volume 27. [Google Scholar]
  49. Larionova, A.A.; Yevdokimov, I.V.; Kurganova, I.N.; Sapronov, D.V.; Kuznetsova, L.G.; de Lopes Gerenju, V.O. Root Respiration and Its Contribution to the CO2 Emission from Soil. Eurasian Soil Sci. 2003, 36, 173–184. [Google Scholar]
  50. Chen, C.R.; Condron, L.M.; Xu, Z.H.; Davis, M.R.; Sherlock, R.R. Root, Rhizosphere and Root-Free Respiration in Soils under Grassland and Forest Plants. Eur. J. Soil Sci. 2006, 57, 58–66. [Google Scholar] [CrossRef]
  51. King, J.S.; Albaugh, T.J.; Lee Allen, H.; Buford, M.; Strain, B.R.; Dougherty, P. Below-Ground Carbon Input to Soil Is Controlled by Nutrient Availability and Fine Root Dynamics in Loblolly Pine. New Phytol. 2002, 154, 389–398. [Google Scholar] [CrossRef]
  52. Aguilos, M.; Sun, G.; Noormets, A.; Domec, J.C.; McNulty, S.; Gavazzi, M.; Prajapati, P.; Minick, K.J.; Mitra, B.; King, J. Ecosystem Productivity and Evapotranspiration Are Tightly Coupled in Loblolly Pine (Pinus Taeda l.) Plantations along the Coastal Plain of the Southeastern, U.S. Forests 2021, 12, 1123. [Google Scholar] [CrossRef]
  53. Hutyra, L.R.; Munger, J.W.; Hammond-Pyle, E.; Saleska, S.R.; Restrepo-Coupe, N.; Daube, B.C.; de Camargo, P.B.; Wofsy, S.C. Resolving Systematic Errors in Estimates of Net Ecosystem Exchange of CO2 and Ecosystem Respiration in a Tropical Forest Biome. Agric. For. Meteorol. 2008, 148, 1266–1279. [Google Scholar] [CrossRef]
  54. Moyano, F.E.; Kutsch, W.L.; Rebmann, C. Soil Respiration Fluxes in Relation to Photosynthetic Activity in Broad-Leaf and Needle-Leaf Forest Stands. Agric. For. Meteorol. 2008, 148, 135–143. [Google Scholar] [CrossRef]
  55. Liguori, G.; Gugliuzza, G.; Inglese, P. Evaluating Carbon Fluxes in Orange Orchards in Relation to Planting Density. J. Agric. Sci. 2009, 147, 637–645. [Google Scholar] [CrossRef]
  56. Martin, D.; Beringer, J.; Hutley, L.B.; McHugh, I. Carbon Cycling in a Mountain Ash Forest: Analysis of below Ground Respiration. Agric. For. Meteorol. 2007, 147, 58–70. [Google Scholar] [CrossRef]
  57. Zeng, X.; Song, Y.; Zeng, C.; Zhang, W.; He, S. Partitioning Soil Respiration in Two Typical Forests in Semi-Arid Regions, North China. Catena 2016, 147, 536–544. [Google Scholar] [CrossRef]
  58. Raich, J.W.; Tufekcioglu, A. Vegetation and Soil Respiration: Correlations and Controls; Kluwer Academic Publishers: Dordrecht, The Netherlands, 2000; Volume 48. [Google Scholar]
  59. Gupta, S.R.; Singh, J.S. Soil Respiration in a Tropical Grassland Soil Biology and Biochemistry; Elsevier: Amsterdam, The Netherlands, 1981; Volume 13, 4, pp. 261–268. [Google Scholar] [CrossRef]
  60. Hashimoto, S.; Tanaka, N.; Suzuki, M.; Inoue, A.; Takizawa, H.; Kosaka, I.; Tanaka, K.; Tantasirin, C.; Tangtham, N. Soil Respiration and Soil CO2 Concentration in a Tropical Forest, Thailand. J. For. Res. 2004, 9, 75–79. [Google Scholar] [CrossRef]
  61. Rustad, L.E.; Fernandez, I.J. Experimental Soil Warming Effects on CO2 and CH4 Flux from a Low Elevation Spruce-Fir Forest Soil in Maine, USA. Glob. Change Biol. 1998, 4, 597–605. [Google Scholar] [CrossRef]
  62. Menichetti, L.; Reyes Ortigoza, A.L.; García, N.; Giagnoni, L.; Nannipieri, P.; Renella, G. Thermal Sensitivity of Enzyme Activity in Tropical Soils Assessed by the Q10 and Equilibrium Model. Biol. Fertil. Soils 2015, 51, 299–310. [Google Scholar] [CrossRef]
  63. Suseela, V.; Conant, R.T.; Wallenstein, M.D.; Dukes, J.S. Effects of Soil Moisture on the Temperature Sensitivity of Heterotrophic Respiration Vary Seasonally in an Old-Field Climate Change Experiment. Glob. Change Biol. 2012, 18, 336–348. [Google Scholar] [CrossRef]
  64. Yang, J.; Tian, H.; Pan, S.; Chen, G.; Zhang, B.; Dangal, S. Amazon Drought and Forest Response: Largely Reduced Forest Photosynthesis but Slightly Increased Canopy Greenness during the Extreme Drought of 2015/2016. Glob. Change Biol. 2018, 24, 1919–1934. [Google Scholar] [CrossRef]
  65. Aguilos, M.; Mitra, B.; Noormets, A.; Minick, K.; Prajapati, P.; Gavazzi, M.; Sun, G.; McNulty, S.; Li, X.; Domec, J.C.; et al. Long-Term Carbon Flux and Balance in Managed and Natural Coastal Forested Wetlands of the Southeastern USA. Agric. For. Meteorol. 2020, 288, 108022. [Google Scholar] [CrossRef]
  66. Raich, J.W.; Potter, S. Global Patterns of Carbon Dioxide Emissions from Soils. Glob. Biogeochem. Cycles 1995, 9, 23–36. [Google Scholar] [CrossRef]
  67. Aguilos, M.; Sun, G.; Noormets, A.; Domec, J.C.; McNulty, S.; Gavazzi, M.; Minick, K.; Mitra, B.; Prajapati, P.; Yang, Y.; et al. Effects of Land-Use Change and Drought on Decadal Evapotranspiration and Water Balance of Natural and Managed Forested Wetlands along the Southeastern US Lower Coastal Plain. Agric. For. Meteorol. 2021, 303, 108381. [Google Scholar] [CrossRef]
  68. Linn, D.M.; Doran, J.W. Effect of Water-Filled Pore Space on Carbon Dioxide and Nitrous Oxide Production in Tilled and Nontilled Soils. Soil Sci. Soc. Am. J. 1984, 48, 1267–1272. [Google Scholar] [CrossRef]
  69. Bronson, D.R.; Gower, S.T.; Tanner, M.; Linder, S.; van Herk, I. Response of Soil Surface CO2 Flux in a Boreal Forest to Ecosystem Warming. Glob. Change Biol. 2008, 14, 856–867. [Google Scholar] [CrossRef]
  70. Ryan, M.G.; Law, B.E. Interpreting, Measuring, and Modeling Soil Respiration. Biogeochemistry 2005, 73, 3–27. [Google Scholar] [CrossRef]
  71. Tang, J.; Baldocchi, D.D.; Xu, L. Tree Photosynthesis Modulates Soil Respiration on a Diurnal Time Scale. Glob. Change Biol. 2005, 11, 1298–1304. [Google Scholar] [CrossRef]
  72. Aguilos, M.; Hérault, B.; Burban, B.; Wagner, F.; Bonal, D. What Drives Long-Term Variations in Carbon Flux and Balance in a Tropical Rainforest in French Guiana? Agric. For. Meteorol. 2018, 253, 114–123. [Google Scholar] [CrossRef]
  73. Brando, P.M.; Goetz, S.J.; Baccini, A.; Nepstad, D.C.; Beck, P.S.A.; Christman, M.C. Seasonal and Interannual Variability of Climate and Vegetation Indices across the Amazon. Proc. Natl. Acad. Sci. USA 2010, 107, 14685–14690. [Google Scholar] [CrossRef]
  74. Hutyra, L.R.; Munger, J.W.; Saleska, S.R.; Gottlieb, E.; Daube, B.C.; Dunn, A.L.; Amaral, D.F.; de Camargo, P.B.; Wofsy, S.C. Seasonal Controls on the Exchange of Carbon and Water in an Amazonian Rain Forest. J. Geophys. Res. Biogeosciences 2007, 112, 1–16. [Google Scholar] [CrossRef]
  75. Aguilos, M.; Stahl, C.; Burban, B.; Hérault, B.; Courtois, E.; Coste, S.; Wagner, F.; Ziegler, C.; Takagi, K.; Bonal, D. Interannual and Seasonal Variations in Ecosystem Transpiration and Water Use Efficiency in a Tropical Rainforest. Forests 2019, 10, 14. [Google Scholar] [CrossRef]
  76. Ile, O.J.; Aguilos, M.; Morkoc, S.; Minick, K.; Domec, J.C.; King, J.S. Productivity of Low-Input Short-Rotation Coppice American Sycamore (Platanus Occidentalis, L.) Grown at Different Planting Densities as a Bioenergy Feedstock over Two Rotation Cycles. Biomass Bioenergy 2021, 146, 105983. [Google Scholar] [CrossRef]
  77. Shi, W.Y.; Du, S.; Morina, J.C.; Guan, J.H.; Wang, K.B.; Ma, M.G.; Yamanaka, N.; Tateno, R. Physical and Biogeochemical Controls on Soil Respiration along a Topographical Gradient in a Semiarid Forest. Agric. For. Meteorol. 2017, 247, 1–11. [Google Scholar] [CrossRef]
  78. Davidson, E.A.; Savage, K.; Bolstad, P.; Clark, D.A.; Curtis, P.S.; Ellsworth, D.S.; Hanson, P.J.; Law, B.E.; Luo, Y.; Pregitzer, K.S.; et al. Belowground Carbon Allocation in Forests Estimated from Litterfall and IRGA-Based Soil Respiration Measurements. Agric. For. Meteorol. 2002, 113, 39–51. [Google Scholar] [CrossRef]
Figure 1. Aerial view of the study site: Butner, Durham County, North Carolina (left panel) and plot assignment (right panel).
Forests 13 01286 g001
Figure 2. Linear relationship between total soil respiration (Rtotal) and heterotrophic respiration (Rh) in the upper panels and autotrophic respiration (Ra) in the lower panels based on season. Each season is assigned with different colors. The linear regression line is colored black. The diagonal broken line is the 1:1 line. Average soil respiration per month was used in the analysis.
Forests 13 01286 g002
Figure 3. Linear relationship between total soil respiration (Rtotal) and heterotrophic respiration (Rh) in the upper panels and autotrophic respiration (Ra) in the lower panels based on planting densities (10,000 tph, 5000 tph, and 2500 tph). Each planting density is assigned with different colors. The linear regression line is colored black. Average soil respiration per planting density per month was used in the analysis.
Forests 13 01286 g003
Figure 4. Relationships among Rtotal, Rh, and Ra with soil temperature and soil water content using the seasons as a factor. Each season is assigned with different symbols and colors. Linear regression lines are colored according to season. Average soil respiration per planting density per month was used in the analysis.
Forests 13 01286 g004
Figure 5. Variation in total root biomass and litterfall across different planting densities (a,c) and seasons (b,d). In the boxplots, the thick line shows the median, the box extends to the upper and lower quartiles, and dashed lines indicate the range of data falling within 1.5 interquartile ranges of the box top and bottom. For a given graph, different letters denote significant differences among planting densities or seasons. Average monthly data were used in the analysis.
Forests 13 01286 g005
Figure 6. Relationships among Rtotal, Rh, and Ra and total root biomass with planting densities (ac) and seasons (df) as factors. Each planting density and season is assigned with different symbols and colors. Linear regression lines are colored according to season. Average soil respiration per planting density per month was used in the analysis.
Forests 13 01286 g006
Table 1. Variation in total soil respiration (Rtotal), heterotrophic respiration (Rh), and autotrophic respiration (Ra) with soil temperature and soil water content (SWC) by season and per planting density. Mean values represent the values across all treatments with ± standard deviation (SD). Values that were not significantly different at a 95% significant level (p > 0.05) are represented by the same letter.
Soil Respiration (g C m−2 d−1)Climate variables
Rtotal Soil temp. (°C)SWC (%)
Season
Jan–Mar 0.60±0.21b0.43±0.17c0.17±0.18b8.86±0.85b53.11±4.52a
Apr–Jun3.50±1.09a2.21±1.28ab1.28±0.85a19.84±0.99a45.30±6.41a
Jul–Sep4.01±1.11a3.20±0.81ab0.18±0.60ab22.62±0.76a15.59±7.07b
Oct–Dec1.42±0.29b1.11±0.31bc0.21±0.20b11.77±0.36b33.03±3.88c
Mean2.38±0.67 1.74±0.64 0.47±0.46 15.77±0.74 36.76±5.47
Planting Density
10,000 tph2.41±0.75a1.93±0.64a0.48±0.34a15.61±0.70a34.27±4.11a
5000 tph2.43±0.64a1.57±0.39b0.86±0.51b15.87±0.71a38.61±5.98a
2500 tph2.30±0.63a1.72±0.40ab0.59±0.53ab15.83±0.80a37.41±6.33a
Mean 2.38±0.67 1.74±0.47 0.64±0.46 15.77±0.74 36.76±5.47
Publisher’s Note: MDPI stays neutral with regard to jurisdictional claims in published maps and institutional affiliations.

