Article

Assessment of Possible Production Leakage from Implementing the EU Biodiversity Strategy on Forest Product Markets

Thünen Institute of Forestry, Leuschnerstraße 91, 21031 Hamburg, Germany
*
Author to whom correspondence should be addressed.
Forests 2022, 13(8), 1225; https://doi.org/10.3390/f13081225
Submission received: 14 June 2022 / Revised: 20 July 2022 / Accepted: 22 July 2022 / Published: 2 August 2022
(This article belongs to the Special Issue Modeling National and Global Forest Product Markets and Trade)

Abstract

:
The EU Biodiversity Strategy (EUBDS) for 2030 aims at regaining biodiversity by strengthening the protection of nature in the European Union. This study models and analyses possible impacts of the EUBDS on the production and trade of forest-based products in the EU and non-EU countries in two alternative scenarios. Implementing EUBDS measures would allow a maximum EU roundwood production of roughly 281 M m3 in 2030 in the intensive and 490 M m3 in the moderate scenario. Since in the reference scenario, the EU roundwood production amounts to 539 M m3 in 2030, this represent a reduction of −48% and −9% in 2030, respectively. Until 2050, the production further decreases and accounts for 42% and 90% of the reference production. Globally, the EU roundwood production deficit is compensated partly (roughly between 50%–60%) by increasing production of roundwood in non-EU countries (e.g., USA, Russia, Canada, China and Brazil) whereas the remaining share of the EU production deficit is no longer produced and consumed worldwide. In the EU, reduced roundwood availability leads to a lower production of wood-based products, although, apparent consumption of wood-based products remains similar. This is mainly caused by significantly lower export volumes of wood-based products and, for some product groups, by significantly increased imports as well. This is partly due to unchanged assumptions regarding income and thus, demand patterns. However, on a global level, decreased production and consumption of wood-based products could lead to a growing use of non-bio-based resources to substitute wood-products. Our study also shows that the magnitude of effects strongly depends on how much the use of forest resources is actually restricted.

1. Introduction

The EU Biodiversity Strategy (EUBDS) for 2030 aims at regaining biodiversity by strengthening the protection and restoration of nature in the European Union (EU) [1]. Key objectives of the strategy are: (i) the creation of protected areas on at least 30% of Europe’s land and sea areas; (ii) the strict protection of at least one third of the EU’s protected areas, including all remaining EU primary and old-growth forest, and (iii) the effective management and monitoring of all protected areas, based on clear conservation objectives and measures. With regard to the term “strictly protected areas”, it is stated that “strict protection does not necessarily mean the area is not accessible to humans, but leaves natural processes essentially undisturbed to respect the areas’ ecological requirements” [1] (p. 5). The definitions of other protected assets, such as “old-growth forest”, are mentioned but have not yet been conclusively determined at either the EU or national level. Thus, the EUBDS leaves room for interpretation concerning the definition of protected assets, e.g., “strict protection” and “primary and old-growth forests”. Even though the EUBDS aims at enlarging protected areas, it does not specify which protected area categories are eligible to account for the 30% protected and 10% strictly protected area goals and how the additional protected areas should be allocated to the (terrestrial) land use types.
In the past, implementation of environmental policies sometimes caused indirect impacts that counteracted the actual aims of this policy, thus reducing its overall benefit [2]. This classifies as leakage, a subset of the broader term spillover [3]. A spillover can be any form of collateral effect that takes place across established boundaries, be they geographical, temporal, jurisdictional, sectoral or political [3,4]. In the environmental sector, spatial displacement effects often occur, i.e., the desired effect in one region is counteracted by unintended negative effects on the same environmental asset in places not initially focused on by the original measure [5]. Thus, the protection of forests in one region could influence the use of forest resources in other regions, as the markets for wood and wood-based products are highly interlinked via international trade [6,7]. Leakage then occurs to the extent that, e.g., the limited use of timber resources due to increasing forest protection in one region is offset by additional timber production in regions that are not affected by the conservation program or policy [8]. The extent to which leakage occurs is influenced by principle market characteristics, including (i) response of supply and demand to price changes, (ii) spatial coverage of additional protection efforts and (iii) homogeneity of the affected products [2,6,8,9]. Previous studies state that the extent of leakage is related to price elasticities of supply and demand; the magnitude of leakage increases with increasing price elasticity of supply and decreasing price-elasticity of demand [2,6,8]. The magnitude of leakage also depends on the number of countries involved in protection efforts. Mutual implementation of a policy on a large geographical scale can reduce overall leakage in absolute terms. However, in relative terms, leakage tends to be aggravated if a policy is only applied to small geographical area [6,8]. Finally, products from one and another region that are homogenous and thus, perfectly substitutable, are expected to be more affected by leakage [6,8,9].
In the past, several studies assessed the impact of different forest protection measures on forest markets. Jonsson et al. [2] analyzed ten studies on market leakage from forest protection efforts to reduce or enhance greenhouse gas emissions or sequestration, respectively, and found evidence that increased forest conservation in one country could lead to leakage effects of varying degrees for both tropical and non-tropical countries. Their findings are backed by the study of Li et al. [10], who found that eliminating illegal logging would shift wood production from developing to developed countries. Vice versa, Sohngen et al. [11] found that enhanced forest protection in Europe or North America could increase wood production in natural forests in other parts of the world. In addition, more recently, different studies on impacts of environmental policies have been carried out on a national level, e.g., in terms of harvest leakage from Norway [12] and China [13] to countries in the rest of the world, or in terms of domestic impacts on wood-processing sectors in Canada [14]. Ford et al. [15] detected a prevalence of deforestation leakage into surrounding buffer zones stemming from the protected areas in 120 tropical and subtropical forest regions. On the European level, Kallio et al. [9] examined the effects of the introduction of enhanced carbon sequestration goals in European and Norwegian forests. They found that production of wood and wood products declines, which leads to increasing production in countries in the rest of the world.
In 2020, Dieter et al. [16] carried out a first assessment on possible leakage effects from implementing the EUBDS. Even though the objective of Dieter et al. [16] is similar to the objective of the present study, it only investigates one possible pathway EUBDS implementation. The quantitative model used for Dieter et al. [16] relies on older wood products market, socio-economic and bio-physical input data from the FAO forestry statistics [17], IPCC scenario A1 [18] and the Forest Resources Assessment 2010 [19], respectively. Compared to the preliminary study of Dieter et al. [16], the two implementation scenarios modelled in the present study open a range on possible changes in protected area coverage, resulting roundwood production levels and related magnitudes of leakage. In addition, the present study uses more recent data on wood product market developments reported in [17] and is based on the updated socioeconomic development pathway offered by the SSP 2 scenario [20] and forest data from the most recent FAO Forest Resources Assessment [21].
Policy strategies such as the EUBDS often do not provide operational information. To address and evaluate the uncertainties connected to policy implementation, the use of scenarios is a common tool, e.g., [13,22,23]. Scenarios provide the possibility of taking a long and wide look into the future. They enable long-term and system-oriented observations and thus, allow for system-oriented observations as orientational knowledge for decision support and guidance for options of action in the present. This way, scenarios are always hypothetical, but by no means arbitrary [23]. Consistent scenario construction is guided by a methodological procedure that considers basic properties and building techniques for scenarios for quality assurance, transparency and credibility. Thereby a scenario can fulfill a number of basic functions [23], of which the following are of relevance in the context of our study: (i) the explorative and knowledge function which makes basic assumptions about future developments explicit and shows possible development pathways together with conflicting goals, (ii) a communication function which supports discourse, uncovers problems and informs decision-making and (iii) a strategy formation function which helps to evaluate decisions, measures and strategies [23]. Furthermore, holistic scenarios are characterized by basic properties: their character (explorative vs. normative), their type (quantitative vs. qualitative), their purpose (reference vs. alternative) and their scope [23].
With the exception of the above-mentioned study carried out by Dieter et al. [16], quantitative policy assessments of the EUBDS within the forestry sector have not been carried out so far. Against the described background, we analyze possible leakage effects from EUBDS implementation. We perceive leakage as shifts in production of roundwood and wood-based products (production leakage) from the EU to non-EU countries. We measure leakage as the absolute difference in production of either roundwood or various wood products between a reference scenario and two alternative scenarios where the roundwood supply is reduced in the EU in a given year.
The objectives of this study are to quantify absolute production leakage due to EUBDS implementation and to identify the countries that are likely to compensate for the EU’s production deficit by increasing the production of roundwood and wood-based products. This further highlights accompanying changes in the international trade of roundwood and wood products.
In the still ongoing implementation process of the EUBDS, this study provides a second updated and more holistic assessment of possible impacts of policy implementation on the wood-based sector. By combining scenario building techniques and quantitative scenario modelling, it offers guidance on designing national EUBDS implementation in the member states.

2. Materials and Methods

As noted above, the EUBDS does not provide operational definitions of its objectives, protected assets and management measures. To address the resulting uncertainties, we draft a moderate and intensive EUBDS implementation scenario (MSC and ISC, respectively) in order to open a plausible range of possible related impacts of EUBDS implementation on global forest product markets. First of all, EUBDS implementation will most likely result in the designation of additional protected forest areas. This will exogenously restrict roundwood production in the EU as compared to a reference scenario (RSC) and may have effects on production leakage and trade patterns. In Section 2.1, we introduce basic scenario characteristics and development and describe scenario generation in Section 2.2. Section 2.3 gives a short introduction into the Global Forest Products Model (GFPM) [24] used for the policy impact analysis carried out in this study.

2.1. Scenario Basics: Characteristics, Functions and Building Techniques

The scenario building process of our study is based on scientific desk research and follows the approach described by Kosow and Gaßner [23]. According to the EUBDS’ objectives, alternative forest management measures include additional set-aside and protection of forest area, (non)-utilization of “old-growth forest” and the implementation of forest management schemes that result in reduced levels of roundwood supply in contrast to a reference. Thus, the field and topic of this scenario study is the EU biodiversity strategy 2030 and the extraction of policy topics and related goals in the context of forestry and forest product markets. Identified key factors to be analyzed in this field are: (i) possible forest management measures that are to be taken, (ii) the determination of changes in roundwood supply and (iii) consecutive impacts on production and trade patterns of wood and wood-based products.

2.2. Scenario Generation

So far, only one study qualitatively discussed possible EUBDS implementation impacts [25]. Regarding quantitative impacts on forest product markets, Germany is the only EU country so far that carried out a policy impact analysis of the EUBDS on the national level and provided a first estimate of possible roundwood production reduction following EUBDS implementation in Germany. [16,26]. German National Forest Inventory data and the data of German Forest Development and Timber Volume Modelling provide detailed information on forest structure, management schemes and forest production [27,28], which is a prerequisite for impact analysis. For the present study, we refine the approach of Dieter et al. [16] (see Section 2.2.1) and evaluate the suitability of forest structure and protected area coverage in Germany as an estimator for EU-27 in order to use German results in EUBDS implementation (Section 2.2.2) as a basis for scenario building on the EU level (Section 2.2.3). For this evaluation, we selected quantitative key factors relevant for scenario generation. The results and summary are given in Table A1.
First, we examine how the relative German protected area coverage fits the EU protected area coverage in EU member states. Referring to a “forest area within legally established protected areas” (includes IUCN Categories I–IV, excludes IUCN Categories V–VI [29,30] as reported in FAO [21], Germany ranks in the third quartile of protected area coverage distribution of EU member states. Comparing the status quo of non-strictly protected areas according to MCPFE Class 1.3 and MCPFE Class 2 [31] in Germany and the EU reveals that Germany has a larger share of protected forests than the rest of the EU. Thus, a transfer of German scenario assumption to other EU member states tends to underestimate the impact of the implementation of an EUBDS. Therefore, the approach can be considered as conservative. Looking at strictly protected areas (MCPFE Class 1.1 and MCPFE Class 1.2 [31]), we see that, except for few exceptional countries that hold high shares of land in this category, Germany possesses marginal shares of land in these categories and would reflect the EU situation well if future strictly protected areas were predominantly located in forests. Since the occupancy of protected areas in the EU is comparable with Germany, the EUBDS would have a comparable effect at the EU level as in Germany.
Second, we create and analyze a normalized coefficient which relates forest area to growing stock to roundwood production (“roundwood production intensity”). Here, the use of a normalized, proportional coefficient appears as the proper approach since further analysis of reduced roundwood production impacts bases on relative reduction rates. Table 1 shows that the German value is well in the range of the EU average and median roundwood production over growing stock density.
Taking the above-mentioned findings into account, we conclude that the reduction of roundwood production in Germany can be considered as a valid estimator in further scenario building processes.
In the following, we describe the draft of two implementation scenarios: a moderate (MSC) and an intensive implementation scenario (ISC), which are based on two different interpretations of the EUBDS terms “protected area” and “strictly protected area”, different EU and national protection categories, different allocation of additional protected areas to forest and non-forest land uses, contrasting understanding of “old-growth forests” and varying management measures of protected forests.

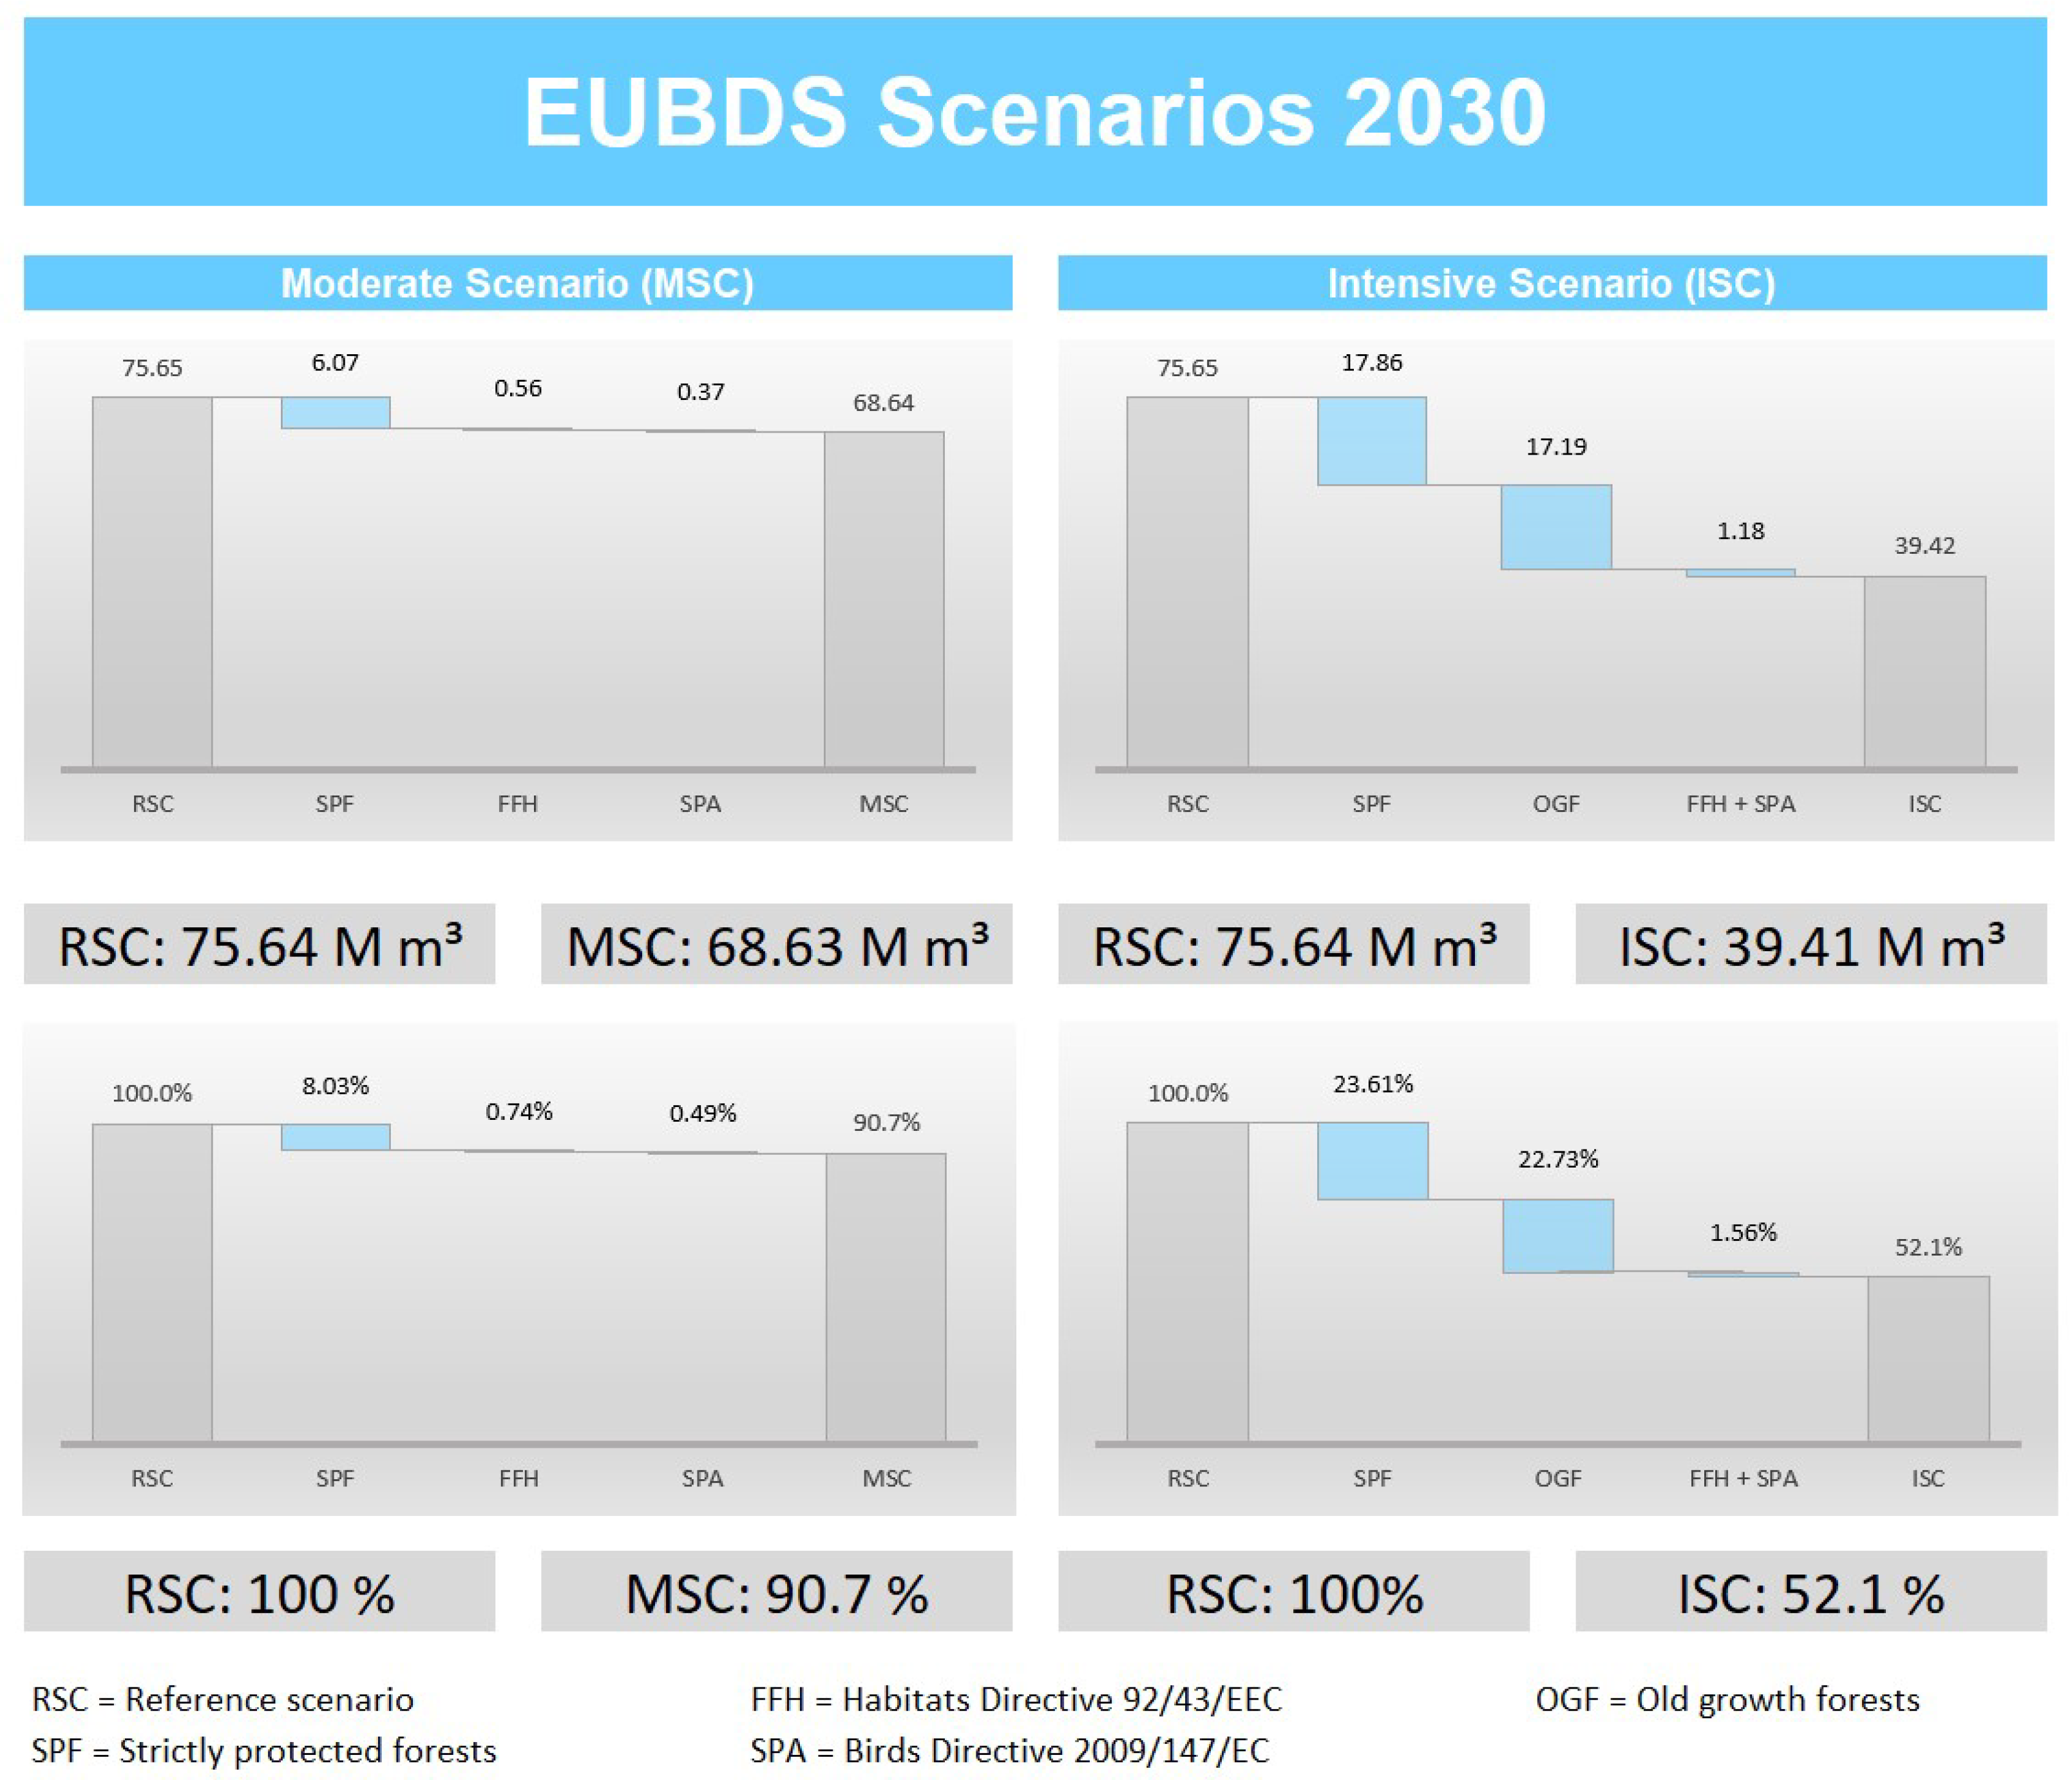
2.2.1. WEHAM Scenario and EUBDS Implementation Scenarios for Germany

As the EUBDS does not provide operational definitions, we define two different current protected area coverages (PAC) in order cover a range of possible effects of the EUBDS implementation. We calculate additional PAC (PAC+) as the difference between current and future PAC. For further information on the current protected forest area in Germany see Appendix A.
Both implementation scenarios are based on a total area of Germany of 35.803 M ha, of which 11.125 M ha is forest and 24.668 M ha is non-forest land uses [32], as seen in Table A2. The EUBDS’ objectives translate into a future protection area of at least 10.741 M ha (i.e., 30% protected areas), of which at least 3.580 M ha (i.e., 10%) shall be strictly protected, including all primary and old-growth forests. For both implementation scenarios, we follow the definition given by Steinacker et al. [33], where “strict protection” results in natural forest development without raw wood production.
MSC is built on a PAC that includes existing protected areas under the Natura 2000 framework, i.e., Habitats Directive sites (FFH sites) and Birds Directive sites (Special Protection Areas (SPA)) and areas protected under the implementation of the National Strategy on Biological Diversity [34], i.e., forests under “natural forest development” and are therefore “strictly protected” [35] (see Table A2). Based on these assumptions, 2.8 M ha are already under protection in forests, of which 227,000 hectares are strictly protected. This corresponds to 25% (protected) and 2% (strictly protected) of the forest area, respectively.
PAC+ is realized by designating new Natura 2000 areas, which are allocated to forest and non-forest land according to the actual distribution of forest and non-forest land in Germany. In forests, PAC+ is further allocated to main tree species groups and age classes according to their current distribution and the distribution of habitat types [28,36]. Consequently, 2.6 M ha have to be additionally protected in forests, of which 1.031 M ha are to be strictly protected. In protected areas where roundwood production is still allowed, it is assumed that roundwood production is restricted at 45% and 50%, following conservation management requirements of FFH sites and SPA, respectively [36,37].
In the ISC, all protected area categories (i.e., according to European and national classifications) are included in the current PAC (see Table A3). This results in a current total PAC of 14.7 M ha, which corresponds to 41% of Germany’s total area and therefore meets the EUBDS goal. In forests, 6.471 M ha (i.e., 58% of forest area) are already protected, of which 161,000 ha are protected strictly (1.4% of forest area) (Table A3 and Table A4) [32]. The target for strict protection (i.e., one third of all protected areas) translates into 4.904 M hectares to be strictly protected (Table A4). In the ISC, we assume that the only realistic potentials for strict protection outside of forests lie in peatland restoration. We assume that 500,000 ha of organic soils used for agriculture can be put under strict protection [32]. Consequently, an additional forest area of 4.164 M ha has to be strictly protected, which is 3.1 M ha more forest area as compared to MSC (Table A4).
In the ISC, management schemes of existing Natura 2000 areas will be implemented at all protected areas. The future management intensity will correspond to the current management intensity of FFH beech habitat types [36,37]. The protection of primary and old-growth forests includes all forests whose current age exceeds the usual rotation period of the respective wood species group (oak > 160 a, beech and spruce > 120 a, pine > 140 a). In the ISC, 58% of the forest area is located in future PAC and 37% in future strict PAC.

2.2.2. Roundwood Production under Possible EUBDS Implementation in Germany

The Forest Development and Timber Volume Modelling (WEHAM) [27] serves as reference for the implementation of additional forest protection measures from the EUBDS in Germany. The WEHAM scenario was based on data of the third National Forest Inventory in Germany [28] and therefore refers to the year 2012. According to Rock et al. [27], the scenario represents forestry practices and experiences, existing forest protection measures and near-future expectations for forest management and market developments for Germany at the time of the WEHAM scenario development. Since the EUBDS’ objectives are to be achieved by 2030, we use WEHAM scenario data on potential roundwood production for the projection period from 2028 to 2032.
We calculate the decrease in roundwood production as the difference between potential roundwood production estimated by the WEHAM scenario and the roundwood production of each of the implementation scenarios.
The WEHAM scenario provides data on potential roundwood production for each tree species group and age class [27]. The WEHAM scenario does not provide information on the allocation of protected forest area to the respective wood species group and age class. Thus, for PAC+ for protected and strictly protected areas in both implementation scenarios, we allocate wood species groups and age classes (Table A5) according to their current distribution [28].
Compared to the WEHAM scenario, roundwood production in additional strictly protected areas is excluded. In the ISC, potential roundwood production in all age classes above the usual rotation period is also excluded, as these age classes are defined as “old-growth forests” (see Table 2). In protected areas with management restrictions (FFH, SPA), potential roundwood production is reduced by applying a discount factor of 0.19 [36,37]. Potential roundwood production of all scenarios is shown in Table A6. Based on a total annual potential roundwood production of 75.65 M m3 in the WEHAM scenario, annual roundwood production is reduced to 68.64 M m3 (90.7%) and 39.42 M m3 (52.1%) in the MSC and the ISC starting in the period from 2028–2032 and continues onwards, respectively (Figure 1).

2.2.3. Scenario Generation on EU Level

For the simulation of two alternative implementation scenarios on the EU level, we transfer roundwood reduction factors as calculated for Germany to all EU member states. Even though we acknowledge that protected area coverages, forest structure and management differ within the EU, we thus assume that the EUBDS implementation in other EU member states will have a comparable proportional impact on roundwood production as in Germany (see Section 2.2, Table A1). We use one reduction factor for the total roundwood production (see Section 2.2.2) and apply this factor to reduce coniferous and non-coniferous as well as fuelwood production, respectively. We assume that the implementation of the EUBDS would be gradual and completed in 2030. Reduction factors are used to exogenously decrease roundwood supply in each of the EU member states from 2017 onwards until the roundwood supply in 2030 is at 52% (ISC) and 91% (MSC) compared to the roundwood supply of RSC. For modelling long-term effects of changing roundwood production after 2030 in both implementation scenarios, we retain the exogenous upper production limits until 2050 for each of the EU member states. Thus, for the modelling period from 2030–2050, roundwood production remains reduced to 91% (MSC) and 52% (ISC) of the RSC supply. However, since this exogenous limitation of roundwood production has the function of an upper production limit, it represents the maximum production potential. The actual roundwood production in both implementation scenarios can be lower.

2.3. Quantitative Scenario Analysis: Forest Products Market Modelling

The use of a quantitative model can help to put the goals and impacts of policies to the test [38,39]. The analysis of leakage effects by means of general equilibrium modelling [40] or partial equilibrium market modelling are proven methodological approaches for this type of analysis [41]. With the help of dynamic mathematical simulation models, it is possible to simultaneously evaluate country and product-specific market developments over time, which are otherwise difficult to grasp in their complexity. The Global Forest Products Model (GFPM) [24] has proven to be such an instrument for policy impact or scenario assessment in the past [42,43,44,45].
The GFPM is a partial equilibrium model for the global forest products market that simulates production, consumption and trade of wood and wood-based products in 180 countries. The model structure distinguishes between raw, intermediate and end products. The GFPM has been used to analyze possible effects of trade barriers [46,47], payments for the compensation of greenhouse gas emissions [47,48] or possible benefits and losses from international trade in the forest-based sector [49]. Schier and Weimar [42] introduced an advanced version of the GFPM, the GFPMCNC. The GFPMCNC differentiates industrial roundwood and sawnwood into coniferous and non-coniferous industrial roundwood and sawnwood, respectively. Subsequently, intermediate and end commodities are hence to be produced from a mix of coniferous and non-coniferous industrial roundwood. This modification has been successfully implemented, tested and applied in previous studies [42,50]. For this study, the GFPMCNC is recalibrated according to the procedure introduced in Schier et al. [51]. For the sake of simplicity, in the following text we refer to “GFPM”; however, explanations are valid for both model versions: GFPM and GFPMCNC. The input data for calibrating the GFPM are obtained from three global databases: The FAO forestry statistics [17], the FAO Forest Global Resources Assessment [21] and the World Bank [52]. The model output comprises information about production, consumption and trade quantities, supply and demand prices as well as forest area development.
Scenario simulations with the GFPM are guided by parameters and assumptions shaping possible future developments. In the GFPM model framework, wood products are implicitly assumed to be perfect substitutes, regardless of their origin, as long as they belong to the same commodity group. As the optimization of the market equilibrium in a given state does not include an elasticity of substitution, demand is merely shifted by changes in income and price [8] whereas supply depends on changes in wood prices and forest stock. The development of the gross domestic product (GDP as an indicator for economic income) is an important exogenous driver of change in the GFPM. As demand for wood-based products is positively correlated to income, an increase in income basically leads to an increase in demand. Forest development and thus, timber supply is coupled to GDP per capita developments based on the concept of the environmental Kuznets curve [53]. In the equilibrium processes, product supply, demand and price formation are balanced for each simulation period. This study relies on assumptions about future GDP developments and population growth as stated in the “Middle of the road” scenario described in “The Shared Socioeconomic Pathways” (the so called SSP2 scenario). This scenario describes a world of modest population growth and where social, economic and technological trends continue similarly to historical patterns [54]. Further exogenous scenario specifications are the same as published in the GFPM [24] version 1-29-2017-World500 (available at https://onedrive.live.com/?authkey=%21AEF7RY7oAPlrDPk&id=93BC28B749A1DFB6%21118&cid=93BC28B749A1DFB6, accessed on 10 June 2022) with the exception of demand elasticities of income and price for coniferous and non-coniferous sawnwood. These are taken from the estimations carried out by Morland et al. [55]. The base year for the scenario simulations with the GFPM is 2017. Based on the GFPM input data described in Section 2.3, we run the reference scenario (RSC). In RSC, no specific restrictions on roundwood production for the EU are assumed.

3. Results

We present the main modelling results by first focusing on the EU roundwood production (Section 3.1) and then differentiating into impacts on industrial roundwood and fuelwood production (Section 3.1.1) and connected trade effects (Section 3.1.2). In Section 3.2, we present the findings on the main wood-based product groups. Results on the trade of wood-based products and the implication on apparent domestic EU consumption (production plus imports minus exports of EU countries) of wood and wood products are presented in detail in Table A7. Section 3.3 informs about the main production leakage effects of roundwood and wood-based products.

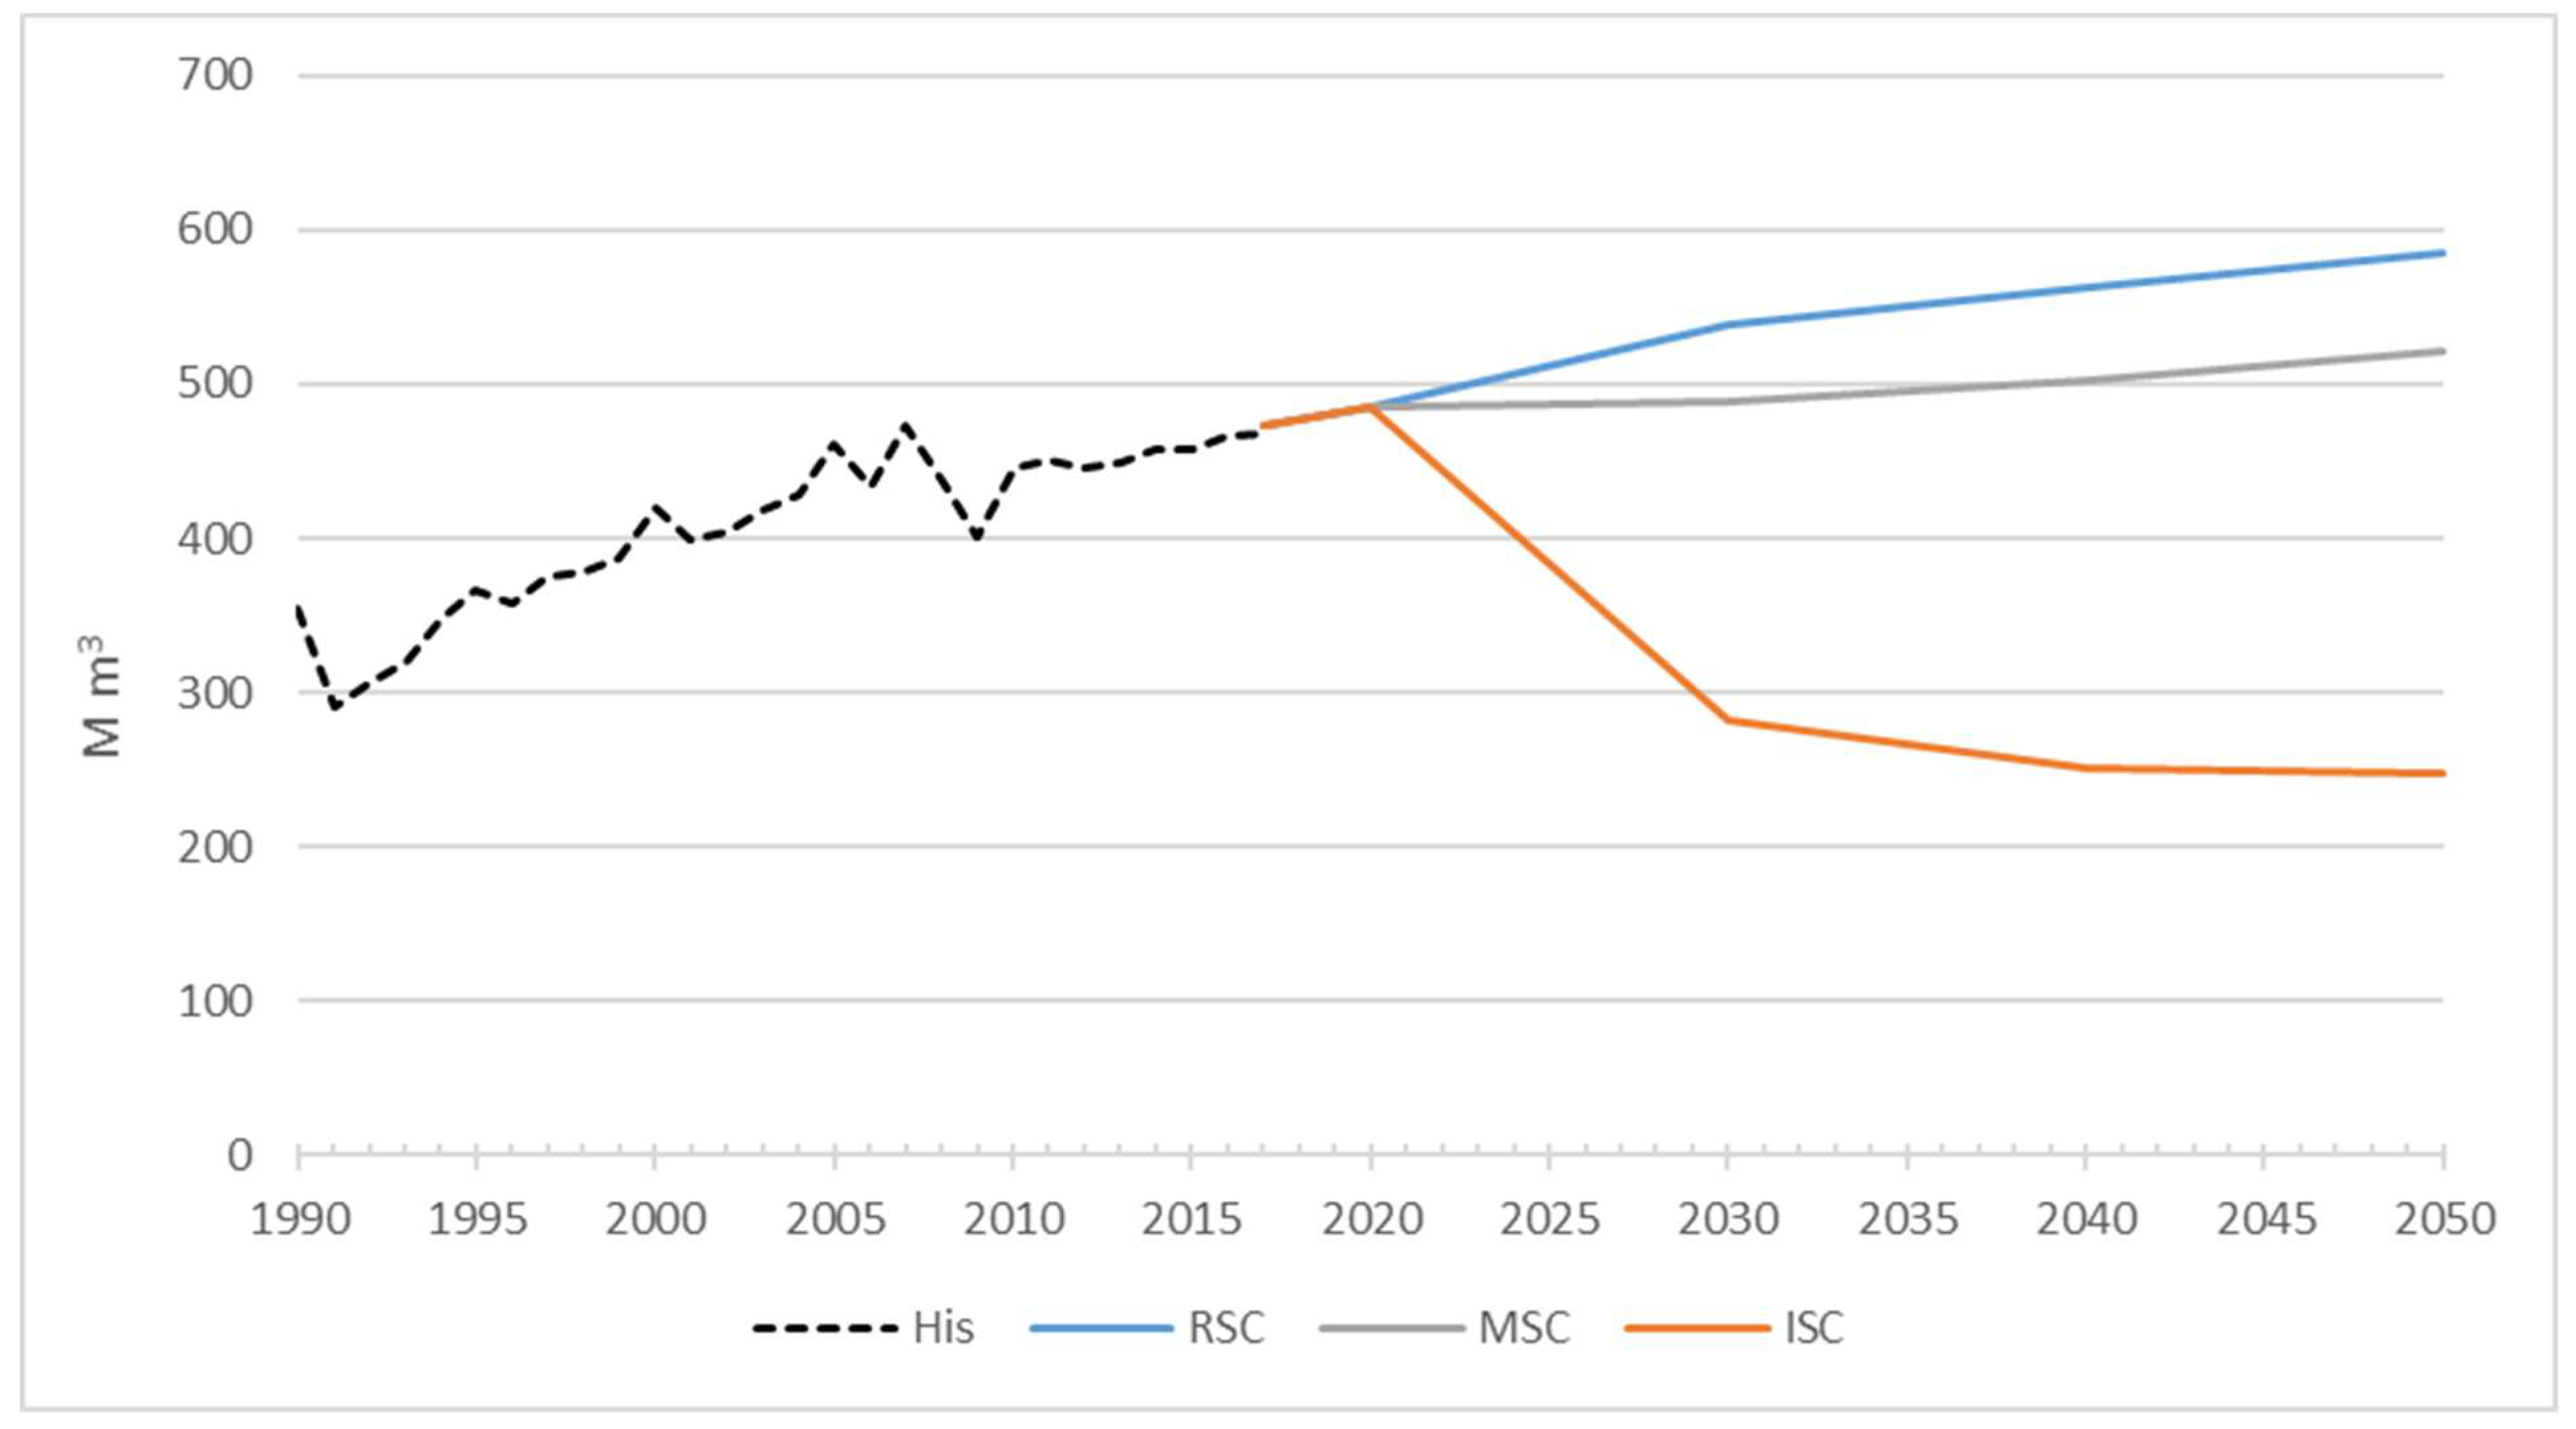
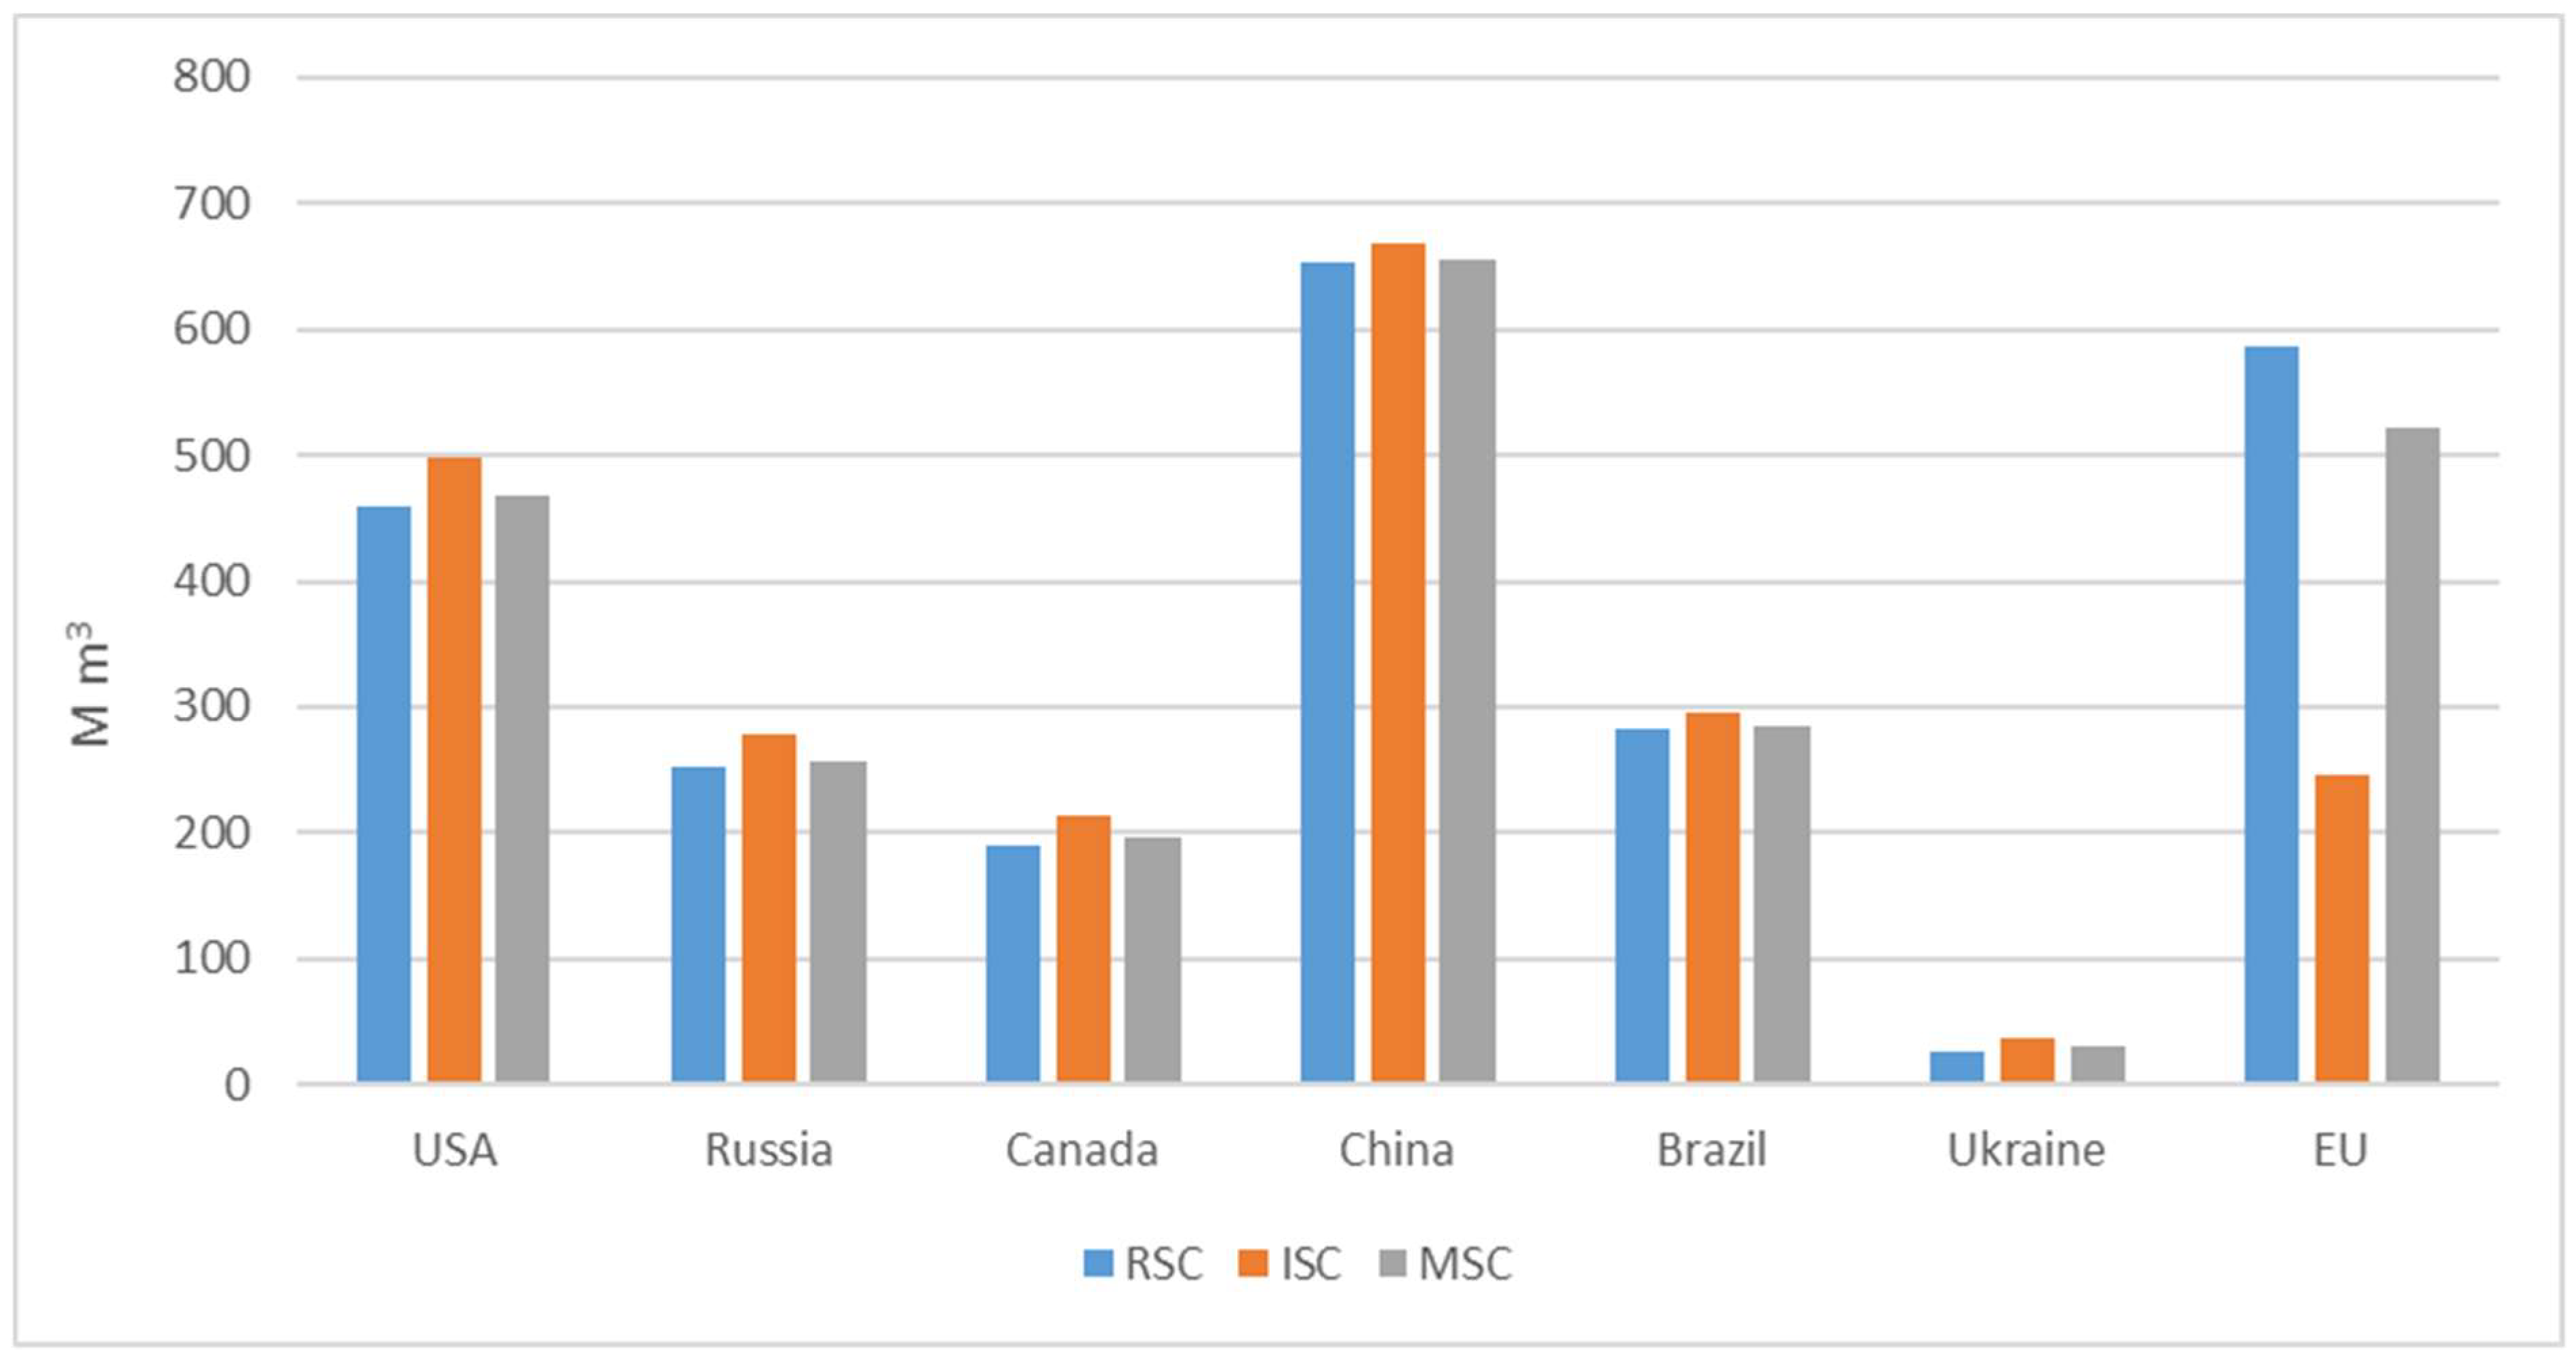
3.1. Impact on EU Roundwood Production

Total roundwood production includes industrial roundwood, differentiated into coniferous and non-coniferous, other industrial roundwood and fuelwood production. European roundwood production in the base year 2017 is simulated at 473.6 M m3. In the RSC, it increases to 539.4 M m3 in 2030 and further to 586.0 M m3 in 2050. In the ISC, total EU roundwood production is roughly 48% and 58% lower and amounts to 281.8 M m3 in 2030 and to 247.8 M m3 in 2050, respectively. In the MSC, the European roundwood production is roughly 9% and 11% lower in 2030 and 2050, respectively, and amounts to 489.5 M m3 and 521.2 M m3 (Figure 2).

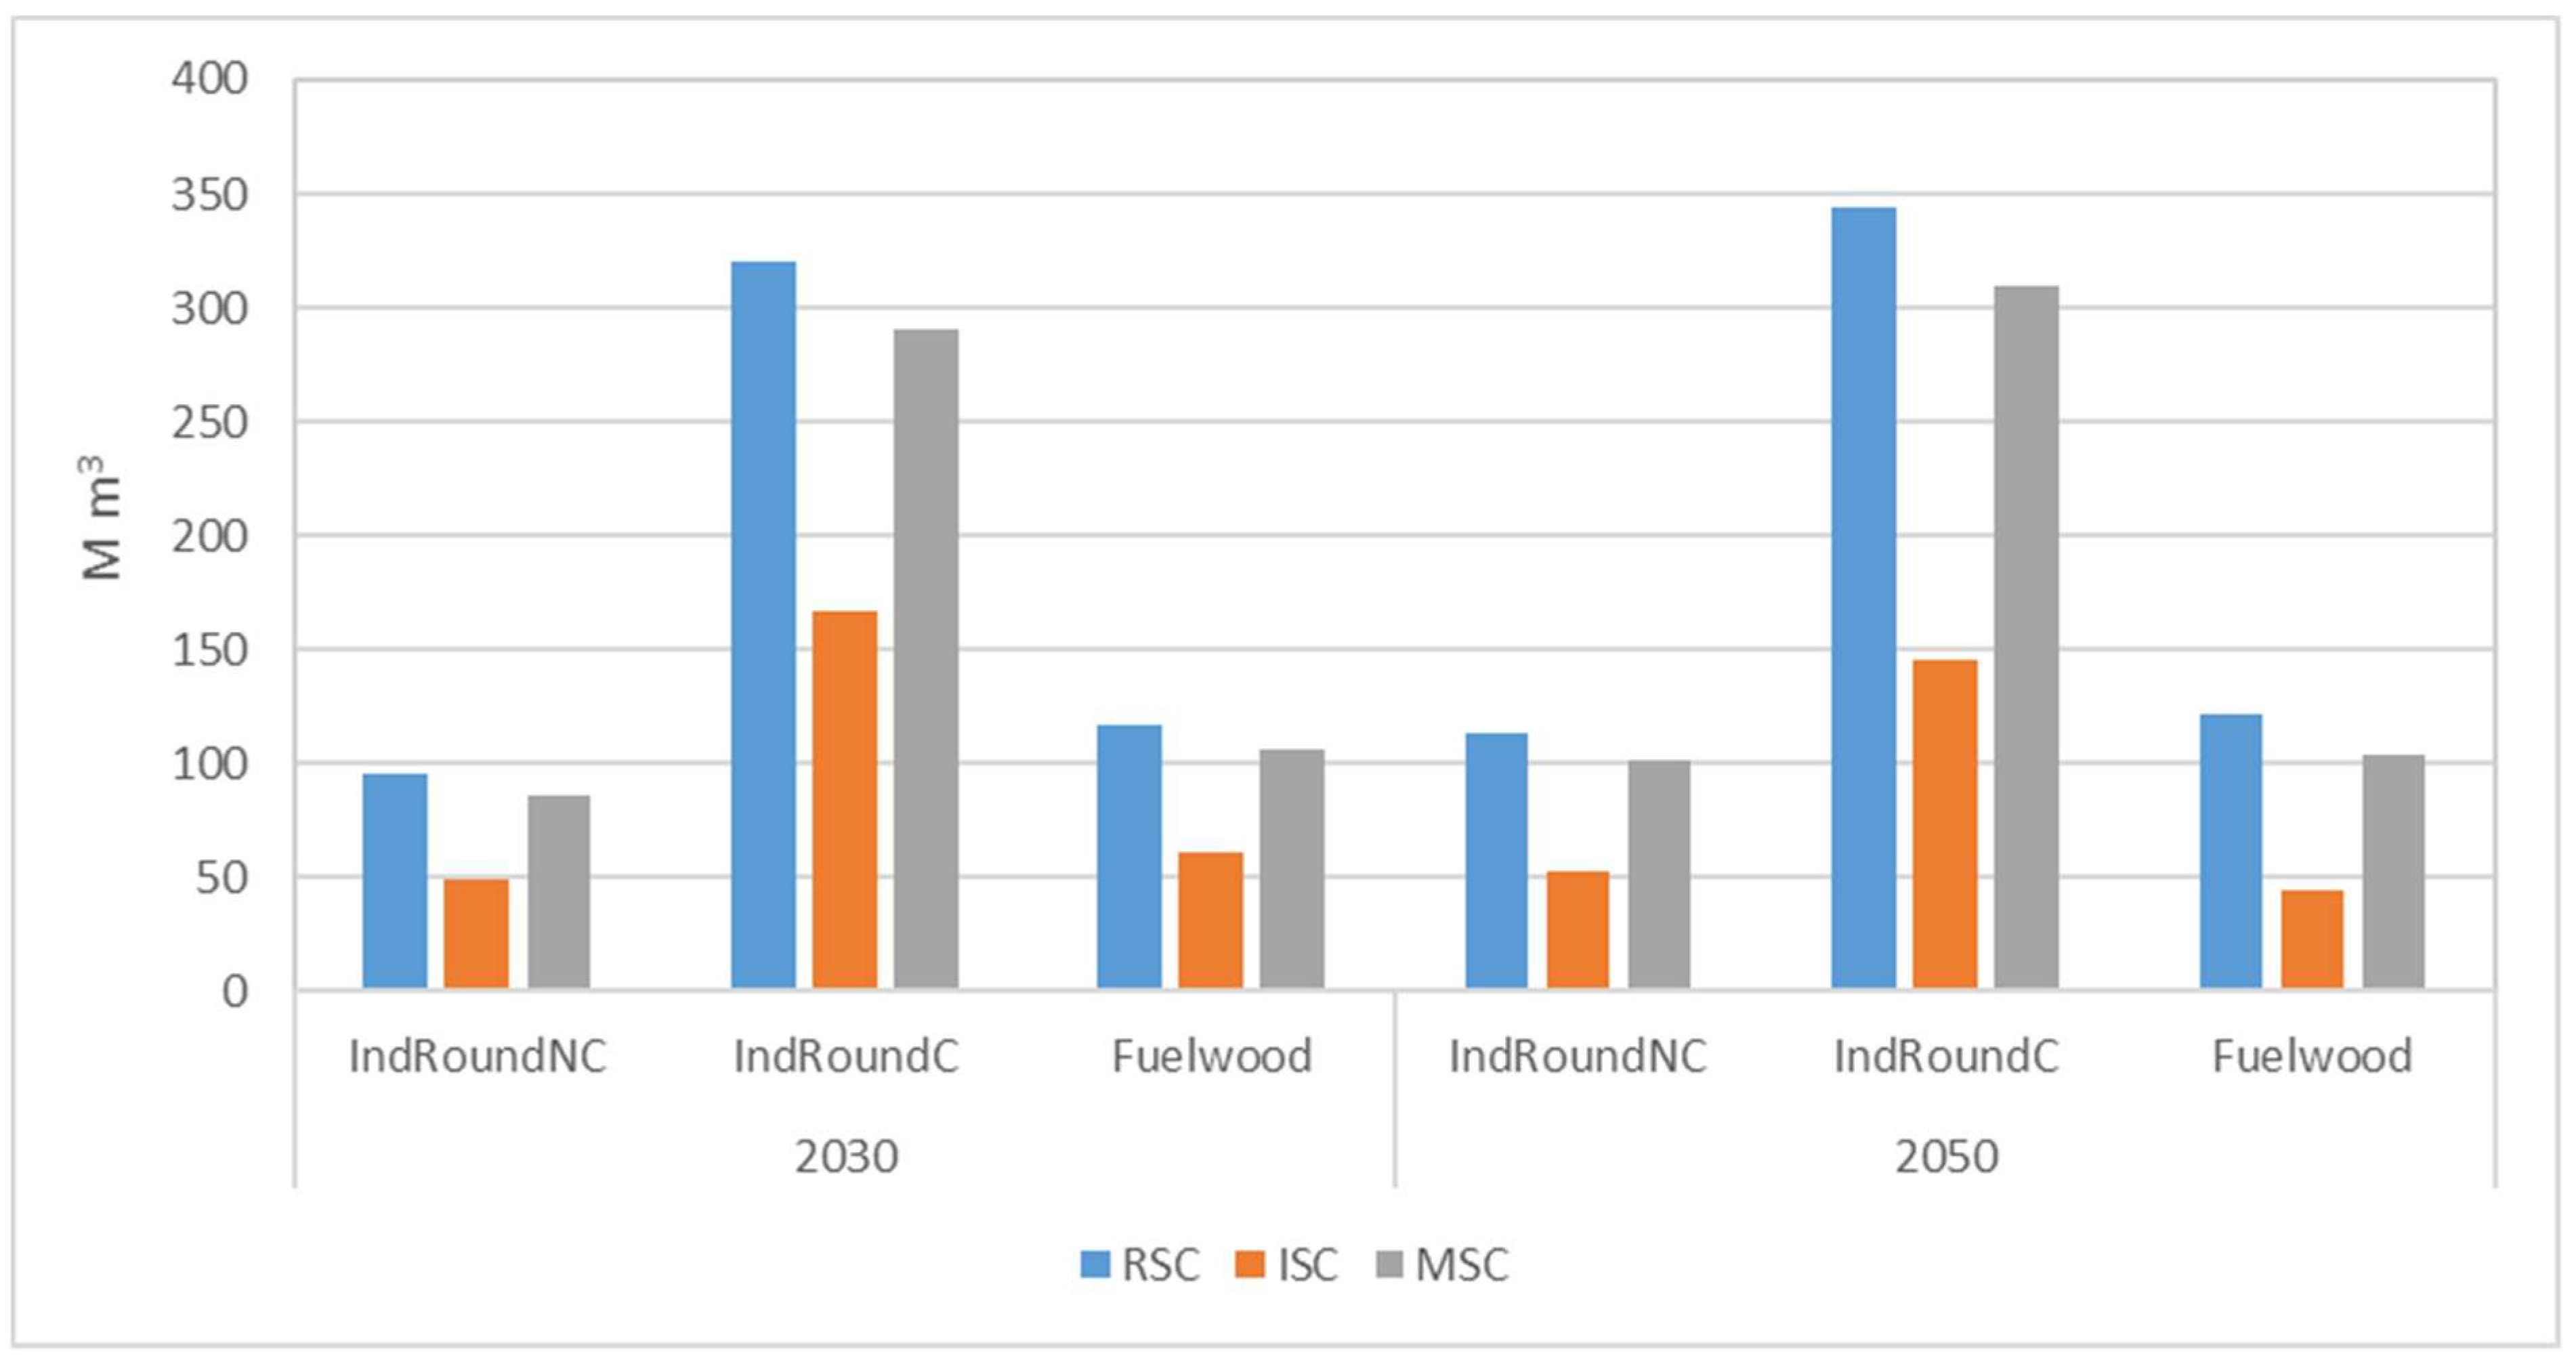
3.1.1. Impact on Industrial Round and Fuelwood Production

EU production of coniferous industrial roundwood in the base year 2017 is 278.1 M m3. In the RSC, it increases to 343.5 M m3 up to 2050 (Figure 3). In the ISC, its production in 2030 is 48% lower than in the RSC. Up to 2050, the production further decreases and accounts for 42% of the production in the RSC. In the MSC, the production of coniferous industrial roundwood increases moderately towards 2050 and is only 10% lower than in the RSC (Table A7).
In 2017, EU production of non-coniferous industrial roundwood amounts to 76.3 M m3. In the RSC, it increases up to 2050 (Figure 3). In the ISC, the production of non-coniferous industrial roundwood is reduced by 48% and 53% in 2030 and 2050, respectively. In the MSC, production steadily increases up to 2050. However, in comparison to the RSC, this equals a minus of 10%, respectively (Table A7).
In the base year 2017, the production of fuelwood is estimated at 112.3 M m3. In the RSC, it moderately increases until 2050 (Figure 3). In the ISC, it strongly decreases to 52% and 37% of the reference production in 2030 and 2050, respectively. In the MSC, the fuelwood production in 2030 and 2050 is 9% and 15% lower compared to the RSC (Table A7).

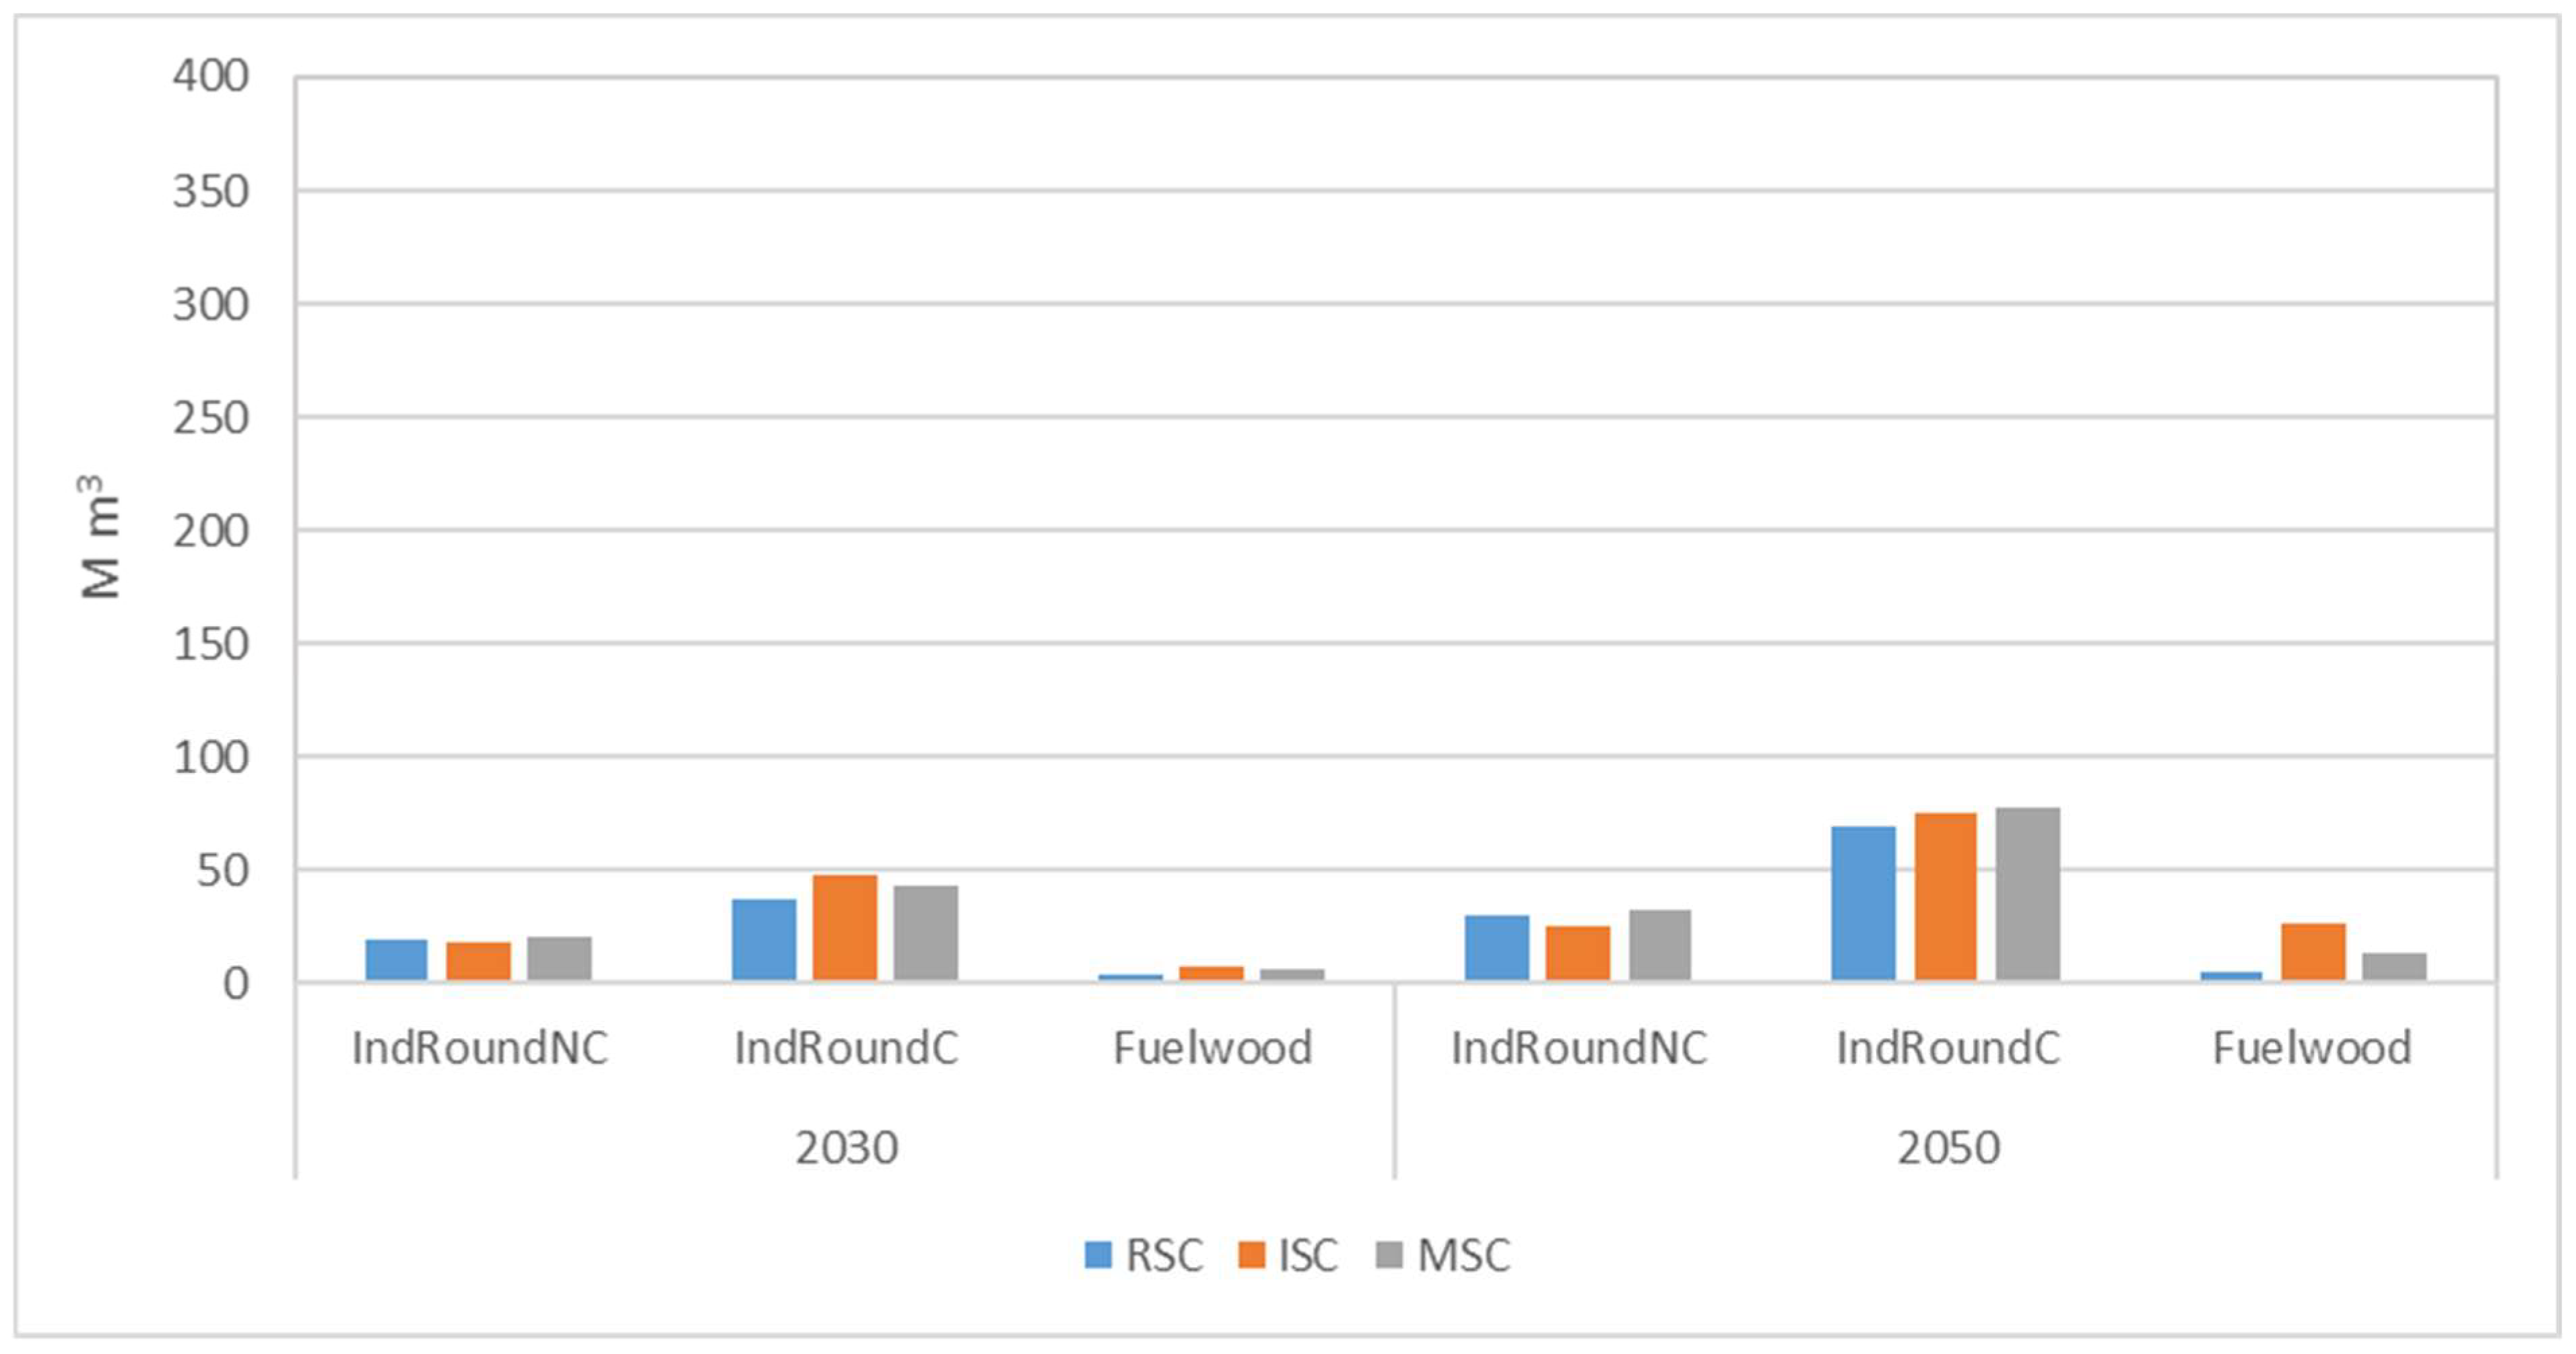
3.1.2. Trade Effects in European Roundwood Markets

The imports of EU countries of roundwood (fuelwood and industrial roundwood) in the base year 2017 is simulated at 56.7 Mio. m3. In the RSC, EU roundwood imports from non-EU countries increase to 105.8 Mio. m3 up to 2050. Coniferous industrial roundwood accounts for the majority of roundwood imports. Both coniferous and non-coniferous industrial roundwood imports nearly double up to 2050 in the RSC whereas import volumes of fuelwood are both small but also show strong relative increases (Table A7). Please note that Figure 4 describes aggregated import of all EU countries and, hence, does not consider intra-EU trade.
In both implementation scenarios, the import quotas of coniferous industrial roundwood exceed those of the RSC. In 2030, the EU import volume in ISC is higher than in the MSC whereas in 2050, the imports in the MSC exceed those in the ISC.
As in the RSC, European import volumes of non-coniferous industrial roundwood also increase in both implementation scenarios. In the MSC, imports develop similarly to those of the RSC, but always range higher, whereas in the ISC, the import volumes of non-coniferous industrial roundwood are steadily below those of the RSC (Figure 4).
Under both implementation scenarios, fuelwood imports are higher as compared to the RSC. After 2030, fuelwood imports develop differently under the ISC and MSC. As a result, the ISC import volume is twice as high as the MSC import volume in 2050 (Figure 4).
The export of coniferous industrial roundwood to non-EU countries declines in all three scenarios (Table A7). However, it only moderately decreases in the RSC and MSC. In the ISC, exports strongly decline over the entire simulation period. In contrast, European exports of non-coniferous industrial roundwood increase in the RSC and MSC, respectively. Contrarily, in the ISC, resources are strongly restricted and non-coniferous industrial roundwood exports decrease. European exports of fuelwood slightly increase in the RSC whereas in both implementation scenarios, exports decline considerably up to 2050.

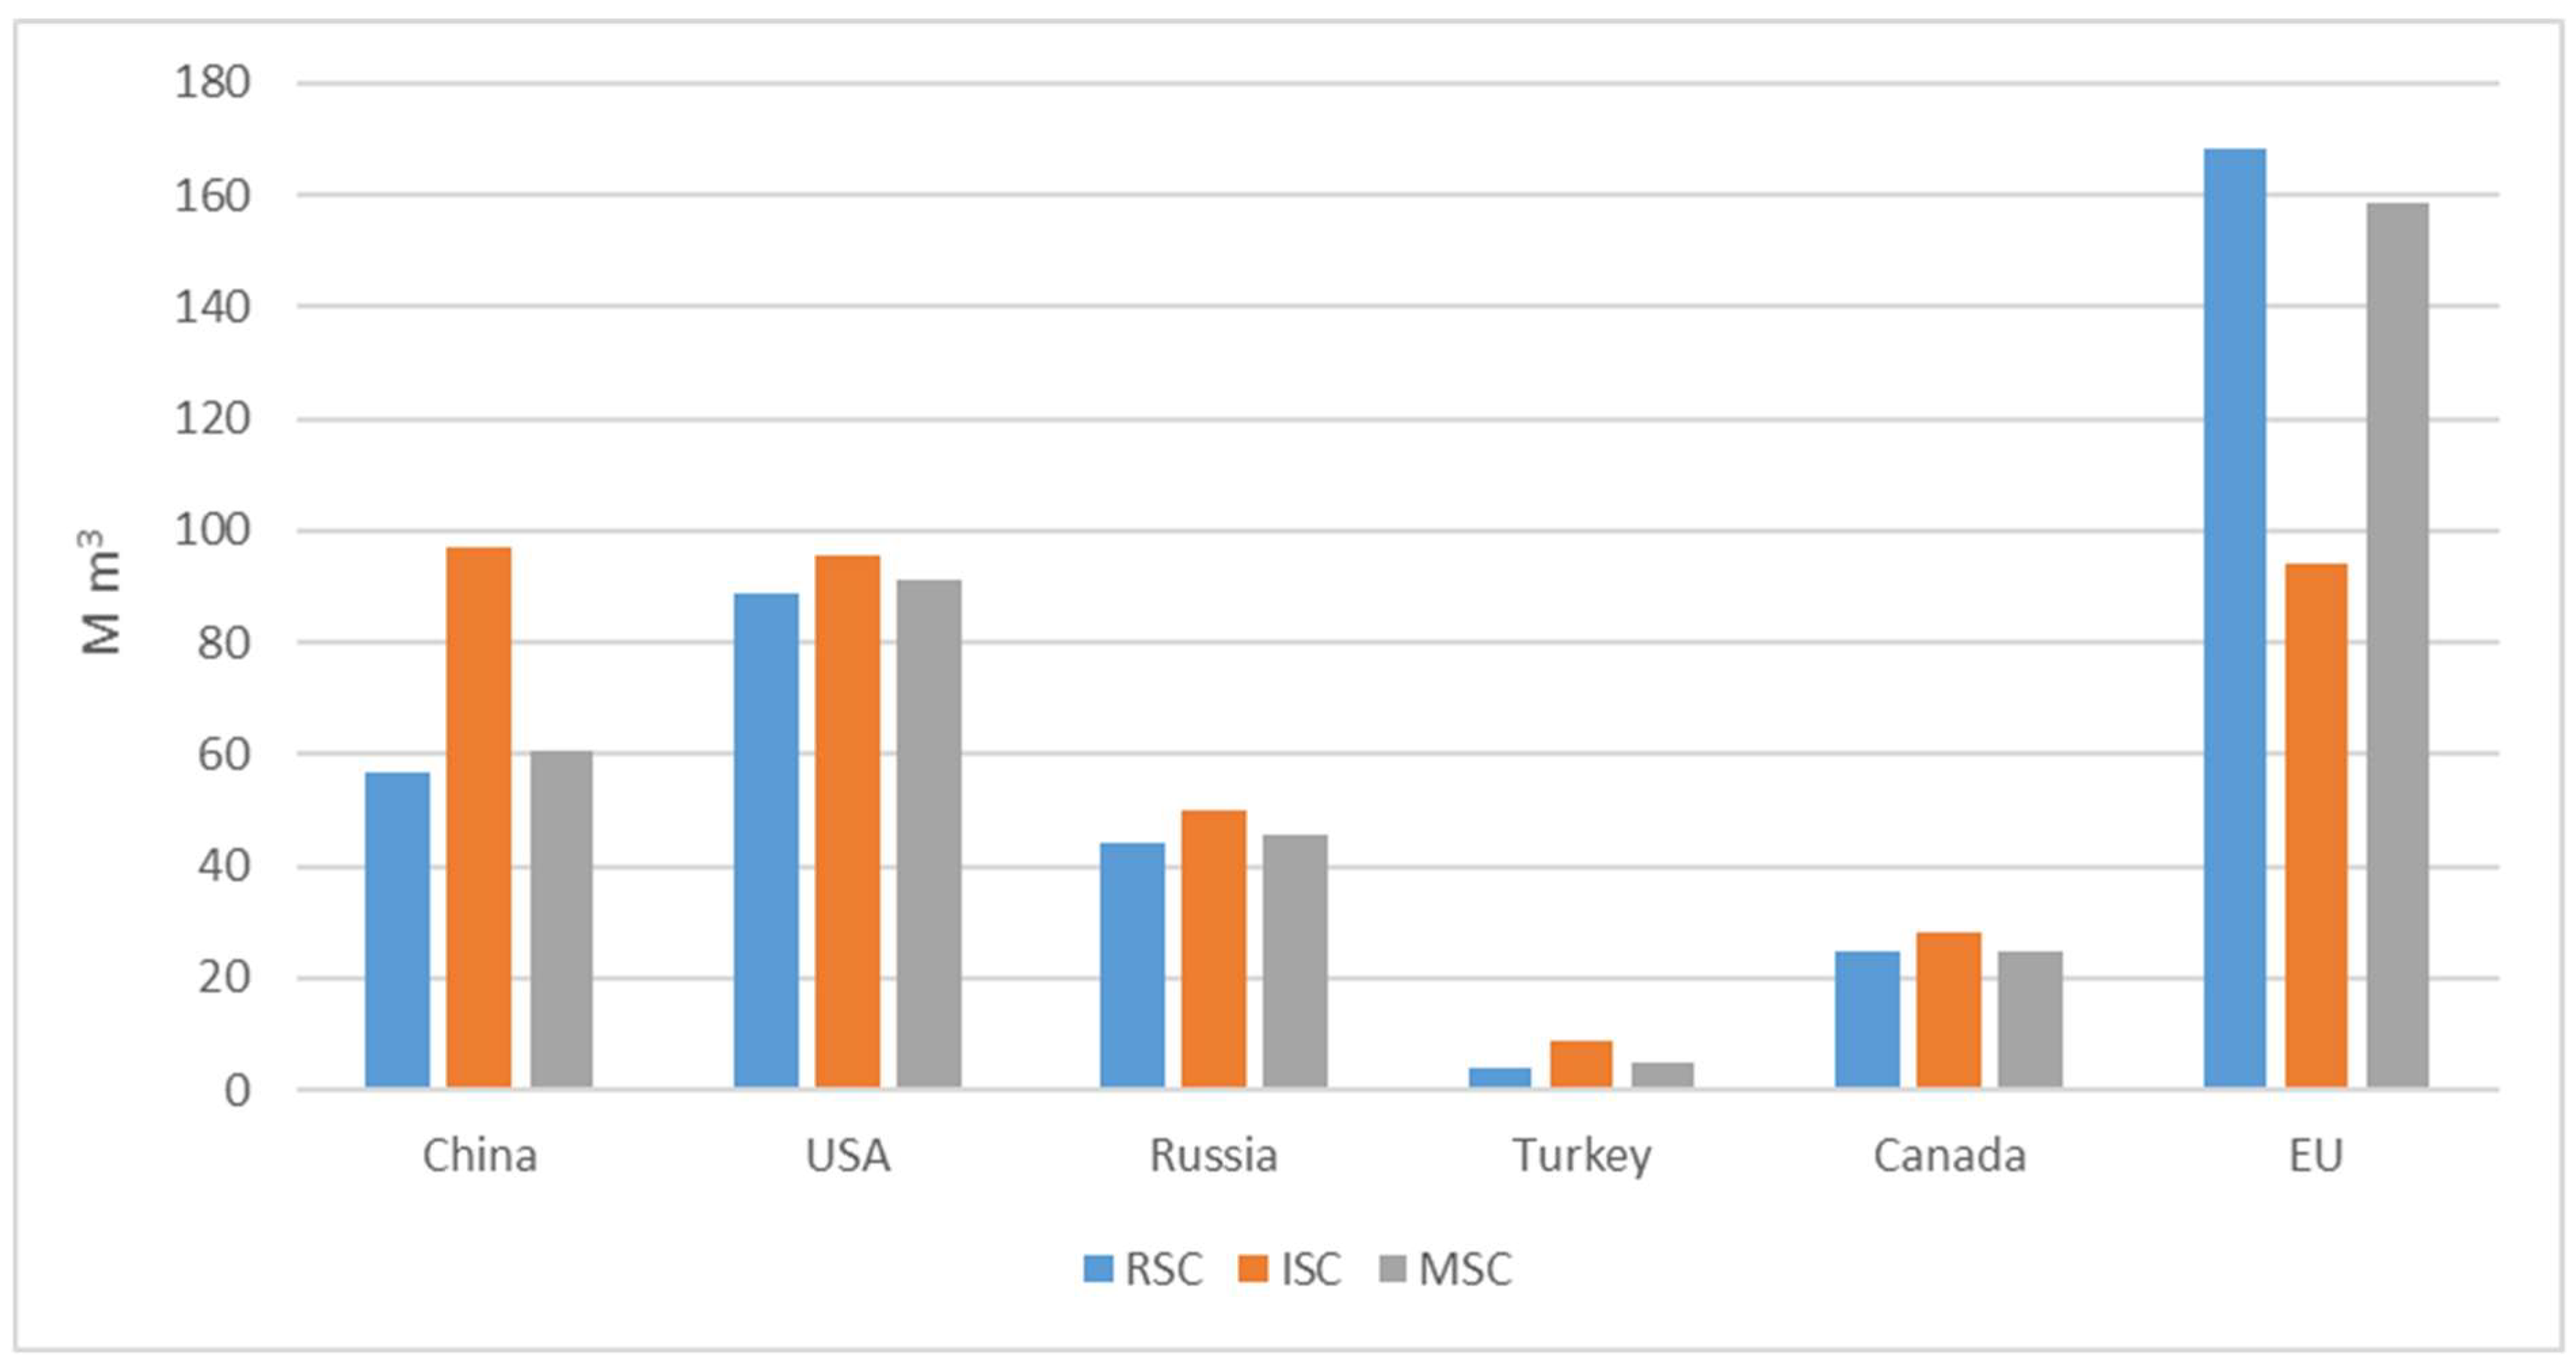
3.2. Impact on European Production of Wood-based Products

Due to the reduction of EU roundwood supply, a decline in production activities in the wood processing sector can be observed especially in the ISC (Figure 5). We observe a significant increase in industrial roundwood prices up to 2030 and thus, increasing prices of wood-based products (4% to 16% in 2030 compared to the RSC). In turn, this negatively affects competitiveness in national and international markets.

3.2.1. Sawnwood

The aggregated EU production of coniferous and non-coniferous sawnwood in the base year 2017 amounts to 107.3 M m3. In the RSC, production volumes strongly increase up to 2050 (Table A7). Although the European apparent domestic consumption of sawnwood changes little over time, most of the growing production in the RSC is exported (Table A7).
In the ISC, the production of sawnwood decreases considerably. It corresponds to 62% and 56% of the reference production in 2030 and 2050, respectively, and remains below the production volume of 2017. In the MSC, sawnwood production is less affected. It also increases up to 2050 but is 6% and 5% below the reference production (Table A7).
In the ISC, the sector suffers from raw material scarcity and the highest price increases among wood-based products (+16% in 2030, +8% in 2050). Compared to the RSC, the EU consumption decreases by only 3% to 81.0 M m3 in 2050, which can be explained by a strong reduction in exports, whereas imports increase. Thus, exports do not evolve but EU consumption can still be satisfied to a large extend. In the MSC, roundwood supply to sawnwood industries is only slightly affected, which causes only small price effects (1% to 2%). Sufficient raw materials and competitive prices allow the sawnwood industry to maintain and enlarge their production volumes. Again, the production surplus is mostly exported whereas European consumption only changes a little.

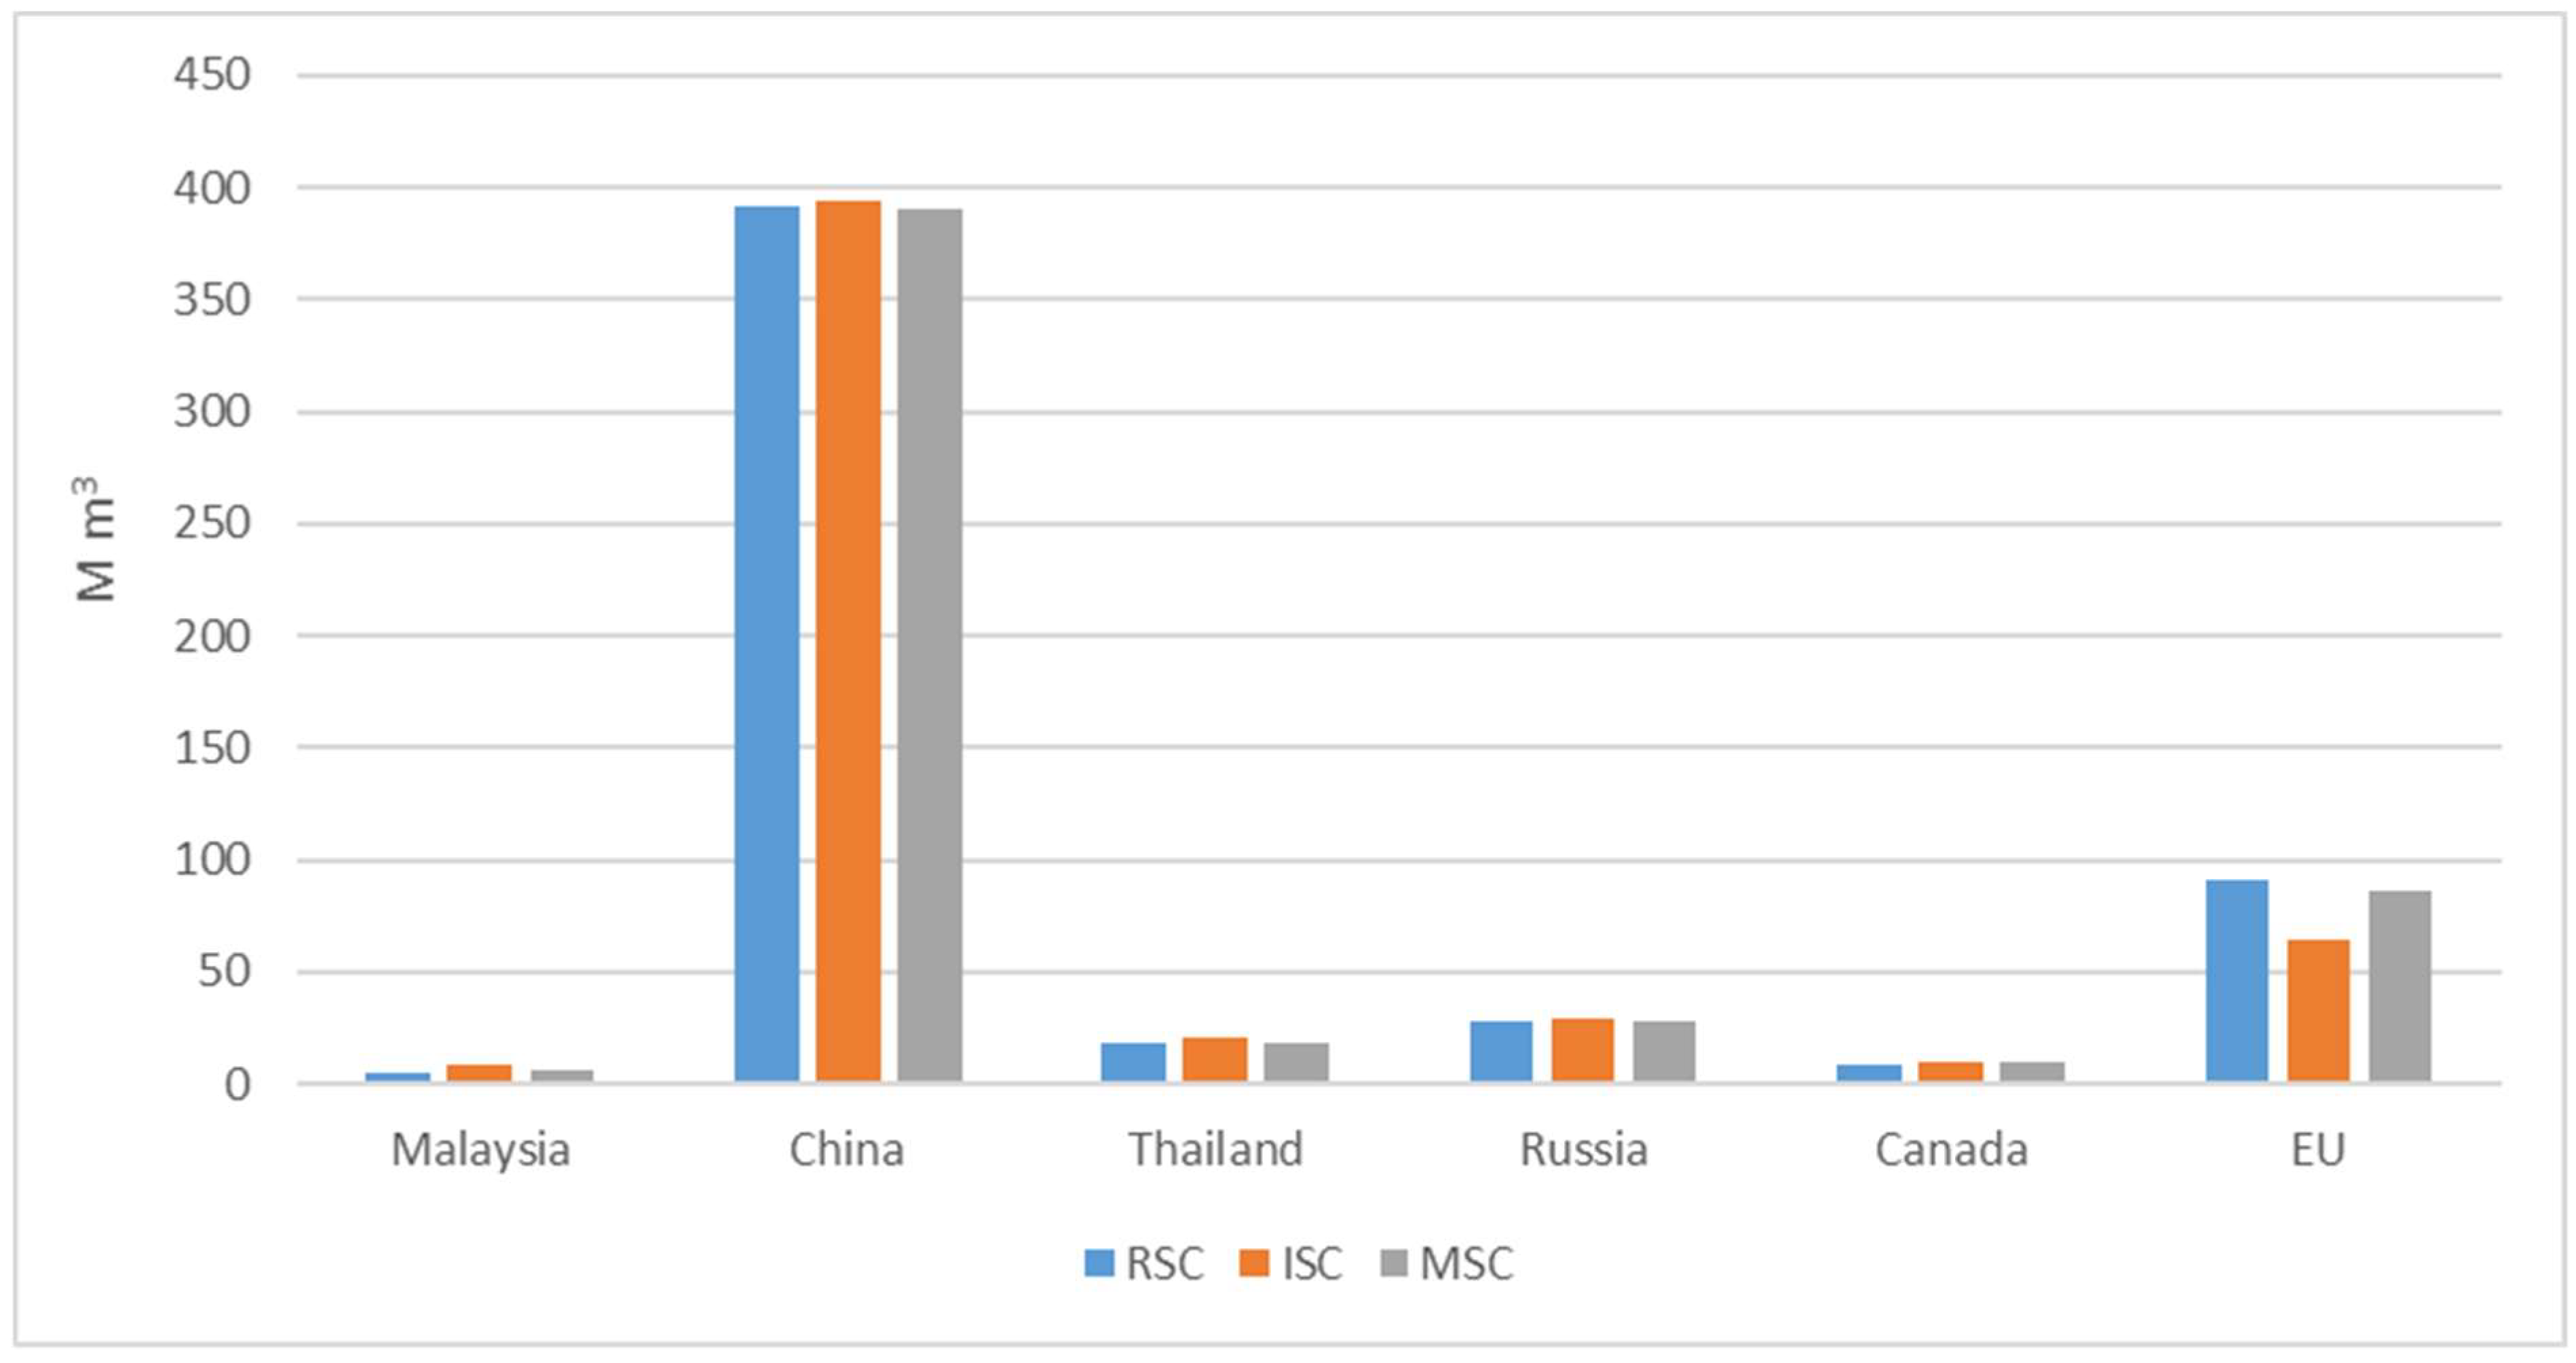
3.2.2. Wood-Based Panels

In the base year 2017, the simulated EU production of wood-based panels including veneer and plywood amounts to 61.3 M m3. In the RSC, it steadily increases up to 2050 (Table A7). In the ISC, the production volume significantly decreases and corresponds to 71% and 72% of the reference production in 2030 and 2050, respectively. In the MSC, EU production follows the trend of the RSC but is around 4% and 5% below the reference level in 2030 and 2050, respectively.
The European consumption of wood-based panels increases in all three scenarios up to 2050 whereas both imports and exports decrease (Table A7). The magnitude of change is similar in the RSC and MSC. In the ISC, exports are reduced by 50% up to 2050 compared to the base year. At the same time, imports are higher than the reference imports but remain lower than in the base year. Thus, the EU production deficit is compensated by comparatively lower exports and slightly higher imports.

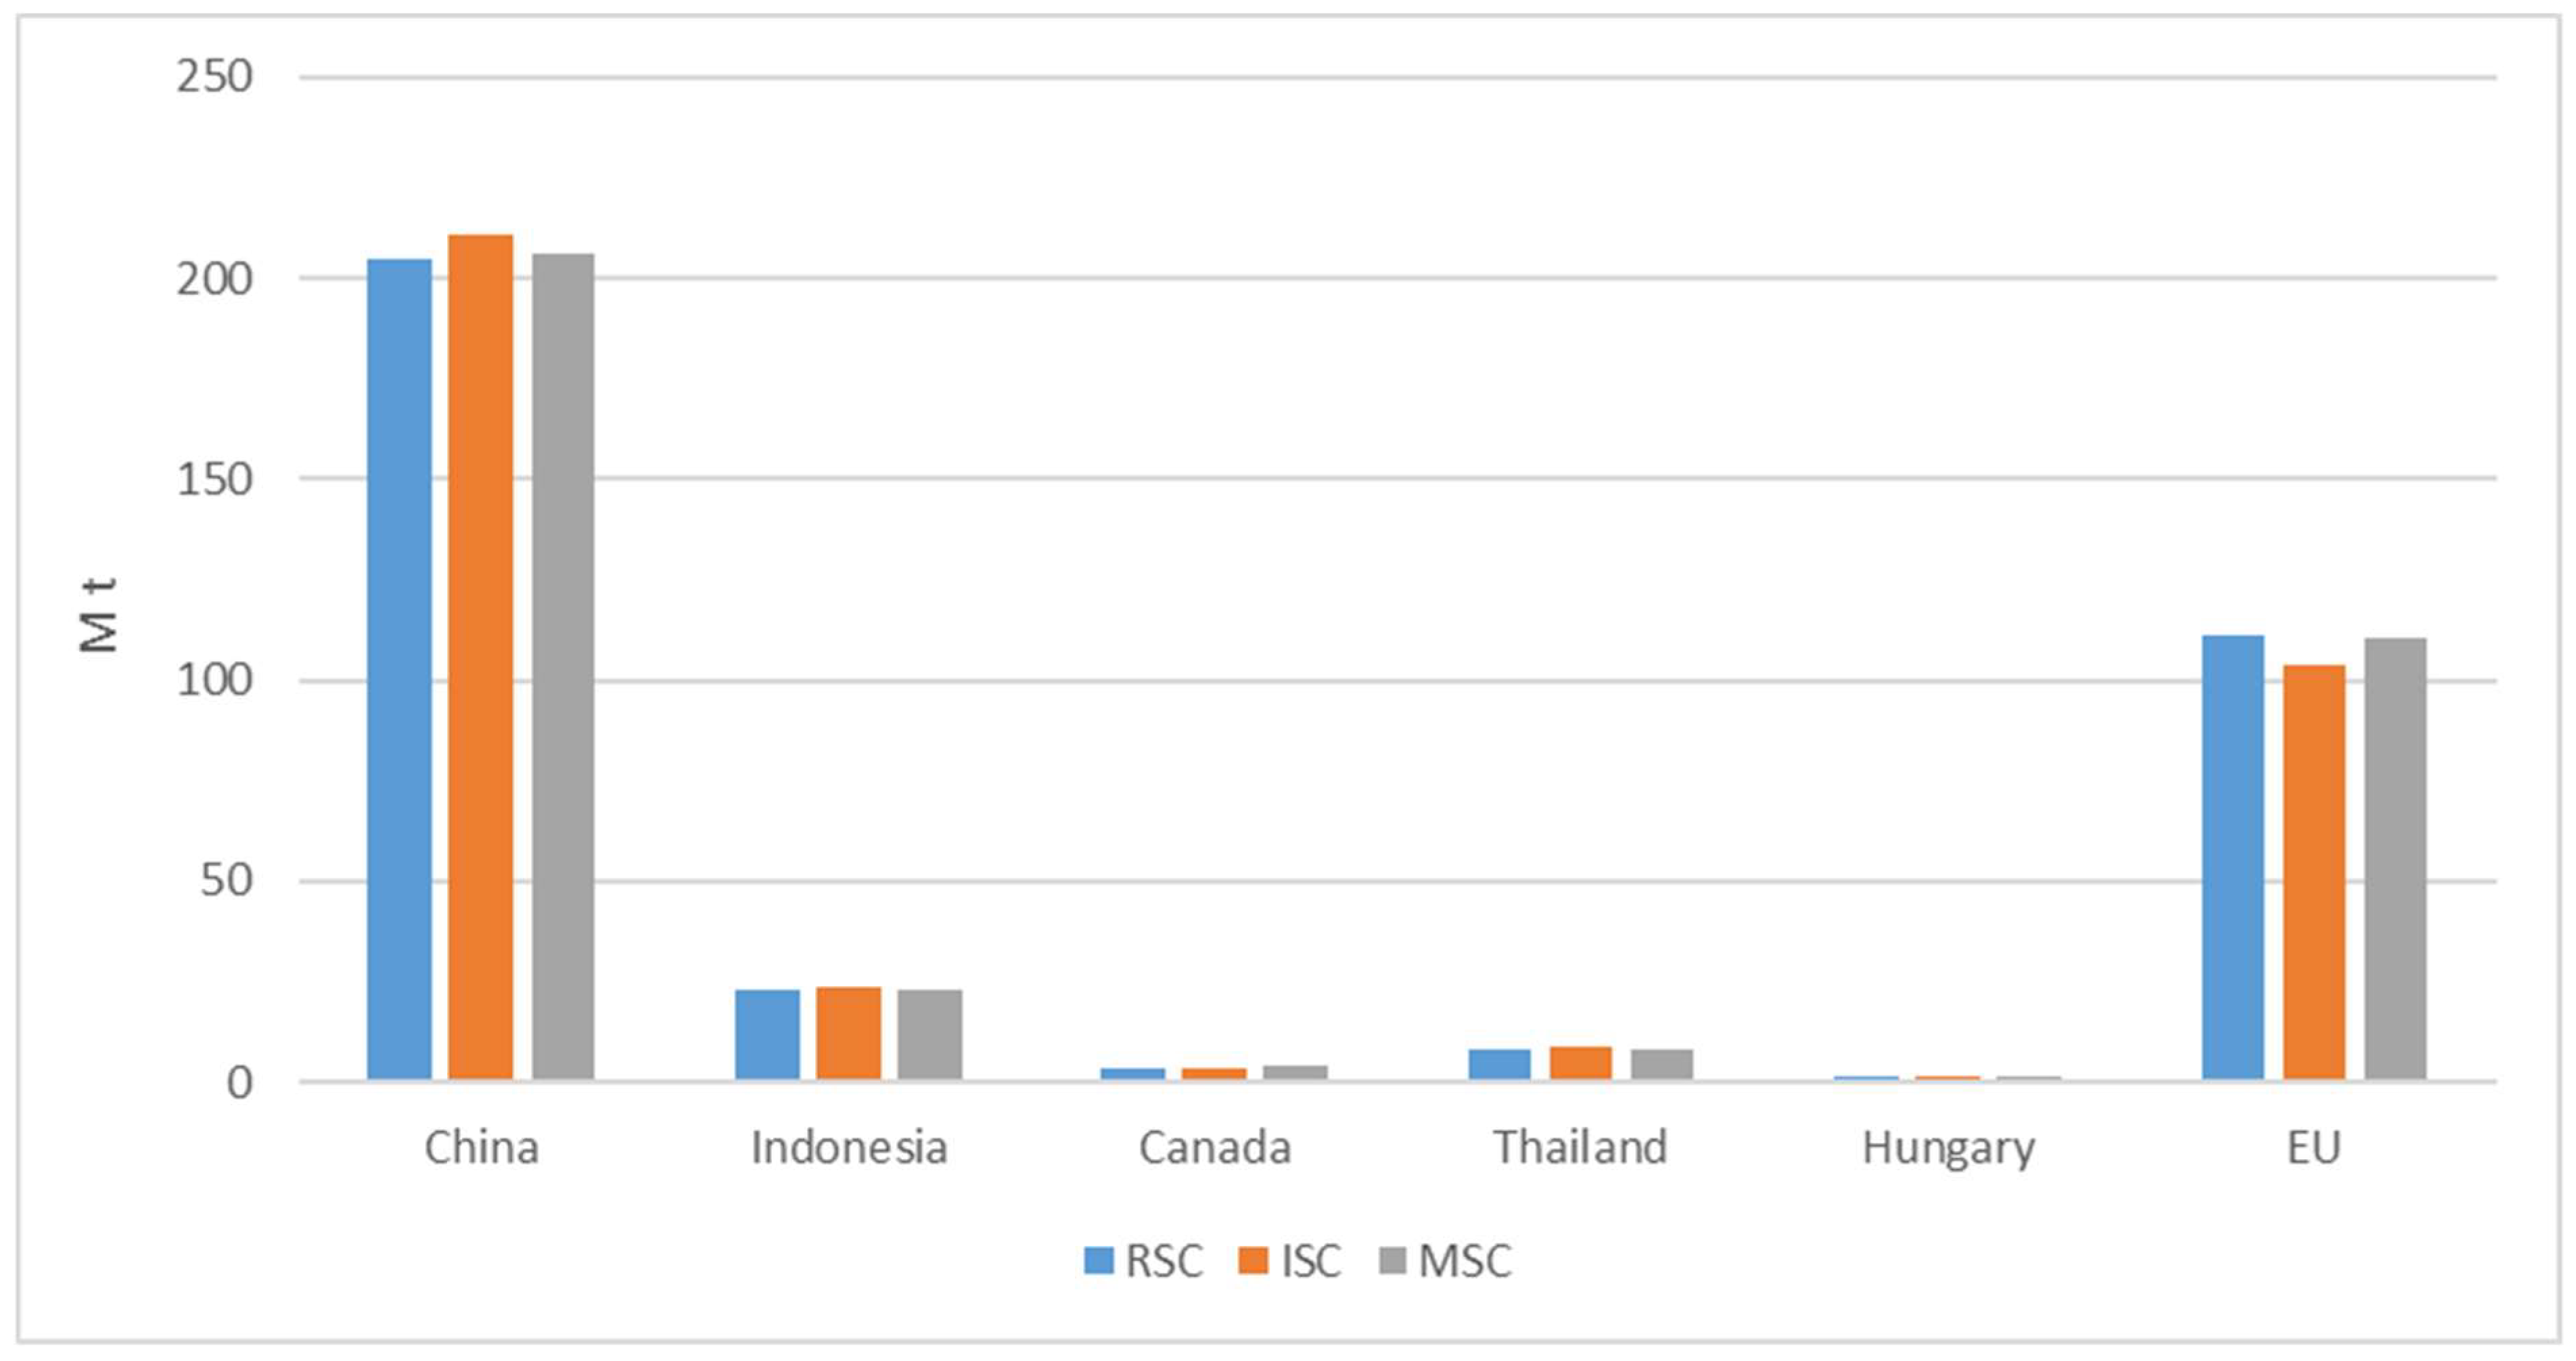
3.2.3. Wood Pulp and Paper and Paperboard

The EU wood pulp production is simulated at 36.6 M t in 2017. In the RSC, the production of paper pulp in the EU increases to 44.6 M t in 2050. In the ISC, paper pulp production decreases to 45% in 2030 and to 49% of this reference production in 2050. In the MSC, paper pulp production is 5% lower than the reference production in 2030 and 2050, respectively (Table A7). Exports almost double up to 2050 in the RSC and MSC. In the ISC, exports decrease up to 2030 and stabilize at the level of 2017 in 2050 (Table A7). Imports increase in all scenarios to comparable levels (Table A7).
The EU paper and paperboard production amounts to 88.5 M t in the base year 2017. In the RSC, it increases up to 2050 but in the ISC and MSC, the production is reduced by 7% and 1% in 2050, respectively (Table A7).
Altogether, paper industries seem to be less affected by a reduction of the roundwood supply as a possible effect of EUBDS implementation. This can be explained by the high quota of wastepaper input in the manufacturing process as well as with the underlying technological progress in the raw material utilization. The European consumption of paper products remains constant in the MSC and only decreases by 1% under the ISC. This can be explained by declining exports of paper products from the EU to non-EU countries.

3.3. Production Leakage

3.3.1. Total Roundwood

In the ISC, the introduction of an exogenous upper production limit results in an actual decrease in EU total roundwood production of 339.0 M m3 in 2050 compared to the RSC. Thus, the EU’s total roundwood production is 58% below than that of the RSC. Around 179.1 M m3 (53%) of this decrease is compensated through additional production in countries outside the EU, whereas 160.0 M m3 are no longer produced worldwide. In 2050, the EU production deficit is mainly compensated by increased production of roundwood in the USA (to where 21% of the production deficit is shifted), Russia (14% of the production deficit), Canada (14% of the production deficit), China (9% of the production deficit), Brazil (7% of the production deficit) and Ukraine (7% of the production deficit) (Figure 6). In the MSC, a decrease of the EU roundwood production by 66.9 M m3 in 2050 compared to the RSC is simulated. Thus, the production is about 11% below that of the RSC. Roughly 40.6 M m3 (63%) of this reduction is offset by additional production volumes in countries outside the EU27 whereas 24.1 M m3 are no longer produced worldwide. In the MSC, in 2050, the EU production is mainly offset by increased production of roundwood in the USA (to where 17% of the production deficit is shifted), Canada (16% of the production deficit), Ukraine (12% of the production deficit), Russia (10% of the production deficit), South Africa (8% of the production deficit), China (7% of the production deficit) and Brazil (6% of the production deficit).

Industrial Roundwood

In the ISC, 60% of coniferous and 59% of non-coniferous industrial roundwood production deficit are offset by increasing production in non-EU countries. The production of coniferous industrial roundwood is shifting mainly to the USA (26%), Russia (20%) and Canada (19%). The production of non-coniferous industrial roundwood is shifting mainly to China (25%), the USA (17%), Brazil (13%) and Indonesia (12%). However, in both segments, about 40% (coniferous industrial roundwood) and 41% (non-coniferous industrial roundwood) of the production deficit is no longer produced worldwide and may be substituted by products made from other raw materials.
In the MSC, roughly 64% of the coniferous and 59% of the non-coniferous industrial roundwood production deficit is compensated by additional production volumes in a third group countries. Here, 27% of the coniferous industrial roundwood production of the EU shifts to Canada, a further 24% to the USA and 15% to Russia. Non-coniferous industrial roundwood production shifts from EU to China (28%), the USA (17%), Brazil (15%) and Indonesia (14%). However, 36% of coniferous industrial roundwood and 41% of non-coniferous industrial roundwood are no longer produced worldwide.

Fuelwood

In the ISC, about 67% of the fuelwood that is no longer produced in the EU is not compensated by an increased fuelwood production in non-EU countries. Thus, only 33% of the production deficit is offset by additional production volumes outside the EU. In the MSC, we observe the reverse effect; about 65% of the declining fuelwood production is offset through increasing production outside the EU whereas only 35% is no longer consumed. In both scenarios, the production is mainly shifting to Ukraine (39% and 38%) and South Africa (19% and 27%) as well as to Bosnia Herzegovina (11% ISC) and Russia (6% MSC).

3.3.2. Sawnwood

In both implementation scenarios, sawnwood production in part shifts to non-EU countries (Figure 7). In the ISC, aggregated production of sawnwood of non-EU countries is 65.8 M m3 higher than in the RSC in 2050. The countries with the largest shares in additional production volumes are China (61%), USA (10%), Russia (9%), Turkey (7%) and Canada (6%) (Figure 6). Globally, the aggregated production volumes of sawnwood in the ISC are nearly 2% lower compared to the RSC in 2050. In addition to lower production volumes in EU countries, countries also characterized by lower production volumes compared to the RSC are Cameroon (−1.2 M m3) and Vietnam (−0.9 M m3).
In the MSC, production outside the EU increases by 8.3 M m3 compared to the RSC in 2050. The countries with the highest share in additional production volumes are, again, China (46%), the USA (27%), Russia (16%), Turkey (9%) (Figure 6) and Brazil (9%), whereas other non-EU countries production significantly decreases (e.g., Malaysia –0.9 M m3, New Zealand –0.4 M m3). The global production volumes only differ marginally between the MSC and RSC.

3.3.3. Wood-Based Panels

The reduction of EU production and export volumes of wood-based panels (Table A7) is compensated by increasing production of wood-based panels outside the EU (Figure 8). In 2050, the aggregated production of non-EU countries is 12.4 M m3 higher in the ISC than in the RSC. Figure 8 shows that the main shares in additional production are held in Malaysia (26%), China (21%), Thailand (20%), Russia (17%) and Canada (10%) (Figure 8). However, globally, the production of wood-based panels in the ISC in 2050 is about 2% lower than in the RSC. Besides lower production volumes in the EU, we also observe decreases of production in non-EU countries, among them Indonesia (−2.1 M m3), Brazil (−1.5 M m3) and the USA (−0.3 M m3). In contrast, the global production of wood-based panels is similar in the RSC and MSC. The aggregated production of non-EU countries is only 2.2 M m3 higher whereas the major shares in additional production volumes are held in Canada (29%), Thailand (23%), Russia (22%) and Brazil (20%). China, on the other hand, decreases its production compared to the RSC (−0.7 M m3).

3.3.4. Wood Pulp

The reduced EU pulp production in the ISC is partly offset by increasing production volumes in non-EU countries (+9.7 M t in 2050 worldwide). Brazil (41%), Indonesia (32%), Japan (20%) and Canada (12%) hold major shares in additional pulp production volumes especially. In the MSC, non-EU countries do not significantly change their overall production volumes. However, in addition to EU countries, the USA (−1.2 M t) also reduces its pulp production. This deficit is compensated by additional production in other non-EU countries. The production of waste paper in the EU is 47.6 M t in the base year 2017. It continuously increases to 54.9 M t in 2030 and to 65.1 M t up to 2050. In both implementation scenarios, waste paper production differs only slightly from the RSC (less than 1%).

3.3.5. Paper and Paperboard

In the ISC, the production of paper and paperboard is 7.5 M t (7%) lower compared to the RSC. In addition to EU countries, non-EU countries such as USA (−4.0 M t, −4%), Brazil (−1.4 M t, −8%), Australia (−1.1 M t, −17%) and Russia (−0.7 M t, −5%) also produce fewer paper and paperboard products in the ISC. However, this decrease in production is mainly compensated by China (+5.6 M t, +3%) and Indonesia (+0.7 M t, +3%) (Figure 9). Overall production of paper products does not significantly change in non-EU countries in the MSC. However, in addition to the EU, the USA also observes a reduction in paper products production compared to the RSC (−1.5 M t), whereas China experiences an increase in production (+1.2 M t).

4. Discussion

The aim of the present analysis is to quantitatively assess possible impacts of EUBDS implementation on roundwood supply, production of wood-based commodities as well as trade in roundwood and wood products. The presented results are scenario results and thus, are not be interpreted as prognoses, but as answers to a “what if” type of question. The nature of scenarios make them very suitable for forest product market analysis and modelling. Thereby, scenarios describe possible journeys to different future states [56]. It is important to bear in mind that they do not claim to become reality but provide a hypothetical construct of possible futures including probable, possible and desirable developments [23]. In contrast to scenarios, prognoses provide data about future developments which maybe expected to manifest. Such information is backed by, e.g., the statistical extrapolation of present and past trends [57]. We neither state that our assumptions nor results are statistically representative nor do we carry out statistical prognoses that claims to become reality.
The model used for the calculations aims at covering the complex interactions of demand and supply on global wood markets, but it still is by definition a simplification of reality and subject to a number of uncertainties. Its relevance also depends on how well the underlying assumptions reflect reality [58]. One basic assumption is the magnitude of the reduction of roundwood production in the EU after implementing EUBDS. In our study, it is estimated based on protected area coverages and derived reduction of roundwood production in Germany. We acknowledge the variability of forest structure, extent of protected areas, existing conservation measures and possible different EUBDS implementation approaches in EU member states. However, detailed data on these indicators have not been available within the scope of this study. Further, as EU member states are responsible for the national EUBDS implementation, information on the national discussion processes on possible EUBDS implementation would have been also required to draft country-specific scenarios. Due to the lack of this information, we designed the implementation scenarios based on German data. The two EUBDS implementation scenarios open a plausible range of EUBDS implementation impacts on roundwood production.
By the end of January 2022, the European Commission had published criteria and guidance for identifying and designating additional protected areas and appropriate management planning. The document is the result of extensive consultations with the member states [59]. However, those criteria and guidance are non-binding as member states remain responsible for the actual EUBDS implementation on the national level. Furthermore, the criteria and guidance do not provide information that renders our two implementation scenarios implausible. Thus, future possible reduction of roundwood production and its impact on forest product markets will possibly vary between member states within the impact range presented in this study.
The response of wood products markets is of crucial importance in evaluating the overall impacts of a target policy [60]. Here, our results show that EUBDS implementation very likely reduces European roundwood production (Figure 10).
Our study shows that reductions of coniferous industrial roundwood production in both implementation scenarios are not compensated by increasing imports of the EU but mostly by a reduction in roundwood use in EU wood-processing industries. Whereas in the ISC, 60% of the EU production deficit of coniferous industrial roundwood (118.1 M m3) is compensated by increasing production of industrial roundwood in non-EU countries (see Section 3.3), the EU import surplus compared to the RSC only offset less than 1% of reduced coniferous industrial roundwood production and accounts for an additional 5.8 M m3 in 2050 (Table A7). This effect is much more moderate in the MSC: 64% of the 34.4 M m3 EU production deficit is compensated by higher coniferous industrial roundwood production in non-EU countries. From this production surplus, the EU imports 8.3 M m3 coniferous industrial roundwood and thus, compensates 25% of the production deficit with imports in 2050 (Table A7).
In both implementation scenarios, the reduced EU production of non-coniferous industrial roundwood is also not compensated by imports into the EU. In the ISC, imports even decline in comparison to the RSC (Table A7). Thus, the EU does not only produce 60.4 M m3 less non-coniferous industrial roundwood in 2050 (of which 35.6 M m3 are offset by increased production in non-EU countries), it also imports 4.7 M m3 less. In the MSC, 59% of the nearly 11.6 M m3 production deficit is compensated by increasing production in non-EU countries. Of this, the EU imports 1.6 M m3, i.e., compensates 14% of its production deficit with imports in 2050 (Table A7).
The fuelwood production deficits in both implementation scenarios are only partly compensated for as well. Imports offset almost 75% and 33% in the MSC and ISC, respectively. However, in both implementation scenarios, less fuelwood is used in EU countries (Table A7).
In short, we see that a reduction of EU roundwood production has two effects: it leads (i) to an increased roundwood production in non-EU countries and (ii) to decreasing production volumes of downstream wood-processing sectors in the EU (Figure 10a). However, the magnitude of impacts differs across the affected sectors. Compared to the sawnwood and wood-based panel sectors, quantitative differences in the production of wood pulp as well as paper and paperboard between the scenarios remain small. Most affected is the sawnwood production, which is, at least in quantitative terms, the most important end use product in wood product markets [39]. On the EU level, decreasing production in wood-processing industries (Figure 10a) is accompanied by a rather constant apparent domestic consumption of wood-based products in the EU (Figure 10b). The constant apparent domestic consumption can be explained by the underlying socioeconomic model assumptions: GDP development was adopted from the SSP2 scenario and equally applied in the RSC, ISC and MSC. In addition, price elasticities of demand used for simulations are rather inelastic and thus contribute to this effect (see below). The reduced inner-European production is compensated by slightly increasing imports and significantly declining exports in the sub-sectors (Table A7).
When interpreting the magnitude of leakage observed in the present study, two influencing key parameters must be kept in mind: substitutability of products and the response pattern of supply and demand to changes in product prices.
In the GFPM model framework, wood products are implicitly assumed to be perfect substitutes and the optimization of the market equilibrium does not include an elasticity of substitution. Instead, demand is merely shifted by changes in income and price whereas supply depends on changes in price and forest stock. These assumptions could lead to an overestimation of the magnitude of leakage because they ease the relocation of production from one region to another [2,8]. In fact, wood products are rather homogenous and exchanged in global markets without important barriers, which increases their substitutability [9]. In addition, Gan and McCarl [6] found that the degree of substitution between products does not severely impact the intensity of occurring leakage. This makes the forest sector particularly vulnerable to leakage [9]. These findings support the two major assumptions we made in our study: the assumption of perfect substitution among wood products originating from different regions and of homogenous commodities.
In the applied version of the GFPM, price elasticities of supply and demand are the same across all countries worldwide. Magnitude of leakage is thus not influenced by divergent market response pattern in different world regions. However, Murray et al. [8] and Jonssson et al. [2] found that leakage increases with increasing price elasticity of supply and decreasing price elasticity of demand. The underlying model version applies elastic supply elasticities for roundwood products and inelastic to nearly unit elastic demand elasticities. Having the former statement in mind, the combination of relatively elastic supply elasticities and relatively inelastic demand elasticities could lead to an overestimated degree of leakage.
To put our results on the magnitude of leakage to the test, we re-run the ISC with (i) unit elastic supply elasticities and (ii) more elastic demand elasticities (all demand elasticities are changed by the factor −0.5).
As suggested, EU supply of industrial roundwood is higher in 2050 in both alternative scenario runs of the ISC with changed elasticities. The influence of the unit elastic price elasticity of supply is stronger than the influence of more elastic price elasticities of demand (+12% supply vs. +5% supply) compared to the ISC. However, trade patterns of industrial roundwood do not significantly change in absolute terms. Instead, increasing supply translates into increasing intraEuropean use of roundwood while EU-induced production leakage of industrial roundwood to other countries is not affected. Increasing EU raw material availability leads to increasing production of sawnwood within the EU. Again, this increase is stronger assuming unit elastic supply elasticities (+12%) than assuming more elastic demand elasticities (+5%). Since apparent EU consumption in both alternative scenarios of the ISC with changed elasticities slightly decrease compared to the ISC (−7% for unit elastic price elasticity,−2% for more elastic demand elasticity), EU net-trade for sawnwood increases by 17 M m3 and 8 M m3 with unit elastic price elasticities of supply and more elastic price elasticities of demand, respectively. Thus, we observe a slight reduction of leakage due to changes of production, demand and trade pattern in the sawnwood sector. Changes in the plywood and wood-based panels sector do not affect the EU-induced production leakage. However, compared to the total magnitude of leakage observed in the ISC, these deviations do not appear to substantially change the basic results.
In addition to the findings above, the estimates on the magnitude of leakage made in the present study seem to be rather conservative compared to Dieter et al. [16] and Kallio et al. [9] (see below). Taking the former considerations into account, we conclude that the pre-set supply and demand elasticities do not lead to a significant increase of possibly occurring leakage effects as estimated in the present study. However, a thorough analysis on the influence of varying key parameters on the extent of leakage in the given context would be an interesting task for future studies.
In contrast to the preliminary study on production leakage carried out by Dieter et al. [16], the two implementation scenarios modelled in the present study open a range of possible protected area coverage and resulting roundwood production. In both studies, Dieter et al. [16] and the present one, the USA is the country with the strongest increases in roundwood production in the ISC compared to the RSC. However, in the present study and in absolute terms, additional production volumes of the USA are simulated to be lower than in Dieter et al. [16]. In addition, the countries with the main shifts in production differ between the studies. In particular, China plays a more central role for roundwood production in the present study compared to Dieter et al. [16].
When interpreting these diverging modelling results, it must be borne in mind that production, trade and demand developments, both for the RSC and for the EUBDS implementation scenarios, are influenced by exogenous projections of global income as well as the underlying assumptions regarding future forest development and other exogenous parameters, e.g., technological trends. The model version used here is based on the socioeconomic development pathway offered by the SSP 2 scenario [20] and forest data from the most recent FAO Forest Resources Assessment [21], whereas the study of Dieter et al. [16] uses a GFPM version based on the IPCC scenario A1 [18] and the Forest Resources Assessment 2010 [19]. Since the present study uses more recent data on socio-economic and bio-physical forest development, the different developments of roundwood production capacities in Dieter et al. [16] and this study and thus the different results on production leakage effects, are partly due to the different underlying economic and bio-physical assumptions on GDP growth rates and forest development. This finding is backed by Buongiorno and Johnston [61] and [62], who underline that economic data and model parameter estimations are crucial factors for the outcome of market model projections. Since this study does not model the partial effect of changing the underlying socio-economic model parameters, we cannot precisely identify singular effects of changing exogenous model drivers such as GDP, population and forest developments. However, we can state that both roundwood production capabilities and the list of non-EU countries in which increased roundwood production is evident, change depending on income, population and forest development projections.
Kallio et al. [9] carried out a model-based study on harvest leakage due to the implementation of reference levels for EU forest carbon sinks and the following restricted use of forest resources. They found that climate protection policy restrictions on domestic raw wood production led to relocation effects in a third group of countries. The relative compensation of the EU production deficit by higher roundwood production in non-EU countries is smaller in the present study. Between 53% (ISC) and 63% (MSC) of the roundwood production deficit are compensated by production leakage to other countries. In Kallio et al. [9], about 79% of the roundwood harvests in the EU (including Norway) are offset by a corresponding harvest increase in the rest of the world.
However, the main shift of production leakage observed in this study seems to be reasonable. The main countries affected by increasing total roundwood production in 2050 are the USA and Canada (37% of total production leakage). This magnitude is similar to the findings of Kallio et al. [9]. However, in the present study, the share of shifts to Russia is larger (25%). In addition, the role of Asia in compensating production leakage is more important. China alone accounts for 22% of production leakage, whereas Kallio et al. [9] estimated production leakage to Asia to be only 8%. Furthermore, in contrast to Kallio et al. [9], the role of South America is smaller. Brazil as the main South American producer only accounts for 21% whereas in the analysis by Kallio et al. [9], South America is the main compensating region, offsetting 39% of the total production leakage.
Regarding the magnitude of leakage in dependence of the spatial area affected by the protection measure, the present study demonstrates that the mutual implementation of a policy on a large geographical and economic scale may indeed reduce overall production leakage in absolute terms. Thus, our results show that EU production deficits are only partially offset by increasing production volumes of wood and wood-products in non-EU countries. Even though relative leakage is maybe smaller compared to leakage effects observed for smaller conservation projects, total quantity of wood and wood-products that are additionally produced in countries outside the EU aresubstantial due to size and economic importance of the EU market. In addition, it must be kept in mind that quantities of wood products that are no longer being produced and consumed worldwide are potentially substituted by non-bio-based resources.
Our results show that Russia is among the countries with the strongest increases in roundwood production under the implementation scenarios. However, our study neither considers the Russian ban on log exports that entered into force in January 2022 nor possible consequences in production and trade of wood production due to the Russian military attack started in February 2022 in Ukraine. A consideration of further restrictions concerning the availability and trade of wood products from Russia could again change the results concerning the relocation effects from the implementation of the EUBDS. However, one shortcoming of the present work is that bilateral trade flows are not simulated in the version of GFPM used here. Thus, no direct trade shifts or bilateral production leakage effects between individual countries can be shown. The calculation of bilateral trade flows to quantify direct leakage effects would provide a good basis for assessing political options for action to reduce leakage in a future study.

5. Conclusions

An internationally growing demand for wood products, whether due to globally rising incomes or policies that promote the use of bio-based products, could translate into growing production of European forest and wood industries. If a policy such as the EUBDS restricts future roundwood production from European forests against growing demand, this could have adverse impacts on national and international markets. The aim of the present study is to quantitatively assess possible leakage effects as a consequence of EUBDS implementation in two alternative scenarios. The scenarios describe possible journeys to different future states [55]. They provide a hypothetical construct of possible futures including probable, possible and desirable developments [23]. We claim that neither our assumptions nor results are statistically representative, nor do we carry out statistical prognoses that claim to become reality. Even though we model the effects on production and trade of roundwood and wood-based products based on simplified assumptions regarding the potential reduction of roundwood production, we open a plausible range of the magnitude of the impacts the EUBDS implementation could have.
The production deficit of roundwood in the EU is partly offset by increasing production volumes in non-EU countries (179.1 M m3 (53%) and 40.6 M m3 (63%) in the ISC and MSC, respectively. Accordingly, 160.0 M m3 and 24.1 M m3 of roundwood are no longer produced worldwide. Especially in the ISC, EU production volumes of the wood-processing industries decline compared to the RSC (Figure 10a). In the GFPM, the development of wood-products consumption is driven by exogenous scenario assumptions on the regional GDP development over time. Since the assumptions on GDP development are the same in the RSC, ISC and MSC, the apparent domestic EU consumption of wood-based products remains rather constant across the scenarios (Figure 10b). However, the trade volumes vary; especially in the ISC, the export volumes of wood-based products are significantly lower than in the RSC, whereas the imports are higher (see Table A7).
From our results, we conclude that both the production of roundwood and wood products shifts from the EU to non-EU countries to varying degrees. If the production is relocated to countries with less efficient forest and biodiversity protection measures in place, EU biodiversity objectives are counteracted. Further, on a global level, this could lead to a growing use of non-bio-based but fossil resources to substitute wood-products. This effect would clearly counteract the aim of, e.g., the EU Bioeconomy strategy and accompanying aims for climate protection.
However, our study shows that the magnitude of effects strongly depends on the extent of restriction of forest resource use due to establishment of additional protected areas. A moderate implementation that translates into a reduction of roundwood production of less than 10% can be compensated by market mechanisms on the national and international levels. The additional need of strictly protected areas here would have to primarily come from other land users. The consequence would then probably be high leakage effects on agricultural product markets. An intensive implementation that implies a strong production deficit would have a severe impact on EU wood products markets with negative effects for, e.g., the development of EU wood-based industries, sectoral value added, income and employment and net trade.
Despite the above-mentioned challenges of simplified modelling assumptions, this study shows that it is important to accompany ongoing policy implementation processes with evidence-based impact assessments, e.g., by using wood-product markets modelling. The application of a quantitative model such as the GFPM helps to test complex impacts of the policy targets [29].
For the future, a dynamic, country-specific investigation of forest development and the associated potential roundwood supply, in which the implementation of the EU biodiversity strategy is determined individually for each member country, is a desirable extension. It is probable that the implementation of the EU biodiversity strategy will have different effects on national and international timber markets due to the different forest resources of the individual EU member states. Furthermore, the intensity of roundwood extraction in productive areas would probably be different. Consequently, the roundwood production as well as production, trade and consumption of wood products would develop different dynamics. In addition, the consideration of structural market breaks such as the Russian export ban of roundwood together with possible war-related sanctions against Russia as an important wood-producing country could be vital additional steps in future analyses.

Author Contributions

Conceptualization: M.D., S.I., F.S., B.S., H.W.; methodology: F.S., B.S., H.W., M.D.; formal analysis: B.S. and F.S.; data curation: B.S. and F.S.; writing—original draft preparation: S.I. and F.S.; writing—review and editing: S.I., F.S., H.W., B.S., M.D.; visualization: F.S., B.S., S.I. All authors have read and agreed to the published version of the manuscript.

Funding

This research received no external funding.

Institutional Review Board Statement

Not applicable.

Informed Consent Statement

Not applicable.

Data Availability Statement

Not applicable.

Acknowledgments

We would like to thank Christian Morland for fruitful discussion and sharing his expertise as well as Cornelius Regelmann for valuable support in compiling tables and figures. We also thank Dina Führmann for carefully proofreading the manuscript. We would like to thank three anonymous reviewers for their suggestions and comments which helped us to improve the quality of this work.

Conflicts of Interest

The authors declare no conflict of interest.

Appendix A

Table A1. Key figures related to forest area, growing stock and roundwood production and forest protection in EU member states. RW is Roundwood, ts ha is thousand hectares, M is million, o.b. and u.b. is over and under bark, respectively (Source: FAO [21], FAOSTAT [17], Forest Europe [31]).
Forest AreaForest Growing StockGrowing Stock DensityRW ProductionRW ProductionRW Production IntensityForest Area within Protected Areas, IUCN I–IV 4Forest Area 3 in Protected Areas, MCPFE 1.1 4Forest Area 3 in Protected Areas, MCPFE 1.2 4Forest Area 3 in Protected Areas, MCPFE 1.3 4Forest Area 3 in Protected Areas, MCPFE 2 4
Database 1FAO 2022FAOSTAT 2022 FAO 2022Forest Europe 2020
Countries 2ts haM m3 o.b.m3/haM m3 u. b.m3/ham3/hats ha%ts ha%ts ha]ts ha%ts ha%
Austria 53.8811.1462951850.028522200301472123339
Belgium689180260580.03180261127191264
Bulgaria3.833680178620.017041858277222154614
Croatia1.922415216530.015434421012141140
Czechia2.6687682881660.02147528199434159922
Denmark625131210470.0342700813457712
Estonia2.4214922031040.024982116571466224940
Finland22.4092.4491095930.022.831131.9139629327619224
France16.8362.8561705030.023.826230012913.274193.01018
Greece3.90219249100.01 1644
Hungary2.061379184630.024582240906473121610
Ireland755114151340.031421900006100
Italy9.2971.3841491310.013.2653527031.491161.5041689810
Latvia3.3916561931240.025441690198618651635
Lithuania2.187537246630.01460212618749041517
Luxembourg8933369040.01 11
Netherlands36579217260.03217593133 18150
Poland9.4202.5502714140.023.07933631003.016324515
Portugal3.312171521130.076161922100615190
Romania 66.9012.2223221520.012.60638136284117831412
Slovakia1.922535279950.0255429684004862528615
Slovenia1.248415332540.0125721101786786927
Spain18.5511.059571710,027.4004036049432.302121.2857
Sweden27.9803.4781247430,022.121832511.610618611040
Min893349000.014230000610
Max27.9803.4783697480.077.400591.91391.610163.274323.0105
Average6.1119552051640.021.4022314022373660104329
Median2.990536207940.025492127177221461727
Germany11.4193.6633216960.023.306290022023.086275.95852
1 Reference year: 2015. 2 Country list exclude Cyprus and Malta due to incomplete data. 3 Area overlaps: Protected area categories according to MCPFE not reported without overlapping for all countries giving an overestimation of total protected area. 4 Definition of protected area categories available at (i) IUCN FAO [21], Dudley with Stolton et al. [29]; (ii) MCPFE: Forest Europe [31]. 5 Austria reported “protected forests” according to the MCPFE criteria in 2015 only for the area category “Total forest and other wooded land”, but not for the sub-area category “Forest”. For the present evaluation, therefore, the data for the area category “Total forest and other wooded land” were used for Austria in contrast to the other member states. FAO [21] reported 3881 thousand ha “Forest” and 4013 thousand ha “Total forest and other wooded land” in 2015 for Austria. 6 Romania reported “protected forest areas” only for 2005 which is why the data for this reporting year were used here (Forest Europe [31]: 234).
Germany covers 35.803 M ha, of which 11.125 ha are forests and 24.668 are non-forest land use types. NW-FVA [35] determined the distribution of protected areas for natural forest development (according to the German National Strategy on Biological Diversity [34] and under the Habitats Directive (FFH sites) as well as under the Birds Directive (Special Protection Areas (SPA)) in Germany (Table A2). Röder and Laggner [32] estimated the protected areas in Germany by detailed land use categories (Table A3).
Table A2. Protected Areas in Forests and non-forest Land Use Types in 1000 ha (Source: NW-FVA [35]).
CategoryForestNon-Forest
Natural forest development22736
FFH area17811377
SPA7921357
sum28002770
Table A3. Protected areas in Germany by land use categories in 1000 ha (Source: Röder and Laggner [32]).
Protection Level
Land-Use TypeVery HighHighMediumLowVery LowNot ProtectedTotal
waters12882406545159608
agriculture224197861358368712,77419,045
other open habitats44218151601214381031
traffic and settlements120488177230603983
All non-forest7974412261563462416,43224,668
forest161743119879735724,65411,125
All land-use types240148724252361819821,09235,803
Very high: core zones of National Park and Biosphere reservations, high: buffer zones of Biosphere, Reservations and Nature Reserves, medium: FFH areas and irregularly flooded areas, low: SPA areas and rarely flooded areas, very low: Nature Parks, transition zones of Biosphere Reservations and landscape protection areas.
Table A4. Area balance sheet of land use categories in Germany in 2020 and 2030 according to the goals of the MSC and ISC in 1000 ha [authors’ results].
Moderate Scenario (MSC)Intensive Scenario (ISC)
Current: 2020ChangesGoal: 2030Current: 2020ChangesGoal: 2030
GermanyForest Non-ForestGermanyForestNon-ForestGermanyForestNon-ForestGermanyForestNon-ForestGermanyForestNon-ForestGermanyForestNon-Forest
Total area35,80311,12524,66800035,80311,12524,66835,80311,12524,66800035,80311,12524,668
1. EUBDS-objective: legal protection of a minimum of 30% of the EU’s land area
3. EUBDS-objective: Effectively manage all protected areas, defining clear conservation objectives and measures and monitoring them appropriately.
Total protected area 1557028002770517126002572107415400534114711647182360001471164718236
of that
Protected area with legal protection 2
530625732733185415692867162414230201447163118157−4664 *−4164 *−500 *980721477657
2. EUBDS-objective: Strictly protect at least a third of the EU’s protected areas, including all remaining EU primary and old-growth forests.
of that
Protected area with strict legal protection 3
26322736331710312285357912582322240161794664 *4164 *500 *49044325579
of that
Primary forests and old- growth forests 4
1064 1064
1 legally protected areas including areas with and without roundwood production. 2 legally protected areas where roundwood production is possible under designated management plans. 3 legally protected areas under natural forest development, i.e., without roundwood production. 4 no roundwood production. * this area is transferred from general legal protection to strict protection.
Table A5. German forest area balance sheet in 1000 ha by wood species to determine area requirements for MSC and ISC (in 1000 ha) [authors’ results].
Moderate Scenario (MSC)
Wood Species Groups (WSG)Total Forest AreaAdditional Area Required or Areas with Additional Nature Conservation Measure
Accessible and Stocked TimberlandStrictly Protected AreasProtected Areas
Developing
Old-Growth Forests
Natural Forest DevelopmentFFH-AreasSPA-Areas
Oak1130 9110422
Beech3598 28933768
All deciduous trees4727 37944190
Spruce3164 2542781
Pine2737 2202370
All coniferous trees5900 47451152
Subtotal 853491241
of which without wood production according to NFI 2012: nature conservation and protection forest 178
of which without FFH management requirements 595241
all tree species10,628 10311569
Intensive Scenario (ISC)
Wood Species Groups (WSG)Total Forest AreaAdditional Area Required or Areas with Additional Nature Conservation Measure
Accessible and Stocked TimberlandStrictly Protected AreasProtected Areas
Developing
Old-Growth Forests
Natural Forest DevelopmentFFH-AreasSPA-Areas
Oak1130119309268
Beech3598583921867
All deciduous trees472770212301134
Spruce316424689270
Pine273711680160
All coniferous trees59003621692130
Subtotal 106429221265
of which without wood production according to NFI 2012: nature conservation and protection forest 178
of which without FFH management requirements 882
All tree species10,62841642147
Table A6. Roundwood stocks in Germany in different forest types to determine roundwood availability for MSC and ISC (in 1000 m3 per a) [authors’ results].
WEHAM ScenarioModerate Scenario (MSC)Reduction
WEHAM-Projection
Period
Total Forest AreaAdditional EUBDS Protected AreasTotal Forest Area%
without EUBDS ImplementationStrictly Protected AreasProtected Areaswith EUBDS Implementation
Development-
Old-Growth Forests
Natural Forest DevelopmentFFH AreasSPA Areas
2018–202282,806 −6647−634−40975,11690.7%
2023–202773,048 −5863−537−36166,28690.7%
2028–203275,647 −6072−563−37468,63890.7%
2033–203775,028 −6022−547−37168,08790.7%
2038–204275,522 −6062−549−37368,53890.8%
2043–204775,636 −6071−551−37468,64090.7%
2048–205278,434 −6296−554−38871,19690.8%
2018–205276,589 −6148−562−37969,50090.7%
WEHAM scenarioIntensive scenario (ISC)Reduction
WEHAM-Projection
Period
Total Forest AreaAdditional EUBDS Protected AreasTotal Forest Area%
without EUBDS ImplementationStrictly Protected AreasProtected Areaswith EUBDS Implementation
Development-
Old-Growth Forests
Natural Forest DevelopmentFFH AreasSPA Areas
2018–202282,806−15,280−20,632−143045,46454.9%
2023–202773,048−15,270−17,654−116338,96153.3%
2028–203275,647−17,192−17,860−117839,41652.1%
2033–203775,028−16,286−17,948−113439,66052.9%
2038–204275,522−16,079−18,162−115740,12453.1%
2043–204775,636−15,802−18,282−113840,41453.4%
2048–205278,434−16,488−18,927−113141,88753.4%
2018–205276,589−16,057−18,495−119040,84753.3%
Table A7. Development of EU production, import and exports (M m3, M t) of wood and wood-based products in the reference, intensive and moderate scenario [authors’ results].
RSCISCMSC
201720302050201720302050201720302050
production
total roundwood *M m3473539586473281247473490521
fuelwood1121171221126145112106104
coniferous industrial roundwood278321343278167146278291309
non-coniferous industrial roundwood76951137650537687102
sawnwood1071341681078394107125158
plywood and panels617991615665617686
wood pulpsM t373745372123373542
paper and paperboards889611188871048895110
import
total roundwoodM m3576010657731285770123
fuelwood44647264613
coniferous industrial roundwood353770354876354378
non-coniferous industrial roundwood171930171826172032
sawnwood332625333634332726
plywood and panels30119301816301110
wood pulpsM t171824172125171924
paper and paperboards462624462925462623
export
total roundwoodM m3444759442516444049
fuelwood446420421
coniferous industrial roundwood28252628158282223
non-coniferous industrial roundwood1218281288121625
sawnwood56751105639475667101
plywood and panels332630331714332327
wood pulpsM t13173013914131628
paper and paperboard 624138623633624136
apparent domestic consumption
total roundwood *M m3485553632485329358485519595
fuelwood1121161221126671112110116
coniferous industrial roundwood285333388285200213285312364
non-coniferous industrial roundwood82971168260718291109
sawnwood858583858081858483
plywood and panels586470585767586369
wood pulpsM t413939413333413838
paper and paperboards728197728096728197
* incl. other industrial roundwood.

References

  1. COM. EU Biodiversity Strategy for 2030-Bringing Nature Back into our Lives; Communication from the Commission to the European Parliament, the Council, the European Economic and Social Committee and the Committee of the Regions COM (2020) 380 Final: Brussels, Belgium, 2020. [Google Scholar]
  2. Jonsson, R.; Mbongo, W.; Felton, A.; Boman, M. Leakage Implications for European Timber Markets from Reducing Deforestation in Developing Countries. Forests 2012, 3, 736–744. [Google Scholar] [CrossRef] [Green Version]
  3. Meyfroidt, P.; Roy Chowdhury, R.; Bremond, A.d.; Ellis, E.C.; Erb, K.-H.; Filatova, T.; Garrett, R.D.; Grove, J.M.; Heinimann, A.; Kuemmerle, T.; et al. Middle-range theories of land system change. Glob. Environ. Chang. 2018, 53, 52–67. [Google Scholar] [CrossRef]
  4. Liu, J.; Dou, Y.; Batistella, M.; Challies, E.; Connor, T.; Friis, C.; Millington, J.D.A.; Parish, E.; Romulo, C.L.; Silva, R.F.B.; et al. Spillover systems in a telecoupled Anthropocene: Typology, methods, and governance for global sustainability. Curr. Opin. Environ. Sustain. 2018, 33, 58–69. [Google Scholar] [CrossRef] [Green Version]
  5. Bastos Lima, M.G.; Persson, U.M.; Meyfroidt, P. Leakage and boosting effects in environmental governance: A framework for analysis. Environ. Res. Lett. 2019, 14, 105006. [Google Scholar] [CrossRef] [Green Version]
  6. Gan, J.; McCarl, B.A. Measuring transnational leakage of forest conservation. Ecol. Econ. 2007, 64, 423–432. [Google Scholar] [CrossRef]
  7. Dieter, M.; Englert, H. Competitiveness in the global forest industry sector: An empirical study with special emphasis on Germany. Eur. J. For. Res. 2007, 126, 401–412. [Google Scholar] [CrossRef]
  8. Murray, B.C.; McCarl, B.A.; Lee, H.-C. Estimating Leakage from Forest Carbon Sequestration Programs. Land Econ. 2004, 80, 109–124. [Google Scholar] [CrossRef]
  9. Kallio, A.M.I.; Maarit, I.; Solberg, B.; Käär, L.; Päivinen, R. Economic impacts of setting reference levels for the forest carbon sinks in the EU on the European forest sector. For. Policy Econ. 2018, 92, 193–201. [Google Scholar] [CrossRef]
  10. Li, R.; Buongiorno, J.; Turner, J.A.; Zhu, S.; Prestemon, J. Long-term effects of eliminating illegal logging on the world forest industries, trade, and inventory. For. Policy Econ. 2008, 10, 480–490. [Google Scholar] [CrossRef]
  11. Sohngen, B.; Mendelsohn, R.; Sedjo, R. Forest Management, Conservation, and Global Timber Markets. Am. J. Agric. Econ. 1999, 81, 1–13. [Google Scholar] [CrossRef]
  12. Kallio, A.M.I.; Solberg, B. Leakage of forest harvest changes in a small open economy: Case Norway. Scand. J. For. Res. 2018, 33, 502–510. [Google Scholar] [CrossRef]
  13. Hu, X.; Shi, G.; Hodges, D. International Market Leakage from China’s Forestry Policies. Forests 2014, 5, 2613–2625. [Google Scholar] [CrossRef]
  14. Hope, E.; Gagnon, B.; Avdić, V. Assessment of the Impact of Climate Change Policies on the Market for Forest Industrial Residues. Sustainability 2020, 12, 1787. [Google Scholar] [CrossRef] [Green Version]
  15. Ford, S.A.; Jepsen, M.R.; Kingston, N.; Lewis, E.; Brooks, T.M.; MacSharry, B.; Mertz, O. Deforestation leakage undermines conservation value of tropical and subtropical forest protected areas. Glob. Ecol. Biogeogr. 2020, 29, 2014–2024. [Google Scholar] [CrossRef]
  16. Dieter, M.; Weimar, H.; Iost, S.; Englert, H.; Fischer, R.; Günter, S.; Morland, C.; Roering, H.-W.; Schier, F.; Seintsch, B.; et al. Assessment of Possible Leakage Effects of Implementing EU COM Proposals for the EU Biodiversity Strategy on Forestry and Forests in Non-EU Countries; Thünen Working Paper No. 159; Johann Heinrich von Thünen-Institut: Braunschweig, Germany, 2020; Available online: https://www.thuenen.de/media/publikationen/thuenen-workingpaper/ThuenenWorkingPaper_159.pdf (accessed on 10 June 2022).
  17. FAOSTAT. Forestry Production and Trade: Datenbank. Available online: https://www.fao.org/faostat/en/#data/FO (accessed on 12 October 2021).
  18. Nakicenovic, N.; Alcamo, J.; Davis, G.; de Vries, B.; Fenhann, J.; Gaffin, S.; Gregory, K.; Grübler, A.; Jung, T.Y.; Kram, T.; et al. Special Report on Emissions Scenarios: A Special Report of Working Group III of the Intergovernmental Panel on Climate Change; Cambridge University Press: Cambridge, MA, USA, 2000; Available online: https://www.ipcc.ch/site/assets/uploads/2018/03/emissions_scenarios-1.pdf (accessed on 8 September 2020).
  19. FAO. Global Forest Resources Assessment 2010. Available online: http://www.fao.org/forest-resources-assessment/past-assessments/fra-2010/en/ (accessed on 30 September 2020).
  20. O’Neill, B.C.; Kriegler, E.; Riahi, K.; Ebi, K.L.; Hallegatte, S.; Carter, T.R.; Mathur, R.; van Vuuren, D.P. A new scenario framework for climate change research: The concept of shared socioeconomic pathways. Clim. Chang. 2014, 122, 387–400. [Google Scholar] [CrossRef] [Green Version]
  21. FAO. Global Forest Resources Assessment. 2022. Available online: https://fra-data.fao.org/ (accessed on 10 June 2022).
  22. Moiseyev, A.; Solberg, B.; Michie, B.; Kallio, A.M.I. Modeling the impacts of policy measures to prevent import of illegal wood and wood products. For. Policy Econ. 2010, 12, 24–30. [Google Scholar] [CrossRef]
  23. Kosow, H.; Gaßner, R. Methods of Future and Scenario Analysis: Overview, Assessment, and Selection Criteria; DIE Studies No. 39; German Development Institute: Bonn, Germany, 2008; Available online: https://nbn-resolving.org/urn:nbn:de:0168-ssoar-193660 (accessed on 10 June 2022).
  24. Buongiorno, J.; Zhu, S.; Zhang, D.; Turner, J.; Tomberlin, D. The Global Forest Products Model; Academic Press: Cambridge, MA, USA, 2003; ISBN 978-0-12-141362-0. [Google Scholar]
  25. Hermoso, V.; Carvalho, S.B.; Giakoumi, S.; Goldsborough, D.; Katsanevakis, S.; Leontiou, S.; Markantonatou, V.; Rumes, B.; Vogiatzakis, I.N.; Yates, K.L. The EU Biodiversity Strategy for 2030: Opportunities and challenges on the path towards biodiversity recovery. Environ. Sci. Policy 2022, 127, 263–271. [Google Scholar] [CrossRef]
  26. Timm, S.; Dieter, M.; Fischer, R.; Günter, S.; Heinrich, B.; Iost, S.; Matthes, U.; Rock, J.; Rüter, S.; Schabel, A.; et al. Konsequenzen der „EU-Biodiversitätsstrategie 2030“ für Wald und Forstwirtschaft in Deutschland: Abschlussbericht. 2022. Available online: https://www.lwf.bayern.de/mam/cms04/service/dateien/ma17_biodiversit%C3%A4tsstrategie-bericht.pdf (accessed on 13 June 2022).
  27. Rock, J.; Dunger, K.; Marks, A.; Schmidt, U. Wald und Rohholzpotenzial der nächsten 40 Jahre: Ausgewählte Ergebnisse der Waldentwicklungs- und Holzaufkommensmodellierung 2013 bis 2052. 2016. Available online: https://www.bmel.de/SharedDocs/Downloads/DE/Broschueren/Wald-Rohholzpotential-40Jahre.pdf;jsessionid=ED7D78C8F7B6DFD567C2D6475DD49EAA.internet2841?__blob=publicationFile&v=3 (accessed on 19 August 2020).
  28. BWI. Dritte Bundeswaldinventur-Ergebnisdatenbank. Available online: https://bwi.info/start.aspx (accessed on 7 August 2020).
  29. Dudley, N. Guidelines for Applying Protected Area Management Categories; Best Practice Protected Area Guidelines Series, No. 21; IUCN: Gland, Switzerland, 2008; Available online: https://portals.iucn.org/library/sites/library/files/documents/PAG-021.pdf (accessed on 10 June 2022).
  30. FAO. Global Forest Resources Assessment: Terms and Definitions; Forest Resources Assessment Working Paper 188; FAO: Rome, Italia, 2020; Available online: http://www.fao.org/3/I8661EN/i8661en.pdf (accessed on 7 September 2020).
  31. Forest Europe. State of Europe’s Forests. 2020. Available online: https://foresteurope.org/wp-content/uploads/2016/08/SoEF_2020.pdf (accessed on 10 June 2022).
  32. Röder, N.; Laggner, B. Landnutzung in Deutschland Nach Rechtlichem Schutzstatus der Flächen; Johann Heinrich von Thünen-Institut: Braunschweig, Germany, 2020; (Unpublished). [Google Scholar]
  33. Steinacker, C.; Engel, F.; Meyer, P. Natürliche Waldentwicklung: Wird das 5%-Ziel erreicht? Dtsch. Wald. 2020, 15–16. [Google Scholar]
  34. BMUB. Nationale Strategie Zur Biologischen Vielfalt: Kabinettsbeschluss Vom 7. November 2007, Berlin. 2007. Available online: https://www.bmuv.de/fileadmin/Daten_BMU/Pools/Broschueren/nationale_strategie_biologische_vielfalt_2015_bf.pdf (accessed on 12 July 2022).
  35. NW-FVA. Schutzgebiete NWE, FFH, SPA in Deutschland: Auswertung von Daten des Bundesamtes für Naturschutz (2020); Nordwestdeutsche Forstliche Versuchsanstalt: Göttingen, Germany, 2021. [Google Scholar]
  36. Rosenkranz, L.; Seintsch, B.; Wippel, B.; Dieter, M. Income losses due to the implementation of the Habitats Directive in forests—Conclusions from a case study in Germany. For. Policy Econ. 2014, 38, 207–218. [Google Scholar] [CrossRef]
  37. Rosenkranz, L.; Seintsch, B. Opportunitätskostenanalyse zur Implementierung des naturschutzorientierten Waldbehandlungskonzepts “Neue Multifunktionalität“. Landbauforsch. Appl. Agric. For. Res. 2015, 65, 145–160. [Google Scholar] [CrossRef]
  38. Sjølie, H.K.; Latta, G.S.; Solberg, B. Combining backcasting with forest sector projection models to provide paths into the future bio-economy. Scand. J. For. Res. 2016, 31, 708–718. [Google Scholar] [CrossRef]
  39. Hurmekoski, E.; Sjølie, H.K. Comparing forest sector modelling and qualitative foresight analysis: Cases on wood products industry. JFE 2018, 31, 11–16. [Google Scholar] [CrossRef]
  40. ten Brink, P.; Badura, T.; Bassi, S.; Daly, E.; Dickie, I.; Ding, H.; Gantioler, S.; Gerdes, H.; Kettunen, M.; Lago, M.; et al. Estimating the Overall Economic Value of the Benefits Provided by the Natura 2000 Network: Final Report to the European Commission; DG Environment on Contract ENV.B.2/SER/2008/0038; Institute for European Environmental Policy (IEEP), GHK., Ecologic Institute: Brussels, Belgium, 2011. [Google Scholar]
  41. Kallio, A.M.I.; Maarit, I.; Moiseyev, A.; Solberg, B. Economic impacts of increased forest conservation in Europe: A forest sector model analysis. Environ. Sci. Policy 2006, 9, 457–465. [Google Scholar] [CrossRef]
  42. Schier, F.; Weimar, H. Holzmarktmodellierung-Szenarienbasierte Folgenabschätzung verschiedener Rohholzangebotssituationen für den Sektor Forst und Holz; Thünen Working Paper 2018; Johann Heinrich von Thünen-Institut: Braunschweig, Germany, 2018. [Google Scholar] [CrossRef]
  43. van Kooten, G.C.; Johnston, C. Global impacts of Russian log export restrictions and the Canada–U.S. lumber dispute: Modeling trade in logs and lumber. For. Policy Econ. 2014, 39, 54–66. [Google Scholar] [CrossRef]
  44. Nepal, P.; Ince, P.J.; Skog, K.E.; Chang, S.J. Projection of U.S. forest sector carbon sequestration under U.S. and global timber market and wood energy consumption scenarios, 2010–2060. Biomass Bioenergy 2012, 45, 251–264. [Google Scholar] [CrossRef]
  45. Buongiorno, J. Global modelling to predict timber production and prices: The GFPM approach. Forestry 2015, 88, 291–303. [Google Scholar] [CrossRef]
  46. Turner, J.A.; Buongiorno, J.; Katz, A.; Zhu, S. Implications of the Russian roundwood export tax for the Russian and global wood products sectors. Scand. J. For. Res. 2008, 23, 154–166. [Google Scholar] [CrossRef]
  47. Johnston, C.M.T.; Buongiorno, J. Impact of Brexit on the forest products industry of the United Kingdom and the rest of the world. Forestry 2017, 90, 47–57. [Google Scholar] [CrossRef]
  48. Buongiorno, J.; Zhu, S. Consequences of carbon offset payments for the global forest sector. JFE 2013, 19, 384–401. [Google Scholar] [CrossRef]
  49. Buongiorno, J.; Johnston, C.; Zhu, S. An assessment of gains and losses from international trade in the forest sector. For. Policy Econ. 2017, 80, 209–217. [Google Scholar] [CrossRef] [Green Version]
  50. Morland, C.; Schier, F.; Weimar, H. The Structural Gravity Model and Its Implications on Global Forest Product Trade. Forests 2020, 11, 178. [Google Scholar] [CrossRef] [Green Version]
  51. Schier, F.; Morland, C.; Janzen, N.; Weimar, H. Impacts of changing coniferous and non-coniferous wood supply on forest product markets: A German scenario case study. Eur. J. For. Res. 2018, 137, 279–300. [Google Scholar] [CrossRef]
  52. World Bank. World Development Indicators|DataBank. Available online: https://databank.worldbank.org/source/world-development-indicators (accessed on 4 September 2020).
  53. Panayotou, T. Empirical Tests and Policy Analysis of Environmental Degradation at Different Stages of Economic Development; Working Paper No. 238; International Labour Organization: Geneva, Switzerland, 1993; Available online: http://www.ilo.org/public/libdoc/ilo/1993/93B09_31_engl.pdf (accessed on 4 April 2022).
  54. Riahi, K.; van Vuuren, D.P.; Kriegler, E.; Edmonds, J.; O’Neill, B.C.; Fujimori, S.; Bauer, N.; Calvin, K.; Dellink, R.; Fricko, O.; et al. The Shared Socioeconomic Pathways and their energy, land use, and greenhouse gas emissions implications: An overview. Glob. Environ. Chang. 2017, 42, 153–168. [Google Scholar] [CrossRef] [Green Version]
  55. Morland, C.; Schier, F.; Janzen, N.; Weimar, H. Supply and demand functions for global wood markets: Specification and plausibility testing of econometric models within the global forest sector. For. Policy Econ. 2018, 92, 92–105. [Google Scholar] [CrossRef]
  56. UNEP. Global Environment Outlook 3: Past, Present and Future perspectives. 2002. Available online: https://wedocs.unep.org/bitstream/handle/20.500.11822/8609/GEO-3%20REPORT_English.pdf?sequence=7&isAllowed=y (accessed on 10 June 2022).
  57. Grunwald, A. Technikfolgenabschätzung: Eine Einführung; Sigma: Berlin, Germany, 2002; ISBN 3894049316. [Google Scholar]
  58. Solberg, B.; Moiseyev, A.; Kallio, A.M.I.; Toppinen, A. Forest sector market impacts of changed roundwood export tariffs and investment climate in Russia. For. Policy Econ. 2010, 12, 17–23. [Google Scholar] [CrossRef]
  59. EC. Criteria and Guidance for Protected Areas Designations. Available online: https://circabc.europa.eu/ui/group/6f30d1d2-d6f2-4c6e-a4dc-1feb66201929/library/89652963-8cc4-459a-b24f-19373ea73fbf/details (accessed on 11 March 2022).
  60. Im, E.H.; Adana, D.M.; Latta, G.S. Potential impacts of carbon taxes on carbon flux in western Oregon private forests. For. Policy Econ. 2007, 9, 1006–1017. [Google Scholar] [CrossRef]
  61. Buongiorno, J.; Johnston, C. Effects of parameter and data uncertainty on long-term projections in a model of the global forest sector. For. Policy Econ. 2018, 93, 10–17. [Google Scholar] [CrossRef]
  62. Kallio, A.M.I. Accounting for uncertainty in a forest sector model using Monte Carlo simulation. For. Policy Econ. 2010, 12, 9–16. [Google Scholar] [CrossRef]
Figure 1. Absolute and relative changes in potential roundwood production in the moderate (MSC) and intensive scenario (ISC) compared to the WEHAM scenario [27] on potential roundwood for the period from 2028–2032 and onwards [authors’ results].
Forests 13 01225 g001
Figure 2. EU roundwood production (industrial roundwood + fuelwood) development in the reference (RSC), moderate (MSC) and intensive scenario (ISC) up to 2050 [authors’ results] as well as historical development data (His) [17].
Forests 13 01225 g002
Figure 3. EU roundwood production by wood types in RSC (blue), ISC (orange) and MSC (grey). IndRoundNC and IndRoundC refers to non-coniferous and coniferous industrial roundwood, respectively [authors’ results].
Forests 13 01225 g003
Figure 4. EU roundwood imports from non-EU countries by wood types in the RSC (blue), ISC (orange) and MSC (grey). IndRoundNC and IndRoundC refers to non-coniferous and coniferous industrial roundwood, respectively [authors’ results].
Forests 13 01225 g004
Figure 5. EU production of wood-based products by sectors in RSC (blue), ISC (orange) and MSC (grey). Wood-based materials comprises veneer and plywood as well as particle and fiberboard; papers include newsprint, printing and writing paper and paper and paperboards [authors’ results].
Forests 13 01225 g005
Figure 6. Roundwood production in countries with the greatest changes (ranking of countries is according to changes in ISC vs. RSC) and the EU: RSC (blue), ISC (orange), and MSC (grey) in 2050 [authors’ results].
Forests 13 01225 g006
Figure 7. Sawnwood production of the countries with the greatest changes (ranking of countries is according to changes in ISC vs. RSC) and the EU: RSC (blue), ISC (orange) and MSC (grey) in 2050 [authors’ results].
Forests 13 01225 g007
Figure 8. Wood-based panels production (including veneer and plywood) of the countries with the greatest changes (ranking of countries is according to changes in ISC vs. RSC) and the EU: RSC (blue), ISC (orange) and MSC (grey) in 2050 [authors’ results].
Forests 13 01225 g008
Figure 9. Production of paper and paperboard in the countries with the greatest changes (ranking of countries is according to changes in ISC vs. RSC) and the EU: RSC (blue), ISC (orange) and MSC (grey) in 2050 [authors’ results].
Forests 13 01225 g009
Figure 10. Level of EU production (a) and consumption (b) of industrial roundwood (IndRound), fuelwood, sawnwood, wood-based panels, pulps and papers in ISC (orange) compared to the RSC (blue). Radar plots mirrors the relative (a) production and (b) consumption levels in ISC measured to production and consumption of RSC (represented by 100%) in 2050 [authors’ results].
Forests 13 01225 g010
Table 1. Classification of scenarios developed for the purpose of the present study analysis (based on categorization of scenrios introduced in Kosow and Gaßner [23]).
Class AttributionSpecification
Scopetimelong-term horizon2017–2050
geopraphicglobalEU and worldwide
thematicpolicy evaluationforest protection measures and leakage
Characterexplorativeexplorative-descriptive scenariostest “what if” the EUBDS would be implemented
normative-normative character given by EUBDS1
Typequantitativeformalized scenarios mathematical and model-based approach
qualitative-qualitative elements given by EUBDS1
Purposealternativealternative scenariosexplore options for actions “if we change the road”
reference-reference adapted from other sources1
1 Most scenarios are not of purely dichotomous in character but somehow combine different elements in their character, type and purpose. In this study, the complementary elements are taken from external sources.
Table 2. Overview of operationalization of EUBDS objectives in an intensive (ISC) and a moderate (MSC) implementation scenario for Germany [authors’ results].
EUBDS ObjectivesModerate ScenarioIntensive Scenario
“1. Legally protect a minimum of 30% of the EU’s land area and 30% of the EU’s sea area and integrate ecological corridors, as part of a true Trans-European Nature Network.”
  • PAC includes Natura 2000 sites (FFH, SPA) and natural forest development sites (Table A2);
  • Current PAC: 5.6 M ha (16% of land area); 2.8 M ha in forests;
  • PAC+: 5.1 M ha (14% of land area); 2.6 M ha in forests.
  • PAC includes Natura 2000 sites and all protection categories of German law (Table A3);
  • Current PAC: 14.7 M ha (41% of land area); 6.5 M ha in forests;
  • No PAC+ required.
“2. Strictly protect at least a third of the EU’s protected areas, including all remaining EU primary and old-growth forests.”
  • Strict protection: Natural forest protection development sites (227 T ha) (Table A2);
  • PAC+ in forests: 1.031 M ha; allocated to forest and non-forests according to current distribution;
  • primary and old-growth forest are negligible (Sabatini et al. 2018).
  • Strict protection: core zones of National Parks and Biosphere Reservations (Table A3) (161 T ha);
  • PAC+: 4.164 M ha; allocated mainly to forests and 500 T ha of peatland restoration;
  • Primary and old-growth forests will be developed in stands older than the respective usual rotation period.
“3. Effectively manage all protected areas, defining clear conservation objectives and measures, and monitoring them appropriately.”
  • Management schemes of existing Natura 2000 sites are implemented at 45% of FFH and 50% of SPA sites.
  • Management schemes of existing Natura 2000 sites are implemented at all protected sites [36,37]. 1
1 For more details see Table A2, Table A3 and Table A4.
Publisher’s Note: MDPI stays neutral with regard to jurisdictional claims in published maps and institutional affiliations.

