Article

Effect of The Development Level of Facilities for Forest Tourism on Tourists’ Willingness to Visit Urban Forest Parks

1
State Key Joint Laboratory of Environment Simulation and Pollution Control, School of Environment, Beijing Normal University, Beijing 100875, China
2
School of Economics and Management, Beijing Forestry University, Beijing 100083, China
*
Author to whom correspondence should be addressed.
Forests 2022, 13(7), 1005; https://doi.org/10.3390/f13071005
Submission received: 4 May 2022 / Revised: 12 June 2022 / Accepted: 23 June 2022 / Published: 26 June 2022
(This article belongs to the Section Forest Economics, Policy, and Social Science)

Abstract

:
The importance of facilities for forest tourism to the development of forest tourism has been mentioned in many studies, but there is a lack of quantitative and specific research. In order to specifically study the effect of facilities for forest tourism on the development of forest tourism, a theoretical path from the cognition of the development level of facilities for forest tourism to the willingness of tourists to visit urban forest parks was constructed based on the perceived value theory. Then, the process and significance of the influence were quantitatively calculated by using a structural equation model (SEM). The results show that: (1) Cognition of the development level of facilities for forest tourism has a significant positive effect on the perceived value of landscape resources, the perceived value of the ecological environment, and tourists’ satisfaction. (2) The perceived value of the ecological environment has a significant positive effect on tourists’ satisfaction. (3) Tourists’ satisfaction has a significant positive effect on tourists’ willingness to visit urban forest parks. (4) The perceived value of landscape resources has no significant effect on tourists’ satisfaction. (5) The variety, layout, and advancement of facilities for forest tourism have a significant positive effect on the cognition of the development level of facilities for forest tourism, among which the layout has the most significant effect, followed by advancement and finally variety. We suggest that, when building facilities for forest tourism, tourists’ feelings and satisfaction should be the primary considerations.

1. Introduction

With the pronounced climate change in recent years, there has been a growing focus on the interaction between humans and the environment and the likely impacts of environmental degradation [1,2,3,4]. Visitors’ participation in nature-based recreation can nurture environmental attitudes, and those who hold strong environmental attitudes tend to behave in more environmentally responsible ways [5]. Ecotourism, first proposed by Diamantis [6], has therefore attracted more attention. Ecotourism has long been considered a means of ecological conservation and an efficient mechanism for alleviating conflicts between conservation and development [7,8,9,10,11,12]. Forest tourism is one form of ecotourism. Forest tourism is beneficial for physical and mental health [13,14] and has become more popular in recent years. Urban forest parks, the benefits of which are their superior geographical location and comfortable ecological environment, are a major place for people to carry out forest tourism. With the ongoing development of forest tourism, competition between urban forest parks is increasing. The urban forest parks that leave a satisfactory experience for tourists will be more likely to be favored, which will affect the tourists’ choice of urban forest parks, that is, tourists’ willingness to visit urban forest parks. Therefore, it is of great significance to study how to improve the satisfaction of tourists and then improve the willingness of tourists to visit urban forest parks to promote the development of forest tourism.
Tourists’ willingness to visit urban forest parks is affected by many factors, such as the frequent use of electronic media [15], frequent forest visits during childhood [15], and seasonal factors [16]. Some scholars have mentioned the impact of forestry infrastructure [17,18] on the development of forest tourism [19,20,21,22]. In addition, the effect of facilities for forest tourism on tourists’ willingness to visit the urban forest park has been of interest, such as rock climbing [23], facilities such as maintaining access and parking for users [24] and other facilities in the forest park. Crilley et al. [25] concluded that the benefits associated with a recreation experience can better affect the satisfaction of tourists. Stein and Lee [26] believed that the level of facility development will affect the benefits desired by recreationists.
Most of the existing studies concluded that facilities for forest tourism are one of the factors affecting tourists’ satisfaction and tourists’ motivation [23,24,25,26,27]. However, few studies have systematically discussed how the facilities for forest tourism affect tourists’ satisfaction. The effect of the development level of facilities for forest tourism on the willingness of tourists to visit urban forest parks was quantitatively studied in this paper. The development level of facilities for forest tourism is a comprehensive evaluation of the variety, layout and advancement of facilities for forest tourism. Firstly, based on the perceived value theory [28], we constructed a theoretical path from the cognition of the development level of facilities for forest tourism to the willingness of tourists to visit urban forest parks. Then, based on the Likert scale, we designed questionnaires to collect the data regarding tourists’ cognition of the development level of facilities for forest tourism and their willingness to visit urban forest parks. Finally, the structural equation model was used to quantitatively evaluate the influence of the cognition of the development level of facilities for forest tourism on tourists’ willingness to visit urban forest parks.
Compared with existing econometric methods, such as multiple linear regression, structural equation modeling (SEM) can perform not only factor analysis but also path analysis. For variables that cannot be measured directly or objectively, SEM can deal with them by introducing observed variables and latent variables. Variables such as cognition, perception, satisfaction, and willingness are subjective and cannot be measured directly. SEM can, therefore, be effectively used to fit the relationships between such variables. Moreover, SEM is a powerful tool for studying willingness. Some researchers have obtained reliable results using SEM to study the factors affecting willingness [29,30,31].
The rest of the article is arranged as follows: Section 2 elaborates on the theoretical framework and research hypotheses. The research methods and data sources are then described in Section 3, and the results are presented in Section 4. Section 5 discusses the conclusions, study limitations, future research directions, and policy suggestions.

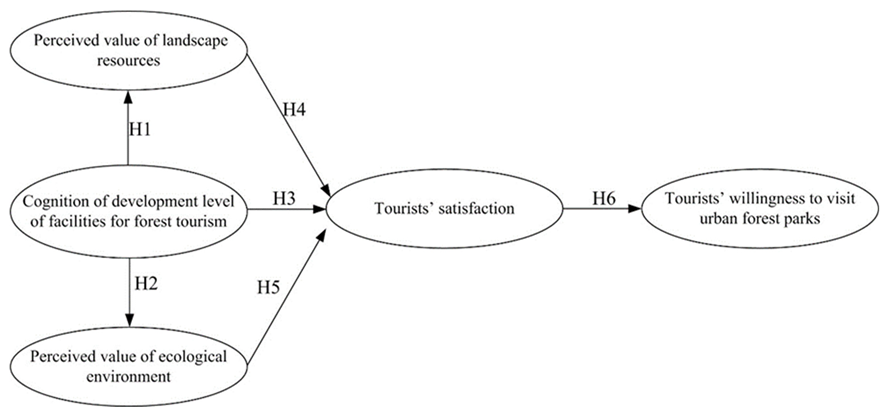
2. Theoretical Framework and Hypothesis Formulation

Perceived value theory [28] was first used to analyze customer behavior and their willingness to purchase. In perceived value theory, customers compare the benefits and costs brought by products, services, or behaviors based on their cognition and experience of products, services, or behaviors to form a comprehensive evaluation of them [32]. In short, perceived value theory is a subjective evaluation based on the customers’ cognition and experience of products, services, or behaviors. Cognition is an important factor affecting perceived value. The hierarchical model and tradeoff model also explain the formation mechanism of perceived value in terms of benefit and cost. The hierarchy model holds that perceived value comes from individuals’ processing of perceived information and is generated by the comparison of their expectations before and the results after behaviors based on their cognition of products, services, or behaviors [33]. According to the tradeoff model, meanwhile, perceived value is the psychological evaluation based on the comparison of benefits and costs [34,35]. When an individual perceives that the benefits are greater than the costs, perceived value will be high, and the individual’s willingness will be more obvious; otherwise, perceived value will be low, and the individual’s willingness will be lower.
We can conclude from the above that perceived value theory clarifies the decision-making mechanism of individuals from cognition to willingness, which is embodied as “experiential cognition–perceived value–behavioral willingness.” In other words, the individual’s experiential cognition will affect his or her behavioral intention. In the process of forest tourism, tourists will judge the development level of facilities for forest tourism in terms of whether all the facilities that they need exist (variety of facilities), whether the facilities can meet their needs in time (the layout of the facilities), and whether the facilities are convenient for use (the advancement of the facilities), etc. Tourists’ cognition of the development level of facilities for forest tourism will produce differences in their experience and affect their judgment of the benefits obtained from forest tourism. If tourists believe that facilities for forest tourism are well developed and bring them comfort and convenience, they will think they have gained higher utility in the process of forest tourism. On the contrary, tourists will feel that the utility of forest tourism is lower. Thus, we proposed the following hypothesis:
H1. 
Cognition of forestry infrastructure completeness has a positive effect on the perceived value of landscape resources.
H2. 
Cognition of forestry infrastructure completeness has a positive effect on the perceived value of ecological resources.
H3. 
Cognition of forestry infrastructure completeness has a positive effect on tourist satisfaction.
Regarding the effect of perceived value on satisfaction, previous studies noted that customer satisfaction is mainly affected by three factors: customer expectation, quality perception, and value perception [36,37]. Bai and Liao [38] suggest that perceived value will affect customers’ satisfaction at different levels. Gallarza and Saura [39] studied the relationship between customers’ perceived value and satisfaction in the context of tourism and found that satisfaction is the behavioral result of perceived value. Therefore, tourists’ cognition of the development level of facilities for forest tourism, perceived value of landscape resources, and perceived value of ecological resources determines their satisfaction with the forest tourism experience. We, therefore, proposed the following hypothesis:
H4. 
Perceived value of landscape resources has a positive effect on tourist satisfaction.
H5. 
Perceived value of ecological environment has a positive effect on tourist satisfaction.
Regarding the relationship between satisfaction and willingness, according to the theory of planned behavior, attitude affects willingness, and satisfaction is a kind of behavioral attitude [33,34]. Therefore, satisfaction will affect willingness. With the introduction of “satisfaction” in the tourism field, the study of tourist satisfaction has become a major research hotspot. Various studies have explored the relationship between satisfaction and behavioral intention [35,36,37], finding that satisfaction will affect behavioral intention. The higher the degree of satisfaction, the higher the tendency of behavioral intention; the lower the degree of satisfaction, the lower the intention. For example, when investigating the willingness of villagers to participate in living garbage management, it was found that the higher the satisfaction of villagers, the higher their willingness to participate in garbage management [38]. Thus, tourist satisfaction with the forest tourism experience determines their willingness to revisit and recommend the scenic spot to others; therefore, H6 was proposed:
H6. 
Tourist satisfaction has a positive effect on forest tourism willingness.
We constructed a model based on the above theoretical analysis and assumptions, as shown in Figure 1.

3. Research Method and Data

3.1. Method

The structural equation model (SEM) was used to study the effect of the development level of facilities for forest tourism on tourists’ willingness to visit urban forest parks. Firstly, based on the perceived value theory [28], we constructed a theoretical path from the cognition of the development level of facilities for forest tourism to the willingness of tourists to visit urban forest parks. Then, we designed a questionnaire based on a Likert scale and collected data about tourists’ cognition of the development level of facilities for forest tourism and their willingness to visit urban forest parks. The reliability test of the collected data was performed in SPSS 19.0 (IBM, Armonk, New York, NY, USA) and the validity test was performed in AMOS22.0 (IBM, Armonk, New York, NY, USA). Finally, the results were analyzed by AMOS22.0 (IBM, Armonk, New York, NY, USA).
SEM can process multiple explained variables at the same time, allowing for the measurement of errors between independent and dependent variables. Therefore, to obtain more accurate results, we used SEM for analysis. SEM includes two theoretical models: a structural model and a measurement model. The structural model studies linear relationships between observed variables; the measurement model defines the linear relationships between observed and latent variables. The SEM equation is expressed as
Structure   model :   η = γ ζ + β η + ε
Measurement   model :   Y = λ η + ε   ( endogenous   latent   variable )
Measurement   model :   X = λ ζ + δ   ( exogenous   latent   variables )
where η is the vector type, γ is the regression type, ζ is the vector type, and β is the regression type. In the measurement model, λ is the regression type, and ε and δ are the vectors of measurement errors for the indicators.

3.2. Participant Characteristics

Data were collected through questionnaires. To study the effect of facilities for forest tourism on tourists’ willingness to visit urban forest parks, we selected tourists in urban forest parks as the objects of the questionnaire. Zhang [39] applied the analytic hierarchy process and fuzzy comprehensive evaluation method to comprehensively evaluate and rank 13 urban forest parks in Beijing from four aspects: tourism resources, social factors, management service factors, and economic factors. In order to comprehensively understand the development level of facilities for forest tourism in urban forest parks with different evaluation levels, we divided those urban forest parks into four levels according to the ranking and synthesis score: ranking 1–4 as the first level, ranking 5–7 as the second level, ranking 8–10 as the third level, and ranking 11–13 as the fourth level. The first level to the fourth level corresponds to a comprehensive evaluation of urban forest parks from excellent to poor. Since the numbers of urban forest parks at each level are different, in order to make the selected parks evenly distributed as much as possible, we selected more parks at the level with a large number and selected fewer at the levels with a small number. As a result, two urban forest parks were selected at the first level, and one each was selected at the second level, the third level, and the fourth level. The participants were selected from the urban forest parks according to the principle that the questionnaires can be understood and filled out carefully. The details of the selected urban forest parks are shown in Table 1. The characteristics of the participants are shown in Table 2.

3.3. Meaning and Characteristics of Variables

The following observed variables were designed based on the hypotheses. The values of the observed variables were designed based on the Likert scale. Table 3 shows the specific information.
Cognition of the development level of facilities for forest tourism (IF) was estimated based on tourists’ assessment of the variety, layout, and advancement of facilities. Perceived value of landscape resources (RE) was estimated based on tourists’ assessment of physiographic landscape, climatic landscape, rare creature landscape, waterscape, historical and cultural relics, entertainment and shopping facilities, and folkloric landscape. Perceived value of ecological environment (EN) was estimated based on tourists’ assessment of air quality, soil pollution, and vegetation cover. Tourists’ satisfaction (SA) was a comprehensive evaluation of tourists’ impression of the environment, facilities, and landscape resources. Tourists’ willingness to visit the forest park (PA) included tourists’ willingness to revisit this park and to recommend this park to others.

4. Results and Analysis

Reliability and validity are important indicators for evaluating the rationality of data. Therefore, first, we conducted reliability and validity tests on the data, and Table 4 and Table 5 show the respective test results. Then, we used the valid data to fit the model and obtain the fitting results. Finally, we evaluated the model fitting results.

4.1. Exploratory Factor Analysis and Data Reliability Test

Reliability tests are used to measure data consistency, and Cronbach’s α coefficient is normally used to measure consistency. In this study, reliability was considered adequate if the α value was >0.7 [40]. First, the Cronbach’s α coefficients of all observed variables were calculated. Cronbach’s α coefficients were all greater than 0.70, indicating high data reliability. Then, the KMO and Bartlett’s test of sphericity values were calculated. The KMO value of each group was greater than or equal to 0.5, indicating that the data were suitable for factor analysis. Finally, exploratory factor analysis was conducted to obtain the factor loads of each observed variable. The variables whose factor loading is less than 0.4 should be removed. Thus, physiographic landscape (RE1) and folkloric landscape (RE7) were removed. Table 4 shows the detailed results.

4.2. Confirmatory Factor Analysis and Data Validity Test

Validity includes convergence validity and discriminant validity. Generally, three criteria are used to evaluate convergence validity: (1) the standardized factor load is greater than 0.5 and significant, (2) combined reliability (CR) is greater than 0.6, and (3) average variance extracted (AVE) is greater than 0.5. We used AMOS 22.0 for confirmatory factor analysis to identify convergence validity and observed variables would be deleted if the standardized factor load was less than 0.50. The final analysis table of convergence validity was obtained, as shown in Table 5. According to Table 5, the standardized factor loads of the five potential variables corresponding to the topic are all greater than 0.60, CRs are all greater than 0.60, and AVEs are all greater than 0.50, except for tourists’ willingness to visit urban forest parks (0.493), which can be considered to be approximately 0.5. Therefore, in general, the scale has good convergence validity.
The arithmetic square root of the AVE of the factor is compared with the correlation coefficients between this factor and other factors. If the arithmetic square root of AVE is greater than the correlation coefficients of this factor and other factors, then the scale has good discriminant validity. Table 6 shows the result of the discriminant validity test. According to the analysis, the scale meets the test criteria for discriminant validity, indicating that it has good discriminant validity.

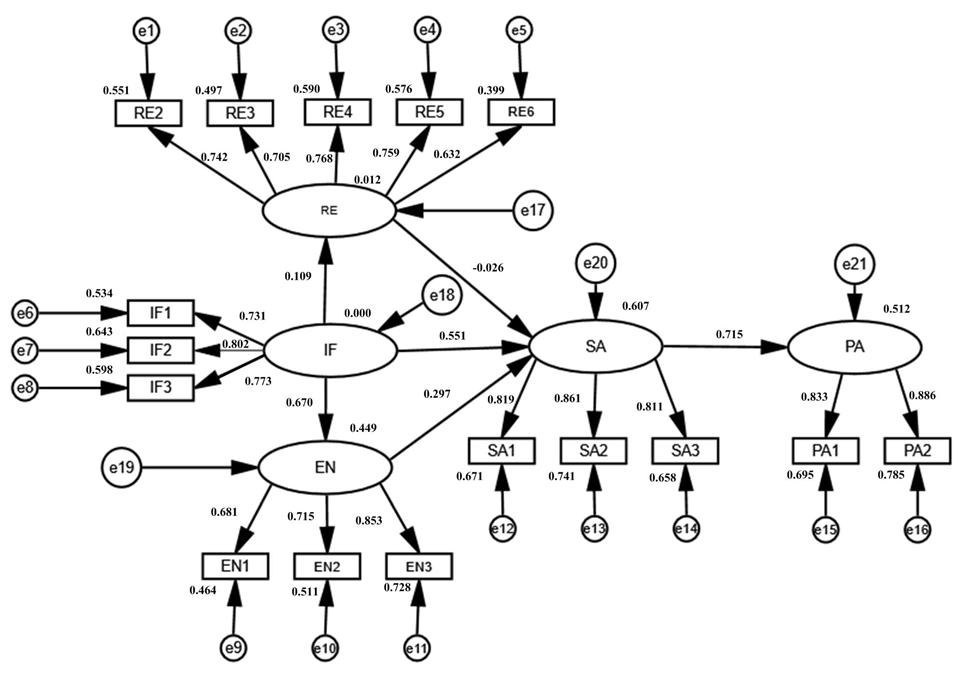
4.3. Model Fitting Results

AMOS 22.0 was used to test the theoretical model. Figure 2 shows the model fitting results. Figure 2 indicates that the model fits well, and the coefficient relationship between measured variables and latent variables meets the validity test. Table 7 shows the normalized path coefficients between the latent variables.
AMOS 22.0 was used to estimate the model, and the correlation coefficients between the latent variables were obtained. Table 7 shows the results. We can conclude that H1, H2, H3, H5, and H6 all support the null hypothesis, while H4 does not.
In the structural model, cognition of the development level of facilities for forest tourism has a significant positive effect on the perceived value of landscape resources and the perceived value of the ecological environment, indicating that the more complete the facilities for forest tourism, the better impression tourists will have of the landscape resources and ecological environment in the urban forest parks. Cognition of the development level of facilities for forest tourism has a significant positive effect on tourists’ satisfaction, indicating that the more complete the facilities for forest tourism, the higher the tourists’ satisfaction. The main reason is that improved facilities for forest tourism bring more convenience to tourists and improve their satisfaction. Perceived value of landscape resources has no significant effect on tourist satisfaction. The reason may be that entertainment facilities and shopping facilities will destroy the natural landscape and reduce tourists’ satisfaction. Perceived value of the ecological environment has a significant positive effect on tourists’ satisfaction, indicating that the better the ecological environment, the higher the tourists’ satisfaction. Tourists’ satisfaction has a significant positive effect on tourists’ willingness to visit urban forest parks, indicating that the higher the tourists’ satisfaction with forest tourism, the stronger the tourists’ willingness to visit urban forest parks.
In the measurement model, the effect of each observed variable on the latent variable is different. For the cognition of the development level of facilities for forest tourism, the IF2 (0.802) of facility layout had the greatest influence, followed by the IF3 (0.773) of advancement of the facilities and the IF1 (0.731) of variety of the facilities. In terms of the perceived value of the ecological environment, in descending order of degree of influence, from large to small, is the influence of vegetation cover EN3 (0.853), the influence of soil pollution EN2 (0.715), and the influence of air quality EN1 (0.681). In terms of the perceived value of landscape resources, waterscape RE4 (0.768) has the greatest influence, and entertainment and shopping facilities RE6 (0.632) have the least influence. For tourists’ satisfaction, the most influential factor is facilities satisfaction SA2 (0.861). For tourists’ willingness to visit urban forest parks, the influence coefficients of PA1 (0.833) and PA2 (0.886) are both greater than 0.800, indicating that both have great influence.

4.4. Model Evaluation Results

We used the root mean square of approximate error (RMSEA), goodness of fit index (GFI), comparative fit index (CFI), and chi square/degree of freedom (CMIN/DF) to evaluate the fitting of the model. AMOS 22.0 was used to calculate the results, as shown in Table 8.
As shown in Table 8, the actual values of RMSEA, GFI, CFI, and CMIN/DF (chi square/degree of freedom) are all within the recommended value, indicating that the model has a good fitting effect.

5. Conclusions and Discussion

5.1. Conclusions

Existing studies only suggest that facilities for forest tourism should be improved to promote the development of forest tourism, but there is a lack of specific research on how facilities for forest tourism affect forest tourism. The willingness of tourists to visit urban forest parks is an important indicator of the development of forest tourism in urban forest parks. Therefore, we constructed the influence path of facilities for forest tourism on the willingness of tourists to visit urban forest parks and quantitatively explored the significance of the impact of facilities for forest tourism on forest tourism based on field research data. The results show that: (1) Cognition of the development level of facilities for forest tourism has a significant positive effect on the perceived value of landscape resources, the perceived value of the ecological environment, and tourists’ satisfaction. This supports the original hypothesis. (2) The perceived value of the ecological environment has a significant positive effect on tourists’ satisfaction. This supports the original hypothesis. (3) Tourists’ satisfaction has a significant positive effect on tourists’ willingness to visit urban forest parks. This supports the original hypothesis. (4) The perceived value of landscape resources has no significant effect on tourists’ satisfaction. This rejects the original assumption. (5) The layout, advancement and variety of facilities for forest tourism have a significant positive effect on the cognition of the development level of facilities for forest tourism, among which the layout has the most significant effect, followed by the advancement and finally the variety.

5.2. Discussion

Sound facilities for forest tourism could enhance tourists’ perceived value of landscape resources and the perceived value of the ecological environment and then improve tourists’ satisfaction with the tourism experience. This is consistent with existing studies that cognition has a positive effect on perceived value [41]. The better the ecological environment, the happier the tourists will be, accompanied by higher satisfaction. In other words, the perceived value of the ecological environment has a positive impact on tourists’ satisfaction, which is consistent with the existing research [31,32]. Regarding the relationship between the perceived value of landscape resources and tourists’ satisfaction, our results show that the perceived value of landscape resources has no significant effect on tourists’ satisfaction, which is different from some other studies [31,32]. The reason may be that too many entertainment facilities in the landscape resources make the urban forest park feel similar to an amusement park, being too noisy and not really relaxing, thus reducing the satisfaction of tourists. Satisfaction is an important indicator affecting tourists’ choice of forest park. Our study confirmed the positive relationship between satisfaction and willingness, consistent with previous related research [35,36,37,38]. When building facilities for forest tourism, tourists’ feelings and satisfaction should be the primary considerations.
The results show that, on the one hand, the layout, advancement and variety of facilities have a direct positive effect on tourists’ satisfaction. On the other hand, the layout, advancement and variety of facilities have an indirect positive impact on tourists’ satisfaction by affecting the perceived value of the ecological environment. Therefore, the layout, advancement and variety of facilities should be improved. If the layout of the facilities for forest tourism is unreasonable, tourists have to spend more time to meet their demands. For example, if the public washrooms are almost all distributed at the entrance while lacking during the tour, it will bring great inconvenience to tourists. Less advanced facilities, such as population ticketing compared to automatic ticket machines, will take extra time for tourists. The lack of certain varieties of facilities in forest tourism will lead to unmet needs of tourists. For example, if facilities such as benches are lacking, tourists’ needs for short breaks cannot be met. Therefore, managers of forest parks should improve the development level of facilities for forest tourism from the three aspects: variety, layout and advancement. To achieve a reasonable layout, managers should aim to provide convenience for tourists when selecting sites for facilities construction or select sites by soliciting opinions from tourists. Managers should also build some advanced facilities, such as vending machines, facilities for monitoring air quality, etc., to provide tourists with a more convenient and comfortable experience. In addition, to achieve a sufficient variety, forest park managers should improve the supply mechanism of facilities and raise funds.
Facilities for forest tourism is one of the important factors affecting tourists’ tourism motivation, but the impact mechanism is lacking specific research. Based on the structural equation model, we specifically studied the effect of the development level of facilities for forest tourism on tourists’ willingness to visit urban forest parks. However, there are some limitations of our study. First, only the urban forest parks were selected for investigation. The research results may not be fully applicable to the visitors of those types of parks that are primitive, rustic, and have few facilities or services. Second, the number of urban forest parks we investigated may be insufficient. More research samples can be investigated to validate our findings. Our research is only one aspect of facilities for forest tourism. There are many other issues concerning facilities for forest tourism that warrant further study, such as how to choose the location of facilities for forest tourism, how to design the supply mechanism of the facilities and so on.

Author Contributions

Conceptualization, writing—original draft preparation, L.Z.; methodology, C.W.; writing—review and editing, Y.H. All authors have read and agreed to the published version of the manuscript.

Funding

This work was funded by the National Natural Science Foundation of China (52170175), National Natural Science Foundation of China (72161147003), and Major Projects of High-Resolution Earth Observation Systems of National Science and Technology under Grant 05-Y30B01-9001-19/20-4.

Conflicts of Interest

The authors declare that there are no conflicts of interest.

References

  1. Martin, G.H. The environment of mental health. J. Ment. Health 2019, 28, 109–111. [Google Scholar]
  2. Yeagerab, R.A.; Smithac, T.R.; Bhatnagarad, A. Green environments and cardiovascular health. Trends Cardiovasc. Med. 2020, 30, 241–246. [Google Scholar] [CrossRef] [PubMed]
  3. Attfield, R. Principlism, public health and the environment. J. Public Health 2021, 43, 427–428. [Google Scholar] [CrossRef] [PubMed]
  4. Carducci, A.L.; Agodi, A.; Ancona, C.; Angelini, P.; Bagordo, F.; Barbone, F.; Birbaum, L.; Carreri, V.; Casuccio, A.; Conti, A.; et al. Impact of the environment on the health: From theory to practice. Environ. Res. 2021, 194, 110517. [Google Scholar] [CrossRef]
  5. Diamantis, D. The concept of ecotourism: Evolution and trends. Curr. Issue Tour. 1999, 2, 93–122. [Google Scholar] [CrossRef]
  6. Ren, L.J.; Li, J.; Li, C.; Dang, P.Y. Can ecotourism contribute to ecosystem? Evidence from local residents’ ecological behaviors. Sci. Total Environ. 2021, 757, 143814. [Google Scholar] [CrossRef]
  7. Ruhanen, L. The prominence of eco in ecotourism experiences: An analysis of post purchase online reviews. J. Hosp. Tour. Manag. 2019, 39, 110–116. [Google Scholar] [CrossRef]
  8. Johannesen, A.B.; Skonhoft, A. Tourism, poaching and wildlife conservation: What can integrated conservation and development projects accomplish? Resour. Energy Econ. 2005, 27, 208–226. [Google Scholar] [CrossRef] [Green Version]
  9. Naidoo, R.; Adamowicz, W.L. Biodiversity and nature-based tourism at forest reserves in Uganda. Environ. Dev. Econ. 2005, 10, 159–178. [Google Scholar] [CrossRef] [Green Version]
  10. Ma, B.; Yin, R.; Zheng, J.; Wen, Y.; Hou, Y. Estimating the social and ecological impact of community-based ecotourism in giant panda habitats. J. Environ. Manag. 2019, 250, 109506. [Google Scholar] [CrossRef]
  11. Coria, J.; Calfucura, E. Ecotourism and the development of indigenous communities: The good, the bad, and the ugly. Ecol. Econ. 2012, 73, 47–55. [Google Scholar] [CrossRef] [Green Version]
  12. Crǎciunescu, A.; Moatǎr, M.; Stanciu, S. The Romanian ecosystem forest—A recreation space in sylvotourism. Agric. Manag. Lucr. Stiintifice Ser. I Manag. Agric. 2014, 16, 89–93. [Google Scholar]
  13. Zhang, D.M.; Peng, S.Z.; Zhao, W.J.; Gao, M.Y.; Han, J.Q. Evaluation of ecological environment quality of typical forest parks. Agric. Biotechnol. 2019, 8, 112–116. [Google Scholar]
  14. Hong, S.; Kim, J.; Kim, S. Implications of potential green tourism development. Ann. Tour. Res. 2003, 30, 323–341. [Google Scholar] [CrossRef]
  15. Oppliger, J.; Lieberherr, E.; Hegetschweiler, K.T. Factors influencing teenagers’ recreational forest use in a densely-populated region in Switzerland. J. Outdoor Rec. Tour. 2019, 27, 100225. [Google Scholar] [CrossRef]
  16. Lee, C.F. The factor structure of tourist satisfaction in forest recreation tourism: The case of Taiwan. Tour Anal. 2016, 21, 251–266. [Google Scholar] [CrossRef]
  17. Cheng, N.Y. Study on the Development of Forest Leisure Tourism Industry Based on Resource Constraint. Ph.D. Thesis, Nanjing Forestry University, Nanjing, China, 2012. [Google Scholar]
  18. Han, N. Analysis of Forest Tourism Competitiveness in Heilongjiang Province. Master’s Thesis, Northeast Agricultural University, Harbin, China, 2017. [Google Scholar]
  19. Gandaseca, S.; Tetsuhiko, Y. Occupational safety, health and living conditions of forestry workers in indonesia. J. For. Res. 2001, 6, 281–285. [Google Scholar] [CrossRef]
  20. Zhang, L.Y.; Zhang, J.Y.; Zhang, L.X.; Wu, C.L.; Zhang, Y. Study on the Classification of Forestry Infrastructure from the Perspective of Supply Based on the Classical Quartering Method. Appl. Math. Nonlinear Sci. 2021, 6, 447–458. [Google Scholar] [CrossRef]
  21. Zeithaml, V.A. Consumer perceptions of price, quality, and value: A means-end model and synthesis of evidence. J. Mark. 1988, 52, 2–22. [Google Scholar] [CrossRef]
  22. Sun, S.H.; Li, H.; Xiao, L. The model of the exploratory factor analysis about residents’ will of rural land transfer. Int. J. Smart Home 2015, 9, 63–72. [Google Scholar]
  23. Oh, D.G. Analysis of the factors affecting volunteering, satisfaction, continuation will, and loyalty for public library volunteers: An integrated structural equation model. J. Libr. Inf. Sci. 2019, 51, 894–914. [Google Scholar] [CrossRef]
  24. Fino, E.; Iliceto, P. Do people have control over the decisions they make? Psychometric properties of the Italian version of the free will and scientific determinism questionnaire (FAD-plus-I). Curr. Psychol. 2021, 25, 1–19. [Google Scholar] [CrossRef]
  25. Sonali, S.; Singh, N.; Kalinić, Z.; Liébana, C. Assessing determinants influencing continued use of live streaming services: An extended perceived value theory of streaming addiction. Expert Syst. Appl. 2021, 168, 114241. [Google Scholar]
  26. Woodruff, R.B. Customer value: The next source for competitive advantage. J. Acad. Market. Sci. 1997, 25, 203–220. [Google Scholar] [CrossRef]
  27. Parasuraman, A.; Grewal, D. The impact of technology on the quality-value -loyalty chain: A research agenda. J. Acad. Mark. Sci. 2000, 28, 168–174. [Google Scholar] [CrossRef]
  28. Sweeney, J.C.; Soutar, G.N. Consumer perceived value: The development of a multiple item scale. J. Retail. 2001, 77, 203–220. [Google Scholar] [CrossRef]
  29. Liang, Y. Summary and comment on the customer’s satisfaction study. J. Beijing Technol. Bus. Univ. 2007, 22, 75–80. [Google Scholar]
  30. Yuan, R.J.; Yuan, Q.J. Perceived value theory and its application and prospect in information system research. J. Mod. Inf. 2021, 41, 150–158. [Google Scholar]
  31. Bai, C.H.; Liao, W. A study of customer’s satisfactions based on customer perceived value. Nankai J. 2001, 8, 14–20. [Google Scholar]
  32. Gallarza, M.G.; Saura, I.G. Value dimensions, perceived value, satisfaction and loyalty: An investigation of university students’ travel behavior. Tour. Manag. 2006, 27, 437–452. [Google Scholar] [CrossRef]
  33. Ajzen, I. Attitudes, traits, and actions: Dispositional prediction of behavior in personality and social psychology. Adv. Exp. Soc. Psychol. 1985, 20, 1–63. [Google Scholar]
  34. Ajzen, I. The theory of planned behavior. Organ. Behav. Hum. Dec. 1991, 50, 179–211. [Google Scholar] [CrossRef]
  35. Joo, D.; Woosnam, K.M.; Lee, S.; Lee, C.K. Destination loyalty as explained through self-congruity, emotional solidarity, and travel satisfaction. J. Hosp. Tour. Manag. 2020, 45, 21–42. [Google Scholar] [CrossRef]
  36. Berhanu, E.B.; Apar, S. Modeling domestic tourism: Motivations, satisfaction and tourist behavioral intentions. Heliyon 2020, 6, 04839. [Google Scholar]
  37. Cong, L.C. Perceived risk and destination knowledge in the satisfaction-loyalty intention relationship: An empirical study of European tourists in Vietnam. J. Outdoor Rec. Tour. 2021, 33, 100343. [Google Scholar] [CrossRef]
  38. Yang, Z.H.; Zhang, Y.; Long, Z.Y.; Yin, C.B.; Zhang, Y.Q.; Meng, Z. Can village rules and regulations effectively promote the willingness of villagers to invest in MSW disposal?—Based on the analysis of the mediating effect of villagers’ cognition and the moderating effect of environmental satisfaction. Chin. J. Agric. Resour. Reg. Plan. 2021, 42, 1–16. [Google Scholar]
  39. Zhang, Y. Study on Recreation Resources Evaluation of Beijing National Forest Park. Master’s Thesis, Beijing University of Agriculture, Beijing, China, 2020. [Google Scholar]
  40. Liu, J.; Zhu, Y.; Bo, Q. Reliability and validity of the Chinese version of the Medical Outcomes Study HIV Health Survey (MOS-HIV) in people living with HIV/AIDS (PLWHA) in China. PLoS ONE 2018, 13, 201177. [Google Scholar] [CrossRef]
  41. Takuroa, T.; Makotob, M. The impact of cognitive apprenticeship on the perceived growth of junior doctors. J. Workplace Learn. 2020, 32, 489–499. [Google Scholar]
Figure 1. Theoretical model.
Forests 13 01005 g001
Figure 2. Final path diagram of structural equation modeling. Note: IF: Cognition of the development level of facilities for forest tourism, RE: Perceived value of landscape resources, EN: Perceived value of ecological environment, SA: Tourists’ satisfaction, PA: Tourists’ willingness to visit the forest park.
Forests 13 01005 g002
Table 1. The details of the selected urban forest parks.
NumbersUrban Forest Parks
1Badaling National Forest Park
2Dayang Mountain National Forest Park
3West Mountain National Forest Park
4Qifeng Mountain National Forest Park
5Anaconda National Forest Park
Table 2. Participant characteristics.
Demographic FeaturesPossible OptionsResponsesPercentage (%)
GenderMale23656.325
Female18343.675
Age18–3516439.141
35–5013732.697
50–6510725.537
Above 65112.625
EducationIlliterate174.057
Primary235.489
High school122.864
College degree19646.778
Graduate17140.812
Monthly incomeLess than 6000 17942.721
6000–80007217.184
8000–10,000255.967
10,000–12,0005613.365
Above 12,0008720.764
Frequency of forest tourism1 time per week25360.382
2–3 times per week13231.504
More than 3 times per week348.115
Table 3. Values and characteristics of variables.
Variable ItemsMeanSD
IF
IF1Variety of infrastructure1 = few, 2 = incomplete, 3 = moderate, 4 = almost complete, 5 = fully complete2.6871.097
IF2Layout of infrastructure1 = completely unreasonable, 2 = relatively unreasonable, 3 = moderate, 4 = relatively reasonable, 5 = completely reasonable2.9521.149
IF3Advancement of infrastructure 1 = completely backward, 2 = relatively backward, 3 = moderate, 4 = relatively advanced, 5 = fully advanced3.0721.226
RE
RE1Physiographic landscape1 = very poor, 2 = relatively poor, 3 = moderate, 4 = relatively good, 5 = very good2.9571.159
RE2Rare creature landscape 1 = very poor, 2 = relatively poor, 3 = moderate, 4 = relatively good, 5 = very good2.3131.055
RE3Climatic landscape1 = very poor, 2 = relatively poor, 3 = moderate, 4 = relatively good, 5 = very good2.4461.079
RE4Waterscape 1 = very poor, 2 = not beautiful, 3 = moderate, 4 = relatively beautiful, 5 = very beautiful2.2701.004
RE5Historical and cultural relics1 = very simple, 2 = relatively simple, 3 = moderate, 4 = relatively diverse, 5 = very diverse2.2391.121
RE6Entertainment and shopping infrastructure1 = very simple, 2 = relatively simple, 3 = moderate, 4 = relatively diverse, 5 = very diverse2.8521.197
RE7Folkloric landscape 1 = very simple, 2 = relatively simple, 3 = moderate, 4 = relatively diverse, 5 = very diverse3.3151.215
EN
EN1Air quality1 = very poor, 2 = relatively poor, 3 = moderate, 4 = relatively good, 5 = very good3.7141.376
EN2Soil pollution 1 = very serious, 2 = relatively serious, 3 = moderate, 4 = almost no pollution, 5 = no pollution at all2.5351.242
EN3Vegetation cover 1 = very thin, 2 = relatively thin, 3 = moderate, 4 = relatively thick, 5 = very thick3.2771.292
SA
SA1Ecological environment satisfaction1 = very dissatisfied, 2 = relatively dissatisfied, 3 = moderate, 4 = relatively satisfied, 5 = very satisfied3.3561.191
SA2Infrastructure satisfaction1 = very dissatisfied, 2 = relatively dissatisfied, 3 = moderate, 4 = relatively satisfied, 5 = very satisfied3.1961.195
SA3Landscape resources satisfaction1 = very dissatisfied, 2 = relatively dissatisfied, 3 = moderate, 4 = relatively satisfied, 5 = very satisfied3.2411.265
PA
PA1Willingness to revisit this place1 = very low, 2 = relatively low, 3 = moderate, 4 = relatively high, 5 = very high2.6781.111
PA2Willingness to recommend others1 = very low, 2 = relatively low, 3 = moderate, 4 = relatively high, 5 = very high2.7951.138
Note: IF: cognition of the development level of facilities for forest tourism; RE: perceived value of landscape resources; EN: perceived value of ecological environment; SA: tourists’ satisfaction; PA: tourists’ willingness to visit urban forest parks; SD: standard deviation.
Table 4. Results of exploratory factor analysis and data reliability tests.
Latent
Variables
Observed
Variables
Factor
Loading
KMO Bartlett’s Test of SphericityCronbach’s
Alpha
IFIF10.8360.710421.278 (p = 0.000)0.810
IF20.872
IF30.848
RERE10.2110.7941029.489 (p = 0.000)0.795
RE20.806
RE30.763
RE40.810
RE50.818
RE60.673
RE70.021
ENEN10.8060.670386.465 (p = 0.000)0.786
EN20.818
EN30.888
SASA10.8870.737635.763 (p = 0.000)0.873
SA20.908
SA30.884
PAPA10.9320.500328.450 (p = 0.000)0.850
PA20.932
Table 5. Confirmatory factor analysis and validity test.
Latent VariablesObserved VariableParametric SignificanceStandard LoadingsReliability of ItemsComposite ReliabilityAverage Variance Extracted
UnstdSEt-ValuepStdSMCCRAVE
IFIF11.000 0.7310.5340.8130.592
IF21.1500.07814.702***0.8020.643
IF31.1820.08314.300***0.7730.598
RERE21.000 0.7420.5510.8450.523
RE30.9710.07313.330***0.7050.497
RE40.9850.06814.421***0.7680.590
RE51.0860.07614.275***0.7590.576
RE60.9660.08111.972***0.6320.399
ENEN11.000 0.6810.4640.7960.568
EN20.9470.07612.435***0.7150.511
EN31.1760.08613.614***0.8530.728
SASA11.000 0.8190.6710.8700.690
SA21.0540.05319.873***0.8610.741
SA31.0530.05718.497***0.8110.658
PAPA11.000 0.8330.6940.6600.493
PA21.0890.06716.320***0.8860.785
Note: *** p < 0.001.
Table 6. Discriminant validity test.
IFENRESAPA
IF[0.769]
EN0.670[0.754]
RE0.1090.073[0.723]
SA0.7470.6640.056[0.831]
PA0.5340.4750.0400.715[0.702]
Note: AVE: average variance extracted; values in italics indicate the square root of AVEs.
Table 7. Standardized regression weights of the structural equation model.
Hypothesized PathStandardized CoefficientspAccept/Reject
IF--->RE0.109 *0.057Accept
IF--->EN0.670 ***0.082Accept
IF--->SA0.551 ***0.089Accept
RE--->SA−0.0260.052Reject
EN--->SA0.297 ***0.071Accept
SA--->PA0.715 ***0.054Accept
Note: *** p < 0.001; * p < 0.05.
Table 8. Results of model fit analysis.
IndicatorsRMSEAGFICFICMIN/DF
Recommended values<0.080>0.900>0.900<5
Actual value0.0710.9120.9383.126
Publisher’s Note: MDPI stays neutral with regard to jurisdictional claims in published maps and institutional affiliations.

