Article

The Biological Origins of Soil Organic Matter in Different Land-Uses in the Highlands of Ethiopia

1
Department of Natural Resources Management, Bahir Dar University, Bahir Dar P.O. Box 5501, Ethiopia
2
Department of Forest and Soil Sciences, Institute of Forest Ecology, University of Natural Resources and Life Sciences, Vienna (BOKU), Peter Jordan-Straße 82, 1190 Vienna, Austria
3
Department of Forest and Soil Sciences, Institute of Soil Research, University of Natural Resources and Life Sciences, Vienna (BOKU), Peter Jordan-Straße 82, 1190 Vienna, Austria
4
Department of Landscape Carbon Deposition, Global Change Research Institute, Academy of Sciences of the Czech Republic, Na Sádkách 7, 370 05 Ceske Budejovice, Czech Republic
*
Author to whom correspondence should be addressed.
Forests 2022, 13(4), 560; https://doi.org/10.3390/f13040560
Submission received: 23 February 2022 / Revised: 17 March 2022 / Accepted: 27 March 2022 / Published: 31 March 2022
(This article belongs to the Special Issue Soil Biology and Biochemistry of Forests)

Abstract

:
In the Ethiopian highlands, clearance of Afromontane dry forest and conversion to crop and grazing land lead to land degradation and loss of soil organic matter (SOM). Eucalyptus is often grown on degraded soils, and this results in the partial recovery of soil carbon stocks. The aim of this work was to assess the biological sources of SOM in this land-use sequence. In top-soils (0–10 cm) of four land-use systems, namely remnant natural forest, eucalyptus plantation, cropland, and grazing land, in the Ethiopian highlands, the origin of SOM was investigated. For this, a sequential extraction method was used, involving a solvent extraction, base hydrolysis, and a subsequent CuO oxidation. In these extracts, biomarkers (molecular proxies) were identified to characterize the SOM of the soil of the four land-uses. Putative lipid monomers of leaf, root, and microbial degradation products suggest that root inputs and microbial inputs dominate in SOM of all the land-uses, except grazing land. The ratios of syringyls, vanillyls, and cinnamyls showed that non-woody angiosperm plants were the predominant source for lignin in eucalyptus, cropland, and grazing land soil. In the soils of the natural forest, lignin originates from both woody angiosperms and woody gymnosperms. Our study shows the importance of root and microbial inputs in the formation of SOM, but also that, in the natural forest, legacies of previous forest cover are present.

1. Introduction

A heavy seasonal rainfall, combined with a topography of steep slopes, causes the extensive topsoil erosion of agricultural soils worldwide [1], including in the Ethiopian highlands [2]. The mean annual precipitation in the central highlands of Ethiopia is ca. 1600 mm, but, in exceptional years, it can be up to 2000 mm; most of the annual precipitation occurs within the months June to September [3]. Topsoil erosion is exacerbated by land-use change, as much of the highlands has been converted from natural forest to crop or grazing land. As a consequence, land degradation is an ongoing process in the Ethiopian highlands [4,5].
Natural forests and woodlands cover ca. 9.5% of the Amhara region, and about 60% of the total area is used as cropland and grazing land [6,7]. The Afromontane dry forest type is characterized by a high tree species diversity mostly of angiosperm genera, with a few gymnosperms, such as Podocarpus sp. Thunb. and Juniperus sp. (Hochst) ex. Endl. [8]. These forests are almost exclusively confined to sacred groves associated with a church (“church forests”) and are thus semi-protected [9]. Eucalyptus is the dominant exotic species planted in the highland areas because of its fast growth [10], non-palatability to livestock, multiple uses, and high economic return. Tree-less croplands are cultivated with ploughs for growing grain crops. Grazing lands are used as common lands for herding and are often severely degraded.
The conversion of natural forest to agricultural land-use types results in considerable losses of soil organic matter (SOM) [5,11]. For a number of sites in the Ethiopian highlands, Assefa et al. [5] could show losses of about 75% of the SOM stocks of natural forests after conversion to croplands. In this study, the loss of SOM stocks was principally due to a loss of the SOM-rich surface soil layers. The loss of SOM was from both labile and recalcitrant SOM pools [12]. Moreover, in the Ethiopian highlands, Solomon et al. [11] found SOM losses of 55 to 63%, mainly in labile SOM fractions, but also in stable SOM fractions associated with silt. To counter soil degradation, degraded soils are planted with Eucalyptus. Thirty years after afforestation with Eucalyptus, SOM stocks recovered to nearly 70% of the SOM stocks determined in the natural forest [5]. The loss of SOM also affects other chemical and physical properties of soils, such as soil particle density and soil porosity [13], as well as aggregate stability and soil quality [14].
Soil organic matter is a complex mixture of decomposed residues from plant, animal, and microbial origin [15]. Biomarkers, also known as molecular proxies, are molecules that can be attributed to a particular biological material [16,17,18,19]. Previous studies have used biomarkers to show the relative contribution of leaf or needle inputs to root inputs to SOM [20], microbial contributions to SOM [21,22,23,24], and also sources of lignin in SOM [25].
Sequential biomarker extraction with the application of chromatographic and spectrometric techniques is one of the most commonly used approaches to detect and quantify the concentration of specific biomarkers [23,26,27]. The sequential biomarker extraction techniques include organic solvent extraction and chemolytic methods, such as base hydrolysis and CuO oxidation [28,29]. Extraction with organic solvents isolates unbound (free) lipids, such as n-alkanes, n-alkanols, n-alkanoic acids, steroids, hopanoids, and other terpenoids [16,23,28]. Solvent extraction thus provides a general overview of biomarkers from plant and microbial sources [30,31]. Ester-bound soil lipids are not extractable with organic solvents, but they can be cleaved from SOM by using chemolytic methods, such as base hydrolysis [26,29]. The products of base hydrolysis have been used to trace root or leaf origin inputs based on suberin- and cutin-derived markers, respectively [18,32]. Extraction with CuO oxidation isolates ether bonds to release mainly lignin-derived phenols and other aromatic compounds [33]. Typically, the lignin-derived phenols (vanillyl, syringyl, and cinnamyl) are used to provide information about whether lignin is derived from angiosperm vs. gymnosperm sources, or woody vs. non-woody tissues [31,34]. Whereas gymnosperm wood contains a definite advantage of vanillyl derivatives (vanillin, acetovanillone, and vanillic acid), angiosperm wood is composed of approximately equal quantities of vanillyls and syringyls (syringaldehyde, acetosyringone, and syringic acid) [32,34]. The ratios of syringyls to vanillyls (S/V) and cinnamyl to vanillyl (C/V) monomers from lignin are widely used to differentiate the relative contributions of major plant taxonomic groups (gymnosperms vs. angiosperms) and tissue type (woody vs. non-woody tissue) [25,34]. The S/V ratio of gymnosperm wood is 0, whereas that of angiosperm wood is >1 [34]. Similarly, a higher C/V than 0 indicates the presence of non-woody tissues as cinnamyl monomers (p-coumaric acid, ferulic acid) is abundant in most herbaceous and “soft” tissues (i.e., leaves, grasses, and needles), but absent in wood [34]. The relative contribution of woody to non-woody angiosperms can also be estimated by using the V:S:C ratio. The ratios of those compounds in lignins are plant- and organ-specific non-woody angiosperms tissues (herbs); however, they hold approximately a 1:1:1 V:S:C ratio [25]. To further improve the detection of lignin sources, the lignin phenol vegetation index (LPVI) was developed [25,35]. The LPVI demarcates ranges for angiosperm and gymnosperm tissues. The wood of gymnosperms has an LPVI of <1, whereas wood of angiosperms is between 67 and 415. Non-woody gymnosperm tissues, such as needles, have an LPVI of 3–27, and non-woody angiosperms tissues, such as the leaves of trees and herbaceous plants, as well as grasses, have a value of 176–2782. Thus, these ratios have a wide and often overlapping range, but are sufficiently distinct to enable the tracing of sources of lignin [25].
Deforestation for agricultural land expansion and extensive land degradation is a major environmental threat in NW Ethiopia [1,2]. In previous work, for a range of sites, we could show severe loss of SOC after deforestation, but also a recovery of SOC after replanting with eucalyptus [5]. In the work presented in this paper, we have focused on one of these sites, Gelawdios, holding the typical land-use change sequence of conversion of natural forest to cropland or grazing land, and then afforestation with eucalyptus after the soils have degraded through agricultural use. Using biomarkers from a sequential extraction, we compare the land-use types to gain an insight into biological sources of SOM in the different systems and potential legacies. We investigated (1) the importance of fine root inputs for formation of SOM, (2) the contribution of microbial inputs to SOM, and (3) the occurrence of legacies of the past forest cover.

2. Materials and Methods
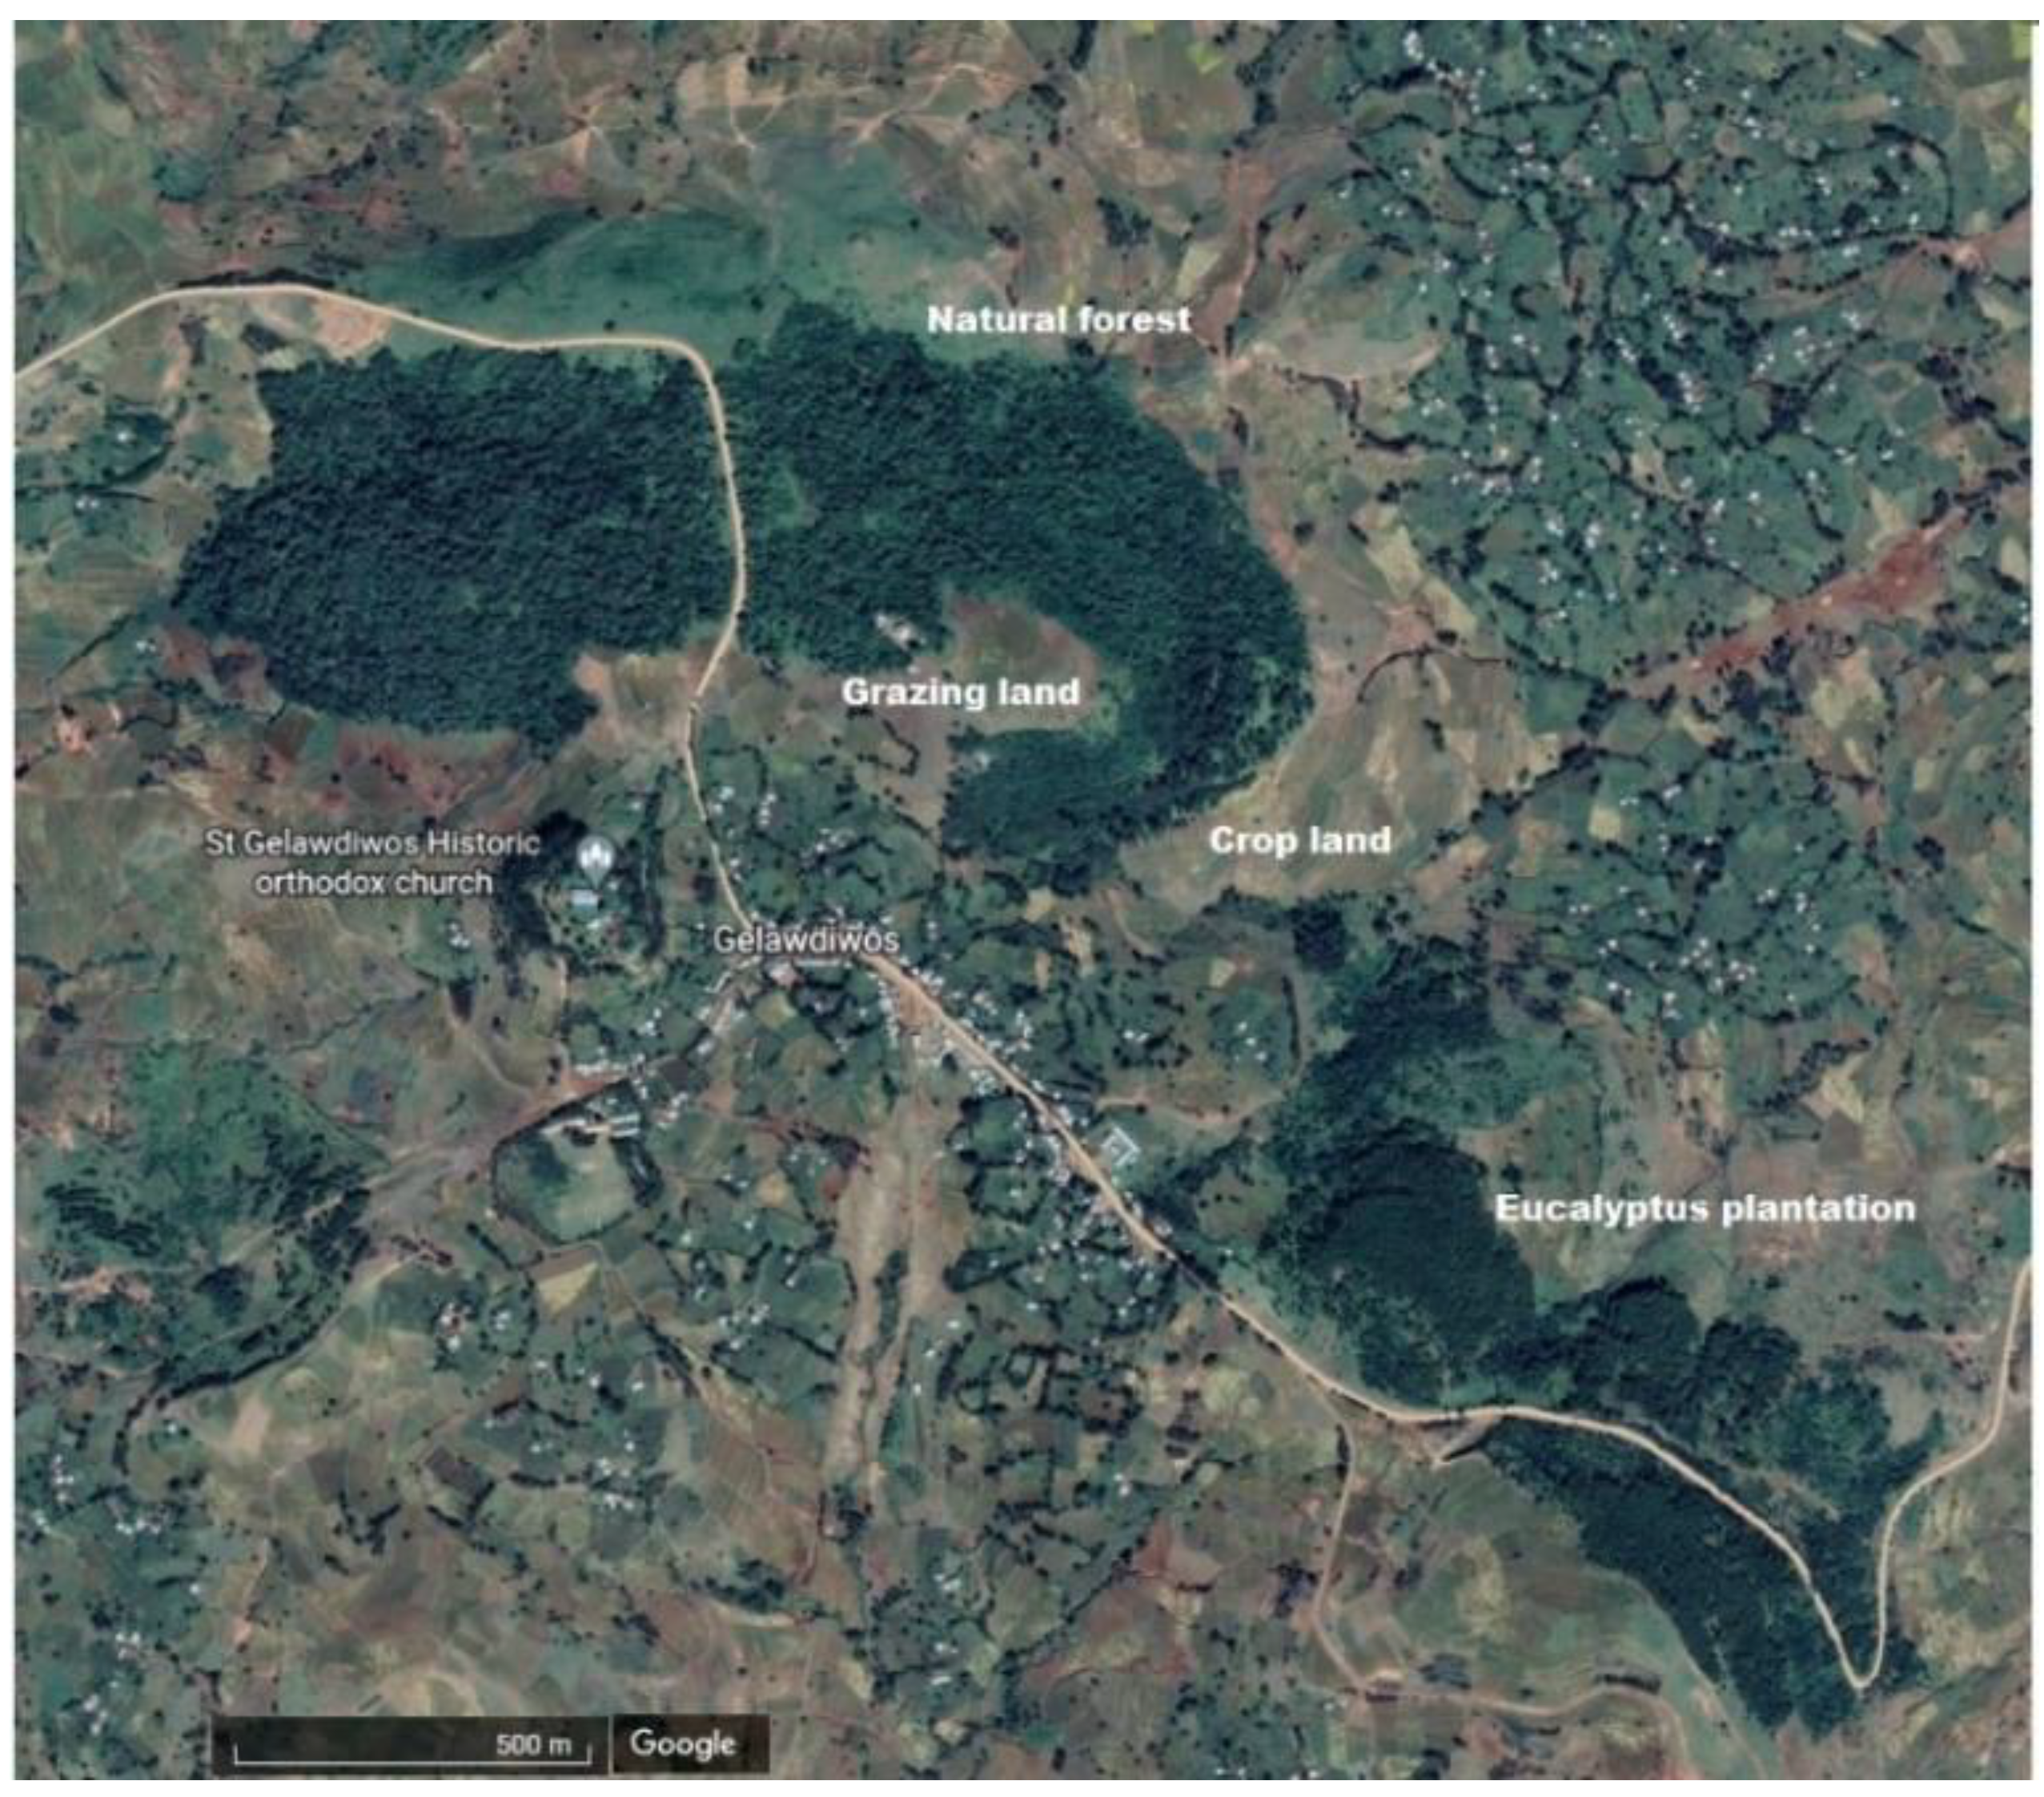
2.1. Study Area

The study area is located at an elevation of 2500 m above sea level in an undulating landscape typical for the Ethiopian highlands. The climate is temperate with a dry winter and a warm, wet summer, and is classified as Cwb according to the Köppen–Geiger climate classification [36]. The mean annual rainfall at Gelawdios is 1220 mm, with a unimodal rainy season, and the average annual temperature is 19 °C [8]. The site and the land-use systems chosen represent the typical land-use sequence dominating large parts of the highlands. Natural forest is converted into grassland or cropland, and due to the heavy rainfall in the rainy season and the land topography, the soils erode and become degraded. In an attempt to utilize the degraded soils, large areas are planted with eucalyptus.
The soils at different land-uses are Cambisols [37], but with different degrees of soil degradation [12]. The soils have a clay-to-silty-clay texture [12,38], with less than 10% sand, except for the grazing land, which has 24% sand and less clay [38]. The pH of the soils is similar for all land-uses and is between 6.0 and 6.2 in water and between 5.0 and 5.8 in 0.01 M CaCl2 [12,38]. The water-holding capacity of the soils decreases in the order natural forest > eucalyptus > cropland = grazing land [38].
The study was carried out by using four adjacent land-use systems (natural forest, eucalyptus plantation, cropland, and grazing land) at Gelawdios, Amhara, Northwestern Ethiopia (11°38′25″ N and 37°48′55″ E) (Appendix A Figure A1).
The natural forest is an Afromontane dry forest with a high diversity of indigenous tree species. The Gelawdios forest holds approximately 41 tree species, and the dominant woody species are (sorted by greater basal area first) Chionanthus mildbraedii (Gilg & G. Schallenb.), Euphorbia abyssinica J.F.Gmel, Apodytes dimidiate E.MEY ex ARN, Schefflera abyssinica (Hochst. ex A.Rich.) Harms, Ekebergia capensis Sparrm., Albizia schimperiana Oliv., Calpurnia aurea (Aiton) Benth., Combretum molle R.Br. ex G.Don and Croton macrostachyus Hochst., all of which are angiosperms. The only woody gymnosperms occurring in the forest is Podocarpus falcatus (Thunb.) C.N.Page, which occurs in clumps and makes up only a small percentage of the basal area. Juniperus procera (Hochst) ex. Endl occurs rarely and is mainly restricted to areas around the Gelawdios church, which is now outside the main forest area. The Gelawdios forest has a density of approximately 6300 trees per hectare above a diameter at breast height (dbh) of 5 cm [5]. Due to the high tree density, undergrowth of grasses and herbs in the forest is minor. Trees cannot be cut in the forest, but the collection of dead wood is allowed.
The eucalyptus (Eucalyptus globulus Labill.) stand was established on formerly common grazing land in 1985 and was consecutively thinned to its current density of about 3000 trees per hectare [5]. The understory is dominated by grasses and indigenous shrub species. Trees and deadwood are cut and removed from the forest; leaves are also collected and removed.
The adjacent grazing land and cropland were converted from natural forest approximately in the early 1970s (the exact date is not known). The grazing land is used as communal grazing lands for herds of animals and it consists of highly degraded, nearly bare ground. Across the grazing land, there are sporadic trees present, mainly Croton macrostachyus. The cropland is tree-less, and it is usually cultivated by using an animal-drawn wooden plough to a depth of ca. 15 cm. After harvest, the crop residues are either removed for animal feeding, or the animals are allowed to graze the stubble. The principal crops are “teff” (Eragrostis tef (Zucc.) Trotter), wheat (Triticum aestivum L.), barley (Hordeum vulgare L.), maize (Zea mays L.), and sorghum (Sorghum bicolor (L.) Moench).

2.2. Soil Sampling, C and N Analysis

Soil samples were collected at the end of the wet season in September 2015 from all land-use types. Soil samples were taken from the top 10 cm of the soils from the natural forest, eucalyptus plantation, cropland, and grazing land. The samples were taken at 10 sampling points marked at 50–100 m distance along a transect line. At each sampling point, one sample was taken from the depth of 0–10 cm with a soil corer (6.8 cm in diameter) after removing the litter layer (if present). The samples were air-dried within one week of sampling, and the soil samples were sieved (2 mm) and packed separately in plastic bags. The samples were transported in October 2015 to Vienna for laboratory analysis. In Vienna, sub-samples of soils weighing approximately 3–5 g from each sample were dried at 105 °C for 48 h. From each sample, about 200 mg of soil was taken, and total C and N concentrations were determined on a CN elemental analyzer (Truspec CNS, LECO, St. Joseph, MO, USA).

2.3. Sequential Chemical Extraction

Sequential chemical extractions (solvent extraction, base hydrolysis, and CuO oxidation) were conducted on soil samples to determine total solvent extracts, bound lipids, and lignin-derived phenols, respectively [32,39]. From the 10 soil samples taken along each transect, equal weights of three, three, and four samples were mixed to give three combined samples for further analysis.
Solvent extraction: The three soil samples (20 g) from each land-use type were first sonicated twice for 15 min, each time with 30 mL double deionized water (DDW) to remove the water-soluble polar compounds. The water-extracted soil residues (~20 g) were then freeze-dried and extracted with organic solvents as follows: samples were sonicated for 15 min with 50 mL of methanol, dichloromethane:methanol (DCM-MeOH; 1:1; v/v), and DCM, sequentially. The combined solvent extracts were passed through glass-fiber filters (Whatman GF/A) into a round-bottom flask, concentrated by rotary evaporation, and then completely dried under nitrogen gas (N2) in 2 mL glass vials. The remaining soil samples (non-extractable materials) were air-dried for further analysis.
Base hydrolysis: The air-dried soil residues from solvent extraction were then subject to base hydrolysis to yield ester-linked lipids [26]. Briefly, the residues after solvent extraction were heated at 100 °C for 3 h in Teflon-lined bombs with 20 mL of 1 M methanolic KOH. After cooling, the extracts were acidified to pH 1 with 6 M HCl and filtered through pre-extracted cellulose filters (Fisher P5, 5–10 µm). Again, the soil residues were extracted twice by sonication for 15 min with 30 mL DCM-MeOH (1:1; v/v), as described above. The two extracts were combined and then filtered through glass-fiber filters (Whatman GF/A) into round bottom flasks. DDW (50 mL) was added to each extract. Lipids were recovered from the water phase by liquid–liquid extraction in a separation funnel with 50 mL of diethyl ether. Anhydrous Na2SO4 was added to the combined ether phases to remove any water. The ether extracts were concentrated by rotary evaporation, transferred to 2 mL glass vials, and dried under N2 gas. The remaining soil samples were air-dried for further analysis.
CuO oxidation: This involved the extraction by CuO oxidation, followed the method of Otto et al. [17]. In brief, the base hydrolysis residues were air-dried and further oxidized with CuO to release lignin-derived phenols. Soil residues (~10 g) were extracted with 1 g CuO, 100 mg ammonium iron (II) sulfate hexahydrate [Fe(NH4)2(SO4)2·6H2O], and 15 mL of 2 M NaOH in Teflon-lined bombs at 170 °C for 2.5 h. After heating, the bombs were cooled under running water; the liquids were decanted into Teflon centrifuge tubes (50 mL); and the residues were washed twice each with 10 mL deionized water, using a magnetic stirrer for 10 min. The combined washings and extracts were centrifuged for 30 min at 1050× g force (Heraeus Megafuge 1.0, Hanau, Germany). The supernatant was decanted into another Teflon centrifuge tube, acidified to pH 1 with 6 M HCl, and kept for 1 h at room temperature in the dark to prevent reactions of cinnamic acids. After centrifugation (at 1050× g force for 30 min), the supernatant was transferred to a separation funnel and liquid–liquid extracted twice with 50 mL diethyl ether. The ether extracts were concentrated by rotary evaporation, transferred to 2 mL glass vials, and dried under N2 gas. During sample preparation, one replicate was lost; thus, n = 2.

2.4. Derivatization and GC/MS Analysis

Derivatization was conducted according to References [26,32]. In brief, the extracts were re-dissolved, and aliquots (containing ~1 mg extracts) were derivatized for GC/MS analysis. Solvent extracts and CuO oxidation products were each re-dissolved in 500 μL DCM-MeOH (1:1; v/v). Aliquots of the extracts (100 μL) were dried under a stream of N2 and then converted to trimethylsilyl (TMS) derivatives by 90 μL N,O-bis-(trimethylsilyl)trifluoroacetamide (BSTFA) and 10 μL pyridine for 3 h at 70 °C. After cooling, 100 μL hexane was added to dilute the extracts. The base hydrolysis products were first methylated by reacting with 600 μL of diazomethane in ether at 37 °C for 1 h, evaporated to dryness under N2, and then silylated with BSTFA and pyridine as described above. Oleic acid (C18:1 alkanoic acid), tetracosane, and ergosterol were derivatized and used as external standards for solvent extracts. Oleic acid methyl ester and vanillic acid were used as external standards for base hydrolysis and CuO oxidation products, respectively. To ensure a linear response, standards ranging from 10 to 1000 ppm were analyzed by using the same procedure as the extracts. GC/MS analysis was performed on an Agilent model 6890N GC coupled to a Hewlett-Packard model 5975 quadrupole mass selective detector. Separation was achieved on an HP5-MS fused silica capillary column (30 m × 0.25 mm internal diameter, 0.25 μm film thickness). The GC operating condition: The temperature was held at 65 °C for 2 min and then increased from 65 to 300 °C at a rate of 6 °C min−1 with a final isothermal hold at 300 °C for 20 min. Helium was used as the carrier gas. The samples were injected with a 2:1 split ratio, and the injector temperature was set at 280 °C. The sample (1 μL) was injected with an Agilent 7683B autosampler. The mass spectrometer was operated in the electron impact mode (EI) at 70 eV ionization energy and scanned from 50 to 650 Daltons. Data were acquired and processed with the Chemstation G1701FA software.
Individual compounds were identified by comparing the mass spectra with the National Institute of Standards and Technology library (NIST, version 2.0), Wiley MS library data, and standards. Concentrations of individual compounds (Appendix A Figure A1, Figure A2 and Figure A3 and Table A1, Table A2 and Table A3) were calculated by comparing the peak area of the compound to that of the standards and were then normalized to the soil carbon contents [40]; partially, sums of major compound classes were calculated. The biomarker concentrations and total yields are expressed as organic C-normalized in µg g−1 C or mg g−1 C [40].

2.5. Calculated Ratios and Indices

2.5.1. Microbial Biomarkers

To determine the relative contribution of plant and microbial residues in the SOM, in the solvent extracts, the sums of different chain lengths of n-alkanols, n-alkanes, and n-alkanoic acids were used. The plant fraction was estimated from ≥C20, and microbial from <C20. [21,32]. In the base hydrolysis extracts, for the plant fraction, the sums of the long-chain (≥C20) lipids, n-alkanols, n-alkanes, and n-alkanoic acids with even-over-odd preference were used [21,32]. For the microbial fraction, sums of the short-chain alkanes, alkanoic acids and diacids, mid-chain substituted hydroxy alkanoic acids (C16, C18, and C19), branched alkanoic acid (iso-C16), and α-alkanoic acids (C16–C18) were used (<C20) [21,32]. To determine the relative inputs of plant materials to microbial materials, a ratio was calculated (<C20:≥C20).

2.5.2. Suberin and Cutin Monomers

As uncertainty exists about the cutin or suberin origin of a number of compounds [18,28], sums of suberin monomers were calculated by using two methods. Suberin 1 was calculated as the sum of ω-hydroxyalkanoic acids (C20–C30) + α,ω-alkanedioic acids (C20), and suberin 2 as the sum of ω-hydroxyalkanoic acids (C16–C30) + α,ω-alkanedioic acids (C20). Similarly, cutin 1 was calculated as the of C16 mono and dihydroxy acids and diacids, and cutin 2 as the sum of C16 mono and dihydroxy acids and diacids + C18 trihydroxy acids. Suberin 1 and cutin 1 are the sum of monomers that are most likely from suberin or cutin, respectively, whereas suberin 2 and cutin 2 contain monomers of which there is debate about their origin [18,28]. The suberin-to-cutin ratio was calculated by using suberin 1 and cutin 1, and suberin 2 and cutin 2, respectively.

2.5.3. Lignin-Derived Phenols

To determine major plant taxonomic groups (gymnosperms vs. angiosperms) and tissue type (woody vs. non-woody tissue) from lignin-derived phenols, ratios of syringyl to vanillyl (S/V) and cinnamyl to vanillyl (C/V) monomers, as identified in the CuO oxidation extracts, were calculated [34]. For this calculation, the compounds p-coumaric acid and ferulic acid (cinnamyls, C), vanillin/vanillaldehyde, acetovanillone and vanillic acid (vanillyls, V), and syringaldehyde, acetosyringone and syringic acid (syringyls, S) were used [34].
The relative contribution of woody and non-woody angiosperms was estimated by using the vanillyl-to-syringyl-to-cinnamyl (V:S:C) ratio [34].
The lignin phenol vegetation index (LPVI) was calculated based on Reference [35].
LPVI = [{S(S + 1)/(V + 1) + 1} × {C(C + 1)/(V + 1) + 1}]
where V, S, and C are expressed as % of total VSC.

2.6. Statistical Analysis

Values for the compounds shown in the tables and tables in the appendix are means and standard errors (SE; n = 3). Data for selected compounds and summed compound groups were checked for normality (Shapiro–Wilk) and equal variance (Brown–Forsythe). All datasets met the conditions of normality and were analyzed by a parametric one-way ANOVA test, with a post hoc Tukey test. The analysis was carried out by using the program Sigmastat 4.0 (Systat GmbH, Frankfurt, Germany).

3. Results

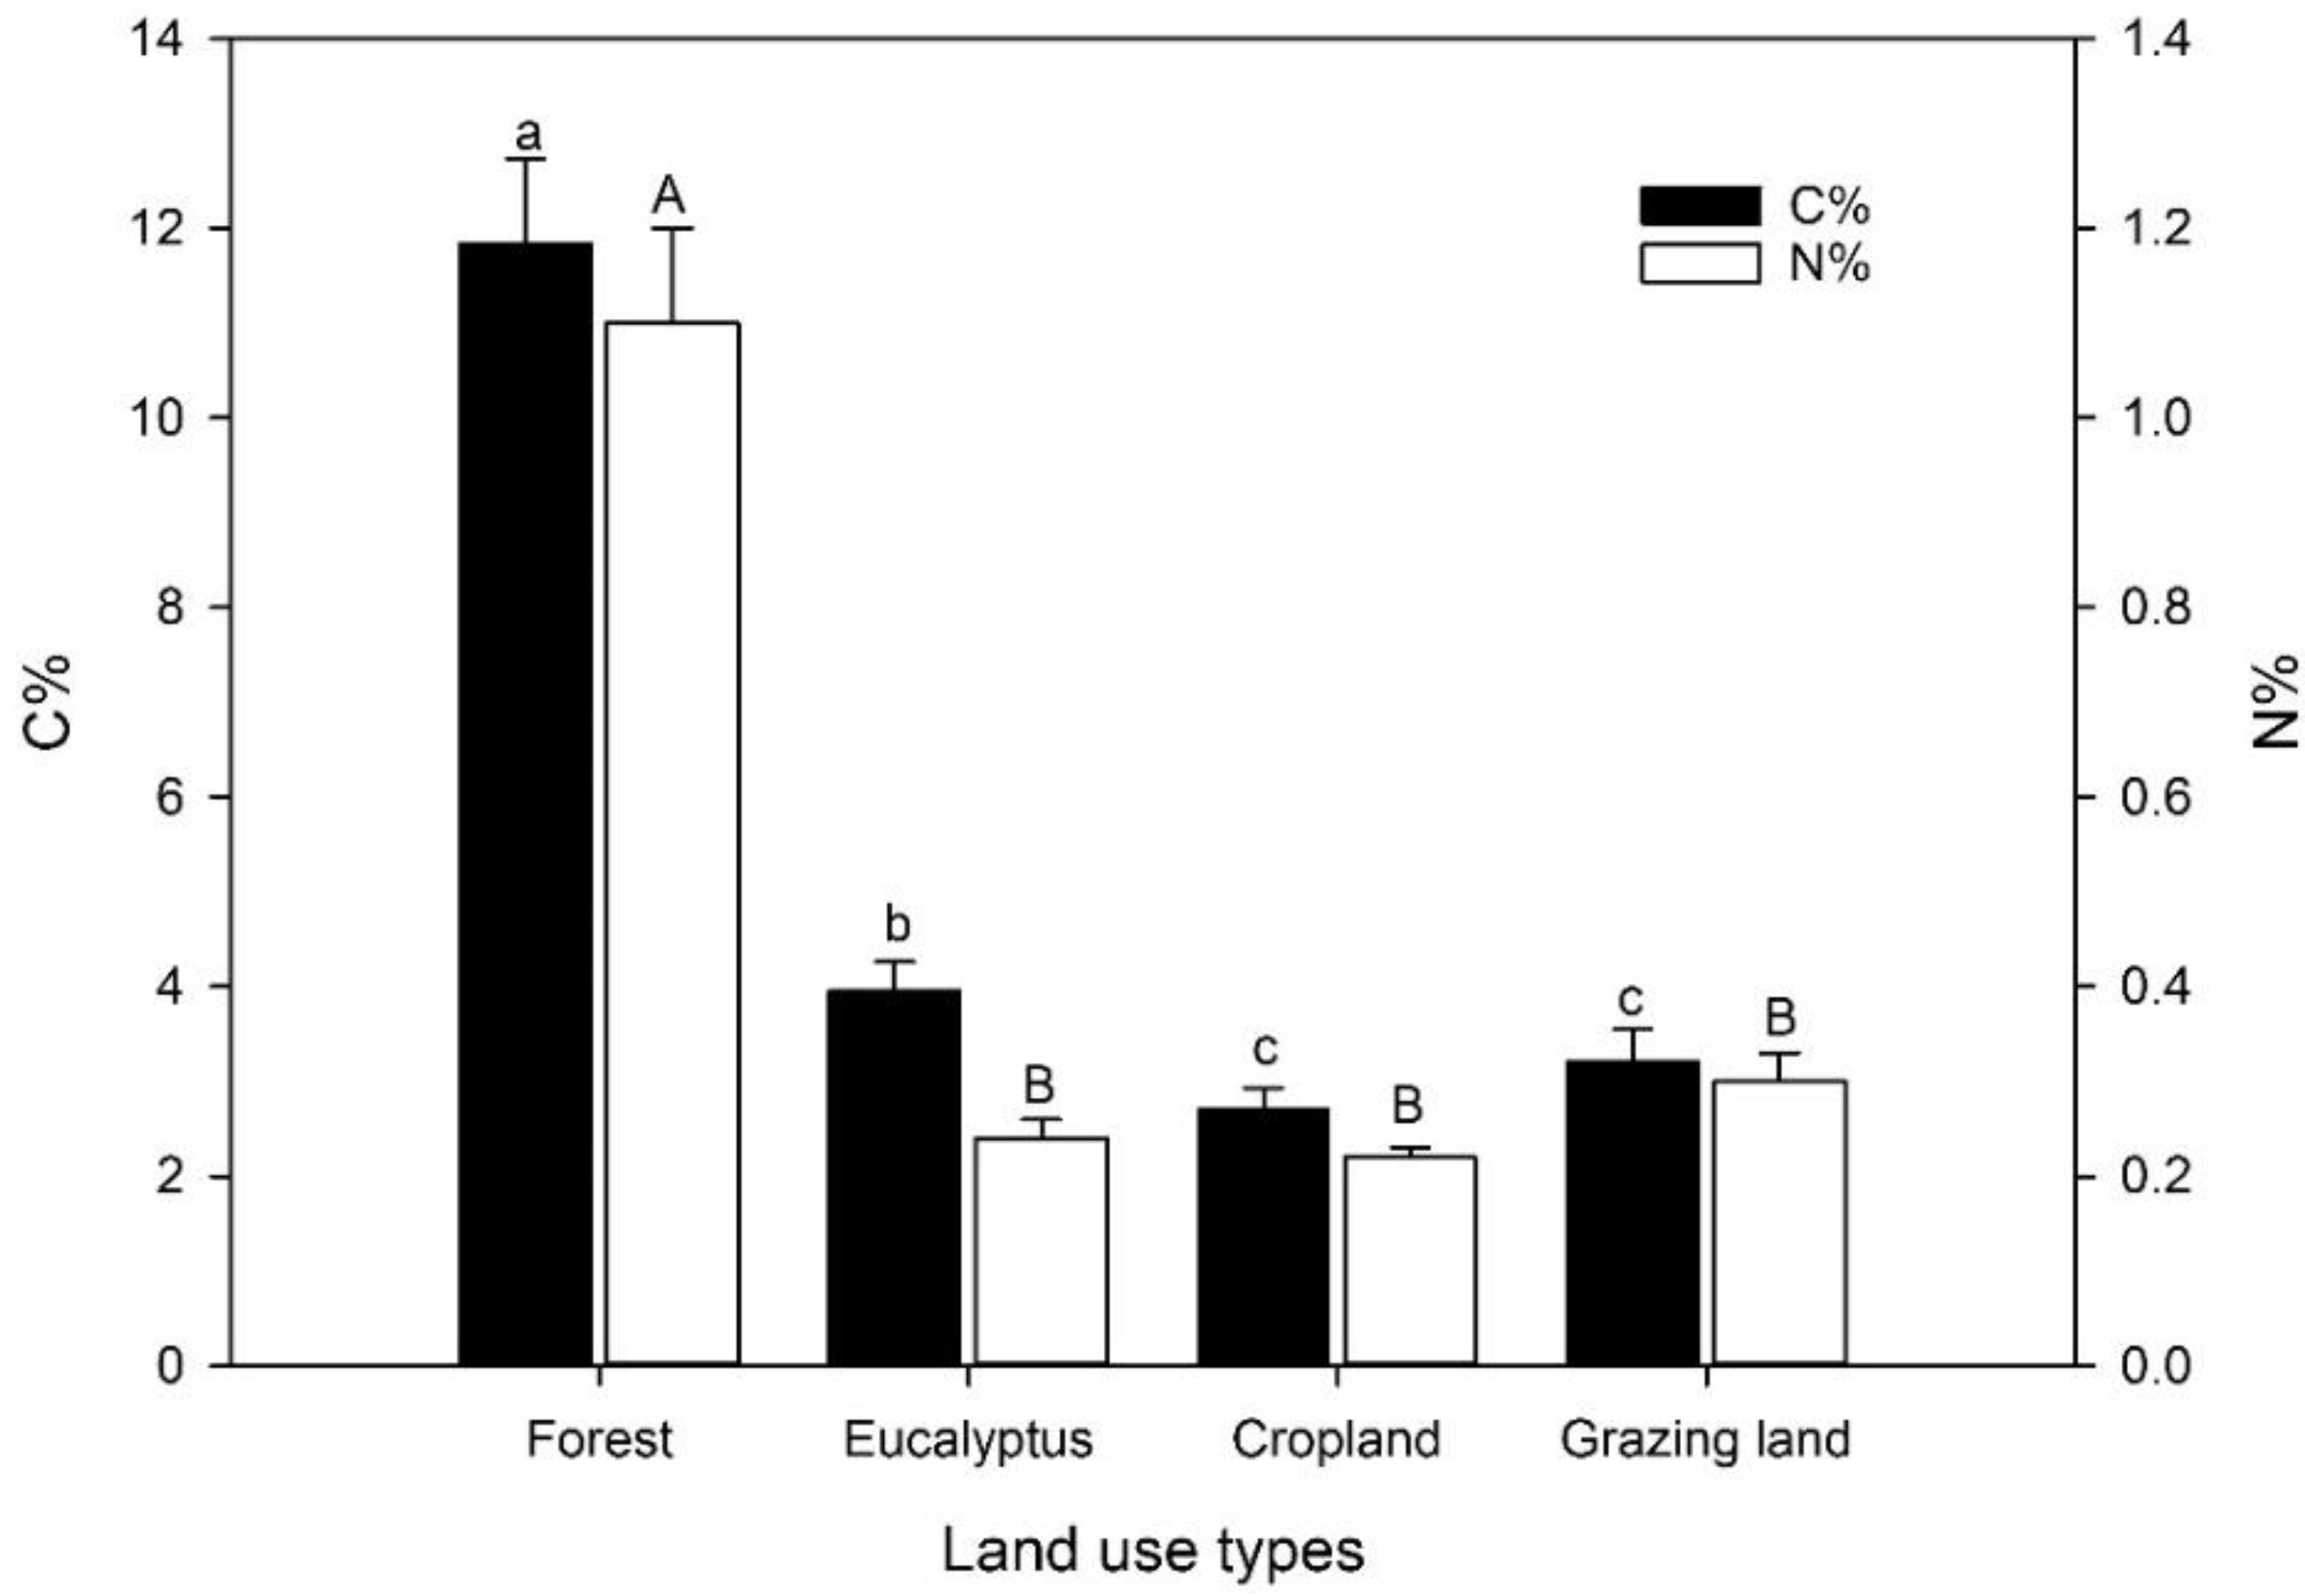
3.1. Soil C and N Content, and Yields of Sequential Extractions

The percentage of carbon in the top 10 cm of the soil of the different land-use types was significantly higher in the natural forest and the eucalyptus plantation when compared to the cropland and grassland (Figure 1). The soil of the natural forest had an approximately 4.4- and 3.7-times greater concentration of C compared to the grassland and the cropland, respectively, and a 3-times greater concentration compared to the eucalyptus plantation. The C concentration of the soil at the eucalyptus stand was only ca. 25% higher than that of the grassland and the cropland. Soil N concentrations followed a trend similar to the C contents.
The normalized yield of identified biomarkers per unit soil C differed between the extraction methods, i.e., the solvent extract, base hydrolysis, and CuO oxidation (Table 1). Among the sequential extraction steps, the highest normalized yield was obtained from the base hydrolysis products. The normalized yields also differed between the soils of the different land-use types within an extraction method. In the solvent extraction, the normalized yield was significantly greater from eucalyptus soil compared to cropland and grazing land soils. The normalized yield of base hydrolysis products was significantly less from the natural forest and eucalyptus soils compared to the grazing land. In contrast, the normalized yield from CuO oxidation did not differ between the soils of the land-use types.

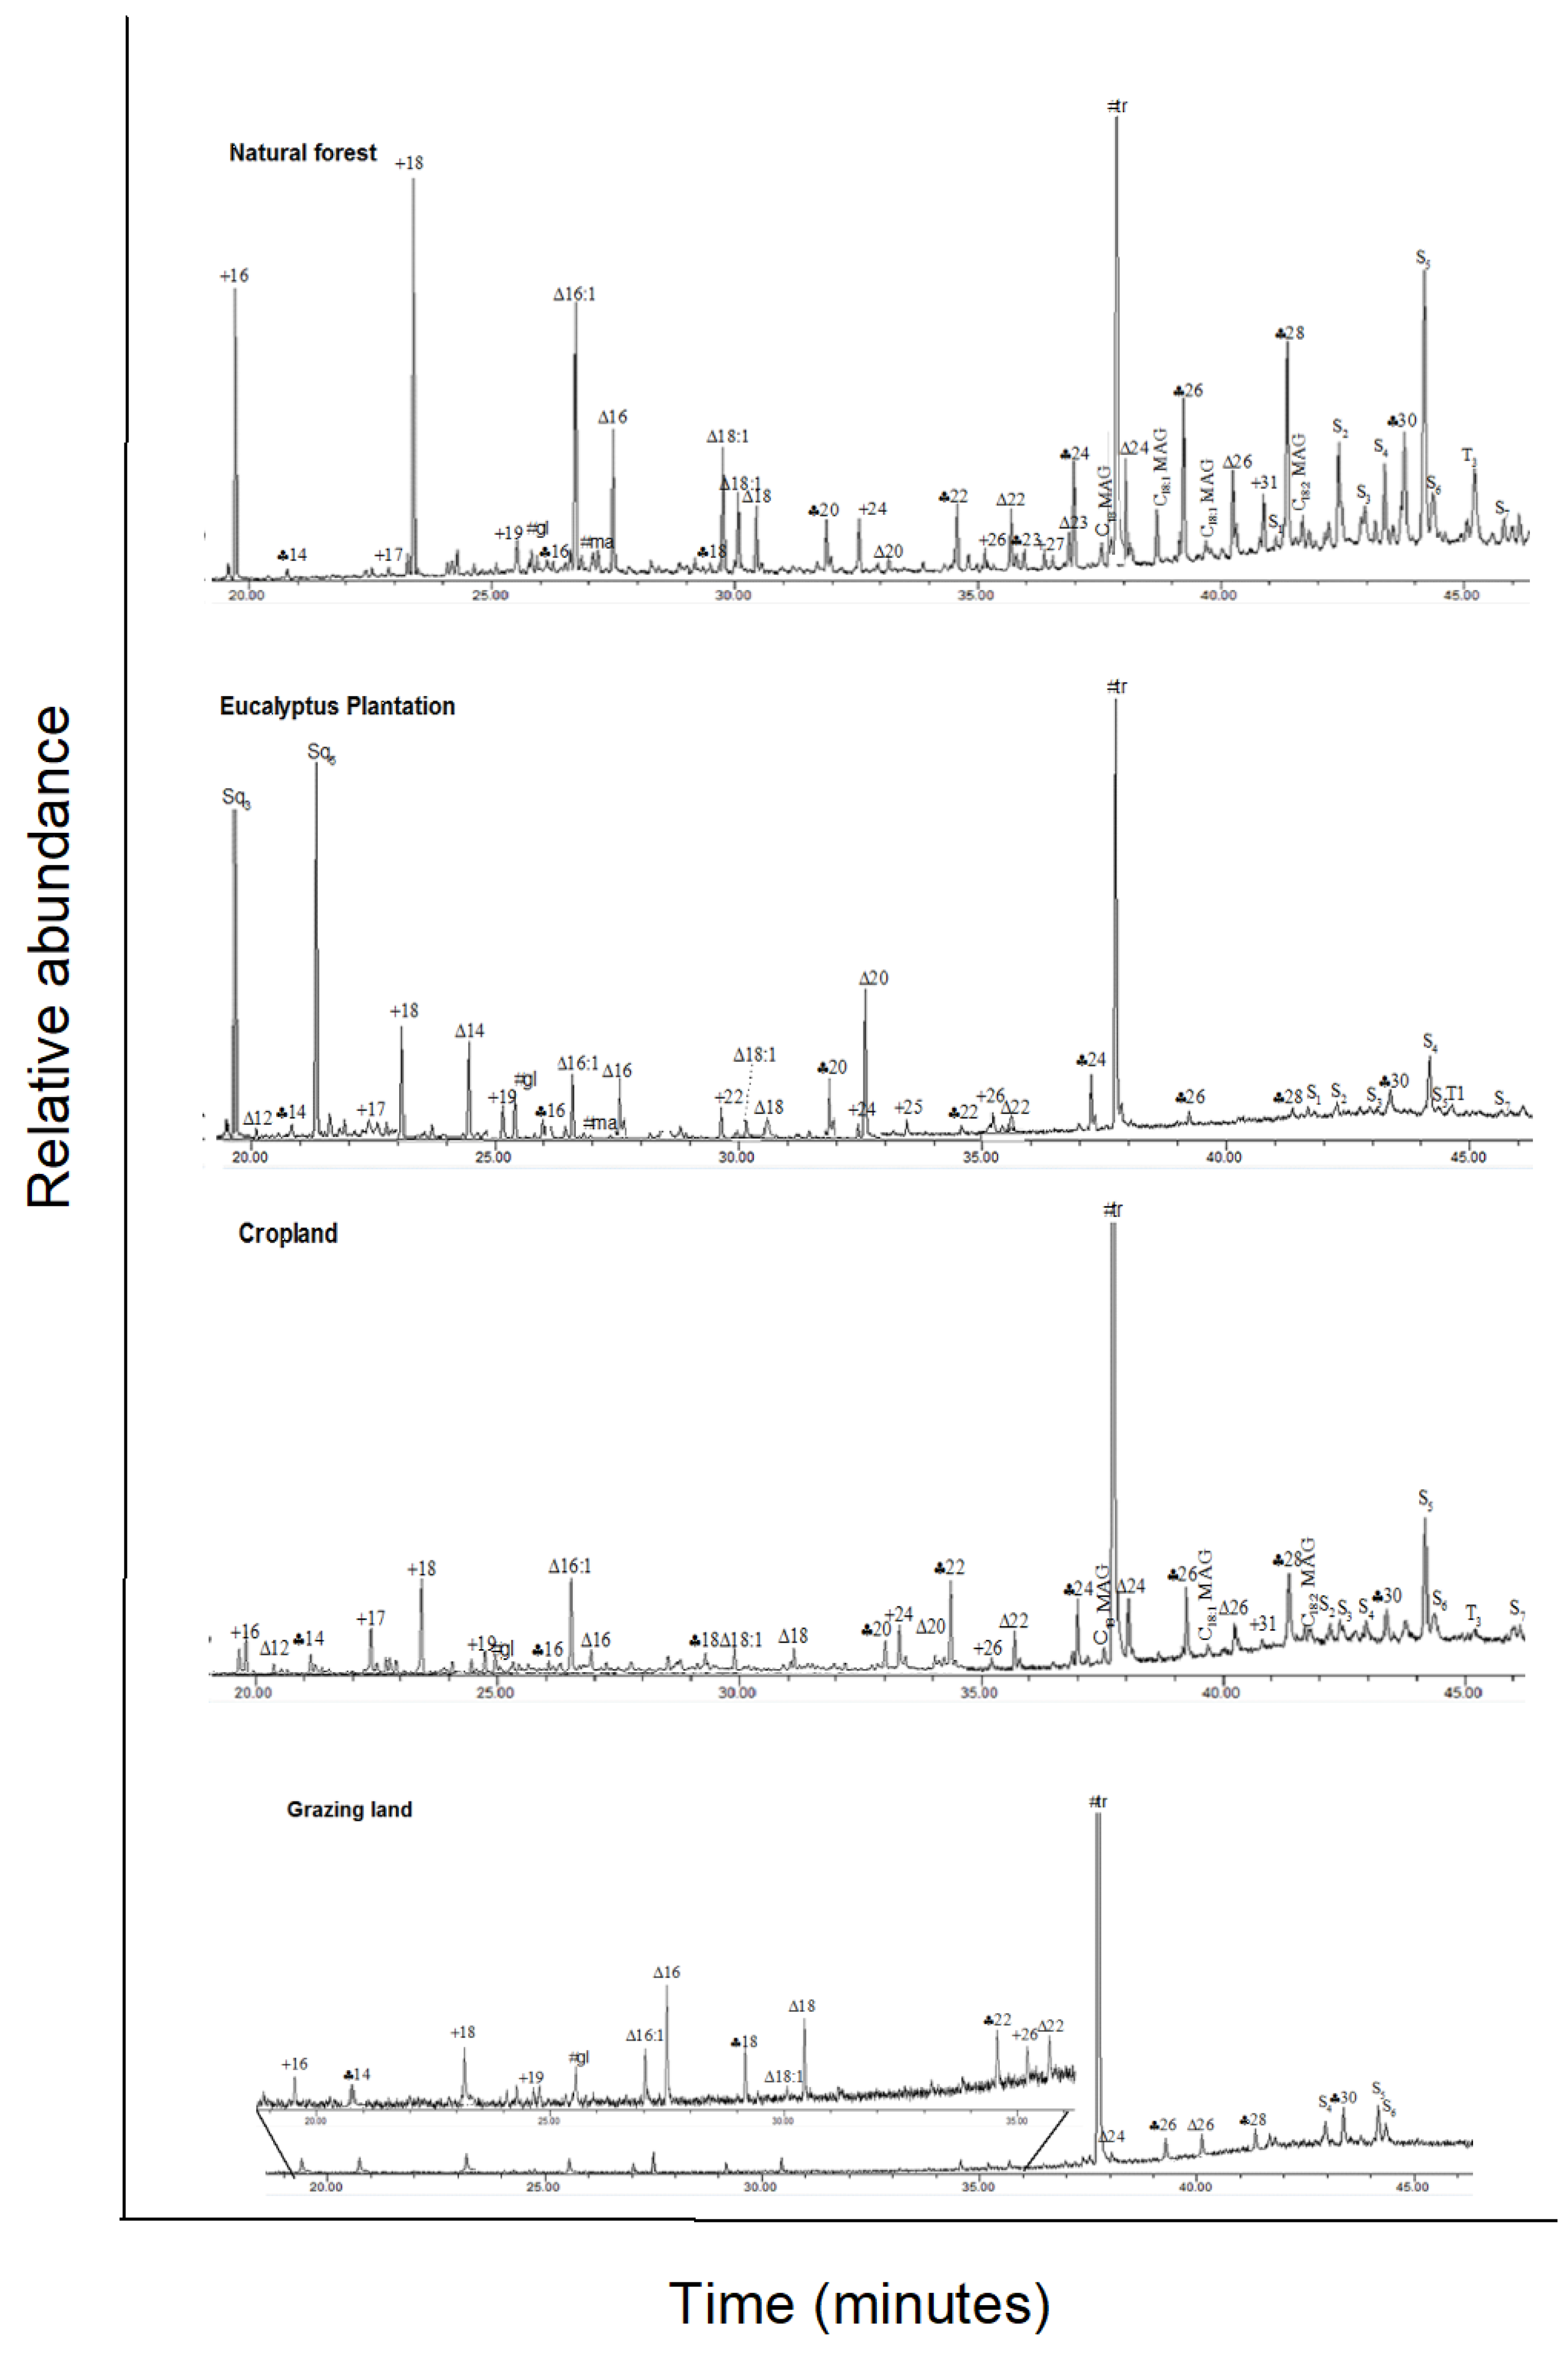
3.2. Solvent-Extractable Compounds

For the solvent-extractable compounds, the GC–MS total ion chromatogram of the major components in the silylated solvent extracts is shown in Appendix A Figure A2, and all individual compounds are listed in Appendix A Table A1. The major chemical compounds detected in the solvent extract include a series of aliphatic lipids (n-alkanols, n-alkanes, and n-alkanoic acids), carbohydrates, monoacylglycerides, steroids, and terpenoids (Table 2). Sugars, followed by aliphatic lipids, were the largest component of the total solvent extract in all land-uses, except eucalyptus. In eucalyptus soil, the concentration of steroids and terpenoids exceeded the concentration of both sugars and total aliphatic lipids.
The concentration of n-alkanols in the range of C20–C30 and n-alkanoic acids in the range of C9–C26 showed a significant even-over-odd dominance of C-chain lengths. Among n-alkanols, only one compound, 1-Tricosanol, had an odd C chain length; among n-alkanoic acids, two compounds, nonanoic acid and tricosanoic acid, had uneven C chain lengths. In contrast, the n-alkanes in the range of C17–C31 had an odd-over-even dominance, principally induced through the concentrations of n-heptadecane and n-heptacosane (Appendix A Table A1). aliphatic lipids were significantly greater in eucalyptus soil compared to the grassland and cropland soils, but not compared to the forest soil (Table 2). The aliphatic lipids with a C chain length less than 20 (<C20) were significantly higher in the eucalyptus soil, but no differences were found for chain lengths of 20 and above (≥C20). In the natural forest soil, the sum of <C20 was significantly less than the sum of ≥C20; the opposite was found in the eucalyptus soil. As a consequence, the <C20:≥C20 ratio in eucalyptus soil was significantly greater than in all other land-use types. For forest soil, this ratio was significantly less compared to cropland soils.
Four sugars (glucose, mannose, sucrose, and trehalose) were identified in the solvent extracts (Appendix A Table A1). Trehalose composed 87% (eucalyptus) to 99% (natural forest) of the total sugars. The sum of all sugar concentrations was significantly greater in the natural forest soil compared to the cropland and grassland; this difference was driven by the concentration of trehalose, which was significantly more abundant in natural forest soil compared to all other land-uses (Appendix A Table A1). The solvent extracts also included four monoacylglycerides, three of them being C21 compounds.
Steroids and terpenoids were ca. 5-times more abundant in eucalyptus soil compared to the other land-uses (Appendix A Table A2). The eucalyptus soil contained higher amounts of a number of specific steroids and terpenoids (Appendix A Table A1). Sesquiterpenes of trans-farnesol and globulol combined contributed 38% of total steroids; other sesquiterpenes detected included aromadendrene, γ-elemene, and ledol. These sesquiterpenes were found in minor amounts in the cropland soil, but not in the other land-uses. The eucalyptus soil also had high concentrations of triterpenoids, erythrodiol, and oleanolic acid. Ergosterol was only found in the forest and eucalyptus soil. The detected phytosterols included campesterol, stigmasterol, β-sitosterol, and sitosterone; these compounds contributed over 81–96% of total steroids in the forest, cropland, and grazing land, but only 19% in eucalyptus soil (Appendix A Table A1).

3.3. Base Hydrolysis Extractable Compounds

The major products identified after base hydrolysis included a series of aliphatic lipids (n-alkanols, n-alkanoic acids, mid-chain substituted and branched acids, ω-hydroxyalkanoic acids, α-hydroxyalkanoic acids, α,ω-alkanedioic acids, and glycerides), with a lesser contribution from benzyls and phenols (Table 3), and one steroid (Appendix A Table A2). The compounds that were identified following base hydrolysis are listed in Appendix A Table A2, and examples of the GC–MS chromatograms are shown in Appendix A Figure A3. Aliphatic lipids showed a similar pattern and represented more than 60% of the total base extracts; n-alkanoic acids in the range of C14–C30 were the dominant fraction. The n-alkanoic acids with a chain length less than 20 (<C20) greatly exceeded the sum of the n-alkanoic acids with a chain length greater than 20 (≥C20) by a factor of 8–15 (Table 3). For both chain-length classes, there was a strong even-over-odd preference (Appendix A Table A2). The α,ω-alkanedioic acids, mid-chain substituted hydroxyalkanoic acids, α-alkanoic acids, ω-alkanoic acids, and glycerides were detected in the soils of each land-use in similar concentrations. Branched alkanoic acids (iso-C16) were not detected in grazing land soil (Table 3), but they were in the soils of the other land-uses. Base hydrolysis also cleaved monoacylglycerides (C19) in minor concentrations (238–487 µg g−1 C) in all land-use types besides grazing land. One organophosphate of C19 was also detected in soil of all land-uses, with significantly greater concentrations detected in cropland and grazing land soils. Benzyls and phenols ranged from 0.4 to 2.3 mg g−1 C (Table 3).
The concentration of the putative suberin monomers (Table 4), suberin 1 or suberin 2, was significantly lower in the natural forest compared to the eucalyptus and cropland soils, but not the grazing land where values were (significantly) lower. For the sum of putative cutin monomers calculated as cutin 1 and cutin 2, there was no significant difference between land-uses. Both suberin/cutin ratios were similar in soils of all land-uses, indicating an excess of suberin, except for grazing land; however, there were no significant differences between the land-uses.

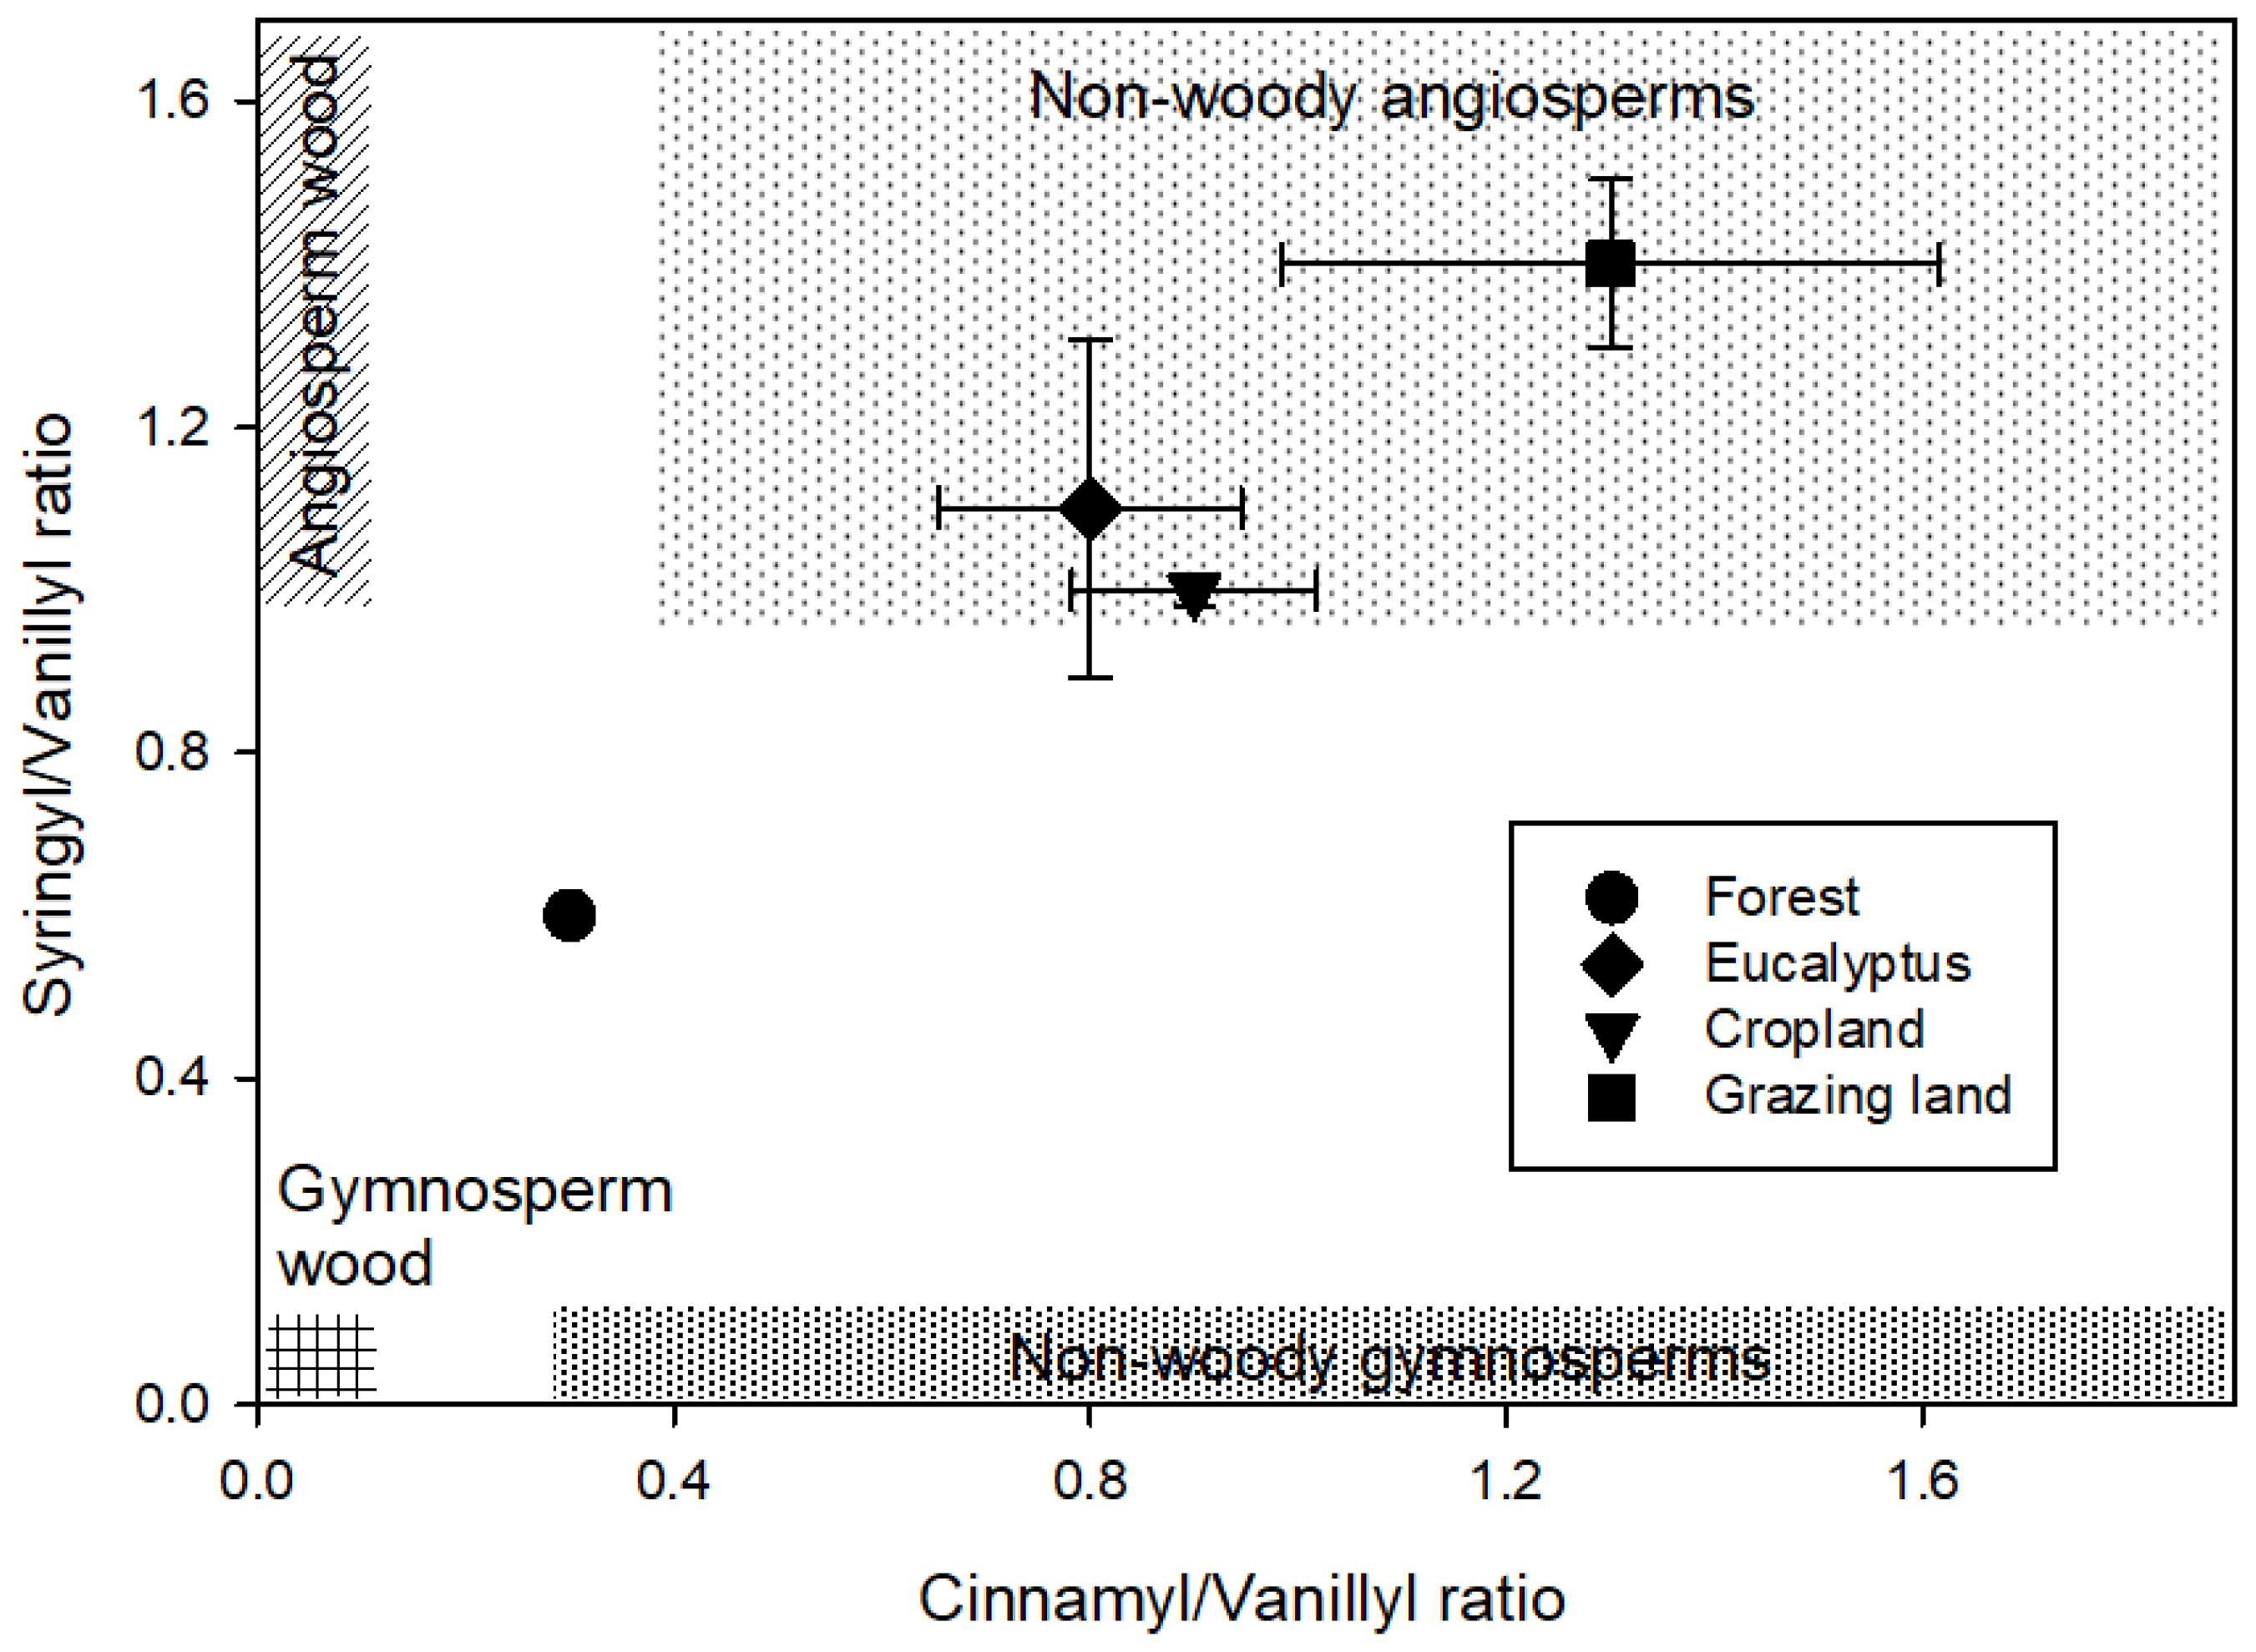
3.4. CuO Oxidation Extractable Compounds

The CuO oxidation of soils released benzyls, lignin-derived phenols, lipid-derived carboxylic acids (short-chain alkanedioic and hydroxy acids), and cutin-derived products, as well as compounds derived from polysaccharides, proteins, and tannins (Appendix A Figure A4 and Table A3). In forest soil, the total concentration of identified C-normalized CuO products was almost double the levels determined in the soils of other land-uses, but it was not statistically different. A trend of higher values in soil from the natural forest was seen for the majority of the compounds determined. In addition to the eight major lignin-derived phenols, nine benzyls, and three other phenols were identified (Appendix A Table A3).
The syringyl to cinnamyl (S/V) and cinnamyl to vanillyl (C/V) ratios were calculated for the sums of the lignin-specific phenols (Table 5). Both the S/V and C/V ratios were lower in natural forest soil than in the other land-use systems, which had similar values. Similarly, the V:S:C ratio differed strongly in natural forest soil, with a ratio of 4:2:1, compared to the other land-uses, which all had a ratio close to 1:1:1. The lignin phenol vegetation index (LPVI) was the lowest in natural forest and highest in grazing land soils. The eucalyptus and cropland soils had a similar intermediate value.
A plot of the S/V and C/V ratios (Figure 2) showed a clear separation of the land-use systems. The eucalyptus, cropland, and grazing land were grouped in the range of the non-woody angiosperms, with a clear difference between eucalyptus and cropland to the grazing land. The natural forest also showed a clear separation from the other land-use system and separated toward the range of gymnosperm wood and angiosperm wood.

4. Discussion

4.1. Above- and Belowground Inputs

Soil organic matter (SOM) is formed through the inputs of above- and belowground plant materials and from microbial detritus [15]. At the Galawdios site, considerable losses of SOM after land-use change have also occurred [5]. In the natural forest, there is substantial necromass input from both aboveground and belowground, whereas, in the other land-uses, the aboveground inputs are small, due to biomass removal [5]. In the natural forest, belowground C inputs from fine roots were almost twice those in the eucalyptus plantation and 8–10 times those in the grassland and cropland [41]. In the natural forest, the amounts of necromass inputs from leaf fall and fine roots were similar [38].
In all land-uses, except for grazing land, the levels of root-derived suberin biomarkers greatly exceeded those of leaf-derived cutin molecular proxies. There is still considerable debate about the cutin or suberin origin of a number of compounds [18,42]; thus, we calculated both a conservative suberin-to-cutin ratio based on compounds that, with a degree of certainty, can be assigned at either suberin to cutin derivatives, and a suberin-to-cutin ratio with a greater degree of uncertainty about the origin of the proxies. The more conservative suberin biomarkers include ω-hydroxyalkanoic acid (≥C20) and α,ω-alkanoic acids (C16–C24). The more conservative cutin biomarkers include compounds of C16 mono- and dihydroxy acids and diacids [42]. Both ratios show a dominance of suberin, suggesting that, in the studied ecosystem, root inputs play a more important role in the formation of SOM than leaf inputs. However, as discussed above, only in the natural forest are the above- and belowground biomass inputs similar. In the eucalyptus plantation, leaves are raked and removed; in the cropland, all crop residues are harvested for either cattle fodder or fuel; and the grazing land is very heavily grazed, removing almost all aboveground biomass, thus explaining the dominance of root-derived biomarkers in these land-uses. In the natural forest with a more balanced input of above- and belowground necromass, the difference still suggests that roots are more important for the formation of SOM than aboveground inputs. A greater importance of belowground inputs compared to aboveground inputs for SOM formation has been shown repeatedly [43,44,45]. However, there is evidence to suggest that the degradation of suberin biomarkers is slower than that of cutin biomarkers [20,45], but also that the plant source of the material is important [44]. Hamer et al. [42] showed that grass-derived lipids had a faster turnover than those derived from forest vegetation, and this may explain the low levels of suberin biomarkers found in the grazing land at Gelawdios. In addition, as forest-derived monomers are preserved in the soil for more than 50 years, the high suberin content in cropland may also be, in part, a legacy of the former forest. Particularly, the ω-hydroxy carboxylic acids and α,ω-alkanedioic acids of forest origin may have been stabilized in the soils by bonding to soil minerals. All of the soils have a high clay content [12].

4.2. Microbial Inputs

Soil organic matter is considered to originate from both plant and microbial origins [15,43]. Long-chain (≥C20) lipids, such as n-alkanols, n-alkanes, and n-alkanoic acids, with even-over-odd preference are considered to be typical constituents of epicuticular and associated waxes of higher plants [22,32,40]. The short-chain alkanes, alkanoic acids and diacids, mid-chain substituted hydroxy alkanoic acids (C16, C18, and C19), and branched alkanoic acid (iso-C16) are considered to be derived from microorganisms [22,40]. However, there is evidence showing that long-chain (≥C20) lipids may also be derived from fungi [19,46]. In the solvent extracts, in all land-uses, except for eucalyptus, the ≥C20 compounds exceeded the <C20 compounds, suggesting that, particularly in the natural forest, inputs of plant origin dominate this fraction of SOM. The solvent extracts represent a less tight bound and possibly younger fraction of compounds in the soils. However, two other solvent extracted compounds, ergosterol and trehalose, show the presence of microbial activity. Ergosterol, a specific biomarker for living fungal biomass [47], was detected in the forest and eucalyptus soil but not in the cropland and grazing land soil (Appendix A Table A1). The stress protectant trehalose is attributed to fungi, bacteria, and insects, but it is only rarely found in plants [16,48]. The concentration of ergosterol in eucalyptus soil is about 2.6 times that of natural forest soil (Appendix A Table A1) and reflects the ectomycorrhizal status of eucalyptus against the arbuscular mycorrhizal–dominated natural forest [49]. As ergosterol was not detected in cropland and grazing land, microbial inputs associated with the mid-chain alkanoic acids are more likely from bacteria. In the base extracts, which represent the bound lipids and accumulation in the SOM, the concentration of <C20 compounds greatly exceeds that of the ≥C20 compounds, with no significant difference in the ratio of <C20:≥C20 (bh) between the land-use systems. Thus, indicating the importance of microbial residues in the longer-term SOM pools of all studied land-use systems.

4.3. Angiosperms and Gymnosperms

The foot print of eucalyptus can clearly be seen in the solvent extracts, in which the sesquiterpenes, aromadendrene, γ-elemene, ledol, globulol, and farnesol were detected in high concentrations. These compounds are found in a variety of aromatic plants and reported as common constituents of essential oils of eucalyptus [50,51]. Triterpenoids of the ß-amyrin, α-amyrin, lupeol, erythrodiol, and oleanolic acid type are also typical biomarkers for angiosperms [17,40,52]. They were found in large quantities in the eucalyptus soil (Table 1). Particularly, erythrodiol and oleanolic acid are major components in the essential oils of eucalyptus leaves [52].
CuO oxidation was used to release lignin-specific phenols (vanillyl, syringyl, and cinnamyl phenols) from lignin polymers [53]. The S/V ratio of gymnosperm wood and non-woody tissues is very low, due to the absence of syringyls compared to that of angiosperm wood and non-woody tissues [54]. In the different land-uses, the S/V values in soils ranged from 0.61 (natural forest) to 1.4 (grazing land). In another investigation carried out in the Southwestern Ethiopia highlands, the soil of a natural forest with dominance of Olea africana, Syzygium guineense, Cordia africana, and Croton macrostachys had a S/V ratio of 0.84. In a similar Olea and Cordia forest, and also in a forest with a presence of the gymnosperm Podocarpus falcutus, a similar value of 0.85 was found [11]. However, in an adjacent gymnosperm Cupressus sp. Plantation, the soil had a lower value (0.22). Other studies have also reported lower S/V values for gymnosperm-dominated species. For example, Li et al. [55] reported a low S/V value (0.23) under pine-dominated forests and 0.84 for farmland soils. The C/V ratio indicates the presence of residues from non-woody tissues of both gymnosperms and angiosperms, as cinnamyls are not present in wood [54]. The C/V ratios were different in all land-use soil samples, again being highest in grassland soil (1.3), followed by cropland (0.9), eucalyptus soil (0.8), and forest soil (0.3). This indicates the presence of material from non-woody tissues in SOM of all land-uses. In cropland, grazing land, and eucalyptus soil, this clearly indicates that non-woody angiosperms, such as grass and herb species, are the predominant sources of lignin. In contrast, in the natural forest ecosystem, the low C/V ratio suggests that both non-woody tissues and wood are important for SOM formation. The V:S:C ratio also supports the major contribution of non-woody angiosperms to SOM in the eucalyptus, cropland, and grazing land soils. Non-woody angiosperms have a 1:1:1 V:S:C ratio [53]. The lignin-derived phenols detected in our samples exhibited a V:S:C ratio of 4:2:1 in natural forest soil and 1:1:1 in the eucalyptus, cropland, and grazing land soils. In a plot of S/V ratio against the C/V ratio [56], a clear separation of the natural forest from the other land-uses was also found. For the natural forest, the lower S/V and C/V values reflect a mixture of both angiosperm and gymnosperm sources. To improve the detection of lignin sources, the lignin phenol vegetation index (LPVI) was developed by Tareq et al. [25]. Tareq et al. [35] calculated the LPVI of 1 for gymnosperm wood, 3–27 for non-woody gymnosperm tissues, 67–415 for angiosperm wood, and 176–2782 for non-woody angiosperm tissues. In the present study, the LPVI value of the natural forest (70) is in the lowest range of angiosperm wood, and below that of angiosperm non-woody tissues. In contrast, soil samples from eucalyptus (992), cropland (880), and grazing land (2080) show characteristics for non-woody angiosperm tissues, and this is consistent with plots of S/V vs. C/V ratios. Thus, all the indices, namely the LPVI, the plots of the S/V ratio against the C/V ratio, and S/V ratio alone, indicate that, in the natural forest, the angiosperm signal might be being lowered by the presence of material from gymnosperms. The exact historical composition of the natural forest is not known, but it was highly likely to be a typical Olive–Juniper-Podocarpus composition. Both Podocarpus and Juniperus are gymnosperm genera. Today, Podocarpus falcatus and Olea africana species still occur in the natural forest, whereas Juniperus procera is restricted to the surrounding area and compounds of the Gelawdios church. Juniperus procera wood is highly valued [57]; much has been harvested, but the regeneration rate is low.

5. Conclusions

By using the sequential extraction technique, clearly information about the sources of material for the formation of SOM can be gained. However, there are a number of uncertainties. The composition of leaf and root lipids differs between different vegetation types [42] and between tree species [18], thus affecting the inputs of biomarkers. The natural forest at Gelawdios has over 40 tree species; thus, determining the lipids in the vegetation in the natural forest was beyond the scope of this investigation. Similarly, the relative turnover of biomarkers in soils, a factor that affects all such studies, remains unknown [19]. For comparability, the yields of compounds are normalized against the soil C content, making the comparison of soils with greatly different C contents difficult, and creating differences in the normalized yields between land-uses. For natural forest soil, the normalized yield in the base hydrolysis extract was only 27–37% of that extracted from the other land-uses. However, for the CuO oxidation, the normalized yield for the natural forest soil was 40% higher than the other land-uses. This can be explained by a high concentration of lignin degradation products in the SOM of the natural forest. However, the results clearly show the importance of root inputs for the formation of SOM in all studied land-use types in NW Ethiopia. In addition, in potentially older SOM fractions, microbial inputs are also important in all land-uses. The SOM in the natural forest soil has a strong signal for woody materials from both angiosperms and gymnosperms, and suggest inputs of woody debris are important. This has implications for the restoration of SOM, particularly in eucalyptus, where trees are cut and most of the woody debris is removed as fuel wood, and in natural forest, where dead trees are legally removed from protected church forests.

Author Contributions

D.A., D.L.G., B.R., and H.S. devised the field design and carried out sampling. D.A. carried out all of the analytical work, and together with A.M. carried out the sequential extraction, and peak identification. D.A. and D.L.G. carried out data analysis and co-wrote the original and final manuscript. B.R. and H.S. critically revised drafts of the manuscript. All authors jointly revised and approved the final version of the manuscript. All authors have read and agreed to the published version of the manuscript.

Funding

This work was carried out within the project “Carbon storage and soil biodiversity in forest landscapes in Ethiopia: Knowledge base and participatory management (Carbo-part)” and was funded by the Austrian Ministry of Agriculture, Forestry, Environment, and Water Management under grant agreement no. BMLFUW-UW.1.3.2/0122-V/4/2013. DLG was also supported by the Ministry of Education, Youth and Sports of CR within the National Sustainability Program NPU I, grant No. LO1415. HS and BR were partially supported by the University of Natural Resources and Life Sciences, Vienna.

Data Availability Statement

Raw data is available on request from the corresponding author.

Acknowledgments

We thank Astrid Hobel and Marcel Hirsch for their continuous assistance during laboratory analysis. We would like also provide our special thanks to Andreas Kitzler (Agilent Technologies, Austria) for appropriation of instruments, technical support, and method adaptation.

Conflicts of Interest

The authors declare no conflict of interest.

Appendix A

Figure A1. Map of the site at Gelawdios, Amhara, Northwestern Ethiopia (11°38′25″ N and 37°48′55″ E), showing the four adjacent land-use systems (natural forest, eucalyptus plantation, cropland, and grazing land). Based on Figure 1 of [12].
Forests 13 00560 g0a1
Figure A2. Total ion GC–MS chromatograms (TIC) of the silylated solvent extracts of four land-use systems from Gelawdios, Ethiopia. Notes: Forests 13 00560 i001, n-alkanols; +, n-alkanes; Δ, n-alkanoic acids; #, carbohydrates (gl, glucose; ma, mannose; su, sucrose); MAG, monoacylglycerides; S1–S7, steroids; T1–T5, triterpenoids; U1, unidentified. Numbers refer to total carbon numbers in aliphatic lipid series. Detailed description of each compound with its quantity, molecular formula, and molecular weight in Appendix A Table A1.
Forests 13 00560 g0a2
Figure A3. Total ion GC–MS chromatograms (TIC) of the methylated and silylated extracts after base hydrolysis of four land-use systems from Gelawdios, Ethiopia. Notes: Forests 13 00560 i002, n-alkanols; 
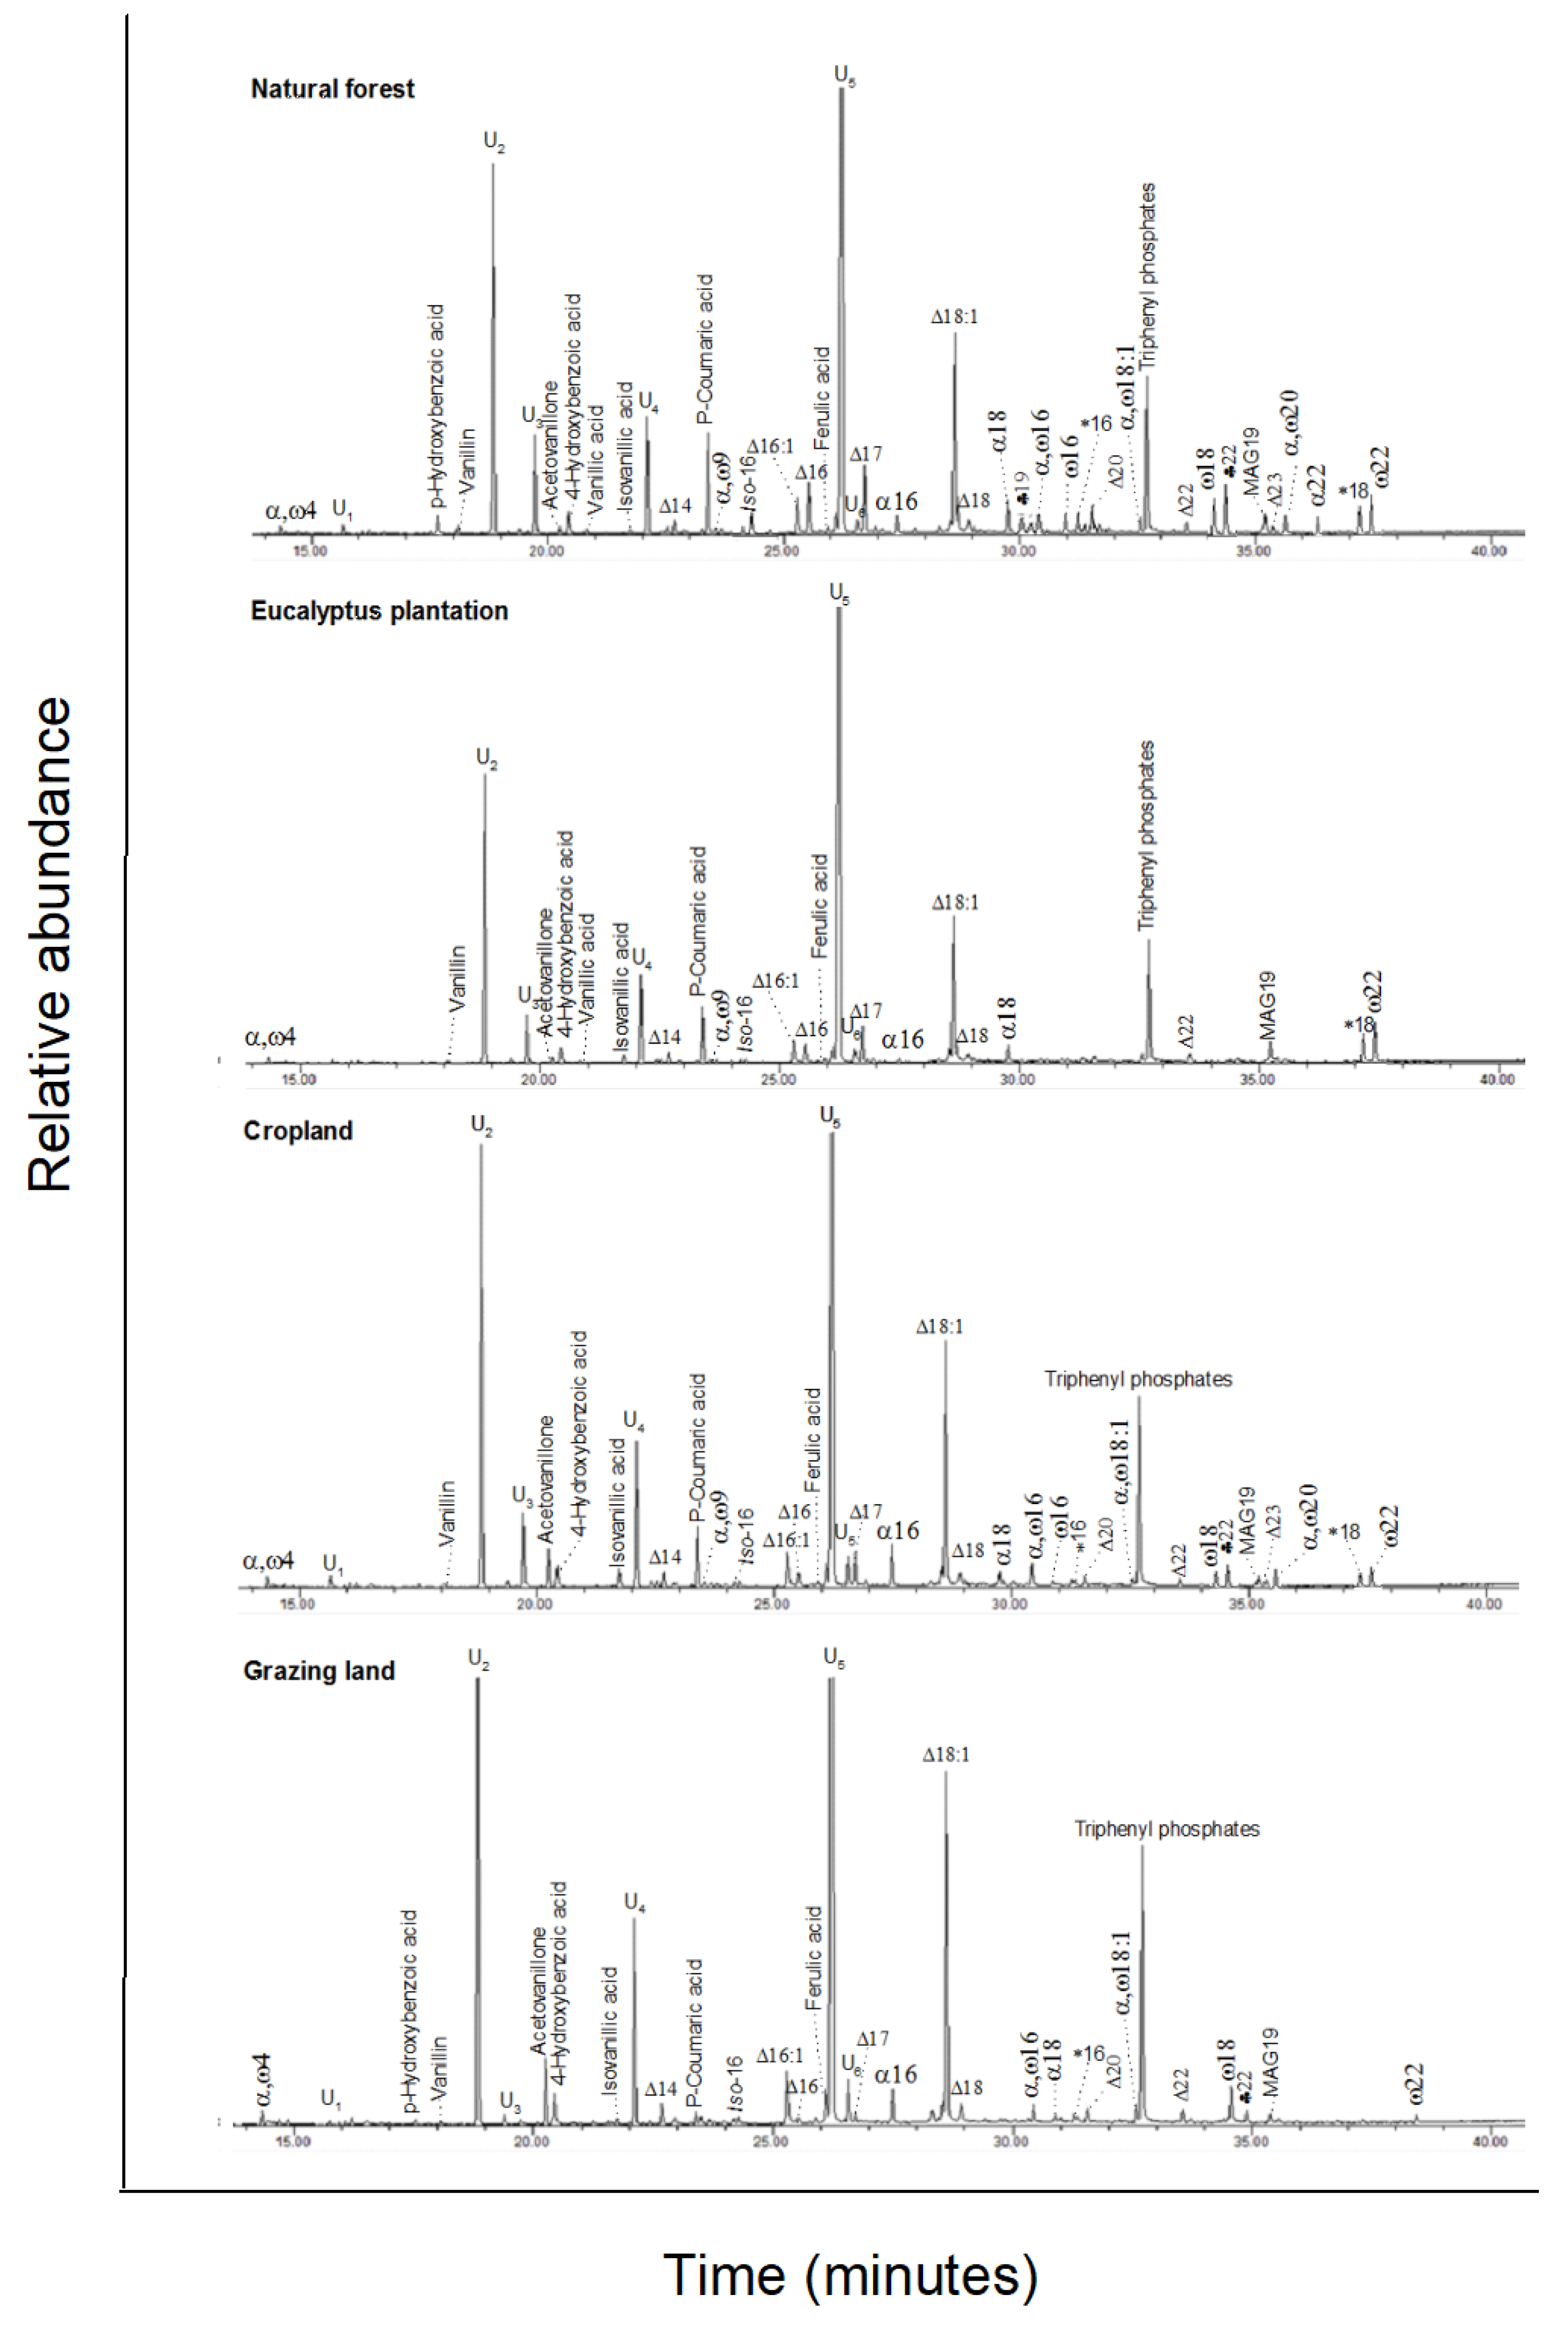
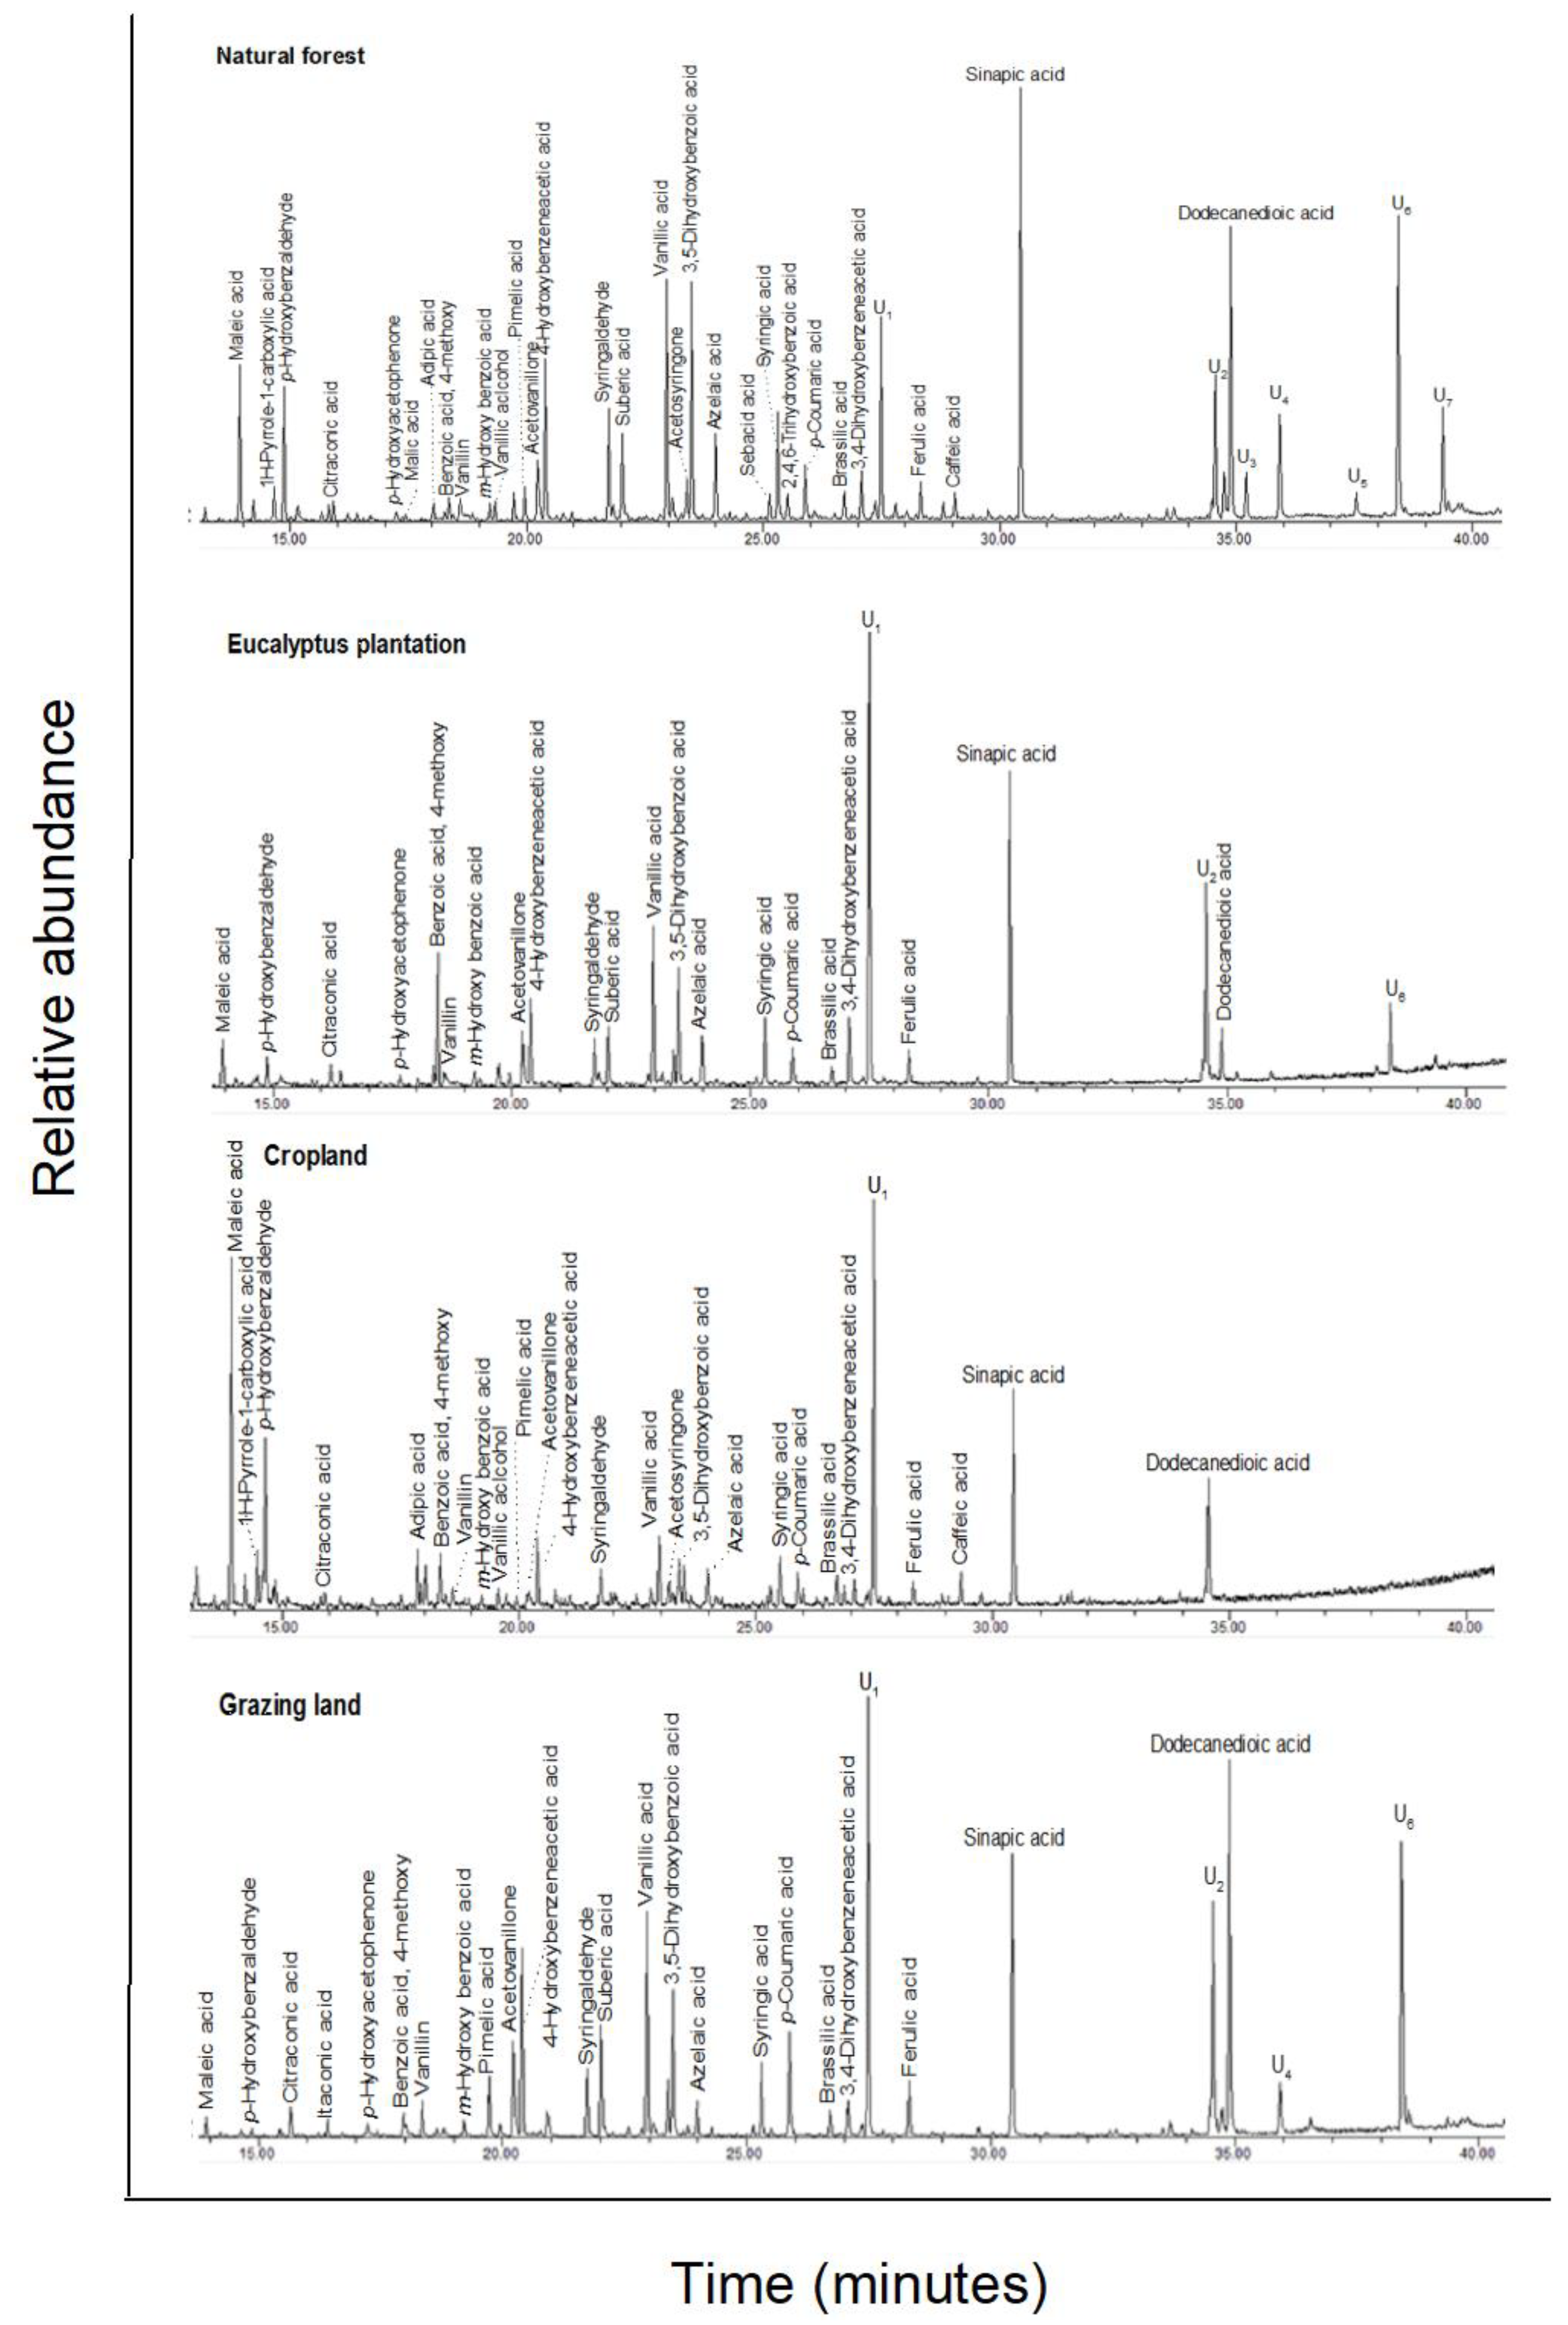
+, n-alkanes; Δ, n-alkanoic acids; iso-alkanoic acids; α-alkanoic acids; α,ω-alkanedioic acids; ω-hydroxyalkanoic acids; * Mid chain substituted hydroxy acids; steroids (β-sitpsterol); organophosphate; phenols; and U1–U5, unidentified. Numbers refer to total carbon numbers in aliphatic lipid series. Detailed description of each compound, with its quantity, molecular formula, and molecular weight, is in Appendix A Table A2.
Forests 13 00560 g0a3
Figure A4. Total ion GC–MS chromatograms (TIC) of the silylated CuO oxidation products of four land-use systems from Gelawdios, Ethiopia. U1–U7, unidentified. Detailed description of each compound with its quantity, molecular formula, and molecular weight in Appendix A Table A3.
Forests 13 00560 g0a4
Table A1. Compounds (µg g−1 C) identified in the solvent extracts of soil samples from different land-use systems in Gelawdios, Ethiopia. MF, molecular formula; MW, molecular weight. Values are mean ± SE; n =1–3 (see table footnotes).
Compound 3MFMWForestEucalyptusCroplandGrazing Land
n-Alkanols
2-TetradecanolC14H30O226 65.3 ± 16.45.8 1
1-HexadecanolC16H34O242 43.3 23.7 1
1-OctadecanolC18H38O2702.1 1 6.0 125.1 1
n-EicosanolC20H42O2989.2 250.7 25.1 1
n-DocosanolC22H46O32645.2 ± 25.496.8 ± 8.055.1 ± 10.246.9 ± 19.3
1-TricosanolC23H48O3406.7 2 6.2 1
n-TetracosanolC24H50O35441.9 ± 29.980.2 ± 20.140.6 ± 18.169.8 ± 15.7
n-HexacosanolC26H54O38284.0 ± 38.273.0 247.4 ± 11.760.5 2
n-OctacosanolC28H58O41093.7 ± 46.777.6 286.0 ± 39.566.2 ± 14.8
n-TricontanolC30H62O43841.4 233.4 1 81.4 ± 15.3
Total Alkanols 324 ± 172520 ± 212250 ± 86356 ± 103
n-Alkanes
n-HeptadecaneC17H36240 162 ± 7216.0 2
OctadecaneC18H382541.1 158.6 2
NonadecaneC19H40268 81.1 28.6 1
n-DocosaneC22H46310 4.8 13.5 1
TricosaneC23H48324 4.0 13.1 1
n-TetracosaneC24H503386.2 2
n-PentacosaneC25H52352 16.9 118.1 ± 0.811.7 2
n-HexacosaneC26H54366 19.6 129.6 ± 8.2
n-HeptacosaneC27H56380201 ± 7645.0 139.9 11.9 1
HentriacontaneC31H6443613.6 227.2 127.6 18.0 1
Total Alkanes 222 ± 71391 ± 78139 ± 6658 ± 15
n-Alkanoic Acids
Nonanoic acidC9H18O21588.7 214.5 138.7 ± 6.237.6 ± 13.1
Dodecanoic acidC12H24O2200 188.3 ± 33.619.4 210.9 2
n-Tetradecanoic acidC14H28O222810.0 2149.3 ± 18.54.3 111.2 1
n-Hexadecanoic acidC16H32O225648.9 ± 25.4169.8 ± 22.163.9 ± 22.034.0 ± 2.4
n-Octadecanoic acid (18:1)C18H34O228220.5 2132.4 ± 17.3 24.9 2
9-Octadecanoic acid (Z)C18H34O228210.3 289.9 ± 20.9 12.5 2
n-Octadecanoic acidC18H36O228421.1 ± 7.5114.7 ± 41.738.4 ± 14.048.4 ± 23.8
n-Eicosanoic acidC20H40O23120.4 114.8 1 3.0 1
n-Docosanoic acidC22H44O2340132.0 2131.9 ± 44.925.8 ± 9.918.8 ± 1.3
Tricosanoic acidC23H46O235411.8 2
n-Tetracosanoic acidC24H48O236875.5 ± 46.081.3 211.6 227.2 ± 2.9
n-Hexacosanoic acidC26H52O239660.3 ± 14.042.5 15.2 143.8 ± 19.4
Total Alkanoic Acids 449 ± 1841129 ± 128207 ± 50272 ± 31
Iso-Alkanoic Acids
Iso-heptadecanoic acidC17H34O227024.5 2
Monoacylglycerides
(±)-2,3-Dihydroxypropyl hexadecanoate (C16)C19H38O43309.2 219.1 137.1 2
Monostearin (C18:1)C21H42O435816.1 2134.4 ± 26.197.0 ± 19.1464.9 ± 8.9
Linolein, 1-mono (C18:1)C21H38O435420.6 ± 9.531.9 1 9.3 1
2-Monolinolenin (C18:2)C21H36O43526.4 174.3 ± 16.0 9.7 1
Total Monoacylglycerides 52 ± 26260 ± 19134 ± 4684 ± 2
Carbohydrates
D-GlucoseC6H12O618016.2 290.1 ± 32.937.8 ± 16.646.7 ± 14.7
MannoseC6H12O618016.9 ± 7.0212 ± 78.478.4 ± 25.346.0 ± 14.0
SucroseC12H22O113427.7 219.6 119.5 233.0 ± 11.3
TrehaloseC12H22O113423895 ± 712 12107 ± 217 21684 ± 191 21768 ± 157 2
Total Carbohydrates 3936 ± 7032429 ± 25618120 ± 2291894 ± 192
Steroids and Terpenoids
AromadendreneC15H242040.5 1125 213.8 1
γ-ElemeneC15H24204 183.0 ± 81.113.5 1
LedolC15H26O222 157.2 ± 32.99.3 1
(-)-GlobulolC15H26O222 72.0 ± 7.517.1 211.8 1
trans-FarnesolC15H26O222 753 ± 64.948.2 1
CholesterolC27H46O38611.4 298.8 ± 33.062.2 223.6 2
ErgostrolC28H44O39636.8 294.7 1
CampesterolC28H48O40032.9 2117.3 ± 28.787.9 2104.7 ± 0.3
StigmasterolC29H48O41256.0 2243.1 ± 30.4110.2 ± 17.4138.9 ± 18.3
ß-SitosterolC29H50O414232.2 ± 93.8243.2 ± 6.0237.9 ± 46.1142.9 ± 25.7
StigmastanolC29H52O416 119.4 ± 34.2
ß-AmyrinC30H50O42681.2 2161.8 ± 1.898.9 ± 16.3
α-AmyrinC30H50O42614.7 266.1 ± 17.9
LupeolC30H50O4269.7 187.3 213.3 128.0 1
SitosteroneC29H48O41213.3 173.6 217.0 1
ErthrodiolC30H50O244247.4 2343.6 ± 100.3
Oleanolic acidC30H48O345685.4 ± 52.5642.1 ± 132.5 46.9 2
Total Steroids and Terpenoids 622 ± 2673461 ± 341729 ± 80616 ± 616
Unidentified 37.6 ± 3.4126.2 ± 10.8238.1 ± 99.667.7 2
Total aliphatic lipids 5007 ± 7464729 ± 5312550 ± 4302664 ± 300
Total solvent extracts 5629 ± 7408190 ± 8573279 ± 5083280 ± 394
1 Detected only in one sample. 2 Detected only in two samples. 3 All polar compounds were identified as their trimethylsilyl (TMS) derivatives.
Table A2. Compounds (µg g−1 C) with molecular formula (MF) and molecular weight (MW) identified from base hydrolyzed of soil samples from different land-use systems in Gelawdios, Ethiopia. MF, molecular formula; MW, molecular weight. Values are mean ± SE, n = 1–3 (see below footnotes). All values as µg g−1 C, except triphenyl phosphate (mg g−1 C).
CompoundMFMWForest EucalyptusCropland Grazing Land
n-Alkanols3
n-HexadecanolC16H34O2427.4 120.266.4 275.3 2
n-OctadecanolC18H38O2709.1 110.610.8 1
n-NonadecanolC19H40O28440.5 ± 10.585.6 ± 12.980.7 2
n-DocosanolC22H46O32647.1 ± 5.5121 ± 8129 ± 36552 ± 324
n-Tetracosanol-1C24H50O354 13.0 1
n-HexacosanolC26H54O382 14.6 114.3 1
n-OctacosanolC28H58O410 13.0 1
Total n-Alkanols 104 ± 21265 ± 12314 ± 21627 ± 362
n-Alkanoic Acids
n-Tetradecanoic acidC14H28O2228128 ± 16352 ± 20.2540 ± 118362.0 ± 92
n-Hexadecanoic acid (C16:1)C16H30O2254390 ± 501030 ± 40969 ± 181569 ± 127
n-Hexacosanoic acidC16H32O2256579 ± 30111.5 ± 49.1651.2 ± 17.6128 ± 70
n-Heptadecanoic acidC17H34O2270472 ± 65.8514 ± 27.4592 ± 82.762.3 ± 57.0
n-Octadecanoic acid, cis-9 (C18:1)C18H34O228254.6 ± 12.2106 ± 11193 ± 38321 ± 78
n-Octadecanoic acid (C18:1)C18H34O22822710 ±7906095 ± 1186631 ± 437.18089 ± 655
n-Octadecanoic acidC18H36O2284187 ± 40.1408 ± 5621 ± 12.4661 ± 53
n-Nonadecanoic acidC19H38O229822.7 241.9 2
n-Eicosanoic acidC20H40O231283.2 ± 13.4213 ± 6.7322.6 ± 74.7347 ± 36
n-Docosanoic acidC22H44O234093.3 ± 28.1324 ± 61292 ± 108342 ± 76
n-Triacosanoic acidC23H46O235447.8 ± 4.1139 ± 9.3204 ± 52.2206 ± 26.8
n-Tetracosanoic acidC24H48O23687.6 126.9 1 57.7 2
n-Hexacosanoic acidC26H52O23965.5 114.6 1
n-Octacosanoic acidC28H56O24247.3 121.3 146.1 1
n-Triacontanoic acidC30H60O2302 11.0 1
Total Alkanoic Acids 4788 ± 11809998 ± 17911063 ± 45212157 ± 1173
α-Alkanoic Acids
α-Hydroxy-Hexadecanoic acidC16H32O327266.7 2105 ± 7.7189 ± 37.4383 ± 225
α-Hydroxyoctadecanoic acidC18H36O3300280 ± 30398 ± 12388 ± 64.488.0 1
α-Hydroxydocosanoic acidC22H44O335617.4 212.5 1
α-Hydroxytetracosanoic acidC24H48O3384 75.6 2
α-hydroxypentacosanoic acidC25H50O3398 24.5 1
Total α-Alkanoic Acids 364 ± 60515 ± 124576 ± 100572 ± 357
α,ω-Alkanedioic Acids
α,ω-Butanedioic acidC4H6O411862.2 ± 20.8123.7 ± 5.260.3 ± 14.3178.7 ± 67.9
α,ω-Nonanedioic acidC9H16O418839.0 ± 12.094.5 ± 4.2109.2 ± 41.793.4 ± 24.4
α,ω-Hexadecanedioic acidC16H30O428664.4 ± 9.1110.6 ± 23.3181.3 ± 42.3248.4 ± 9.1
α,ω-Octadec-9-enedioic acid (C18:1)C18H32O4312120.0 ± 18.5151.8 ± 52.793.7 2
α,ω-Eicosanedioc acidC20H38O434256.5 ± 11.7161.4 ± 9.4144.4 ± 15.6157.8 ± 17.9
Total α,ω-Alkanedioic Acids 342 ± 49642 ± 41589 ± 125678 ± 70
ω-Hydroxyalkanoic Acids3
ω-Hydroxyhexadecanoic acidC16H32O327297.5 ± 27.781.4 2137.5 2124.6 2
ω-Hydroxyoctadecanoic acidC18H34O329841.9 ± 4.498.4 ± 13.7103.9 ± 48.28.4 1
ω-Hydroxydocosanoic acidC22H44O335883.1 ± 19.2125 ± 28106 ± 3010.8 1
ω-Hydroxyoctacosanoic acidC28H56O3440136 ± 72235 ± 35478 ± 4375.2 1
ω-Hydroxytriacontanoic acidC30H60O3468377 ± 70565.2 ± 13.9518.7 ± 69.978.7 1
Total ω-Hydroxyalkanoic Acids 736 ± 311105 ± 261344 ± 30298 ± 141
Mid-Chain Substituted Hydroxy Acids
10,16-DihydroxyhexadecanoicC16H32O428858.8 2152.8 2182.1 2223.3 2
8-Hydroxyhexadecane-1,16-dioic acidC16H30O530267.4 ± 13.3115 ± 26.6123 ± 4.1
Dihydroxymethoxyoctadecanoic acidC18H36O53323.1 111.2 1
9,10,18-Trihydroxyoctadecanoic acidC18H36O533232.2 190.9 238.1 2
9,10-Dihydroxyoctadecane-1,18-dioic acidC19H38O433065.5 ± 41.1222 278.3 285.9 2
Total Mid-Chain Substituted Hydroxy Acids 227 ± 111592 ± 122422 ± 160309 ± 80
MonoacylglyceridesC19H38O4330238 ± 59487 ± 128432 ± 177
Benzyles and Phenols
p-HydroxyacetophenoneC8H8O213621.7 ± 4.153.6 ± 5.793.0 ± 17.055.3 2
VanillinC8H8O31524.7 1 38.0 2
AcetovanilloneC8H10O315451.4 2122 ± 32.7137 21080 ± 468
4-Hydroxybenzoic acidC7H6O3138204 ± 27609 ± 34692 ± 51916 ± 116
Vanillic acidC8H8O416825.4 ± 10.774.3 ± 20.639.2 253.0 2
Isovanillic acidC8H8O416860.1 ± 5.1217 ± 33254 ± 7140.1 1
p-Coumaric acidC9H8O316419.1 260.6 266.7 252.3 1
Ferulic acidC10H10O419440.9 ± 5.196.8 ± 1.4109 ± 2967.5 2
Total Benzyles and Phenols 428 ± 531233 ± 571390 ± 2002303 ± 493
1 Detected only in one sample. 2 Detected only in two samples; 3 n-alkohols, terpenols, and sterols were identified as TMS ethers.
Table A3. Major compounds (µg g−1 C) identified in the CuO oxidation extracts of soil samples from different land-use systems in Gelawdios, Ethiopia. MF, molecular formula; MW, molecular weight. Values are mean ± SE; n = 1–3 (see below footnotes).
CompoundMFMWForest * EucalyptusCroplandGrazing Land
Organophosphates
Triphenyl phosphate (mg g−1)C18H15O4P3261.5 ± 0.24.5 ± 0.15.6 ± 0.36.8 ± 0.6
Hydroxy Benzene Products
p-HydroxyacetophenoneC8H8O2136198145 1nb483 2
Benzoic acid, 4-methoxy-/p-Anisic acidC8H8O3152524233 1301 1537 2
m-Hydroxy benzoic acidC7H6O3138271509 ± 61625 ± 2241 1
3,5-dihydroxybenzoic acidC7H6O41542991665 ± 119469 2360 1
2,4,6-Trihydroxybenzoic acidC7H6O5170181442 ± 27247 1705 ± 145
3,4-Dihydroxybenzeneacetic acidC8H8O4168592801 ± 180432 2751 ± 214
Total Hydroxy Benzene Products 312182795 ± 4132074 ± 4173078 ± 910
Protein and Polysaccharide Products
Benzoic acidC7H6O2122626
Butan-1,4-dioic acid/succinic acidC4H6O41182584420 2642 ± 15242 1
2-Butenedioic acid/fumaric acidC4H4O4116126400 2840 ± 55175 1
Maleic acid C4H4O41161591183 1519 1237 1
1H-pyrrole-1-carboxylic acidC5H5NO2111902532 ± 64658 ± 62196 1
p-HydroxybenzaldehydeC7H6O2122997365 2213 1203 1
4-Hydroxybenzeneacetic acidC8H8O31521449837 ± 183742 ± 74554 ± 35
2-Buten-1,4-dioic acid/citraconic acidC5H6O4130165151 1 200 1
Penten-1,5-dioic acid/itaconic acidC5H6O4130121499 ± 44488 2375 2
Hydroxybutan-1,4-dioic acid/Malic acidC4H6O5134150301 2425 2518 ± 19
Total Protein and Polysaccharide Products 8713368645282700
Lignin Monomers
Vanillin/vanillaldehydeC8H8O3152564555 ± 78219 1576 ± 36
Vanillic alcoholC8H10O3154188292 2ndnd
AcetovanilloneC8H10O3154573744 ± 155654 ± 35587 2
Vanillic acidC8H8O41681169178 1725 ± 110
Total Vanillyls 24931768 ± 3531598 ± 3641163 ± 384
SyringaldehydeC9H10O4182272177 1252 1389 1
AcetosyringoneC10H12O4196491576 ± 89707 ± 521091 ± 221
Syringic acidC9H10O5198619741 ± 157617 ± 36199 1
Total Syringyls 13821494 ± 701576 ± 3391827 ± 691
Cinnamyls
P-Coumaric acidC9H8O3164299556 ± 72660 ± 62253 2
Ferulic acidC10H10O4194267611 ± 83656 ± 291015 ± 271
Caffeic acidC9H8O4180388139 1 336 2
Sinapic acidC11H12O52844132 1941 ± 295 2932 ± 87 2973 ± 145 2
Total Cinnamyls 50862247 ± 3392249 ± 912577 ± 179
Total Benzyles and Phenols 4889211991 ± 139412025 ± 169311344 ± 3471
Dicarboxylic Acids
Adipic acidC6H10O4146439603 2863 2167 1
Pimelic acidC7H12O4160303303 2402 2254 1
Suberic acidC8H14O4174818708 ± 165706 ± 108760 2
Azelaic acidC9H16O41181120893 ± 214672 ± 53451 2
Sebacic acidC10H18O4202294147 1 217 1
Brassilic acidC11H20O4216292527 ± 66657 ± 44790 ± 114
Dodecanedioic acidC12H22O42301802753 ± 176469 21357 ± 240
Total Dicarboxylic Acids 50693933 ± 9953769 ± 3623995 ± 911
Identified Total CuO Products 5396115924 ± 170015794 ± 127815340 ± 4044
Unidentified 84755425 ± 5075638 ± 2586250 ± 1147
Total CuO Products 6243621349 ± 50721432 ± 25821590 ± 1147
* The third sample in the forest was contaminated during extraction. Therefore, all values in CuO oxidation product of forest soil are an average of two samples. 1 Values detected only from one sample; 2 values detected only from two samples.

References

  1. Guo, L.B.; Gifford, R.M. Soil carbon stocks and land use change: A meta analysis. Glob. Change Biol. 2002, 8, 345–360. [Google Scholar] [CrossRef]
  2. Shiferaw, B.; Holden, S. Soil erosion and smallholders’ conservation decisions in the highlands of Ethiopia. World Dev. 1999, 27, 739–752. [Google Scholar] [CrossRef]
  3. Awulachew, S.B.; McCartney, M.; Steenhuis, T.S.; Ahmed, A.A. A Review of Hydrology, Sediment and Water Resource Use in the Blue Nile Basin; International Water Management Institute (IWMI): Colombo, Sri Lanka, 2009. [Google Scholar]
  4. Lemenih, M.; Kassa, H. Re-Greening Ethiopia: History, Challenges and Lessons. Forests 2014, 5, 1896–1909. [Google Scholar] [CrossRef]
  5. Assefa, D.; Rewald, B.; Sandén, H.; Rosinger, C.; Abiyu, A.; Yitaferu, B.; Godbold, D.L. Deforestation and land use strongly effect soil organic carbon and nitrogen stock in Northwest Ethiopia. Catena 2017, 153, 89–99. [Google Scholar] [CrossRef]
  6. Bekele, M. Forest Plantations and Woodlots in Ethiopia; Regional Soil Conservation Unit, Swedish International Development Authority: Nairobi, Kenya, 2011. [Google Scholar]
  7. Desta, L.; Kassie, M.; Beninc, S.; Penderd, J. Land degradation in the highlands of Amhara region and strategies for sustainable land management. In Policies for Sustainable Land Management in the Highlands of Ethiopia; Jabbar, M.A., Pender, J., Ehiu, S.K., Eds.; International Livestock Research Institute: Addis Ababa, Ethiopia, 2000. [Google Scholar]
  8. Wassie, A.; Sterck, F.J.; Teketay, D.; Bongers, F. Tree regeneration in church forests of Ethiopia: Effects of microsites and management. Biotropica 2009, 41, 110–119. [Google Scholar] [CrossRef]
  9. Aerts, R.; Van Overtveld, K.; November, E.; Wassie, A.; Abiyu, A.; Demissew, S.; Daye, D.D.; Giday, K.; Haile, M.; Tewolde Berhan, S.; et al. Conservation of the Ethiopian church forests: Threats, opportunities and implications for their management. Sci. Total Environ. 2016, 551, 404–414. [Google Scholar] [CrossRef] [PubMed] [Green Version]
  10. Pohjonen, V.; Pukkala, T. Eucalyptus globulus In Ethiopian forestry. For. Ecol. Manag. 1990, 36, 19–31. [Google Scholar] [CrossRef]
  11. Solomon, D.; Fritzsche, F.; Lehmann, J.; Tekalign, M.; Zech, W. Soil organic matter dynamics in the subhumid agroecosystems of the Ethiopian highlands: Evidence from natural 13C abundance and particle-size fractionation. Soil Sci. Soc. Am. J. 2002, 66, 969–978. [Google Scholar] [CrossRef] [Green Version]
  12. Ahmed, I.U.; Assefa, D.; Godbold, D.L. Land-Use Change Depletes Quantity and Quality of Soil Organic Matter Fractions in Ethiopian Highlands. Forests 2022, 13, 69. [Google Scholar] [CrossRef]
  13. Tolimir, M.; Kresović, B.; Životić, L.; Dragović, S.; Dragović, R.; Sredojević, Z.; Gajić, B. The conversion of forestland into agricultural land without appropriate measures to conserve SOM leads to the degradation of physical and rheological soil properties. Sci. Rep. 2020, 10, 13668. [Google Scholar] [CrossRef]
  14. Delelegn, Y.T.; Purahong, W.; Blazevic, A.; Yitaferu, B.; Wubet, T.; Göransson, H.; Godbold, D.L. Changes in land use alter soil quality and aggregate stability in the highlands of northern Ethiopia. Sci. Rep. 2017, 7, 13602. [Google Scholar] [CrossRef] [PubMed] [Green Version]
  15. Schmidt, M.W.; Torn, M.S.; Abiven, S.; Dittmar, T.; Guggenberger, G.; Janssens, I.A.; Kleber, M.; Kogel-Knabner, I.; Lehmann, J.; Manning, D.A.C.; et al. Persistence of soil organic matter as an ecosystem property. Nature 2011, 478, 49–56. [Google Scholar] [CrossRef] [PubMed] [Green Version]
  16. Otto, A.; Simpson, M.J. Sources and composition of hydrolysable aliphatic lipids and phenols in soils from western Canada. Org. Geochem. 2006, 37, 385–407. [Google Scholar] [CrossRef]
  17. Otto, A.; Simpson, M.J. Evaluation of CuO oxidation parameters for determining the source and stage of lignin degradation in soil. Biogeochem 2006, 80, 121–142. [Google Scholar] [CrossRef]
  18. Mueller, K.E.; Polissar, P.J.; Oleksyn, J.; Freeman, K.H. Differentiating temperate tree species and their organs using lipid biomarkers in leaves, roots and soil. Org. Geochem. 2012, 52, 130–141. [Google Scholar] [CrossRef]
  19. Jansen, B.; Wiesenberg, G.B.L. Opportunities and limitations related to the application of plant-derived lipid molecular proxies in soil science. Soil 2017, 3, 211–234. [Google Scholar] [CrossRef] [Green Version]
  20. Rasse, D.P.; Rumpel, C.; Dignac, M.F. Is soil carbon mostly root carbon? Mechanisms for a specific stabilisation. Plant. Soil 2005, 269, 341–356. [Google Scholar] [CrossRef]
  21. Kögel-Knabner, I. The macromolecular organic composition of plant and microbial residues as inputs to soil organic matter. Soil Biol. Biochem. 2002, 34, 139–162. [Google Scholar] [CrossRef]
  22. Feng, X.; Simpson, M.J. The distribution and degradation of biomarkers in Alberta grassland soil profiles. Org. Geochem. 2007, 38, 1558–1570. [Google Scholar] [CrossRef]
  23. Amelung, W.; Brodowski, S.; Sandhage-Hofmann, A.; Bol, R. Combining biomarker with stable isotope analyses for assessing the transformation and turnover of soil organic matter. In Advances in Agronomy; Sparks, D., Ed.; Academic Press: Cambridge, MA, USA, 2008; pp. 155–250. [Google Scholar]
  24. Angst, G.; Mueller, K.E.; Nierop, K.G.; Simpson, M.J. Plant-or microbial-derived? A review on the molecular composition of stabilized soil organic matter. Soil Biol. Biochem. 2021, 156, 108189. [Google Scholar] [CrossRef]
  25. Tareq, S.M.; Kitagawa, H.; Ohta, K. Lignin biomarker and isotopic records of paleovegetation and climate changes from Lake Erhai, southwest China, since 18.5kaBP. Quat. Int. 2011, 229, 47–56. [Google Scholar] [CrossRef]
  26. Feng, X.; Simpson, M.J. Molecular-level methods for monitoring soil organic matter responses to global climate change. J. Environ. Monit. 2011, 13, 1246–1254. [Google Scholar] [CrossRef]
  27. Poirier, N.; Sohi, S.P.; Gaunt, J.L.; Mahieu, N.; Randall, E.W.; Powlson, D.S.; Evershed, R.P. The chemical composition of measurable soil organic matter pools. Org. Geochem. 2005, 36, 1174–1189. [Google Scholar] [CrossRef]
  28. Kögel-Knabner, I. Analytical approaches for characterizing soil organic matter. Org. Geochem. 2000, 31, 609–625. [Google Scholar] [CrossRef]
  29. Otto, A.; Simpson, M.J. Analysis of soil organic matter biomarkers by sequential chemical degradation and gas chromatography–mass spectrometry. J. Sep. Sci. 2007, 30, 272–282. [Google Scholar] [CrossRef]
  30. Angst, G.; John, S.; Mueller, C.W.; Kögel-Knabner, I.; Rethemeyer, J. Tracing the sources and spatial distribution of organic carbon in subsoils using a multi-biomarker approach. Sci. Rep. 2016, 6, 29478. [Google Scholar] [CrossRef] [Green Version]
  31. Goñi, M.A.; Teixeira, M.J.; Perkey, D.W. Sources and distribution of organic matter in a river-dominated estuary (Winyah Bay, SC, USA). Estuar. Coast. Shelf Sci. 2003, 57, 1023–1048. [Google Scholar] [CrossRef]
  32. Otto, A.; Shunthirasingham, C.; Simpson, M.J. A comparison of plant and microbial biomarkers in grassland soils from the Prairie Ecozone of Canada. Org. Geochem. 2005, 36, 425–448. [Google Scholar] [CrossRef]
  33. Thevenot, M.; Dignac, M.F.; Rumpel, C. Fate of lignins in soils: A review. Soil Biol. Biochem. 2010, 42, 1200–1211. [Google Scholar] [CrossRef]
  34. Hedges, J.I.; Mann, D.C. The characterization of plant tissues by their lignin oxidation products. Geochim. Cosmochim. Acta 1979, 43, 1803–1807. [Google Scholar] [CrossRef]
  35. Tareq, S.M.; Tanaka, N.; Ohta, K. Biomarker signature in tropical wetland: Lignin phenol vegetation index (LPVI) and its implications for reconstructing the paleoenvironment. Sci. Total Environ. 2004, 324, 91–103. [Google Scholar] [CrossRef] [PubMed]
  36. Peel, M.C.; Finlayson, B.L.; McMahon, T.A. Updated world map of the Köppen-Geiger climate classification. Hydrol. Earth Syst. Sci. 2007, 4, 439–473. [Google Scholar] [CrossRef] [Green Version]
  37. WRB. World Reference Base for Soil Resources 2014, International Soil Classification System for Naming Soils and Creating Legends for Soil Maps; Food and Agriculture Organization of the United Nations: Rome, Italy, 2014. [Google Scholar]
  38. Assefa, D. Carbon Dynamics of Different Land Use Systems in NW Ethiopian. Ph.D. Thesis, University of Natural Resources and Life Sciences, Vienna, Austria, 2017. [Google Scholar]
  39. Feng, X.; Simpson, M.J. Temperature responses of individual soil organic matter components. J. Geophys. Res. Biogeosci. 2008, 113. [Google Scholar] [CrossRef] [Green Version]
  40. Pautler, B.G.; Austin, J.; Otto, A.; Stewart, K.; Lamoureux, S.F.; Simpson, M.J. Biomarker assessment of organic matter sources and degradation in Canadian High Arctic littoral sediments. Biogeochem. 2010, 100, 75–87. [Google Scholar] [CrossRef]
  41. Assefa, D.; Rewald, B.; Sandén, H.; Godbold, D.L. Fine root dynamics in afromontane forest and adjacent land uses in the northwest ethiopian highlands. Forests 2017, 8, 249. [Google Scholar] [CrossRef] [Green Version]
  42. Hamer, U.; Rumpel, C.; Dignac, M.-F. Cutin and suberin biomarkers as tracers for the turnover of shoot and root derived organic matter along a chronosequence of Ecuadorian pasture soils. Eur. J. Soil Sci. 2012, 63, 808–819. [Google Scholar] [CrossRef]
  43. Godbold, D.L.; Hoosbeek, M.R.; Lukac, M.; Cotrufo, M.F.; Janssens, I.A.; Ceulemans, R.; Polle, A.; Velthorst, E.J.; Scarascia-Mugnozza, G.; De Angelis, P.; et al. Mycorrhizal hyphal turnover as a dominant process for carbon input into soil organic matter. Plant Soil 2006, 281, 15–24. [Google Scholar] [CrossRef] [Green Version]
  44. Berhongaray, G.; Cotrufo, F.M.; Janssens, I.A.; Ceulemans, R. Below-ground carbon inputs contribute more than above-ground inputs to soil carbon accrual in a bioenergy poplar plantation. Plant Soil 2019, 434, 363–378. [Google Scholar] [CrossRef] [Green Version]
  45. Mendez-Millan, M.; Dignac, M.-F.; Rumpel, C.; Rasse, D.P.; Bardoux, G.; Derenne, S. Contribution of maize root derived C to soil organic carbon throughout an agricultural soil profile assessed by compound specific 13 C analysis. Org. Geochem. 2012, 42, 1502–1511. [Google Scholar] [CrossRef]
  46. Quenea, K.; Mathieu, J.; Derenne, S. Soil lipids from accelerated solvent extraction: Influence of temperature and solvent on extract composition. Org. Geochem. 2012, 44, 45–52. [Google Scholar] [CrossRef]
  47. Wallander, H.; Ekblad, A.; Godbold, D.L.; Johnson, D.; Bahr, A.; Baldrian, P.; Björk, R.G.; Kieliszewska-Rokicka, B.; Kjøller, R.; Kraigher, H. Evaluation of methods to estimate production, biomass and turnover of ectomycorrhizal mycelium in forests soils–A review. Soil Biol. Biochem. 2013, 57, 1034–1047. [Google Scholar] [CrossRef]
  48. Feng, X.; Nielsen, L.L.; Simpson, M.J. Responses of soil organic matter and microorganisms to freeze–thaw cycles. Soil Biol. Biochem. 2007, 39, 2027–2037. [Google Scholar] [CrossRef]
  49. Ahmed, I.U.; Mengistie, H.K.; Godbold, D.L.; Sandén, H. Soil moisture integrates the influence of land-use and season on soil microbial community composition in the Ethiopian highlands. App. Soil Ecol. 2019, 135, 85–90. [Google Scholar] [CrossRef]
  50. Elaissi, A.; Rouis, Z.; Salem, N.A.B.; Mabrouk, S.; Ben Salem, Y.; Salah, K.B.H.; Aouni, M.; Farhat, F.; Chemli, R.; Harzallah-Skhiri, F.; et al. Chemical composition of 8 eucalyptus species’ essential oils and the evaluation of their antibacterial, antifungal and antiviral activities. BMC Complement. Altern. Med. 2012, 12, 81. [Google Scholar] [CrossRef] [PubMed] [Green Version]
  51. Song, A.; Wang, Y.; Liu, Y. Study on the chemical constituents of the essential oil of the leaves of Eucalyptus globulus Labill from China. Asian J. Tradit. Med. 2009, 4, 134–140. [Google Scholar]
  52. Jäger, S.; Trojan, H.; Kopp, T.; Laszczyk, M.N.; Scheffler, A. Pentacyclic Triterpene Distribution in Various Plants—Rich Sources for a New Group of Multi-Potent Plant Extracts. Molecules 2009, 14, 2016–2031. [Google Scholar] [CrossRef] [Green Version]
  53. Goñi, M.A.; Hedges, J.I. Lignin dimers: Structures, distribution, and potential geochemical applications. Geochim. Cosmochim. Acta 1992, 56, 4025–4043. [Google Scholar] [CrossRef]
  54. Goñi, M.A.; Montgomery, S. Alkaline CuO oxidation with a microwave digestion system: Lignin analyses of geochemical samples. Anal. Chem. 2000, 72, 3116–3121. [Google Scholar] [CrossRef]
  55. Li, F.; Pan, B.; Zhang, D.; Yang, X.; Li, H.; Liao, S.; Ghaffar, A.; Peng, H.; Xing, B. Organic matter source and degradation as revealed by molecular biomarkers in agricultural soils of Yuanyang terrace. Sci. Rep. 2015, 5, 11074. [Google Scholar] [CrossRef] [Green Version]
  56. Goñi, M.A.; Yunker, M.B.; Macdonald, R.W.; Eglinton, T.I. Distribution and sources of organic biomarkers in arctic sediments from the Mackenzie River and Beaufort Shelf. Mar. Chem. 2000, 71, 23–51. [Google Scholar] [CrossRef]
  57. Tesfay, H.M.; Konrad, H.; Lapin, K. Strategy for the Provision of Reproductive Material for Juniperus procera in Ethiopia; Report of the JUPRET Project (Juniperus procera—Development of a Concept for the Provision of Forest repRoductive Material in Ethiopia); Austrian Research Centre for Forests: Vienna, Austria, 2021; 35p, ISBN 978-3-903258-53-2. [Google Scholar]
Figure 1. Carbon (C) and nitrogen (N) contents (%) at 0–10 cm soil depth in four land-use systems at Gelawdios, Ethiopia (mean ± SE, n = 10). Different lower-case letters indicate significant differences in soil C content; upper-case letters indicate significant differences in N content between land-use types. Note: 10-fold difference in axis scales between C and N contents.
Forests 13 00560 g001
Figure 2. Lignin source parameters of the monomeric syringyl/vanillyl (S/V) and cinnamyl/vanillyl (C/V) phenol ratios among four land-use systems at Gelawdios, Ethiopia. Patterned areas indicate the expected S/V to C/V relationships of four vegetation types according to Reference [35]. Shown are mean ± SE.
Forests 13 00560 g002
Table 1. Normalized yields (mg g−1 C) of the three extraction methods from soils of different land-use systems in Gelawdios, Ethiopia. Shown are the mean and range (in parentheses) for the natural forest and mean ± SE (n = 3) for the other land-uses. Different letters indicate a significant difference between land-uses (p ≤ 0.05).
ExtractionForestEucalyptusCroplandGrazing Land
Solvent5.6 ± 0.7 ab8.2 ± 0.9 b3.3 ± 0.5 a3.2 ± 0.4 a
Base hydrolysis30.0 ± 3.6 a82.0 ± 1.0 b97.4 ± 4.4 bc111.3 ± 8.2 c
CuO oxidation36.0 (33.2–38.7)21.3 ± 2.1 a21.4 ± 1.0 a21.4 ± 4.9 a
Table 2. Compounds, their sums, and their ratios, as identified in the solvent (s) extracts of soil samples of different land-use systems in Gelawdios, Ethiopia (mean ± SE, n = 3). All values are in (µg g−1 C). Different letters indicate a significant difference between land-uses (p ≤ 0.05).
Compound 1ForestEucalyptusCroplandGrazing Land
n-Alkanols (C14–C30)324 ± 171 a520 ± 212 a250 ± 86 a356 ± 103 a
n-Alkanes (C17–C31)222 ± 71 ab391 ± 78 a139 ± 66 ab58 ± 15 b
n-Alkanoic acids (C9–C26)448 ± 184 b1129 ± 128 a 207 ± 49 b272 ± 31 b
Sum995 ± 288 ab2040 ± 400 b596 ± 198 a686 ± 120 a
Sum < C20172 ± 55 a1269 ± 221 b205 ± 60 a205 ± 59 a
Sum ≥ C20823 ± 236 a771 ± 180 a391 ± 140 a482 ± 81 a
<C20:≥C20 ratio (s)0.21 ± 0.01 a1.69 ± 0.09 c0.55 ± 0.07 b0.43 ± 0.10 ab
Monoacylglycerides (C19–C21)52 ± 26 a260 ± 19 b134 ± 46 ab84 ± 2 a
Sugars3936 ± 703 a2429 ± 256 ab1820 ± 229 b1894 ± 192 b
Steroids and Terpenoids622 ± 267 a3461 ± 341 b729 ± 80 a616 ± 99 a
1 All polar compounds were identified as their trimethylsilyl (TMS) derivatives.
Table 3. Compounds, their sums, and their ratios, as identified from base hydrolysis (bh) of soil samples in different land-use systems in Gelawdios, Ethiopia (mean ± SE, n = 3). All values are in µg g−1 C or mg g−1 C, as shown. Different letters indicate a significant difference between land-uses (p ≤ 0.05).
CompoundForest EucalyptusCropland Grazing Land
µg g−1 C
n-Alkanols (C16–C28) 1 104 ± 21 a 265 ± 12 a314 ± 21 a627 ± 362 a
n-Alkanoic acids (C14–C30) 24788 ± 1180 a9998 ± 179 b11063 ± 452 b12157 ± 1173 b
Branched alkanoic acids (iso-C16)11 a38 a 16 and
α-Alkanoic acids (C16–C25) 3 364 ± 60 a 515 ± 124 a576 ± 100 a571 ± 357 a
Sum <C204901 ± 1113 a9799 ± 107 b10789 ± 357 b11664 ± 1317 b
Sum ≥C20 309 ± 43 a 873 ± 79 bc994 ± 237 bc 1616 ± 447 c
<C20:≥C20 ratio (bh)15.9 ± 3.4 a11.4 ± 1.0 a 11.9 ± 2.2 a7.9 ± 1.2 a
α,ω-Alkanedioic acids (C4–C20) 3 342 ± 49 a 642 ± 41 a589 ± 125 a678 ± 69 a
ω-Hydroxyalkanoic acids (C16–C30) 3 736 ± 31 a1105 ± 26 b 1344 ± 30 b298 ± 141 c
Mid-chain substituted hydroxy acids 227 ± 111 a 592 ± 122 a422 ± 160 a309 ± 80 a
Monoacylglycerides (C19) 238 ± 59 487 ± 128432 ± 177nd
Benzyles and phenols 428 ± 531233 ± 57 1390 ± 200 2303 ± 493
mg g−1 C
Organophosphates1.5 ± 0.2 a4.5 ± 0.1 b5.6 ± 0.3 bc6.8 ± 0.6 c
1 n-Alcohols, and ß-Sitosterol were identified as TMS ethers. 2 Alkanoic acids were identified as methyl esters and hydroxyacids as methyl esters/TMS ethers. 3 Phenolic acids were identified as methyl esters/TMS ethers. nd = not detected.
Table 4. Sums of suberin or cutin monomers (µg g−1 C) identified from base hydrolysis of soil samples in different land-use systems in Gelawdios, Ethiopia (mean ± SE, n = 3). Different letters indicate a significant difference between land-uses (p ≤ 0.05).
Suberin and Cutin MonomersForestEucalyptusCroplandGrazing Land
Suberin 1653 ± 56 a1087 ± 63 b1247 ± 15 b322 ± 137 c
Suberin 2792 ± 42 a1267 ± 27 b1488 ± 36 b456 ± 129 a
Cutin 1126 ± 40 a 268 ± 96 a 305 ± 90 a223 ± 17 a
Cutin 2158 ± 71 a 359 ± 88 a 344 ± 109 a223 ± 17 a
Suberin/Cutin ratio 16.1 ± 1.4 a6.3 ± 3.1 a5.3 ± 2.2 a1.0 ± 0.4 a
Suberin/Cutin ratio 27.1 ± 2.5 a3.9 ± 0.9 a6.1 ± 2.8 a1.5 ± 0.6 a
Suberin 1 = ω-hydroxyalkanoic acids (C20–C30) + α,ω-alkanedioic acids (C20). Suberin 2 = ω-hydroxyalkanoic acids (C16–C30) + α,ω-alkanedioic acids (C20). Cutin 1 = C16 mono and dihydroxy acids and diacids. Cutin 2 = C16 mono and dihydroxy acids and diacids + C18 trihydroxy acids.
Table 5. Syringyl-to-cinnamyl ratio (S/V), cinnamyl-to-vanillyl ratio (S/V), vanillyl-to-syringyl-to-cinnamyl ratio (V:S:C), and the lignin phenol vegetation index (LPVI) in soil of four land-use systems at Gelawdios, Ethiopia. For S/V and C/V ratios and for the LPVI, mean and range are shown.
IndexForestEucalyptusCroplandGrazing Land
S/V0.6 (0.5–0.7)1.1 (0.7–1.4)1.0 (1.0–1.0)1.4 (1.2–1.6)
C/V0.3 (0.2–0.3)0.8 (0.5–1.0)0.9 (0.6–1.0)1.3 (0.9–1.9)
V:S:C4:2:11:1:11:1:11:1:1
LPVI70 (50–90)992 (301–1674)880 (548–1087)2080 (1323–2941)
Publisher’s Note: MDPI stays neutral with regard to jurisdictional claims in published maps and institutional affiliations.

