Article

Soil Organic Carbon Distribution, Enzyme Activities, and the Temperature Sensitivity of a Tropical Rainforest in Wuzhishan, Hainan Island

1
Key Laboratory of Agro-Forestry Environmental Processes and Ecological Regulation of Hainan Province, College of Ecology and Environment, Hainan University, Haikou 570228, China
2
College of Tropical crops, Hainan University, Haikou 570228, China
3
International Center for Bamboo and Rattan, Beijing 100102, China
4
College of forestry, Hainan University, Haikou 570228, China
*
Authors to whom correspondence should be addressed.
These authors contributed equally to this work.
Forests 2022, 13(11), 1943; https://doi.org/10.3390/f13111943
Submission received: 17 September 2022 / Revised: 3 November 2022 / Accepted: 12 November 2022 / Published: 17 November 2022
(This article belongs to the Section Forest Soil)

Abstract

:
Soil carbon (C) distribution, which is deeply correlated with soil extracellular enzyme activity and its temperature sensitivity (Q10), are important for predicting the soil organic carbon (SOC) pools under climate warming. However, the high spatial heterogeneity in tropical forest soils makes the predicted results vary significantly. Thus, a total of 87 soil samples of three forest types, eight slope orientations, and four vegetation types were selected from Wuzhishan in Hainan Island, China. SOC distribution, the activities of six soil enzymes, and Q10 at 10, 20, 30, and 40 °C were investigated to supplement the tropical data. The results showed that: (1) SOC ranged from 24.82 to 87.72 g/kg. SOC in the primary forest was significantly higher than that of the secondary forest, and SOC of the cloud forests and hilltop scrub at higher elevations was significantly higher than that of the lowland rainforests and montane rainforests at lower elevations. However, the amount of recalcitrant carbon in the primary forest was the lowest. (2) Under lab temperature conditions, the acid phosphatase and β-1,4-glucosidase in the plantation forest were significantly higher than that of the secondary forest, and the polyphenol oxidase and catalase in the plantation forest were significantly higher than that of the primary forest. Enzyme stoichiometry analysis indicated that microbials were limited by nitrogen in the study area. The six soil enzyme activities were strongly correlated with SOC and total nitrogen. (3) The Q10 of soil enzymes ranged from 0.61 to 1.92 under three temperature gradients. Most hydrolases enzymes (Q10 > 1) showed a positive response with temperatures from 10 to 30 °C, and showed a negative response (Q10 < 1) with temperatures from 30 to 40 °C. We concluded that the negative response of enzyme Q10 with global warming would slow down the SOC decomposition. Primary tropical forests could still sequester SOC; however, their ability to do so may be vulnerable to climate change, as the amount of soil C quality index was low.

1. Introduction

Soil organic carbon (SOC) is the largest pool of carbon (C) in terrestrial ecosystems and plays a very important role in the global balance of greenhouse gases [1,2]. Any small change in the SOC pool can affect atmospheric CO2 concentrations and the progression of climate change in the future [3]. Forests soils account for ~40% of terrestrial belowground C stocks [4,5], and a better understanding of the patterns and controls of SOC in forest ecosystems is important to evaluate soil roles in the global terrestrial carbon cycle and potential feedbacks to global climatic change. At a large scale, temperature is a main influencing factor of SOC [6]. Temperature controls vegetation distribution and SOC decomposition at large and regional scales, and therefore affects the quantity and quality of SOC inputs [7]. On the other hand, temperature affects the rate of SOC decomposition by influencing microbial activity [8]. At a regional level, studies have shown that the distribution patterns of forest SOC vary across vegetation types [9], forest types [10] and topography [11]. For example, studies in the Dinghu Mountain Reserve found that broadleaf forests distribute more SOC than coniferous forests [12]. A study on tropical forests in southern China showed that SOC stock was much higher in natural forests than in secondary forests and plantations [13]. Additionally, in tropical montane rainforests, microenvironmental topography is another main influencing factor for SOC distribution [14]. The distribution patterns of SOC under different environmental conditions at a regional scale remain largely uncertain. Tropical forests have a complex topography and, vegetation pattern and a rapid nutrient cycling with high temperatures [14,15], which makes the prediction of SOC uncertain under global climate change. Therefore, extensive regional field soil survey results are expected to improve assessments of SOC storage, as well as of vertical and spatial patterns of SOC in the tropical forest.
Soil enzymes are mainly biocatalysts secreted by microorganisms which can depolymerize organic C and catalyze the mineralization of soil organic matter [16]. Enzyme activity is highly correlated with microbial respiration and the decomposition of SOC and plays a key role in carbon and nutrient cycling in terrestrial ecosystems [17]. However, studies have found that the soil enzyme activity in different forest types and topographies varies largely [18,19]. A study by Brockett et al. [20] in western Canada on seven different forest types showed that polyphenol oxidase (POX) activity in yellow pine forests was significantly higher than that in other forest types. The effect of different slope orientations on soil enzyme activity also differed [21,22], with β-1,4-glucosidase (BG) and 1,4-β-N-acetylaminoglucosidase (NAG) activity significantly higher on the southern slopes of the Tanggula Mountains than on the northern slopes, but there was no difference in acid phosphatase (AP) and leucine aminopeptidase (LAP) across slope orientations [22]. Generally, temperature is considered to be the main environmental factors affecting enzyme activity [23]. This is because each enzyme has its own optimum temperature, below which enzyme activity decreases due to inactivation. Exceeding the optimum temperature, the enzyme denatures and nutrient availability decreases, resulting in decreased activity [24]. Studies have found that enzyme activities increased with warming and resulted in SOC decreasing [25]. However, negative and nonresponse results of enzyme activity to warming and hence SOC were also found [26]. This might be because the sensitivity of enzyme activity in different regions varied with temperature changes. The temperature sensitivity index (Q10) of enzyme activities, which characterizes the rate of change in soil enzyme activity per 10 °C increase in temperature, is a key predictor of the effect of temperature on microbial C, nitrogen (N), and phosphorus (P) metabolism [27,28]. Many studies have observed large spatial and temporal variability in enzyme activity Q10. For example, in southwestern Germany, there are significant seasonal variations in Q10 for BG and POX [29]. In southern California, most enzymes were found to be more sensitive to temperature in colder regions than in warmer regions [27], which may be due to the thermal adaptation of enzymes in a higher temperature environment. Therefore, further study of enzymes and their Q10 in forest soil is still needed.
The Wuzhishan National Nature Reserve is one of the nature reserves with the largest number of tropical vegetation types, the most complete vertical banding spectrum of vegetation and the most typical rainforest communities on Hainan Island [30,31]. It is an ideal site for studying SOC distribution and enzyme activity in a heterogeneous environment in the tropical region. Therefore, soils from three forest types, eight slope orientations, and four vegetation types were selected for study in the Wuzhishan. The SOC distribution and the activities of six soil enzymes related to the C, N, and P cycle (AP, BG, NAG, LAP, POX, and catalase [CAT]) were studied. Meanwhile, the Q10 of enzyme activities were also investigated. The objectives of the study were (1) to characterize the soil SOC and enzyme activities under different forest types, slope orientations, and vegetation types; and (2) to characterize the Q10 of different soil enzymes under different environmental conditions in tropical regions and to test if enzyme activity in tropical areas had thermal adaptability. The study could further understandings of the distribution of SOC and soil enzyme activities and provide knowledge of the feedback of soil enzymes under global warming in tropical regions.

2. Materials and Methods
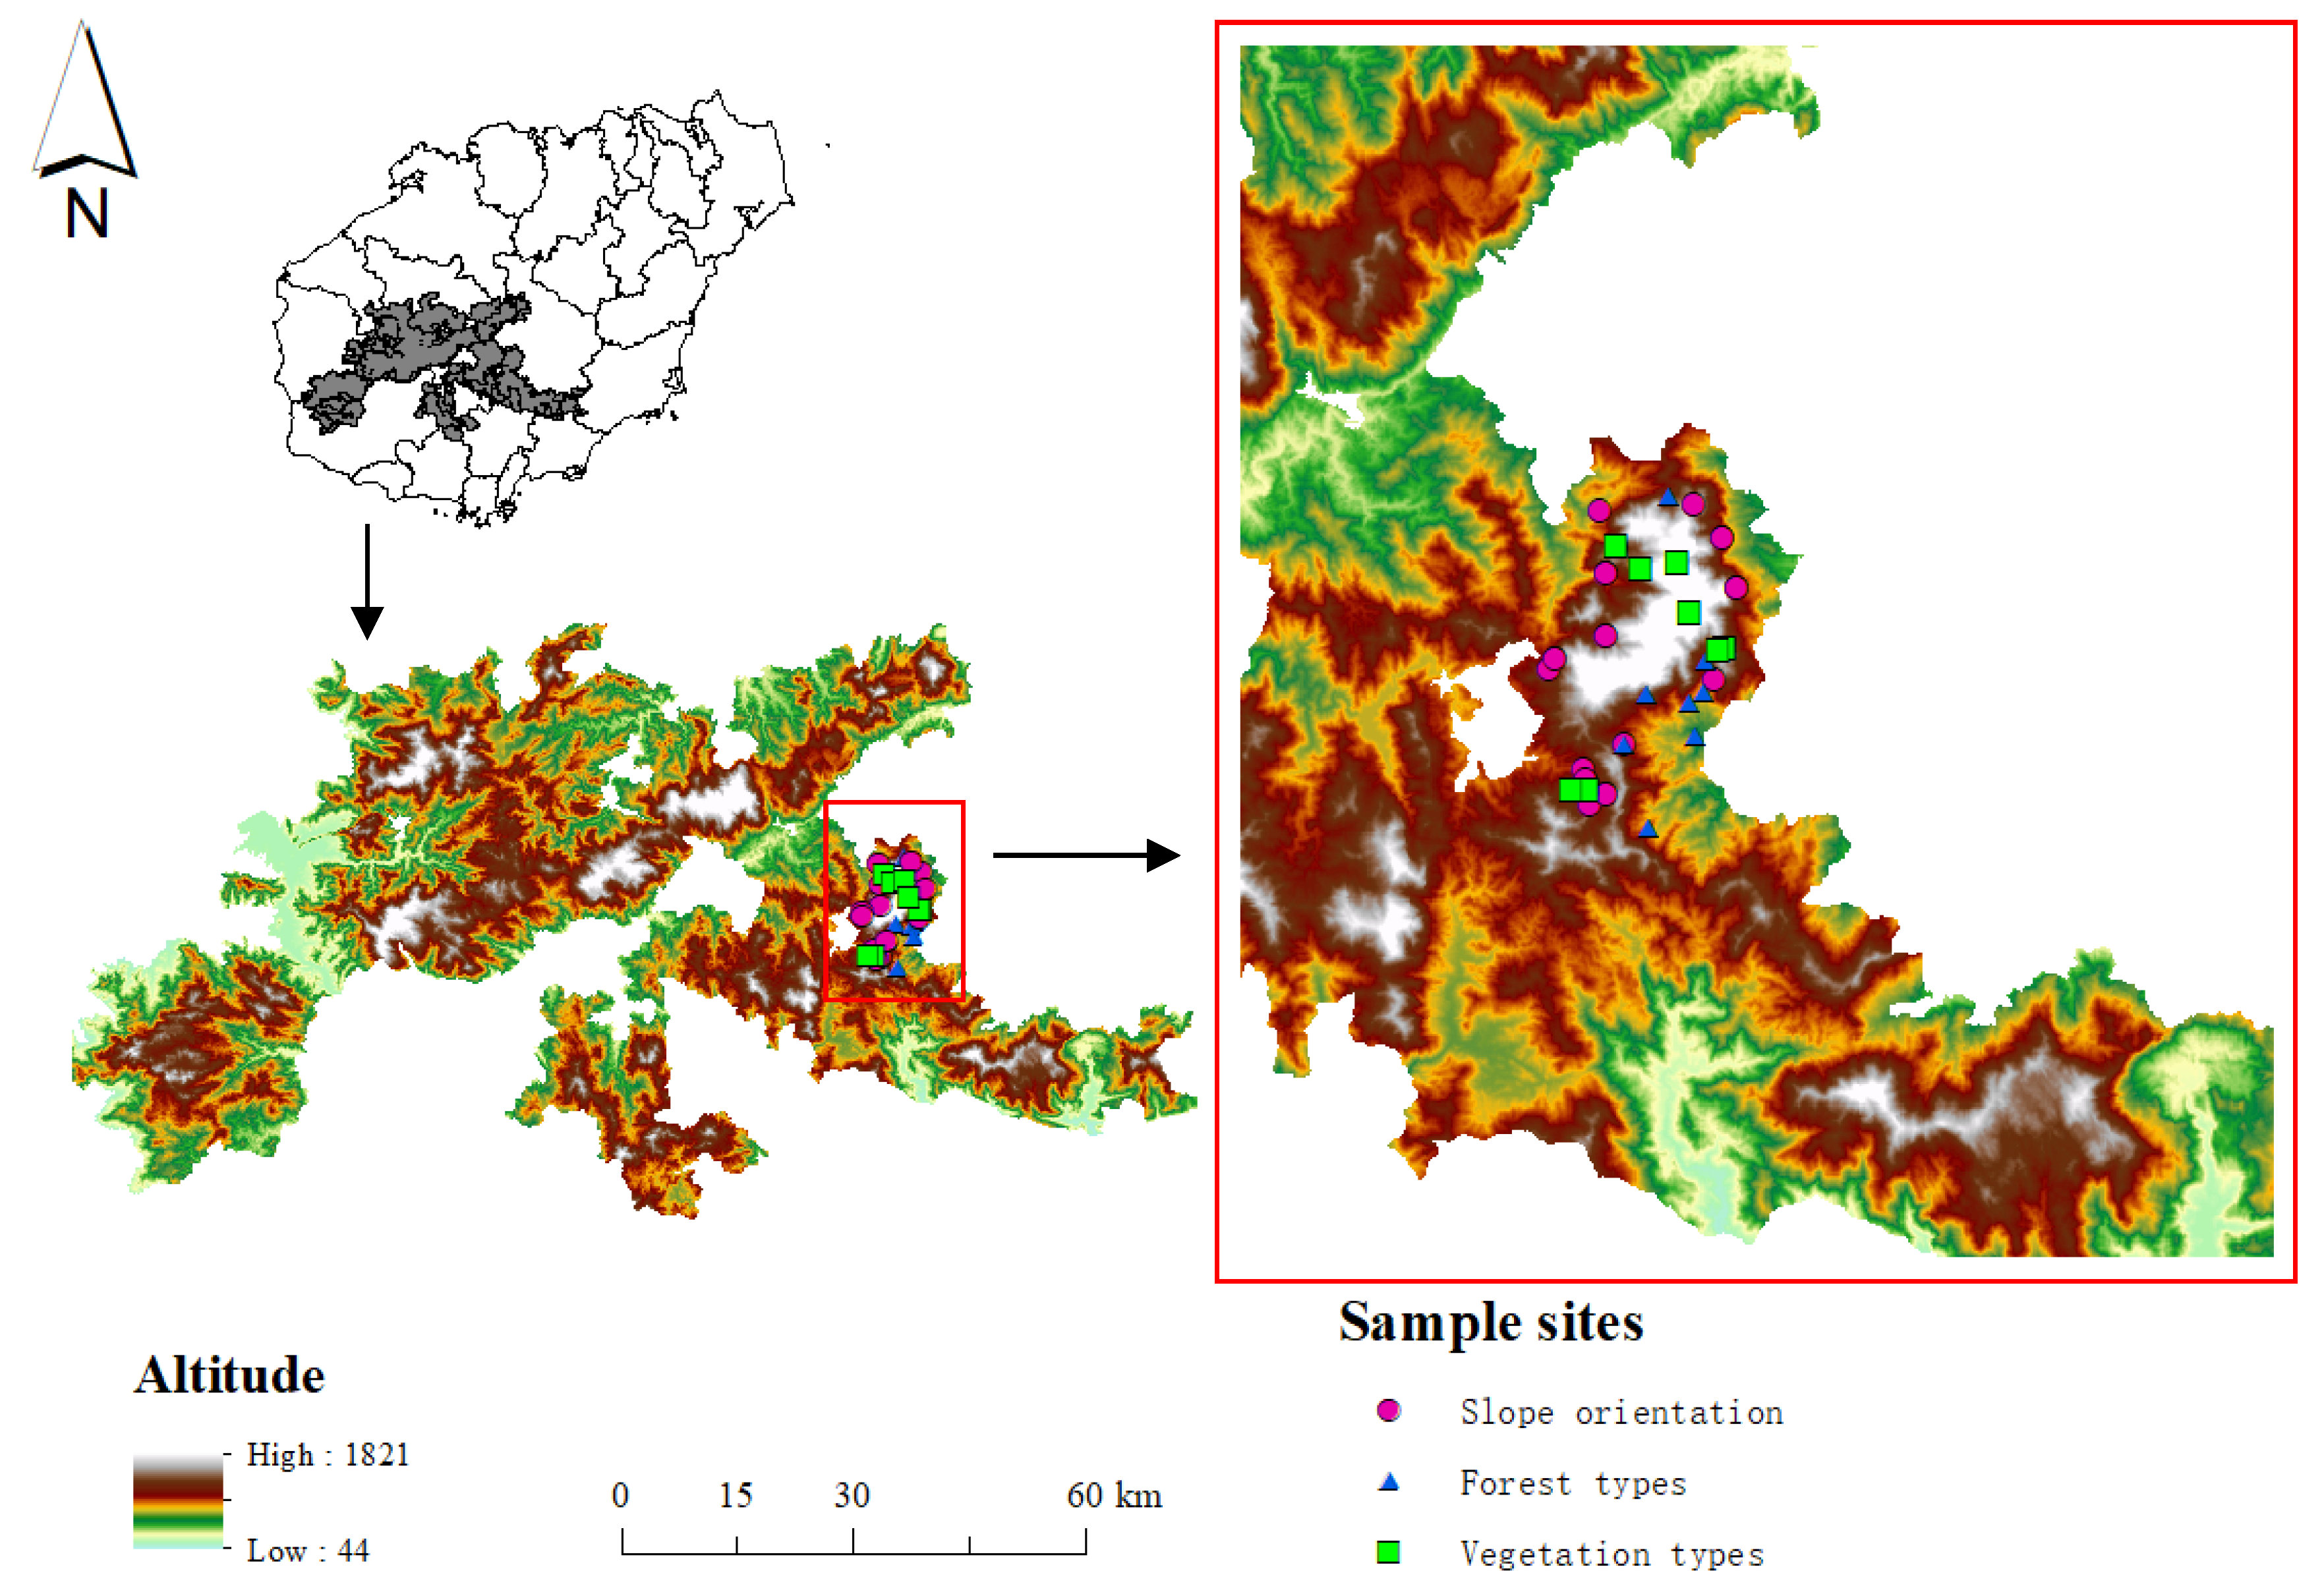
2.1. Study Area

The Wuzhishan National Nature Reserve is located in the south-central part of Hainan Island (18°48′59″–18°59′07″ N, 109°32′03″–109°43′19″ E) [32], with an altitude of 278–1867 m. It belongs to the tropical monsoon climate, with a mean annual temperature (MAT) of 22.4 °C and mean annual precipitation (MAP) of 2307.9–2488.3 mm. The soil is mainly mountain yellow loam, mountain red loam, and scrub meadow soil. The forest cover of the reserve is 86.7%, and different vegetation types are distributed along the altitude gradient, which mainly includes lowland rainforest, montane rainforest, cloud forest, and hilltop scrub [31]. Three main types of tropical forests owing to human intervention are distributed in this area: primary forest, secondary forest, and plantation forest.

2.2. Soil Sample Collection

Typical plantation forest, secondary forest, and primary forest in Wuzhishan, Hainan were selected. Three sample sites were chosen in each forest type, and three sampling plots were selected within each sample site. Each sampling plot was sampled for 0–10 cm of topsoil according to the five-point sampling method, and finally the soils from the five points were mixed into one sample (Figure 1). Additionally, eight slope orientations with similar slope and elevation (namely E, S (sunny slope), W, N (shady slope), ES, EN, WS, and WN) and four vegetation types (namely lowland rainforest, montane rainforest, cloud forest, and hilltop scrub) were selected. Two large sample sites were set up for each slope orientation and vegetation type, and three sampling plots were selected within each sample site. Each sampling plot was also sampled for 0–10 cm of topsoil following a five-point sampling method, after which the soil from the five points was mixed as a replicate. All soil samples were sampled after the removal of surface litter, placed in self-sealing bags, and then taken back to the laboratory for cold storage. Subsequently, these soil samples were passed through the 2-mm sieve to remove plant roots and debris stones. A portion of the fresh soil was stored at 4 °C for enzyme activity and temperature sensitivity experiments, while the remaining soil samples were air dried and passed through the 0.15-mm sieve to measure SOC and other physicochemical properties. Due to the different division criteria, the second sample plots of the plantation forest used the same three soil samples as the first sample plots of the montane rainforest, and the third sample plots of the plantation forest used the same three soil samples as the first sample plots of WS. Additionally, the two sample plots of the lowland rainforest used the same six soil samples as N. Eighty-seven soil samples were collected.

2.3. Sample Analysis

A pH meter was used to determine soil pH (water–soil ratio of 2.5:1), and soil water content was determined by the drying and weighing method. SOC was measured using the potassium dichromate oxidation external heating method [33]. Total nitrogen (TN) and total phosphorus (TP) were extracted by the semi-micro Kjeldahl method and determined by a fully automated flow analyzer [14].
Six enzymes (four hydrolases and two oxidases) related to C, N, and P cycles were measured, including C-cycling enzymes (BG, POX, CAT), N-cycling enzymes (NAG, LAP), and P-cycling enzyme (AP). Enzyme activities were measured by microplate fluorometric assay with reference to the method of Saiya-Cork et al. [34]. The substrates for hydrolase and oxidase were methylumbelliferone and L-dihydroxyphenylalanine, respectively. To measure the Q10 of enzyme activities, four temperature gradients (10, 20, 30, and 40 °C) were built for incubating the samples. Specifically, 1 g of soil sample was added to 125 mL of sodium acetate buffer and stirred for 5 min with a magnetic mixer to obtain a soil suspension. Blank wells, standard wells, negative control wells, and sample wells were set up. The soil suspension, buffer, and substrate working solution were then added to the 96-well microtiter plate. Different enzymes corresponded to different substrate working solutions. Hydrolases were incubated for 4 h at different temperature gradients, and the reaction was terminated by adding 10 μL of 1 mol NaOH solution to each well. The oxidized enzymes were incubated for 24 h and measured by an enzyme marker. The excitation wavelength of both hydrolases and oxidases was measured at 365 nm; however, the emission wavelength of these two types of enzymes was measured at 450 nm and 460 nm, respectively.

2.4. Data Analysis

The Q10 was calculated using the following equation [35]:
K = (LnRT2 − LnRT1)/(T2 − T1)
Q10 = e10K
where K is the exponential constant used to describe the activity response with temperature, and RT1 and RT2 are the soil enzyme activities at two temperatures (T1 and T2), respectively.
The soil carbon quality index (CQI), which can effectively assess the percentage of recalcitrant C in soil organic matter, was calculated using the following equation [36]:
CQI = ln(POX)/(lnPOX + lnBG)
where a higher CQI indicates a higher percentage of recalcitrant C.
Soil enzyme stoichiometry balance regulates microorganism nutrient distribution and determines enzyme secretions, so as to require the most limited nutrients according to nutrient allocation theory [37]. The vector analysis reflects the enzyme stoichiometry balance deviation and was calculated to reflect the nutrient limitation of microorganisms [38]. The formular is as follows:
Vector Length = SQRT(x2 + y2)
Vector Angle = DEGREES(ATAN2(y, x))
where x represents the relative activity of C and N acquisition enzymes and y represents the relative activity of C and P acquisition enzymes. A longer vector length indicates greater C limitation. Vector angles > 45° and <45° indicate the relative degree of P limitation and N limitation, respectively.
Statistical analyses were performed using SPSS (22.0) software. One-way ANOVA and significance test were used to determine the differences of SOC, N, P, and their chemometrics among forest types, slope orientations, and vegetation types (p < 0.05). The SOC was used as the dependent variable, and other soil physical and chemical property indexes were used as independent variables for GLM regression. A heat map of Pearson correlation analysis was perfected with R (4.1.2). Plotting was completed with Origin (v. 2017) software. RDA analysis was performed with Canoco 5 (v5.02).

3. Results

3.1. SOC of Different Forest Types, Slope Orientations, and Vegetation Types

The SOC ranged from 24.82 to 87.72 g/kg (Table 1). Among the three types of forest, the greatest amount of SOC was found in primary forest (32.25 g/kg), followed by plantation forest (28.96 g/kg) and secondary forest (24.82 g/kg). Similarly, the SOC of cloud forest (87.72 g/kg) and hilltop scrub (86.07 g/kg) were significantly higher those of lowland rainforest (36.91 g/kg) and montane rainforest (33.49 g/kg). For different slope directions, the highest SOC was 56.30 g/kg on the southeast slope, which was 52% higher than the lowest SOC on the south slope (27.08 g/kg).

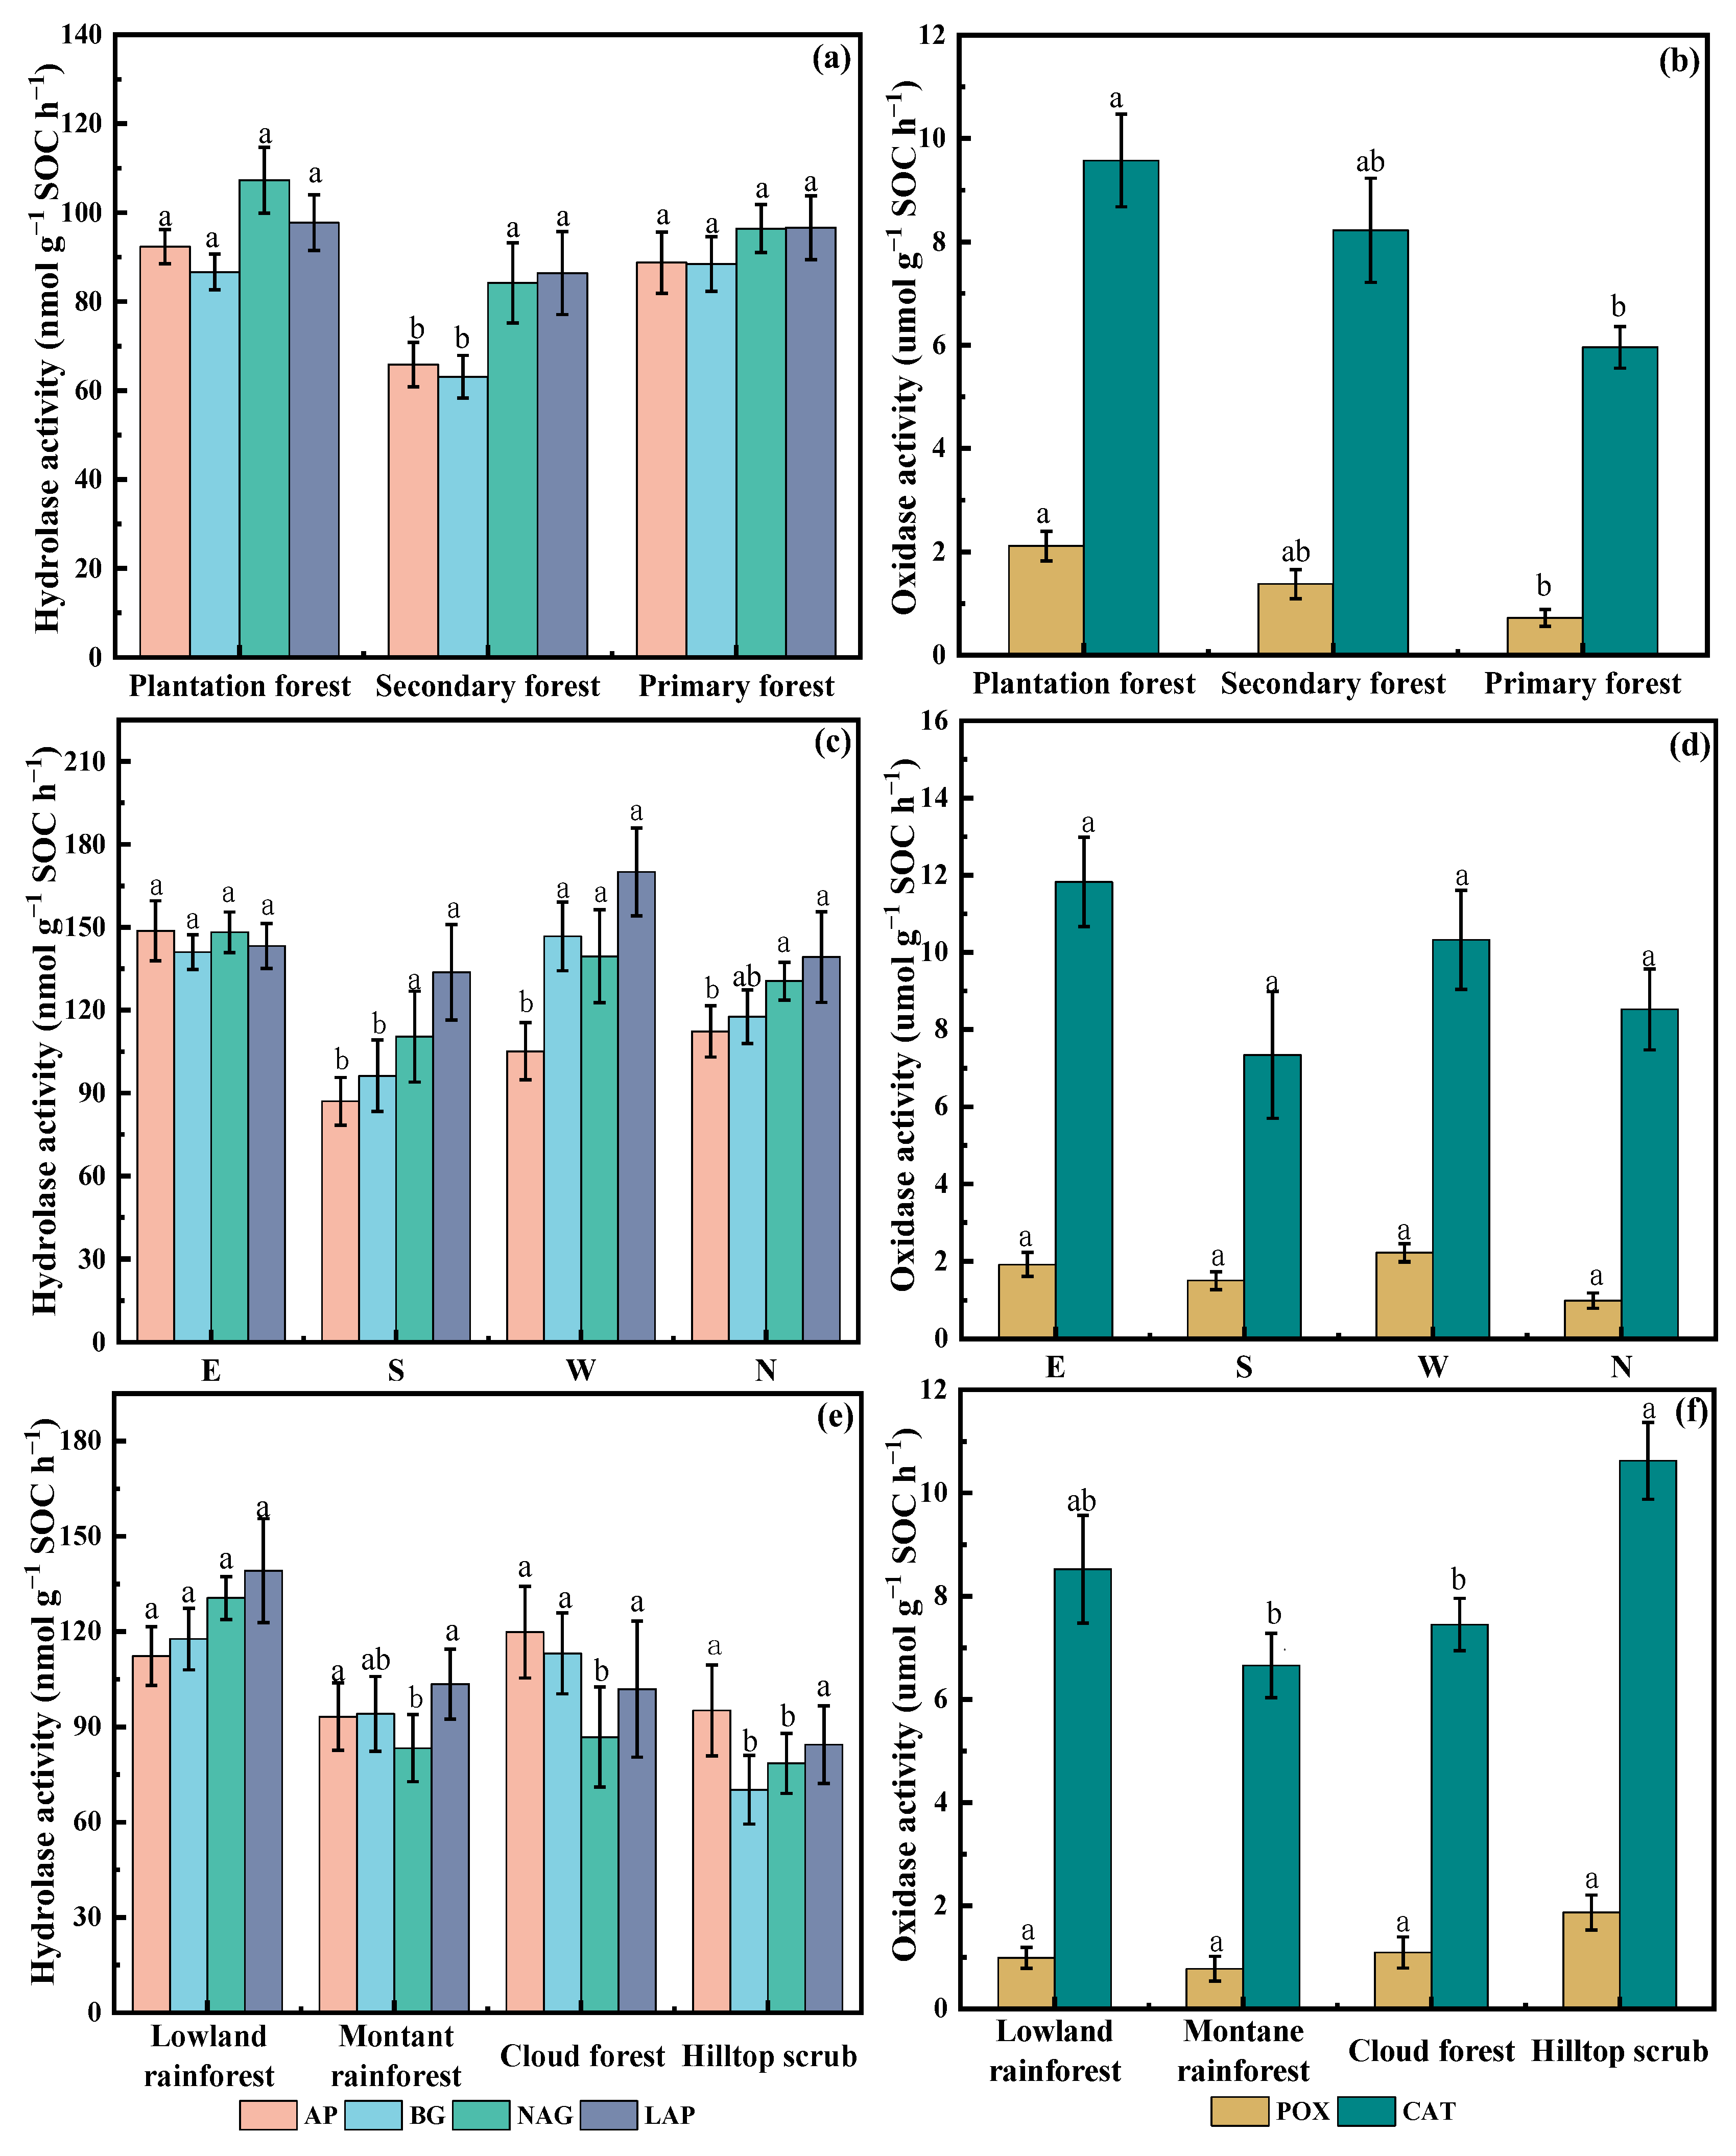
3.2. Characteristics of Soil Enzyme Activities in Different Forest Types, Slope Orientations, and Vegetation Types

The AP and BG activities in the plantation forest and primary forest were significantly higher than those of secondary forest. The POX and CAT activities decreased sequentially from plantation to secondary and primary forest, and those in the plantation forest were significantly higher than those in the primary forest (Figure 2a,b).
For different slope orientations, the highest AP activity (148.73 nmol g−1 SOC h−1) was found on the eastern slope and was significantly higher than that of the other three slope orientations. There was no significant difference in oxidase activity among slope orientations (Figure 2c,d).
Among the four vegetation types, the BG activity in the lowland rainforest (117.67 nmol g−1 SOC h−1) and cloud forest (113.12 nmol g−1 SOC h−1) was significantly higher than that of hilltop scrub (70.21 nmol g−1 SOC h−1), and NAG activity in the lowland rainforest (130.56 nmol g−1 SOC h−1) was significantly higher than that of the other vegetation types. The CAT activity in the hilltop scrub (10.62 μ mol g−1 SOC h−1) was significantly higher than that of montane rainforest (6.66 μ mol g−1 SOC h−1) and cloud forest (7.45 μ mol g−1 SOC h−1), while no significant differences for POX activity were found among different vegetations (Figure 2e,f).
The microbial soil nutrient limitation conditions which were revealed by vector length and vector angle showed no significant difference in all forest types, slope orientations, or vegetation types. Microbials were limited by N as the vector angles were <45° (Table 1). As indicated by CQI, the C was more stable in plantation forest (0.63) and secondary forest (0.63) than in primary forest (0.58), but there was no difference among vegetation types and slope orientations (Table 1).

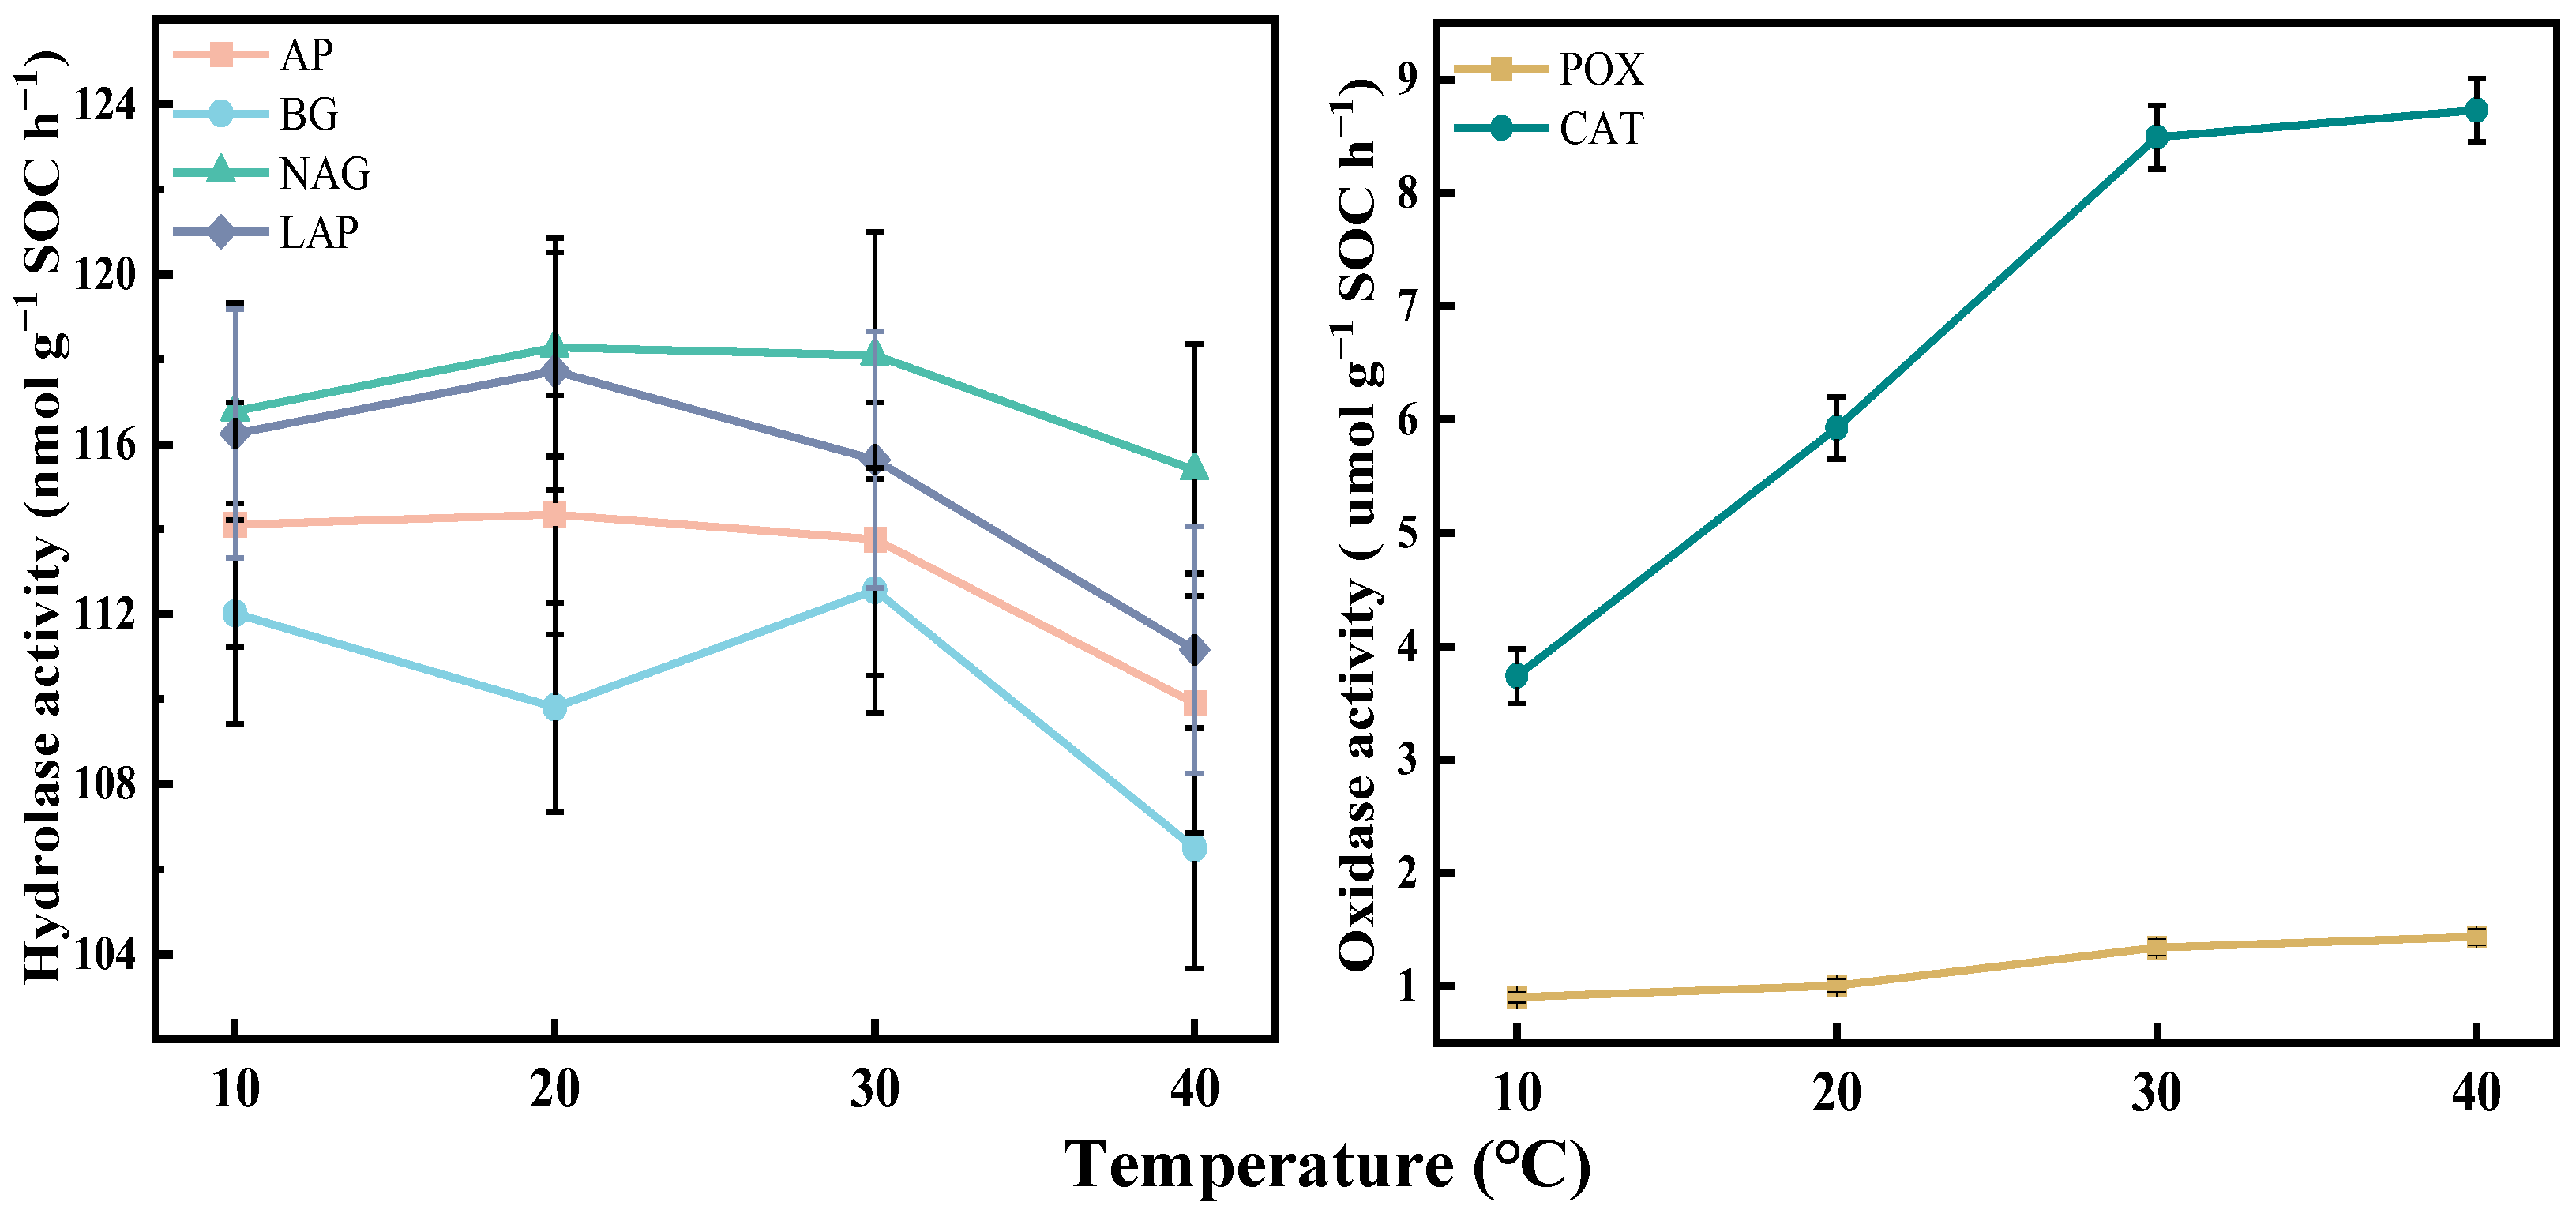
3.3. Temperature-Sensitive Characteristics of Soil Enzyme Activity

The activities of four hydrolytic enzymes varied less with temperatures between 10 and 30 °C, but they decreased when the temperature increased from 30 to 40 °C (Figure 3). The activities of the two oxidative enzymes increased when the temperature increased from 10 to 40 °C (Figure 3).
The Q10 of soil enzyme activities is shown in Table 2. In the plantation forest, the Q10 of all six enzymes first increased and then decreased with the increase in temperature. For four hydrolases, as the temperature increased from 20 to 30 °C, the Q10 > 1. As the temperature increased from 30 to 40 °C, Q10 < 1, they were insensitive to changes in temperature in the high temperature interval (from 30 to 40 °C). In the secondary forest, the Q10 of CAT decreased with increased temperature, but other enzymes were negatively responsive to the temperature from 30 to 40 °C (Table 2).
The responses of different enzymes to temperature on slope orientations were different. The Q10 of hydrolases was 0.85–1.12 among slope orientation. The Q10 (>1) of four hydrolases on the eastern slope showed a positive response with temperatures from 30 to 40 °C. The Q10 of CAT on all four slope orientations gradually decreased with increasing temperature and showed a positive response with temperatures from 10 to 30 °C; however, there was a negative response with temperatures from 30 to 40 °C (Table 2).
The Q10 of hydrolases in the four vegetation types ranged from 0.68 to 1.13. The Q10 of NAG from 30 to 40 °C and Q10 of LAP from 20 to 30 °C were all less than 1 and showed a negative response with temperature. The Q10 of AP and BG responded positively with temperatures from 10 to 20 °C in most vegetation types except for AP in the hilltop scrub. In all cases, the Q10 of CAT decreased with temperature in the lowland rainforest and montane rainforest (Table 2).
Overall, the Q10 of AP, BG, and LAP showed positive responses between 10 and 20 °C in most vegetation types. The Q10 of CAT showed a positive response with temperatures from 10 to 30 °C among all forest types and vegetation types. The Q10 range for oxidase (0.62–1.92) was slightly larger than that of hydrolase (0.68–1.16).

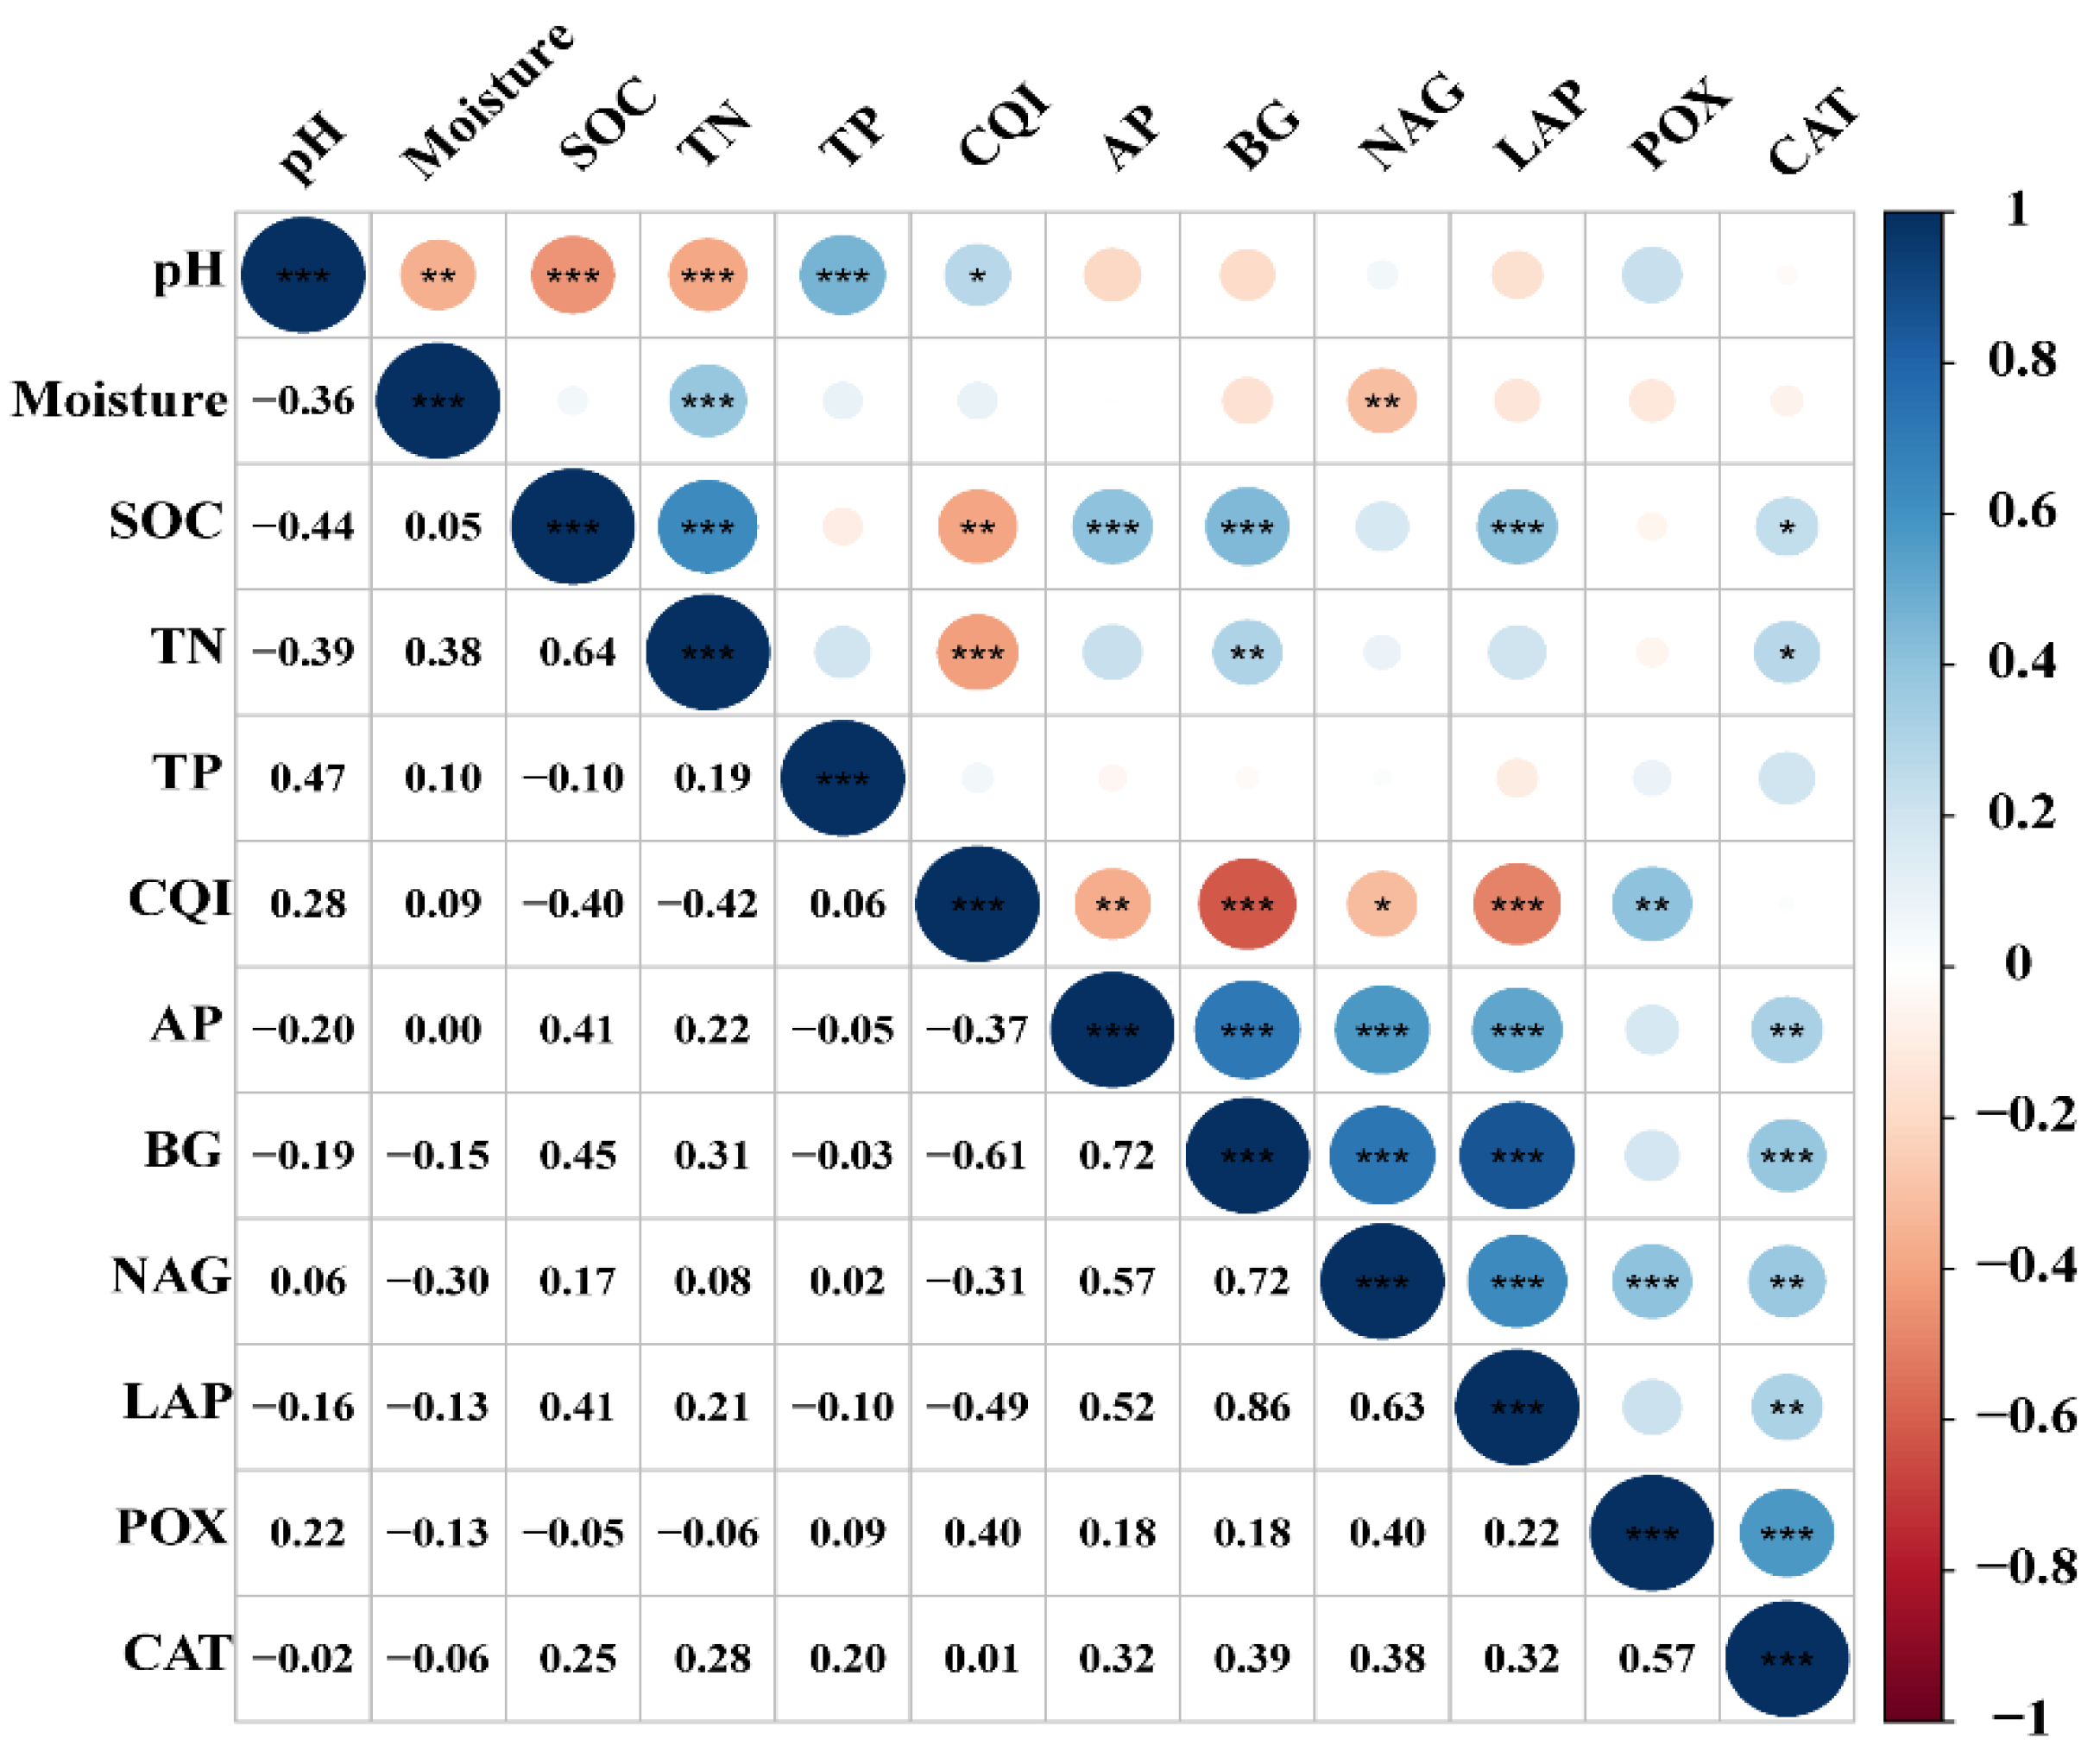
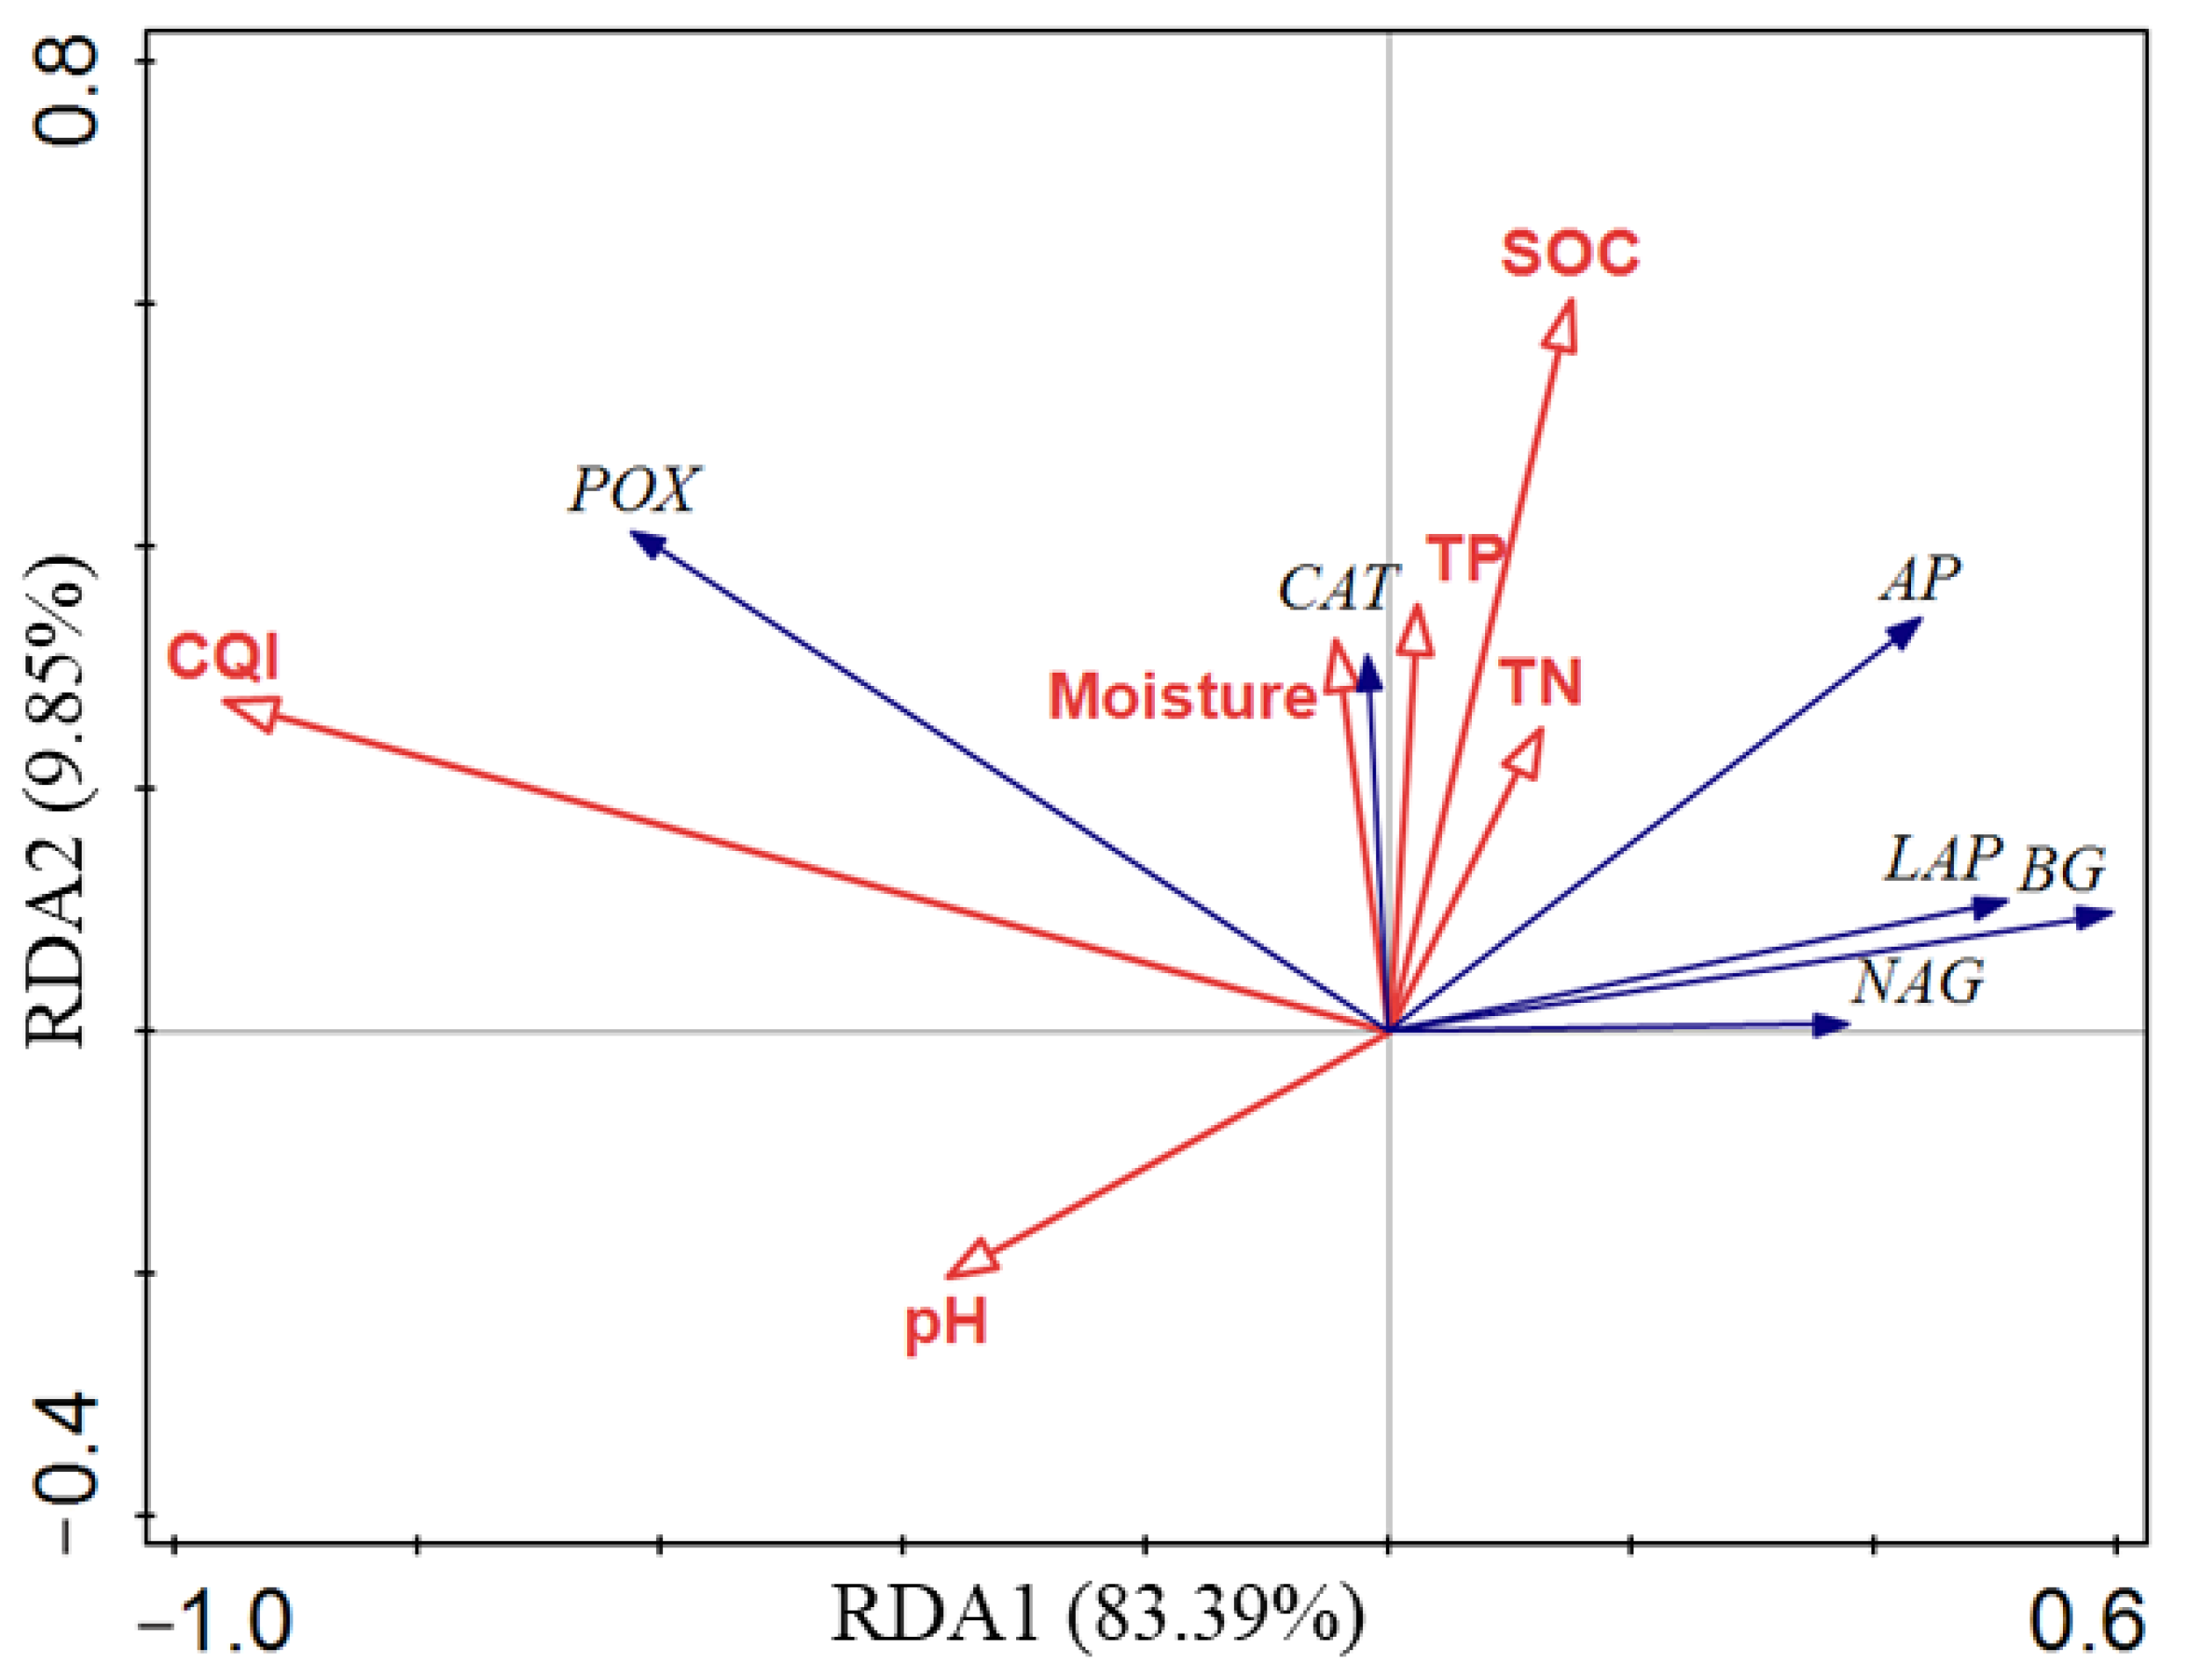
3.4. Relationship between Soil Enzyme Activity, SOC, and Other Soil Properties

SOC was significantly and positively correlated with TN, moisture, AP, BG, CAT, and LAP (p < 0.001), but negatively correlated with pH (p < 0.001). There was a significant negative correlation between CQI and four hydrolytic enzymes, but a positive correlation between CQI and POX. These six soil enzymes were all significantly and positively correlated with each other (Figure 4).
The best-fit model of the GLM regression could be expressed as follows:
SOC = 18.047 × TN − 9.938 × pH + 51.629 (R2 = 0.70, p < 0.05)
The results from the RDA analysis showed that NAG, BG, LAP, AP, and CAT were positively correlated with SOC, TN, and TP (Figure 5). Furthermore, CAT was positively correlated with soil moisture. POX was positively correlated with soil moisture, CQI, and pH.

4. Discussion

4.1. SOC and Enzyme Activity Distribution in Tropical Forests

In this study, we found SOC had a high heterogeneity among different forest types, vegetation types, and slope orientations (Table 1). The SOC of primary forest (32.25 g/kg) was higher than the average SOC (11.12 g/kg) of surface soil in China [39] and the Elaeocarpus sylvestris plantation forest (22.96 g/kg) in Guangdong Province [40]. SOC in the primary forest was also significantly higher than that of the secondary forest (Table 1), which is consistent with results found in the Xiaoxing’an Mountains [41]. Compared with secondary forest, there was much more litter in the primary forest due to less disturbance in this study area, which was beneficial to SOC accumulation [42]. This result illustrated that old-growth forests can accumulate C in soils. However, the SOC in primary forest might be vulnerable to climate warming as the recalcitrant C percentage (CQI) was low compared with other forest types (Table 1). Correlation analysis and RDA analysis illustrated that SOC was positively correlated with TN, AP, and BG activities and was negatively correlated with soil pH (Figure 4 and Figure 5). This means that the aggregated activity of enzymes for acquiring N and P helps SOC accumulation, which fits the nutrients allocation theory [43]. The AP and BG activity in the primary forest was significantly higher than that of the secondary forest in this study (Figure 2a). Vector analysis showed that microorganisms in this primary forest were limited by N, and soil TP in the primary forest was also low (Table 1) which was at very deficient (0.2 to 0.4 g/kg) and extremely deficient levels (<0.2 g/kg) [44]. Limited N and P in the primary forest drove microorganisms to secrete more AP and BG enzymes to acquire the nutrients according to the nutrients allocation theory [45] (Figure 2a) and resulted in the recalcitrant C being decomposed as N and P were often shielded in relative recalcitrant organic matter [46]. In conclusion, in N and P-limited forests, microorganisms’ urgent need for N and P increases the recalcitrant C pool consumption and active C pool aggregation.
In addition, SOC showed an extremely significant negative correlation with pH (Figure 4), which indicated that soil acidification aggregation was beneficial to SOC accumulation [47]. Soil pH in the primary forest was significantly lower than in the plantation forest (Table 1), which supports the results of Zhang et al., who found that forest succession can significantly decrease pH value in topsoil [48]. Soil acidification inhibited the activities of soil microbial, as the most suitable pH for soil microbial is generally in the neutral range of 6.5–7.5 [49]. Studies have shown that pH value was negatively correlated with hydrolase activity [50]. However, in primary tropical forest where the pH was the lowest, hydrolase enzymes activities were not significantly inhibited (Figure 2a), while the activities of POX and CAT decreased sequentially in plantation, secondary, and primary forests (Figure 2b). POX and CAT are commonly used to describe the decomposition of recalcitrant C [34]. It may be that pH inhibits oxidase activities and slows down the SOC decomposition procession in this tropical primary forest.
Among vegetation types, SOC in the cloud forest and hilltop scrub at higher altitudes was significantly higher than that of the lowland rainforest and montane rainforest (Table 1). This result was consistent with another study that found SOC distributed at higher altitudes compared with low altitudes because higher altitudes had relatively slow litter decomposition and a thicker humus layer [51]. The hydrolase enzyme activities were low in the cloud forest and hilltop scrub which were distributed at higher altitudes (Figure 2e).
In terms of slope orientations, SOC on the northern slopes was higher than that of the southern slopes (Table 1). Soil temperature and moisture varied greatly on different slope orientations, which resulted in differences in organic matter decomposition among slope orientations [52]. The difference in soil temperature between shady and sunny slopes was caused by the intensity of light, which had an impact on soil nutrients and microbial activities [53]. The shady slope had relatively vigorous vegetation growth, relatively stable soil temperature, and a cool and moist soil environment, which was conducive to microbial activity, resulting in higher enzyme activity [54]. In this study, all enzyme activities (POX excluded) on the north slope (shady slope) were higher than those on the south slope (sunny slope) (Figure 2c,d), which is consistent with the findings of Shen et al. [54].

4.2. Responses of Soil Enzyme Activities to Temperature Increase in the Tropical Rainforest

In this study, hydrolase enzyme activities and oxidase activities responded differently to warming. Enzyme activities were more easily inhibited at higher temperatures, while they increased at a relatively low temperature (10–30 °C) (Figure 3). The hydrolase enzyme activities increased slowly at temperatures ranging from 10 to 30 °C and rapidly decreased at temperatures ranging from 30 to 40 °C. In contrast, the oxidase activities increased with temperatures from 10 to 40 °C and especially from 10 to 30 °C (Figure 3). It has been shown that global warming can significantly increase the rate of enzymatic reactions and accelerate the respiration of soil microorganisms [55]. However, long-term global warming may cause soil microbial communities to adapt to environmental changes, causing an adaptive shift in extracellular enzyme activity as well, thus reducing their physiological activity at high temperatures [56]. The mean annual temperature in the study area is 22.4 °C, which is suitable for enzymes and might result in more C being decomposed.
In this study, the sensitivity of enzyme activity to temperature was low, as we found the Q10 of soil extracellular enzymes ranged from 0.61 to 1.92 among the three forest types, four slope orientations, and four vegetation types (Table 2), which was less than 2 [57]. The range of variation was slightly higher than that in the moist forests of the Peruvian Andes (1.4–2.0) [56] and the temperate grasslands of northwestern Xinjiang, China (0.97–1.11) [23], and relatively lower than the Q10 of Arctic soil enzymes (1.5–3.0) [35]. In addition, the Q10 of different soil extracellular enzymes varied greatly with forest, vegetation, and slope (Table 2), which is consistent with the results of Razavia et al. [58]. As shown in Table 2, the Q10 of all the enzymes was larger than 1 at temperatures ranging from 20 to 30 °C in plantation forest; Q10 of the two oxidase enzymes in primary forest was larger than 1 from 10 to 40 °C; and Q10 of hydrolase enzymes were almost all less than 1 from 10 to 40 °C. The AP, BG, and LAP among vegetation types showed positive responses with temperatures from 10 to 20 °C and became insensitive to temperatures from 30 to 40 °C, suggesting that the response of SOM decomposition might not always be positive with temperature increases [59]. Studies found Q10 increased at temperatures ranging from 16 to 22 °C [60]. The Q10 of hydrolase enzymes among different slopes ranged between 0.85 and 1.12, which was relatively close to 1 (Table 2). A short-term study in Germany found that Q10 values for hydrolase enzyme activities varied from 1.5 to 1.9 within the 10–30 °C range and decreased to 1.4 with increasing temperature (30–40 °C) [61]. Additionally, studies in grassland found the Q10 of BG enzymes was significantly higher at 4–20 °C (2 < Q10 < 8) than at 20–37 °C (Q10 < 3) [57]. The extant results indicated that soil microorganisms have different optimum temperatures for secreting different enzymes [62]. In this study, the oxidase enzymes had greater responses than the hydrolase enzymes at higher temperature ranges, which may have resulted in more recalcitrant carbon decomposing with global warming.
In this study, we only measured the instantaneous values of soil enzymes activity at four temperatures (10, 20, 30, and 40 °C), and found that there were almost no differences in Q10 value across six enzymes. This may have been because the microbial biomass and metabolic capability were unchanged without incubation in temperature gradients. Thus, in future research, we would incubate soil samples collected from fields to investigate the enzyme activity temperate sensitivity and corresponding microbial biomass. Additionally, soil N and pH play important roles in influencing SOC by altering the enzymes activity directly, while N deposition was expected to bring in soil acidification. How SOC stock and stability may change in the future according to aggregated N deposition in this study area and the underlying mechanism still requires exploration. Thus, in future research, we would also conduct a N addition experiment in the study area to separate the effects of N deposition and soil acidification on SOC to illustrate the SOC response mechanisms.

5. Conclusions

SOC was significantly different among forest types and vegetation types. The primary tropical forest could still sequester SOC; however, it might be vulnerable to climate change as the recalcitrant C percentage was low. In this tropical forest, limited N and P drove microorganisms to secrete more AP and BG enzymes to acquire nutrients according to the nutrient allocation theory and thus increased the consumption of the recalcitrant C pool. pH was found to inhibit oxidase activities and slow down the SOC decomposition process. The responses of hydrolase activities and oxidase activities to warming were different. Enzyme activities were more easily inhibited at higher temperatures (30–40 °C), while lower temperatures (10–30 °C) could promote increased enzyme activities. Overall, the sensitivity of enzyme activity to temperature was low. It was concluded that the negative response of enzyme Q10 under global warming would decrease the SOC decomposition rate. The instantaneous values of soil enzyme activities were measured at four temperatures which might result in the nonsignificant response of the six enzymes.

Author Contributions

Conceptualization, X.W. and W.L. (Wenjie Liu); methodology, X.W. and G.X.; software, S.M.; formal analysis, J.L. (Jialing Li); investigation, J.L. (Jialing Li); resources, W.X.; data curation, X.W.; writing—original draft preparation, X.W.; writing—review and editing, W.L. (Wenjie Liu), Y.J., J.L. (Jingli Lu) and H.Y.; visualization, Q.Y.; supervision, W.L. (Wenxing Long).; funding acquisition, W.L. (Wenjie Liu). All authors have read and agreed to the published version of the manuscript.

Funding

This research was supported by the National Key Research and Development Program of China (No. 2021YFD2200403-04), the National Natural Science Foundation of China (No. 32160291) and the Natural Science Foundation of Hainan province (No. 2019RC012).

Acknowledgments

The authors would like to thank the editor and reviewers for their insightful comments and suggestions.

Conflicts of Interest

The authors declare no conflict of interest.

References

  1. Adhikari, K.; Owens, P.R.; Libohova, Z.; Miller, D.M.; Wills, S.A.; Nemecek, J. Assessing soil organic carbon stock of Wisconsin, USA and its fate under future land use and climate change. Sci. Total Environ. 2019, 667, 833–845. [Google Scholar] [CrossRef] [PubMed]
  2. Liu, C.; Tian, H.; Gu, X.; Li, N.; Zhao, X.; Lei, M.; Alharbi, H.; Megharaj, M.; He, W.; Kuzyakov, Y. Catalytic efficiency of soil enzymes explains temperature sensitivity: Insights from physiological theory. Sci. Total Environ. 2022, 822, 153365. [Google Scholar] [CrossRef] [PubMed]
  3. Yang, W.; Li, N.; Leng, X.; Qiao, Y.; Cheng, X.; An, S. The impact of sea embankment reclamation on soil organic carbon and nitrogen pools in invasive Spartina alterniflora and native Suaeda salsa salt marshes in eastern China. Ecol. Eng. 2016, 97, 582–592. [Google Scholar] [CrossRef]
  4. Zhao, B.; Cao, J.; Geng, Y.; Zhao, X.; von Gadow, K. Inconsistent responses of soil respiration and its components to thinning intensity in a Pinus tabuliformis plantation in northern China. Agric. For. Meteorol. 2019, 265, 370–380. [Google Scholar] [CrossRef]
  5. Zhang, D.; Cai, X.; Diao, L.; Wang, Y.; Wang, J.; An, S.; Cheng, X.; Yang, W. Changes in soil organic carbon and nitrogen pool sizes, dynamics, and biochemical stability during ∼160 years natural vegetation restoration on the Loess Plateau, China. CATENA 2022, 211, 106014. [Google Scholar] [CrossRef]
  6. Wang, C.; Houlton, B.Z.; Liu, D.; Hou, J.; Cheng, W.; Bai, E. Stable isotopic constraints on global soil organic carbon turnover. Biogeosciences 2018, 15, 987–995. [Google Scholar] [CrossRef] [Green Version]
  7. Zeh, L.; Limpens, J.; Erhagen, B.; Bragazza, L.; Kalbitz, K. Plant functional types and temperature control carbon input via roots in peatland soils. Plant Soil 2019, 438, 19–38. [Google Scholar] [CrossRef]
  8. Conant, R.T.; Ryan, M.G.; Ågren, G.I.; Birge, H.E.; Davidson, E.A.; Eliasson, P.E.; Evans, S.E.; Frey, S.D.; Giardina, C.P.; Hopkins, F.M.; et al. Temperature and soil organic matter decomposition rates—Synthesis of current knowledge and a way forward. Glob. Chang. Biol. 2011, 17, 3392–3404. [Google Scholar] [CrossRef]
  9. Varik, M.; Aosaar, J.; Ostonen, I.; Lõhmus, K.; Uri, V. Carbon and nitrogen accumulation in belowground tree biomass in a chronosequence of silver birch stands. For. Ecol. Manag. 2013, 302, 62–70. [Google Scholar] [CrossRef]
  10. Ma, J.; Bu, R.; Liu, M.; Chang, Y.; Qin, Q.; Hu, Y. Ecosystem carbon storage distribution between plant and soil in different forest types in Northeastern China. Ecol. Eng. 2015, 81, 353–362. [Google Scholar] [CrossRef]
  11. Chaturvedi, R.K.; Raghubanshi, A.S. Aboveground biomass estimation of small diameter woody species of tropical dry forest. New For. 2013, 44, 509–519. [Google Scholar] [CrossRef]
  12. Su, F.; Xu, S.; Sayer, E.J.; Chen, W.; Du, Y.; Lu, X. Distinct storage mechanisms of soil organic carbon in coniferous forest and evergreen broadleaf forest in tropical China. J. Environ. Manag. 2021, 295, 113142. [Google Scholar] [CrossRef] [PubMed]
  13. Wang, F.; Ding, Y.; Sayer, E.J.; Li, Q.; Zou, B.; Mo, Q.; Li, Y.; Lu, X.; Tang, J.; Zhu, W.; et al. Tropical forest restoration: Fast resilience of plant biomass contrasts with slow recovery of stable soil C stocks. Funct. Ecol. 2017, 31, 2344–2355. [Google Scholar] [CrossRef] [Green Version]
  14. Liu, W.; Jiang, Y.; Yang, Q.; Yang, H.; Li, Y.; Li, Z.; Mao, W.; Luo, Y.; Wang, X.; Tan, Z. Spatial distribution and stability mechanisms of soil organic carbon in a tropical montane rainforest. Ecol. Indic. 2021, 129, 107965. [Google Scholar] [CrossRef]
  15. Martin, D.; Lal, T.; Sachdev, C.B.; Sharma, J.P. Soil organic carbon storage changes with climate change, landform and land use conditions in Garhwal hills of the Indian Himalayan mountains. Agric. Ecosyst. Environ. 2010, 138, 64–73. [Google Scholar] [CrossRef]
  16. Meng, C.; Tian, D.; Zeng, H.; Li, Z.; Chen, H.Y.H.; Niu, S. Global meta-analysis on the responses of soil extracellular enzyme activities to warming. Sci. Total Environ. 2020, 705, 135992. [Google Scholar] [CrossRef]
  17. Deng, Y.; Chen, X.; Yao, X.; Dong, L.; Zhang, H.; Zeng, H.; Wang, W. No thermal adaptation in soil extracellular enzymes across a temperate grassland region. Soil Biol. Biochem. 2022, 165, 108540. [Google Scholar] [CrossRef]
  18. He, Q.; Wu, Y.; Bing, H.; Zhou, J.; Wang, J. Vegetation type rather than climate modulates the variation in soil enzyme activities and stoichiometry in subalpine forests in the eastern Tibetan Plateau. Geoderma 2020, 374, 114424. [Google Scholar] [CrossRef]
  19. Boeddinghaus, R.S.; Nunan, N.; Berner, D.; Marhan, S.; Kandeler, E. Do general spatial relationships for microbial biomass and soil enzyme activities exist in temperate grassland soils? Soil Biol. Biochem. 2015, 88, 430–440. [Google Scholar] [CrossRef]
  20. Brockett, B.F.T.; Prescott, C.E.; Grayston, S.J. Soil moisture is the major factor influencing microbial community structure and enzyme activities across seven biogeoclimatic zones in western Canada. Soil Biol. Biochem. 2012, 44, 9–20. [Google Scholar] [CrossRef]
  21. Brouns, K.; Eikelboom, T.; Jansen, P.C.; Janssen, R.; Kwakernaak, C.; van den Akker, J.J.H.; Verhoeven, J.T.A. Spatial Analysis of Soil Subsidence in Peat Meadow Areas in Friesland in Relation to Land and Water Management, Climate Change, and Adaptation. Environ. Manag. 2015, 55, 360–372. [Google Scholar] [CrossRef] [PubMed]
  22. Peng, Z.Y.; Liu, W.X.; Tian, R.; Yang, S.; Wang, J.; Huang, J.S.; Yang, Y.S.; Liu, L.L. Effects of altitude and aspect on soil extracellular enzyme activities in Tanggula Mountain. Acta Ecol. Sin. 2021, 41, 7659–7668. [Google Scholar]
  23. Zuo, Y.; Zhang, H.; Li, J.; Yao, X.; Chen, X.; Zeng, H.; Wang, W. The effect of soil depth on temperature sensitivity of extracellular enzyme activity decreased with elevation: Evidence from mountain grassland belts. Sci. Total Environ. 2021, 777, 146136. [Google Scholar] [CrossRef] [PubMed]
  24. Jyothi, A.; Rao, P.C.; Padmaja, G.; Madhavi, M. Effect of Temperature on Soil Enzyme Acid Phosphatase. Int. J. Curr. Microbiol. Appl. Sci. 2018, 7, 15. [Google Scholar]
  25. McDaniel, M.D.; Kaye, J.P.; Kaye, M.W. Increased temperature and precipitation had limited effects on soil extracellular enzyme activities in a post-harvest forest. Soil Biol. Biochem. 2013, 56, 90–98. [Google Scholar] [CrossRef]
  26. Jing, X.; Wang, Y.; Chung, H.; Mi, Z.; Wang, S.; Zeng, H.; He, J.-S. No temperature acclimation of soil extracellular enzymes to experimental warming in an alpine grassland ecosystem on the Tibetan Plateau. Biogeochemistry 2014, 117, 39–54. [Google Scholar] [CrossRef]
  27. German, D.P.; Marcelo, K.R.B.; Stone, M.M.; Allison, S.D. The Michaelis-Menten kinetics of soil extracellular enzymes in response to temperature: A cross-latitudinal study. Glob. Chang. Biol. 2012, 18, 1468–1479. [Google Scholar] [CrossRef]
  28. Liu, Q.; Xu, X.; Wang, H.; Blagodatskaya, E.; Kuzyakov, Y. Dominant extracellular enzymes in priming of SOM decomposition depend on temperature. Geoderma 2019, 343, 187–195. [Google Scholar] [CrossRef]
  29. Ali, R.S.; Ingwersen, J.; Demyan, M.S.; Funkuin, Y.N.; Wizemann, H.-D.; Kandeler, E.; Poll, C. Modelling in situ activities of enzymes as a tool to explain seasonal variation of soil respiration from agro-ecosystems. Soil Biol. Biochem. 2015, 81, 291–303. [Google Scholar] [CrossRef]
  30. Yang, X.; Lin, Y.; Liang, S. Forest vegetation in Wuzhishan, Hainan Island Ⅰ. Types of forest vegetation in the Wuzhishan Mountains. J. Hainan Univ. (Nat. Sci.Ed.) 1994, 12, 220–236. [Google Scholar]
  31. Yin, W.; Li, J.; Huang, L.; Liu, W.; Li, D. Research on physicochemical properties of soil in thatch land of Wuzhishan National Nature Reserve. For. Surv. Plan. 2018, 43, 41–46+61. [Google Scholar]
  32. Zhuo, S.; Hu, N.; Chen, K.; Li, J.; Yin, W.; Huang, L.; Long, W. Species distribution patterns of tree communities on different slopes and elevations in Wuzhishan Nature Reserve. J. Trop. Biol. 2017, 8, 436–443. [Google Scholar]
  33. Li, J.; Liang, Y.; Liu, W.; Yang, Q.; Xu, W.; Tang, S.; Wang, J. Effect of organic fertilizer instead of chemical nitrogen fertilizer on the growth and soil environment of rubber seedlings. J. Appl. Ecol. 2022, 33, 431–438. [Google Scholar]
  34. Saiya-Cork, K.R.; Sinsabaugh, R.L.; Zakb, D.R. The effects of long term nitrogen deposition on extracellular enzyme activity in an Acer saccharum forest soil. Soil Biol. Biochem. 2002, 34, 1309–1315. [Google Scholar] [CrossRef]
  35. Wallenstein, M.D.; McMahon, S.K.; Schimel, J.P. Seasonal variation in enzyme activities and temperature sensitivities in Arctic tundra soils. Glob. Chang. Biol. 2009, 15, 1631–1639. [Google Scholar] [CrossRef]
  36. Hill, B.H.; Elonen, C.M.; Jicha, T.M.; Kolka, R.K.; Lehto, L.L.P.; Sebestyen, S.D.; Seifert-Monson, L.R. Ecoenzymatic stoichiometry and microbial processing of organic matter in northern bogs and fens reveals a common P-limitation between peatland types. Biogeochemistry 2014, 120, 203–224. [Google Scholar] [CrossRef]
  37. Peng, X.; Wang, W. Stoichiometry of soil extracellular enzyme activity along a climatic transect in temperate grasslands of northern China. Soil Biol. Biochem. 2016, 98, 74–84. [Google Scholar] [CrossRef]
  38. Moorhead, D.L.; Hill, B.H.; Weintraub, M.N.; Sinsabaugh, R.L. Vector analysis of ecoenzyme activities reveal constraints on coupled C, N and P dynamics. Soil Biol. Biochem. 2016, 93, 1–7. [Google Scholar] [CrossRef]
  39. Yu, H.; Gao, R.; Yang, W.; Yang, L.; Li, S.; Lin, Y.; Wang, D.; Li, K. Leaf, root and soil carbon, nitrogen and phosphorus contents and relationships of dominant herbaceous plants in a dry thermal valley. J. Appl. Environ. Biol. 2022, 28, 727–735. [Google Scholar]
  40. Lin, W.Q.; Zou, X.J.; She, H.J.; Xue, L. Vertical Distribution of Soil Organic Carbon and Nutrient Element Storages of An Elaeocarpus sylvestris Plantation. J. Northeast. For. Univ. 2019, 47, 55–59. [Google Scholar]
  41. Ding, Y.; Mao, Z.; Zhang, L.; Ding, L. Comparative study of soil organic carbon pools in primary broadleaf red pine and maple birch secondary forests in the Xiaoxingan Mountains. Plant Res. 2015, 35, 604–611. [Google Scholar]
  42. Zhou, L.; Liu, S.; Shen, H.; Zhao, M.; Xu, L.; Xing, A.; Fang, J. Soil extracellular enzyme activity and stoichiometry in China’s forests. Funct. Ecol. 2020, 34, 1461–1471. [Google Scholar] [CrossRef]
  43. Xu, G.; Long, Z.; Ren, P.; Ren, C.; Cao, Y.; Huang, Y.; Hu, S. Differential responses of soil hydrolytic and oxidative enzyme activities to the natural forest conversion. Sci. Total Environ. 2020, 716, 136414. [Google Scholar] [CrossRef] [PubMed]
  44. Liu, W. Carbon, Nitrogen and Phosphorus Content and Ecological Chemometrics of Jiaozhou Bay Wetland Ecosystem. Master’s Thesis, Qingdao University, Qingdao, China, 2014. [Google Scholar]
  45. Sinsabaugh, R.L.; Shah, J.J.F. Ecoenzymatic Stoichiometry and Ecological Theory. Annu. Rev.Ecol. Evol. Syst. 2012, 43, 313. [Google Scholar] [CrossRef] [Green Version]
  46. Weintraub, S.R.; Wieder, W.R.; Cleveland, C.C.; Townsend, A.R. Organic matter inputs shift soil enzyme activity and allocation patterns in a wet tropical forest. Biogeochemistry 2013, 114, 313–326. [Google Scholar] [CrossRef]
  47. Zhang, X.; Guo, J.; Vogt, R.D.; Mulder, J.; Wang, Y.; Qian, C.; Wang, J.; Zhang, X. Soil acidification as an additional driver to organic carbon accumulation in major Chinese croplands. Geoderma 2020, 366, 114234. [Google Scholar] [CrossRef]
  48. Huang, X.; Cui, C.; Hou, E.; Li, F.; Liu, W.; Jiang, L.; Luo, Y.; Xu, X. Acidification of soil due to forestation at the global scale. For. Ecol. Manag. 2022, 505, 119951. [Google Scholar] [CrossRef]
  49. Le, V.S.; Herrmann, L.; Hudek, L.; Nguyen, T.B.; Bräu, L.; Lesueur, D. How application of agricultural waste can enhance soil health in soils acidified by tea cultivation: A review. Environ. Chem. Lett. 2022, 20, 813–839. [Google Scholar] [CrossRef]
  50. Ghiloufi, W.; Seo, J.; Kim, J.; Chaieb, M.; Kang, H. Effects of Biological Soil Crusts on Enzyme Activities and Microbial Community in Soils of an Arid Ecosystem. Microb. Ecol. 2019, 77, 201–216. [Google Scholar] [CrossRef]
  51. Wu, S.G.; Wang, W.P.; Li, B.; Liang, Y.L.; Liu, Y.Z. Altitudinal gradients of soil organic carbon in a central subtropical forest. Soil J. 2020, 57, 1539–1547. [Google Scholar]
  52. Angel, R.; Soares, M.I.M.; Ungar, E.D.; Gillor, O. Biogeography of soil archaea and bacteria along a steep precipitation gradient. ISME J. 2010, 4, 553–563. [Google Scholar] [CrossRef]
  53. Huang, Y.-M.; Liu, D.; An, S.-S. Effects of slope aspect on soil nitrogen and microbial properties in the Chinese Loess region. CATENA 2015, 125, 135–145. [Google Scholar] [CrossRef]
  54. Shen, J.; Li, X.; Yuan, Y.; Wen, J. Response of soil enzymes to different elevations and slope orientations in Napanhe Nature Reserve. Soil Water Conserv. Res. 2018, 25, 111–119+125. [Google Scholar]
  55. Zhou, P.; Wei, L.; Wei, X.; Zhu, Z.; Yuan, H.; Li, Q.; Wu, J. Characterization of β-1,4-glucosidase activity in paddy soils in response to temperature changes. Environ. Sci. Res. 2018, 3l, 1282–1288. [Google Scholar]
  56. Nottingham, A.T.; Turner, B.L.; Whitaker, J.; Ostle, N.; Bardgett, R.D.; McNamara, N.P.; Salinas, N.; Meir, P. Temperature sensitivity of soil enzymes along an elevation gradient in the Peruvian Andes. Biogeochemistry 2016, 127, 217–230. [Google Scholar] [CrossRef] [Green Version]
  57. Xiao, L.; Liu, G.; Li, P.; Xue, S. Dynamics of soil specific enzyme activities and temperature sensitivities during grassland succession after farmland abandonment. CATENA 2021, 199, 105081. [Google Scholar] [CrossRef]
  58. Razavia, B.S.; Blagodatskayab, E.; Kuzyakova, Y. Temperature selects for static soil enzyme systems to maintain high catalytic efficiency. Soil Biol. Biochem. 2016, 97, 15–22. [Google Scholar] [CrossRef]
  59. Davidson, E.A.; Janssens, I.A. Temperature sensitivity of soil carbon decomposition and feedbacks to climate change. Nature 2006, 440, 165–173. [Google Scholar] [CrossRef] [Green Version]
  60. Allison, S.D.; Romero-Olivares, A.L.; Lu, Y.; Taylor, J.W.; Treseder, K.K. Temperature sensitivities of extracellular enzyme Vmax and Km across thermal environments. Glob. Chang. Biol. 2018, 24, 2884–2897. [Google Scholar] [CrossRef] [Green Version]
  61. Razavi, B.; Blagodatskaya, E.; Kuzyakov, Y. Nonlinear temperature sensitivity of enzyme kinetics explains canceling effect-A case study on loamy haplic Luvisol. Front. Microbiol. 2015, 6, 1126. [Google Scholar] [CrossRef] [Green Version]
  62. Chen, J.; Elsgaard, L.; van Groenigen, K.J.; Olesen, J.E.; Liang, Z.; Jiang, Y.; Lærke, P.E.; Zhang, Y.; Luo, Y.; Hungate, B.A.; et al. Soil carbon loss with warming: New evidence from carbon-degrading enzymes. Glob. Chang. Biol. 2020, 26, 1944–1952. [Google Scholar] [CrossRef] [PubMed]
Figure 1. Map of the sampling sites in the Wuzhishan National Nature Reserve. All sampling sites are shown in red boxes. Purple circles represent the eight slope orientation samples, blue triangles represent the three forest type samples and green squares represent the four vegetation type samples. The distance between any two samples is >10 m meters.
Forests 13 01943 g001
Figure 2. The activity changes of six enzymes in three forest types, four slope orientations, and vegetation types in Wuzhishan National Nature Reserve. (a,c,e) represent the enzyme activities of the four hydrolases in three forest types, four slope orientations, and four vegetation types, respectively. (b,d,f) represent the enzyme activities of the two oxidases in three forest types, four slope orientations, and four vegetation types, respectively. Different lowercase letters indicate significant difference of the same enzyme activity in different soil types (p < 0.05). The vertical black line represents the standard error.
Forests 13 01943 g002
Figure 3. Changes in the activity of six enzymes in Wuzhishan National Nature Reserve at different incubation temperatures. Four hydrolytic enzymes are shown on the left and two oxidative enzymes are shown on the right. The vertical black line represents the standard error. The value of 10 means assay temperature = 10 °C, 20 means assay temperature = 20 °C, 30 means assay temperature = 30 °C, and 40 means assay temperature = 40 °C.
Forests 13 01943 g003
Figure 4. Pearson correlation analysis of soil physicochemical properties and enzyme activities in Wuzhishan National Nature Reserve. Blue represents a positive correlation and red represents a negative correlation. A darker color means a stronger correlation between the two variables and a lighter color means a weaker or no correlation between the two variables. Significance: * indicates p < 0.05, ** indicates p < 0.01, *** indicates p < 0.001.
Forests 13 01943 g004
Figure 5. RDA analysis of environmental factors and soil enzyme activity in Wuzhishan National Nature Reserve. The blue arrows represent the six soil enzymes. The red arrows represent the soil physicochemical property indicators and CQI.
Forests 13 01943 g005
Table 1. Physicochemical properties of soils of different forest types, vegetation types, and slope orientations in the Wuzhishan National Nature Reserve. The numbers are means ± standard error. The letters in lowercase indicate significantly different groups based on Duncan’s multiple comparison (p = 0.05).
TypepHMoisture
%
SOC
g/kg
TN
g/kg
TP
g/kg
SAP
mg/kg
Vector LVector ACQI
Forest
type
Plantation forest6.20 ± 0.03 a7.54 ± 0.41 c28.96 ± 1.56 ab2.02 ± 0.11 a0.15 ± 0.014 b1.85 ± 0.014 a1.30 ± 0.010 a40.39 ± 0.42 a0.63 ± 0.004 a
Secondary forest5.99 ± 0.05 ab15.15 ± 0.39 a24.82 ± 1.62 b2.08 ± 0.08 a0.26 ± 0.075 a1.66 ± 0.014 b1.29 ± 0.026 a39.62 ± 0.94 a0.63 ± 0.009 a
Primary forest5.83 ± 0.09 b11.17 ± 0.37 b32.25 ± 1.84 a2.09 ± 0.15 a0.11 ± 0.028 b1.82 ± 0.052 a1.31 ± 0.011 a40.34 ± 0.36 a0.58 ± 0.011 b
Vegetation
type
Lowland rainforest5.86 ± 0.06 a14.69 ± 0.30 b36.91 ± 1.72 b2.46 ± 0.17 b0.31 ± 0.058 a1.59 ± 0.014 b1.32 ± 0.029 a40.12 ± 0.81 a0.59 ± 0.011 a
Montane rainforest5.35 ± 0.08 b15.64 ± 1.67 b33.49 ± 0.38 b2.10 ± 0.26 b0.15 ± 0.010 b1.98 ± 0.002 a1.34 ± 0.016 a41.90 ± 0.68 a0.59 ± 0.017 a
Cloud forest5.50 ± 0.10 b30.17 ± 2.17 a87.72 ± 0.82 a5.92 ± 0.06 a0.18 ± 0.047 b1.70 ± 0.097 b1.34 ± 0.016 a42.25 ± 1.22 a0.59 ± 0.013 a
Hilltop scrub5.45 ± 0.07 b34.89 ± 2.52 a86.07 ± 2.19 a4.97 ± 0.51 a0.14 ± 0.019 b1.65 ± 0.009 b1.25 ± 0.024 a41.59 ± 0.79 a0.63 ± 0.009 a
Slope
orientation
E5.57 ± 0.71 c14.16 ± 1.3 b44.59 ± 5.05 ab2.31 ± 0.13 a0.02 ± 0.002 c1.82 ± 0.026 a1.32 ± 0.011 a41.34 ± 0.26 a0.60 ± 0.007 a
S5.77 ± 0.05 c14.38 ± 0.49 b27.08 ± 0.29 b2.04 ± 0.08 a0.06 ± 0.013 bc1.66 ± 0.011 ab1.34 ± 0.023 a40.29 ± 1.10 a0.62 ± 0.010 a
W5.79 ± 0.12 c14.09 ± 0.42 b35.89 ± 0.68 ab2.51 ± 0.11 a0.29 ± 0.131 ab1.55 ± 0.006 b1.38 ± 0.022 a39.02 ± 0.21 a0.61 ± 0.003 a
N5.87 ± 0.06 bc14.69 ± 0.30 b36.93 ± 1.72 ab2.46 ± 0.17 a0.31 ± 0.058 a1.59 ± 0.014 b1.32 ± 0.029 a40.12 ± 0.81 a0.59 ± 0.011 a
ES5.21 ± 0.03 d18.58 ± 1.77 a56.30 ± 14.99 a2.60 ± 0.44 a0.20 ± 0.068 abc1.72 ± 0.015 ab1.30 ± 0.011 a40.99 ± 0.51 a0.60 ± 0.015 a
EN6.18 ± 0.17 b13.39 ± 0.63 b31.96 ± 3.60 b1.92 ± 0.17 a0.13 ± 0.013 abc1.84 ± 0.085 a1.34 ± 0.004 a42.08 ± 0.37 a0.59 ± 0.011 a
WS5.68 ± 0.06 c13.23 ± 0.68 b31.03 ± 2.40 b1.95 ± 0.26 a0.18 ± 0.025 abc1.72 ± 0.048 ab1.36 ± 0.031 a42.13 ± 1.09 a0.60 ± 0.009 a
WN6.58 ± 0.05 a16.32 ± 1.01 ab29.71 ± 4.61 b2.27 ± 0.35 a0.37 ± 0.058 a1.80 ± 0.078 a1.37 ± 0.028 a40.87 ± 0.94 a0.60 ± 0.007 a
Different lowercase letters in the same column indicate significant differences (p < 0.05). SOC, soil organic carbon; TN, total nitrogen; TP, total phosphorus; SAP, soil available phosphorus; Vector L, Vector Length; Vector A, Vector Angle; CQI, soil carbon quality index.
Table 2. The Q10 value of six enzymes in Wuzhishan National Nature Reserve under three forest types, four slope orientations, and four vegetation types. The numbers are means ± standard error. The letters in lowercase indicate significantly different groups based on Duncan’s multiple comparison (p = 0.05).
TypeTemperature (°C)AP (Q10)BG (Q10)NAG (Q10)LAP (Q10)POX (Q10)CAT (Q10)
Forest typePlantation forest10–201.02 ± 0.05 a0.93 ± 0.06 a1.02 ± 0.06 a0.98 ± 0.07 a0.80 ± 0.12 a1.71 ± 0.08 a
20–301.16 ± 0.08 a1.07 ± 0.07 a1.07 ± 0.04 a1.06 ± 0.06 a1.11 ± 0.06 ab1.92 ± 0.05 a
30–400.87 ± 0.06 a0.87 ± 0.03 a0.93 ± 0.09 a0.77 ± 0.04 b1.00 ± 0.07 a1.16 ± 0.08 a
Secondary forest10–201.04 ± 0.10 a0.83 ± 0.07 a1.16 ± 0.07 a0.97 ± 0.05 a0.87 ± 0.06 a1.64 ± 0.17 a
20–301.12 ± 0.15 a1.08 ± 0.11 a1.11 ± 0.08 a0.98 ± 0.06 ab0.96 ± 0.05 b1.53 ± 0.15 ab
30–400.78 ± 0.07 a0.75 ± 0.10 a0.78 ± 0.03 a0.88 ± 0.08 ab0.90 ± 0.04 a1.24 ± 0.09 a
Primary forest10–201.12 ± 0.12 a0.88 ± 0.06 a0.96 ± 0.07 a0.99 ± 0.08 a1.14 ± 0.08 a1.48 ± 0.10 a
20–300.99 ± 0.11 a1.06 ± 0.08 a0.92 ± 0.07 a0.97 ± 0.06 a1.25 ± 0.09 a1.21 ± 0.09 b
30–401.09 ± 0.14 a0.88 ± 0.09 a0.94 ± 0.07 a1.04 ± 0.05 a1.03 ± 0.07 a1.01 ± 0.04 a
Vegetation typeLowland rainforest10–201.10 ± 0.06 a1.05 ± 0.09 a0.89 ± 0.03 a1.10 ± 0.07 a0.81 ± 0.06 a1.10 ± 0.09 a
20–300.95 ± 0.06 a1.02 ± 0.08 a1.05 ± 0.07 a0.97 ± 0.08 a0.92 ± 0.13 a0.97 ± 0.10 a
30–401.01 ± 0.05 a1.01 ± 0.05 a0.94 ± 0.01 a0.99 ± 0.05 a1.14 ± 0.05 a0.99 ± 0.07 a
Montane rainforest10–201.11 ± 0.09 a1.04 ± 0.08 a1.00 ± 0.05 a1.04 ± 0.10 a0.62 ± 0.08 a1.04 ± 0.12 a
20–300.99 ± 0.05 a1.08 ± 0.06 a1.05 ± 0.04 a0.96 ± 0.04 a1.04 ± 0.09 a0.96 ± 0.06 a
30–400.90 ± 0.07 a0.71 ± 0.07 b0.89 ± 0.08 a1.10 ± 0.05 a1.11 ± 0.09 a1.10 ± 0.07 a
Cloud forest10–201.14 ± 0.08 a1.11 ± 0.07 a1.05 ± 0.04 a1.01 ± 0.09 a0.87 ± 0.08 a1.01 ± 0.11 a
20–301.00 ± 0.09 a0.86 ± 0.07 a0.94 ± 0.05 a0.92 ± 0.05 a1.12 ± 0.02 a0.92 ± 0.07 a
30–400.85 ± 0.05 a1.06 ± 0.06 a0.97 ± 0.07 a1.01 ± 0.08 a1.00 ± 0.09 a1.01 ± 0.10 a
Hilltop scrub10–200.96 ± 0.07 a1.10 ± 0.04 a0.88 ± 0.06 a0.98 ± 0.06 a0.80 ± 0.03 a0.98 ± 0.08 a
20–301.01 ± 0.04 a0.95 ± 0.02 a0.99 ± 0.07 a1.00 ± 0.07 a1.29 ± 0.06 a1.00 ± 0.07 a
30–400.88 ± 0.09 a0.68 ± 0.05 b0.98 ± 0.07 a1.00 ± 0.09 a0.98 ± 0.04 a1.00 ± 0.09 a
Slope orientationE10–201.00 ± 0.08 a1.05 ± 0.05 a1.01 ± 0.03 a0.85 ± 0.05 b1.05 ± 0.08 a1.59 ± 0.14 a
20–300.94 ± 0.05 a0.93 ± 0.06 a0.98 ± 0.05 a0.96 ± 0.04 a0.98 ± 0.09 a1.23 ± 0.03 a
30–401.12 ± 0.09 a1.08 ± 0.09 a1.05 ± 0.07 a1.01 ± 0.03 a1.00 ± 0.05 a0.95 ± 0.04 a
S10–201.09 ± 0.09 a0.99 ± 0.10 a1.08 ± 0.04 a1.04 ± 0.07 ab1.02 ± 0.04 a1.72 ± 0.08 a
20–301.11 ± 0.06 a1.03 ± 0.04 a1.03 ± 0.07 a1.04 ± 0.08 a1.01 ± 0.09 a1.23 ± 0.12 a
30–401.02 ± 0.05 a1.00 ± 0.08 a1.03 ± 0.08 a0.89 ± 0.07 a1.02 ± 0.06 a1.02 ± 0.03 a
W10–200.94 ± 0.08 a0.92 ± 0.06 a0.97 ± 0.07 a0.94 ± 0.03 ab0.98 ± 0.06 a1.37 ± 0.12 a
20–301.02 ± 0.07 a0.87 ± 0.06 a1.03 ± 0.08 a0.90 ± 0.03 a0.86 ± 0.09 a1.19 ± 0.07 a
30–400.97 ± 0.05 a1.04 ± 0.09 a1.09 ± 0.09 a0.98 ± 0.06 a1.07 ± 0.08 a0.94 ± 0.04 a
N10–201.10 ± 0.06 a1.05 ± 0.09 a0.89 ± 0.03 a1.10 ± 0.07 a0.81 ± 0.06 a1.58 ± 0.09 a
20–300.95 ± 0.06 a1.02 ± 0.08 a1.05 ± 0.07 a1.04 ± 0.06 a0.89 ± 0.09 a1.53 ± 0.06 a
30–401.01 ± 0.05 a 1.01 ± 0.05 a0.94 ± 0.01 a0.89 ± 0.07 a1.16 ± 0.03 a0.85 ± 0.08 a
Different lowercase letters indicate significant differences of the same enzyme activity in different soil types (p < 0.05). AP: acid phosphatase, BG: β-1,4-glucosidase, NAG: N-acetyl β-glucosidase, LAP: leucine aminopeptidase, POX: polyphenol oxidase, CAT: catalase.
Publisher’s Note: MDPI stays neutral with regard to jurisdictional claims in published maps and institutional affiliations.

