
Landscape Dynamics in a Poverty-Stricken Mountainous City: Land-Use Change, Urban Growth Patterns, and Forest Fragmentation

Abstract
:1. Introduction
2. Methodology
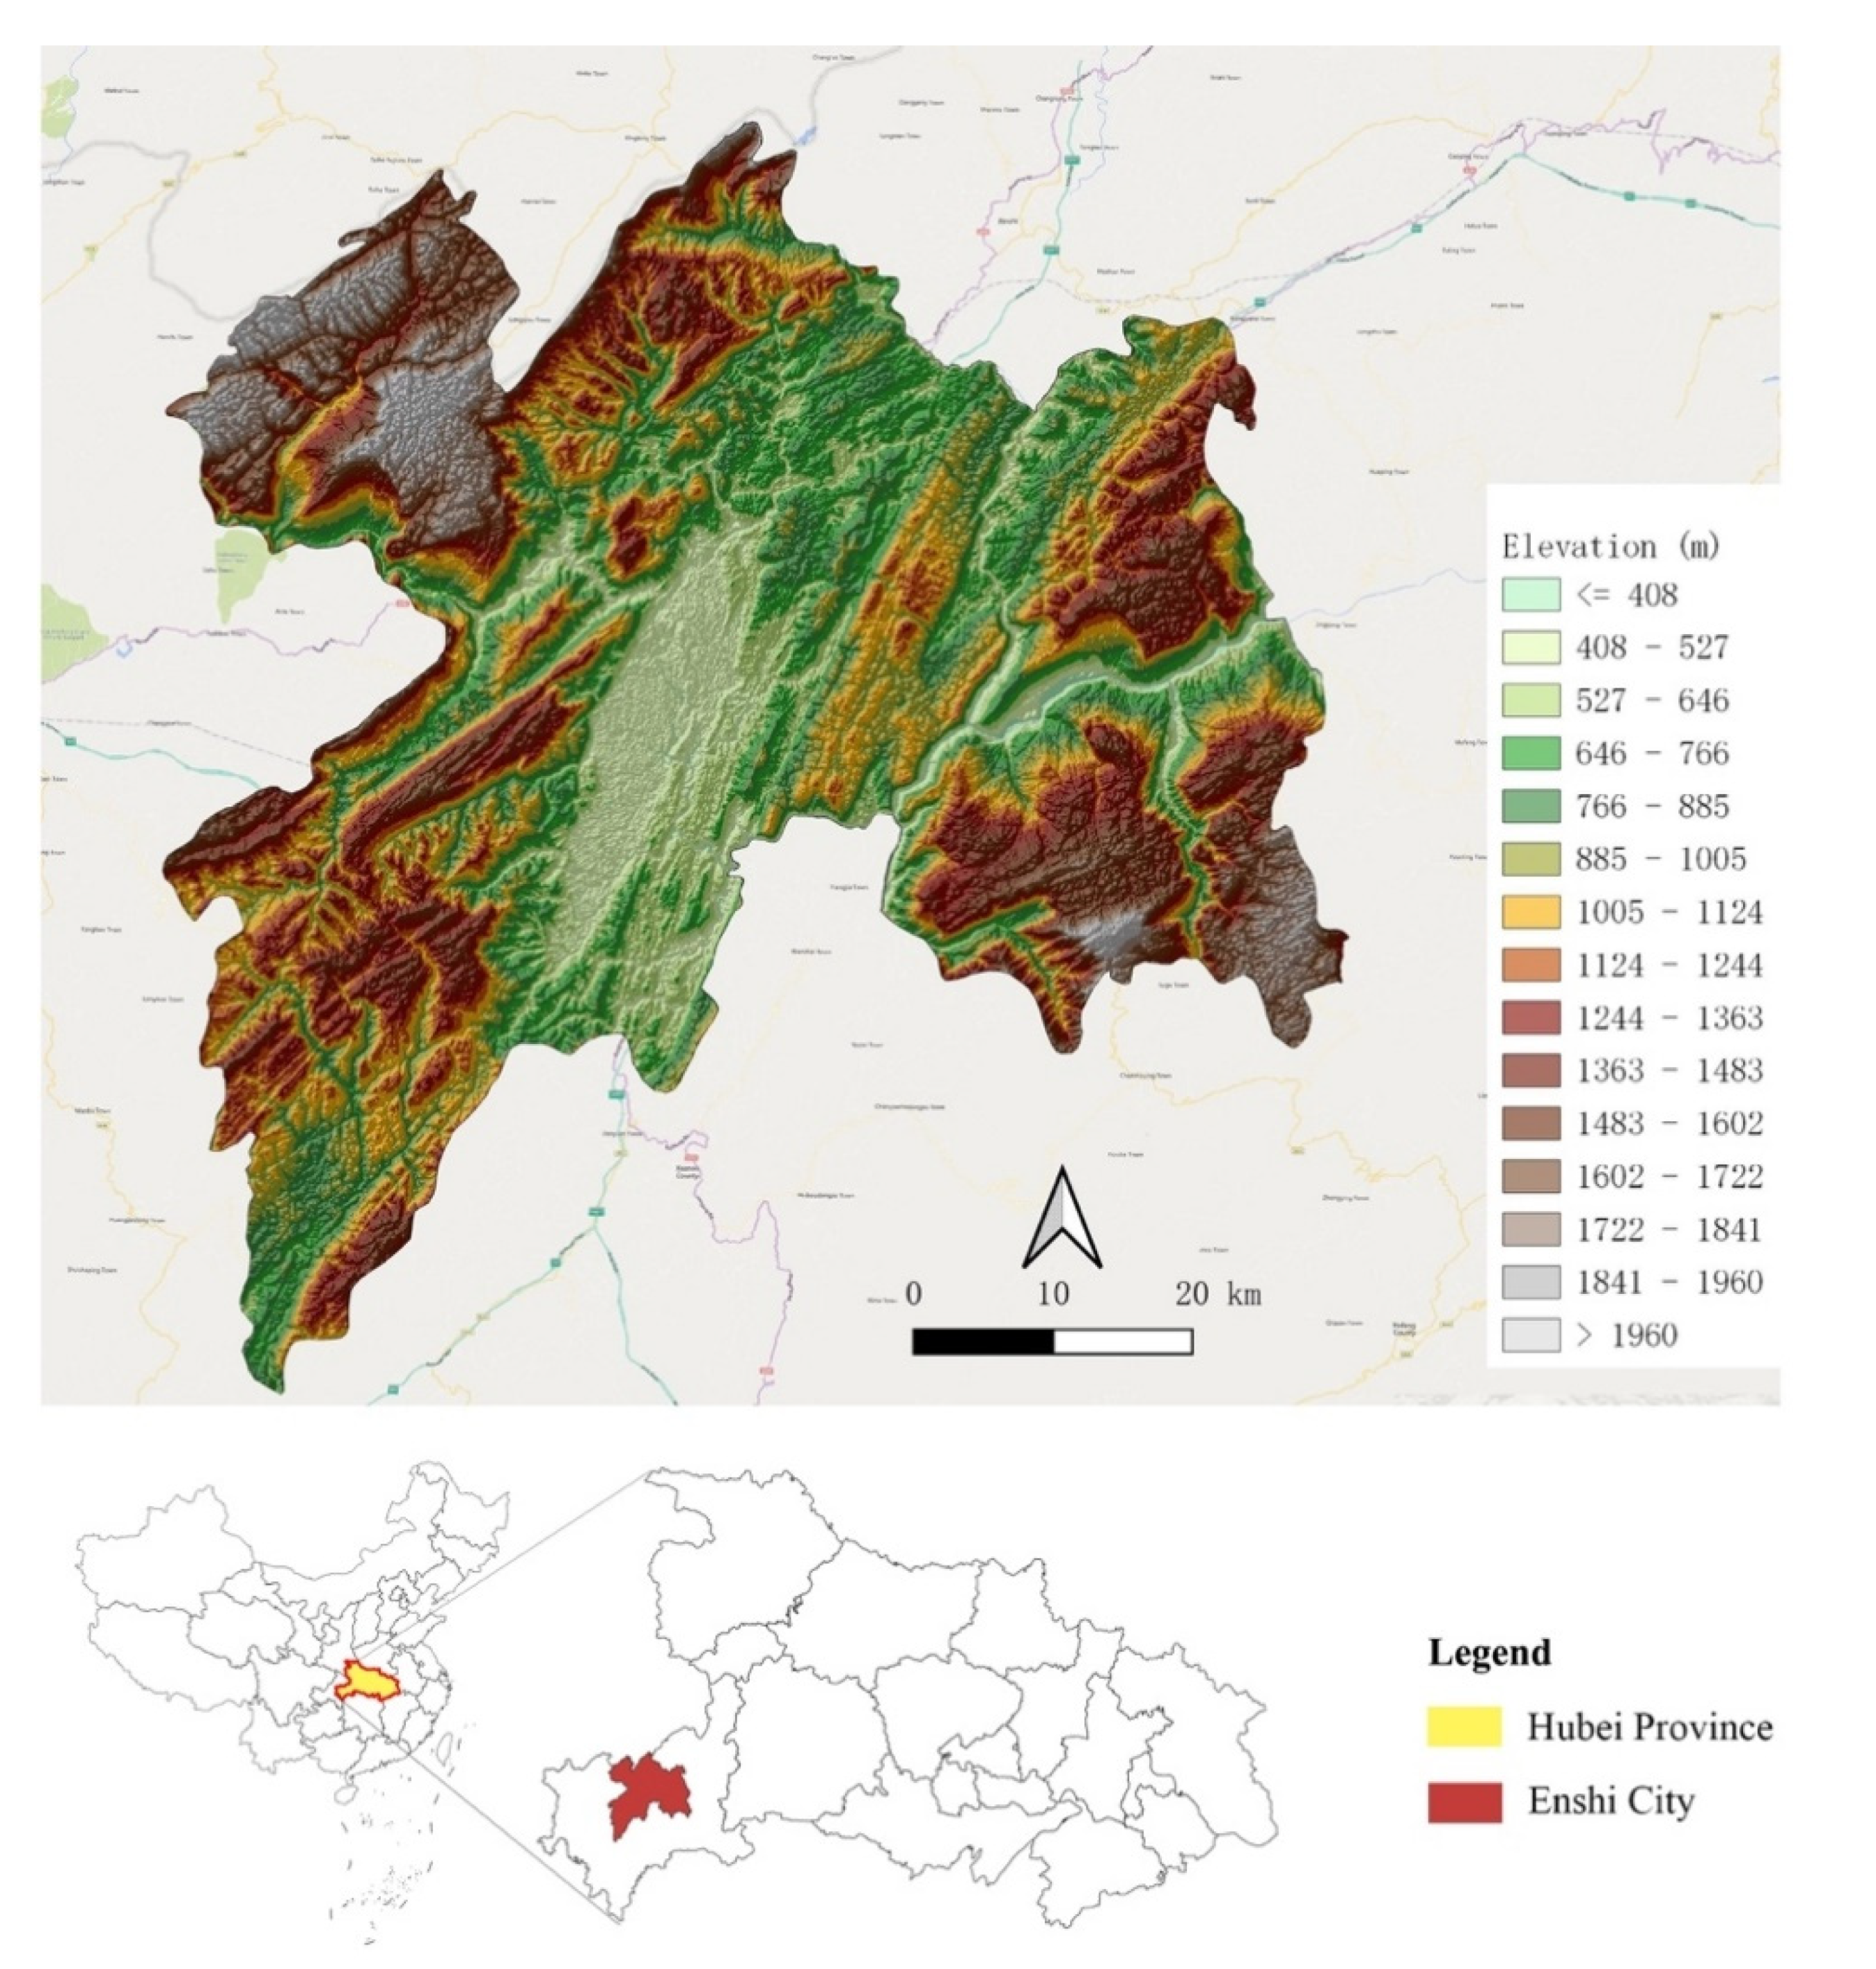
2.1. Study Area
2.2. Data Sources and Analysis
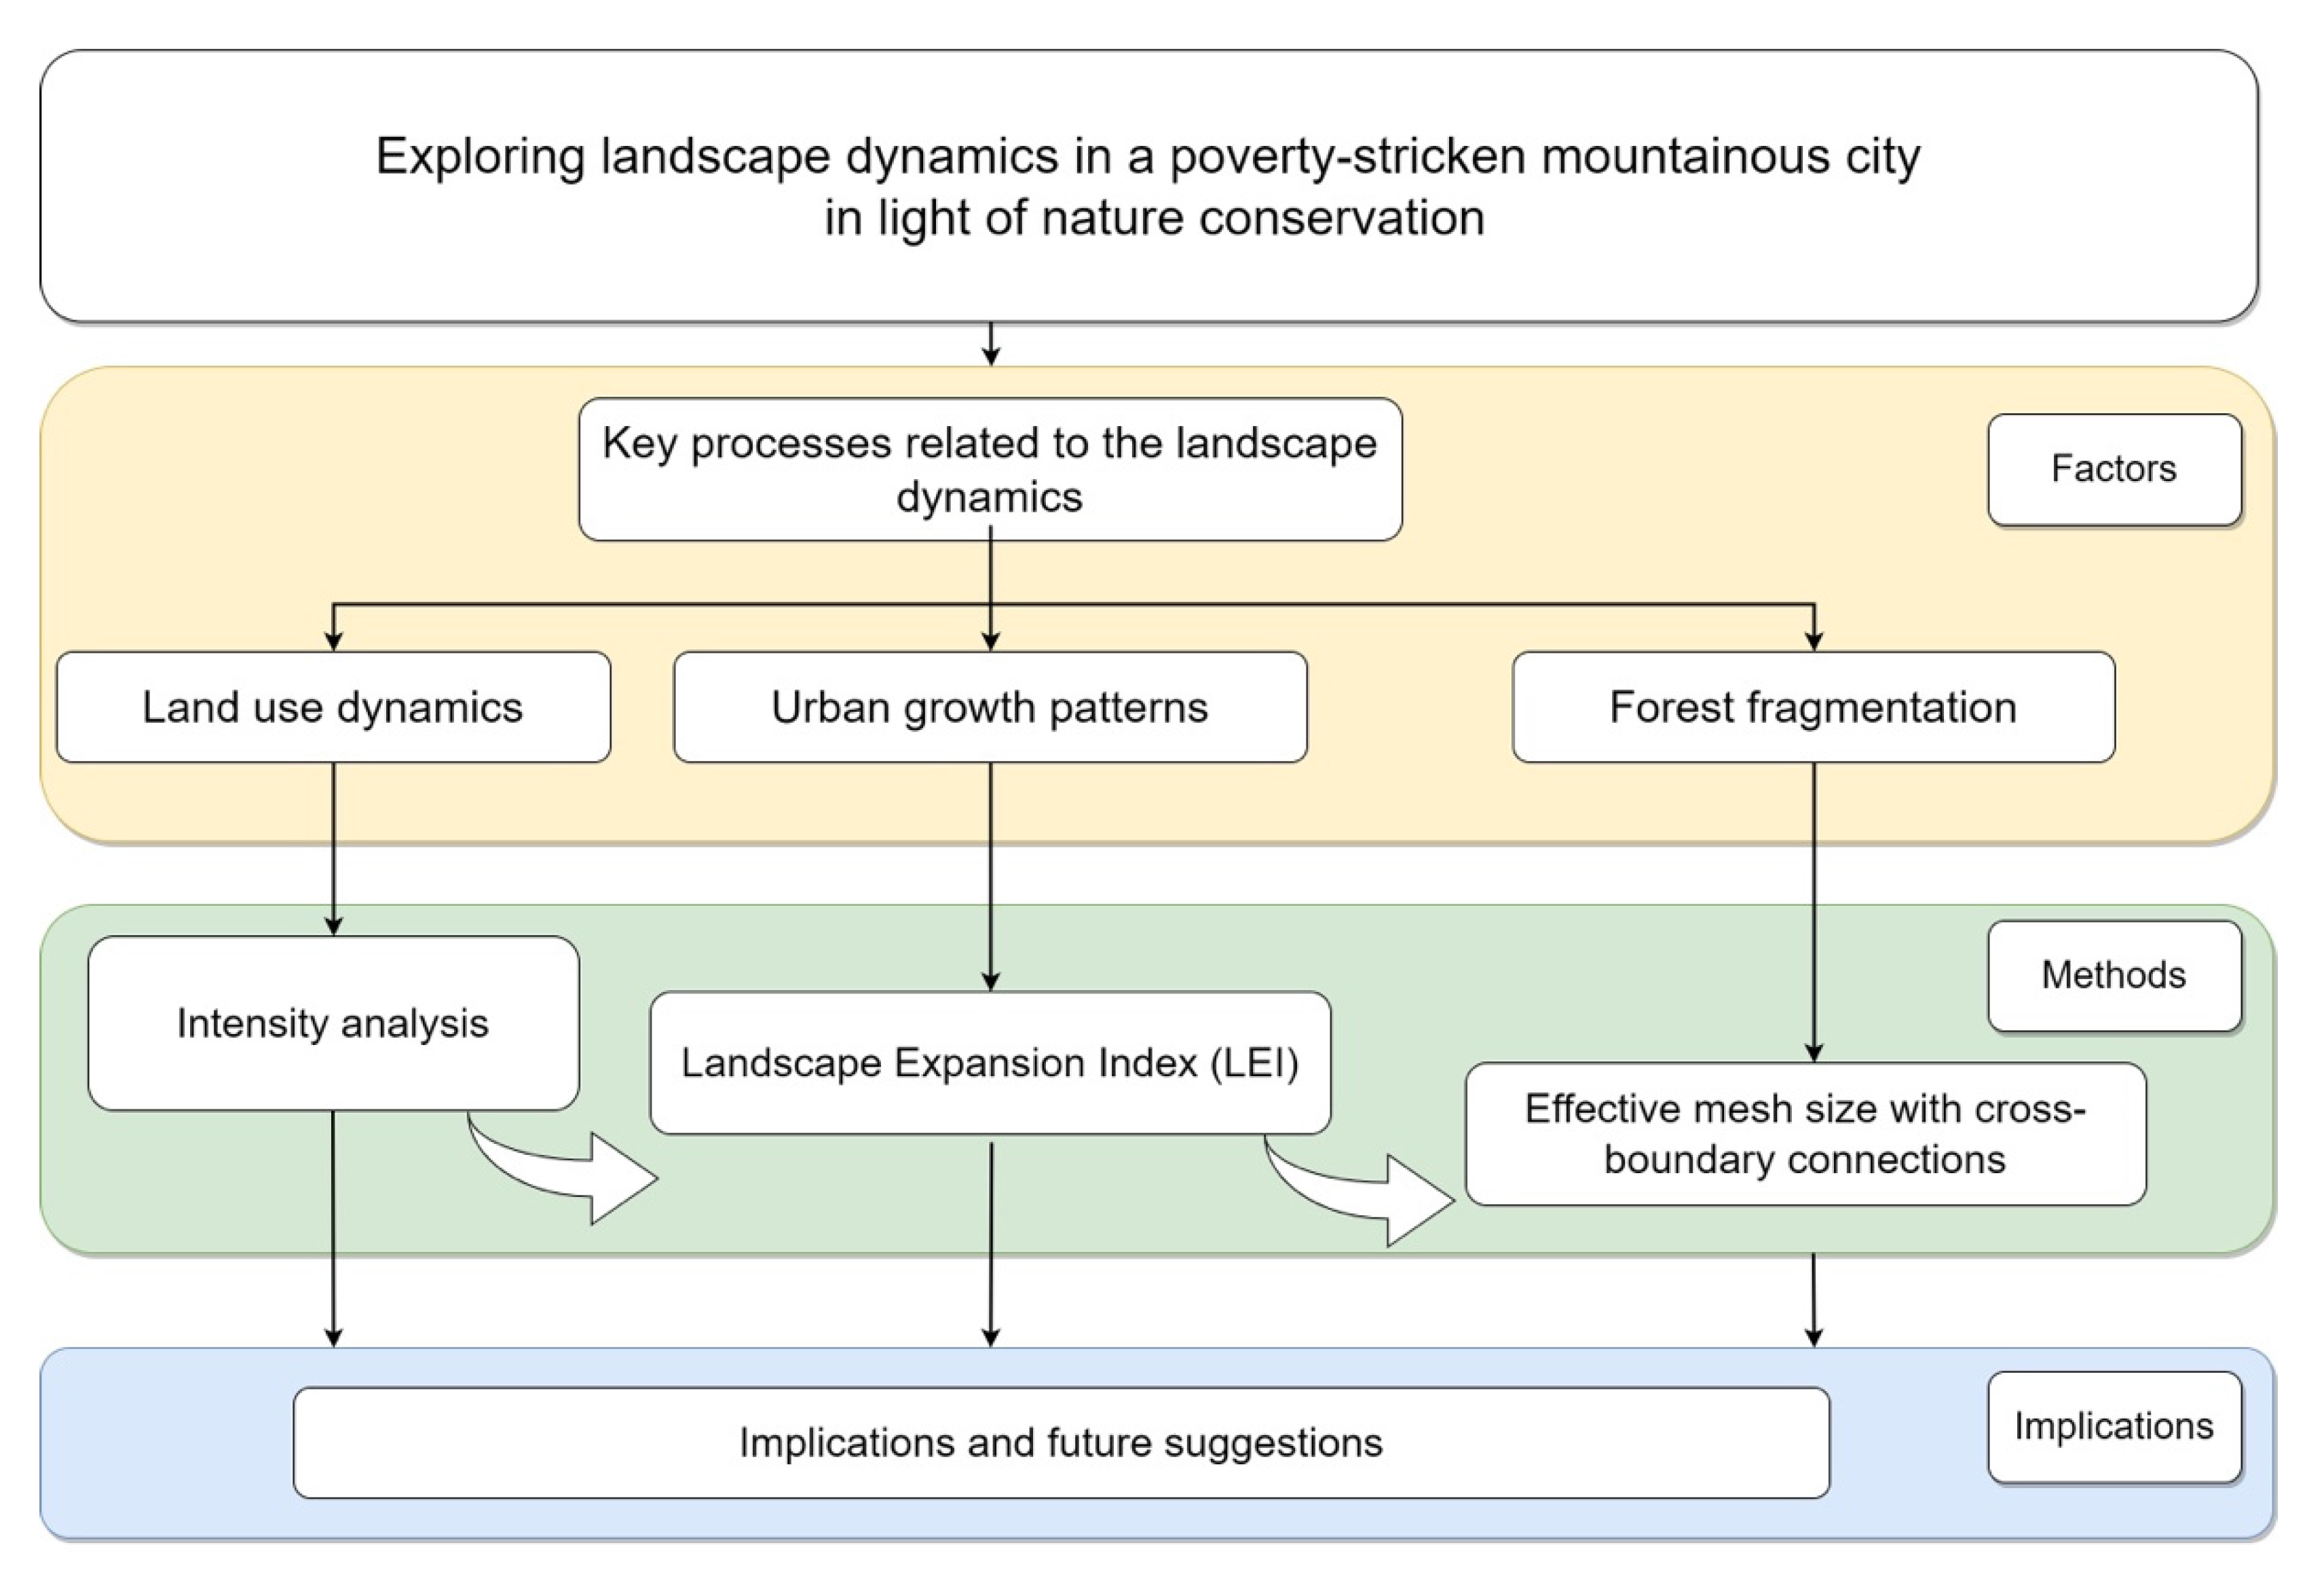
2.2.1. Data Sources and Analytical Framework
2.2.2. Intensity Analysis
2.2.3. Urban Growth Pattern Analysis
2.2.4. Fragmentation Analysis
3. Results
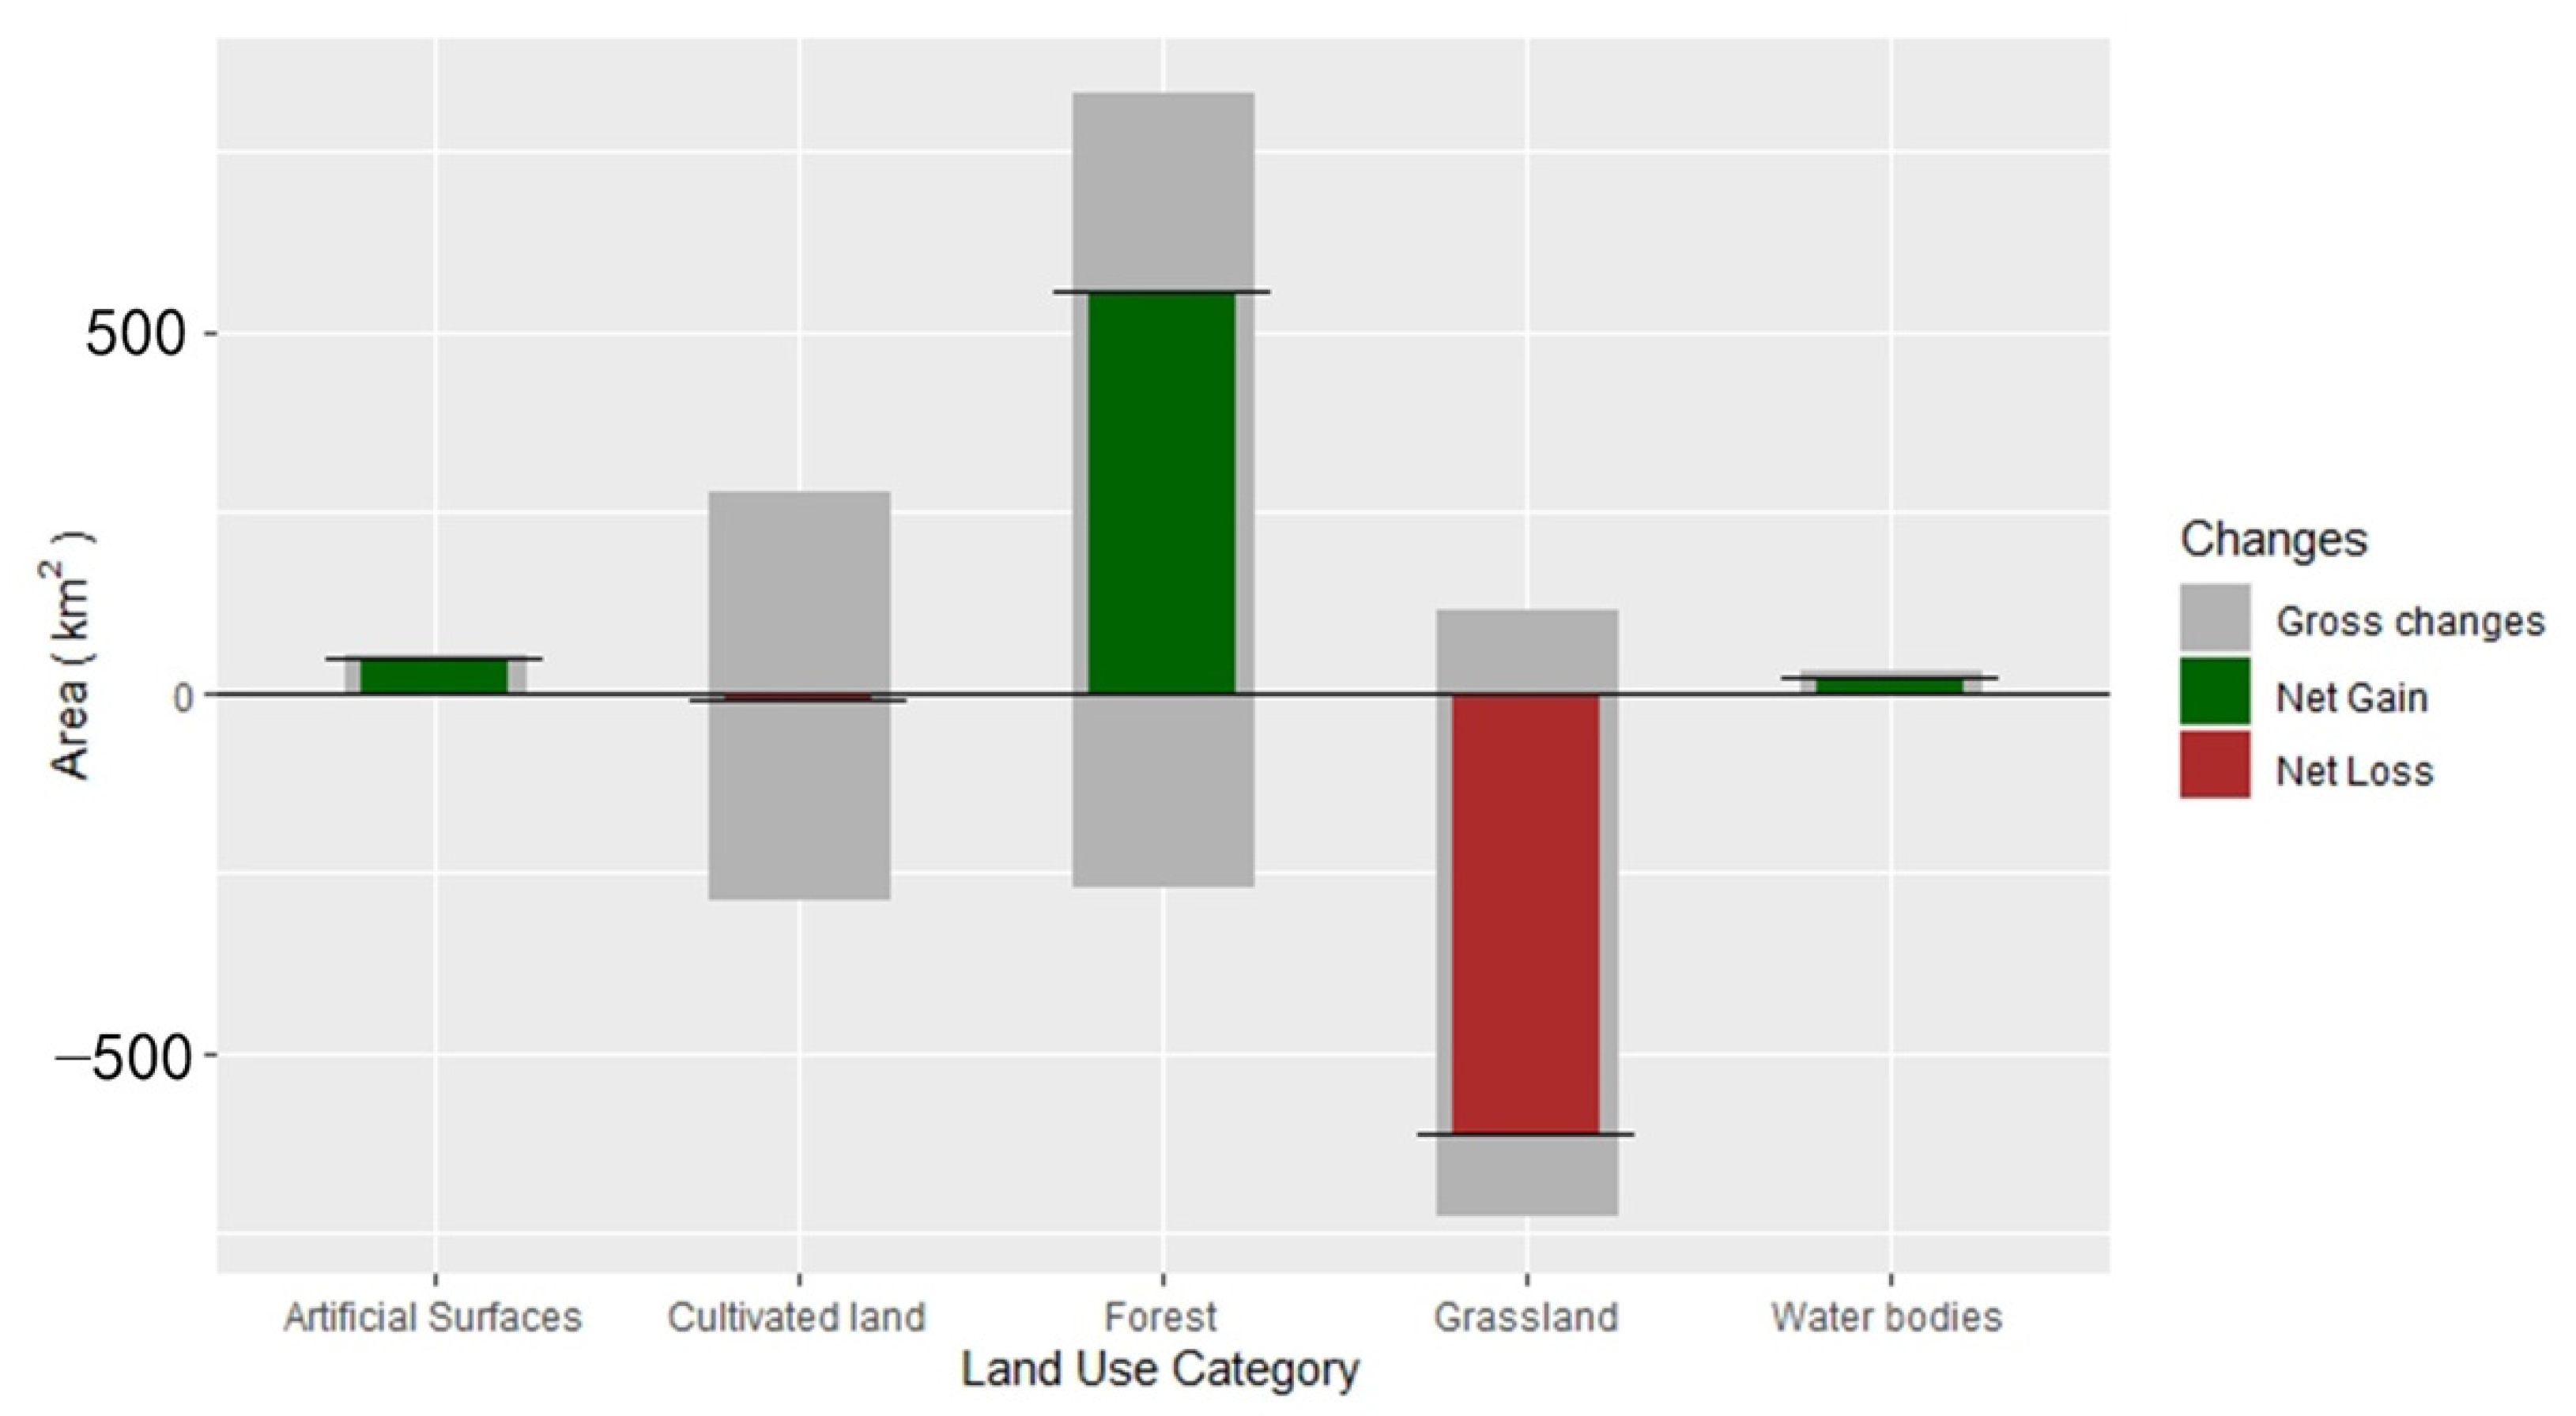
3.1. Land-Use Change
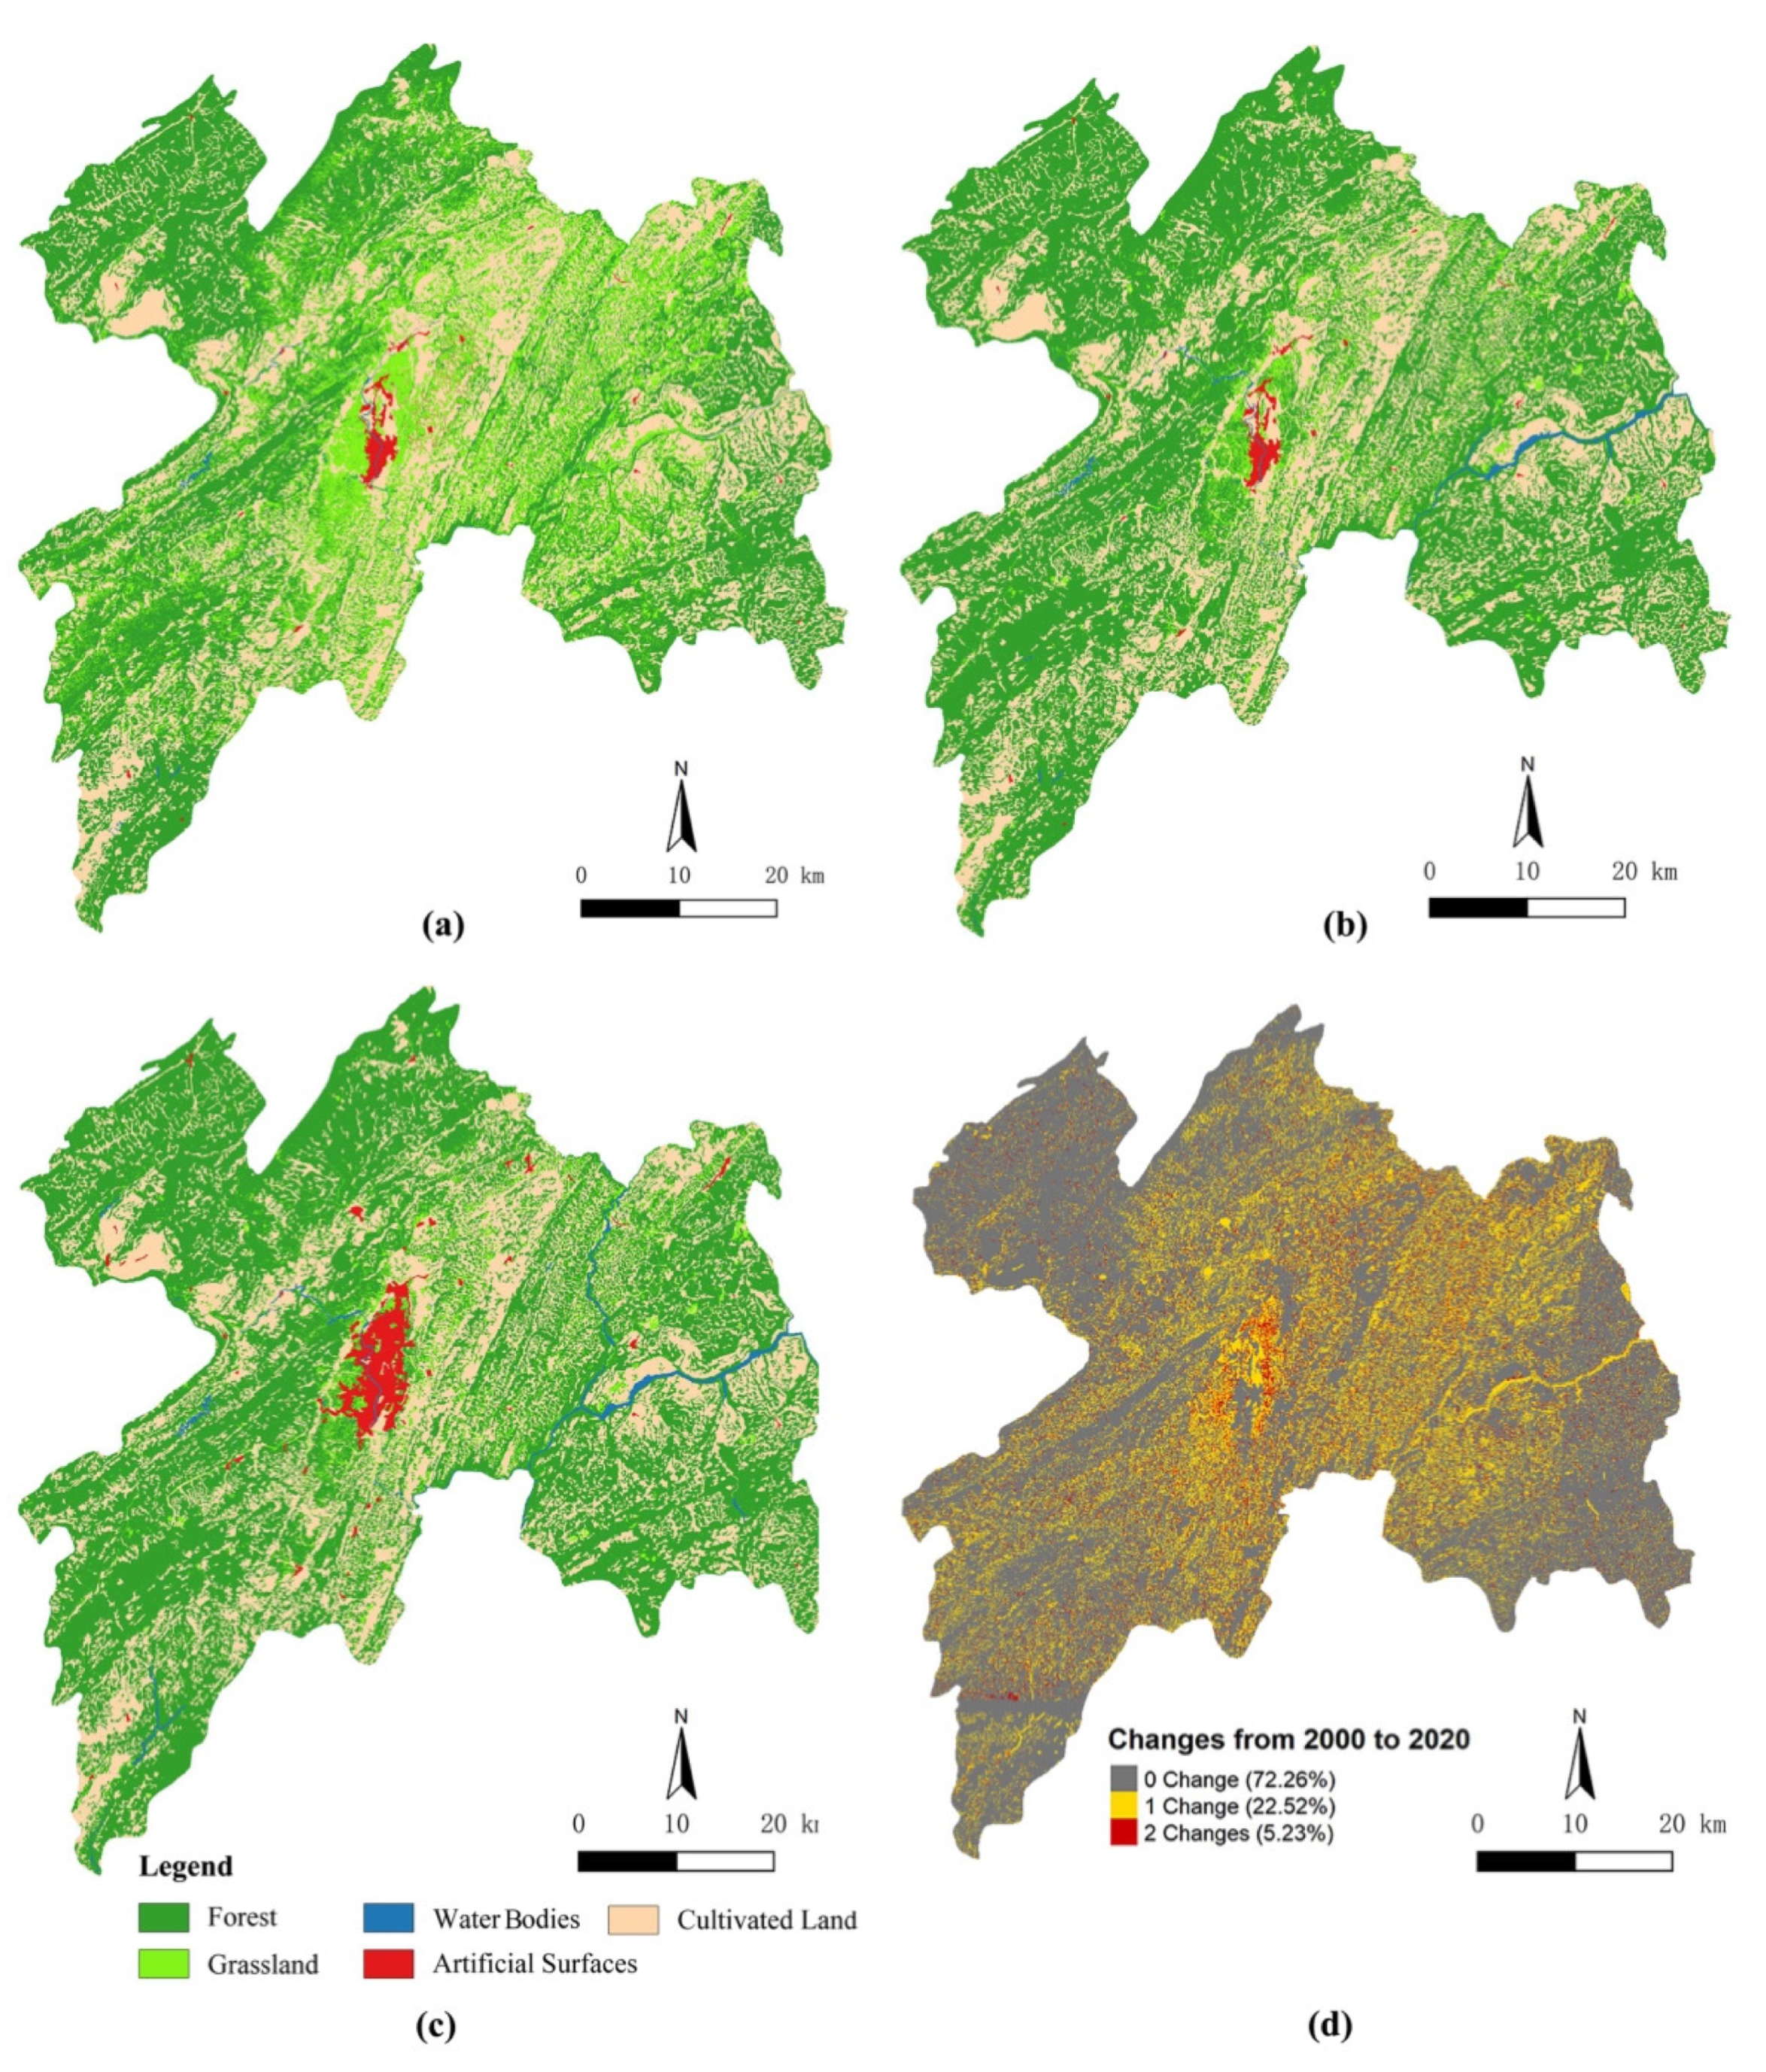
3.1.1. Land Use of Enshi City in 2000, 2010, and 2020
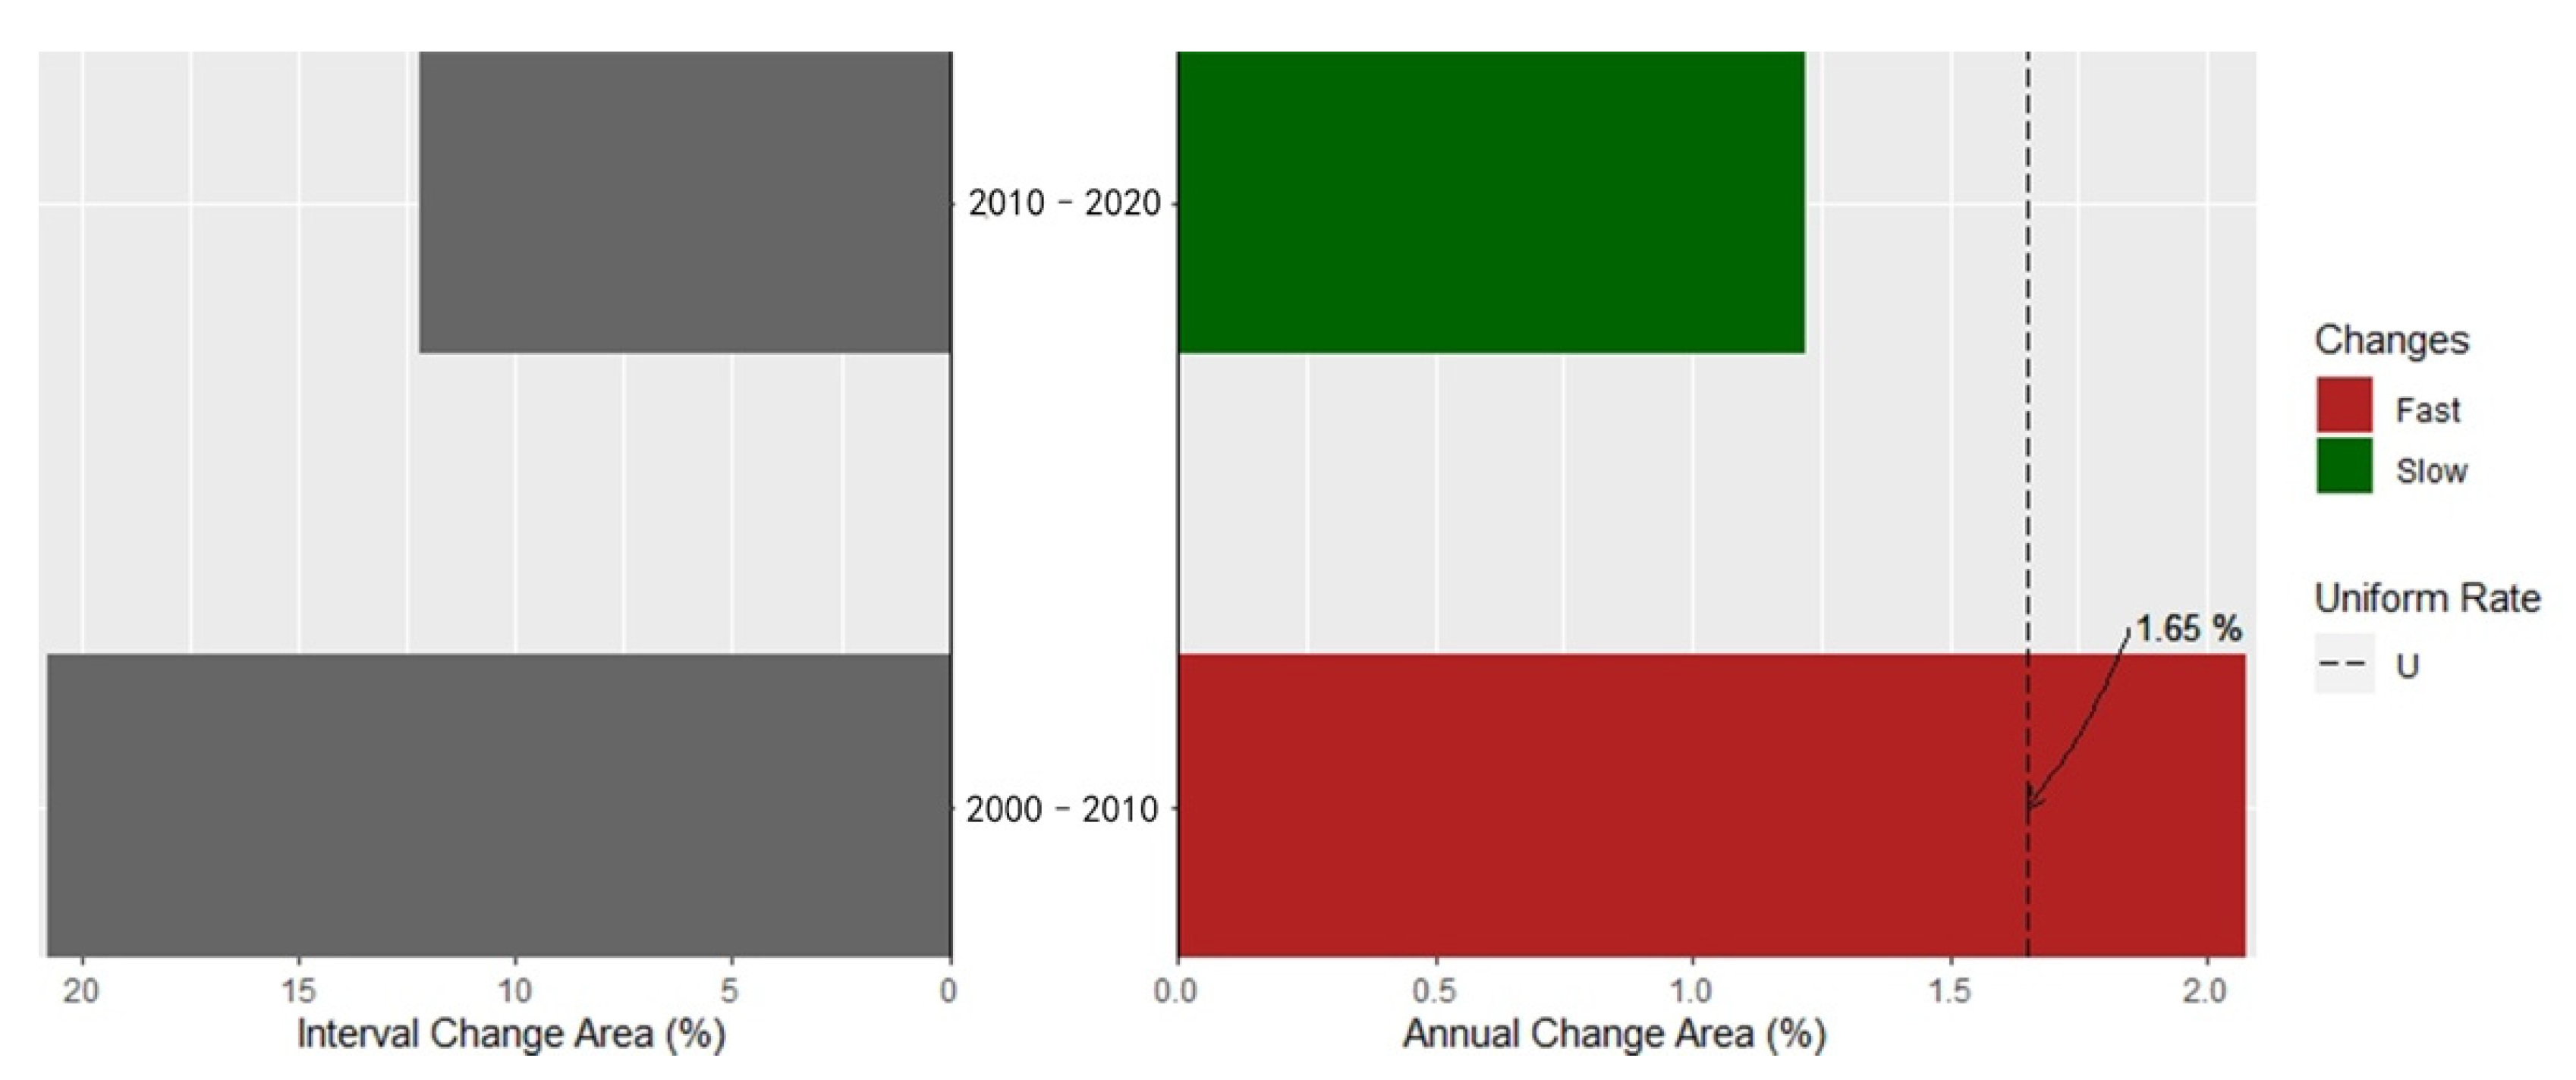
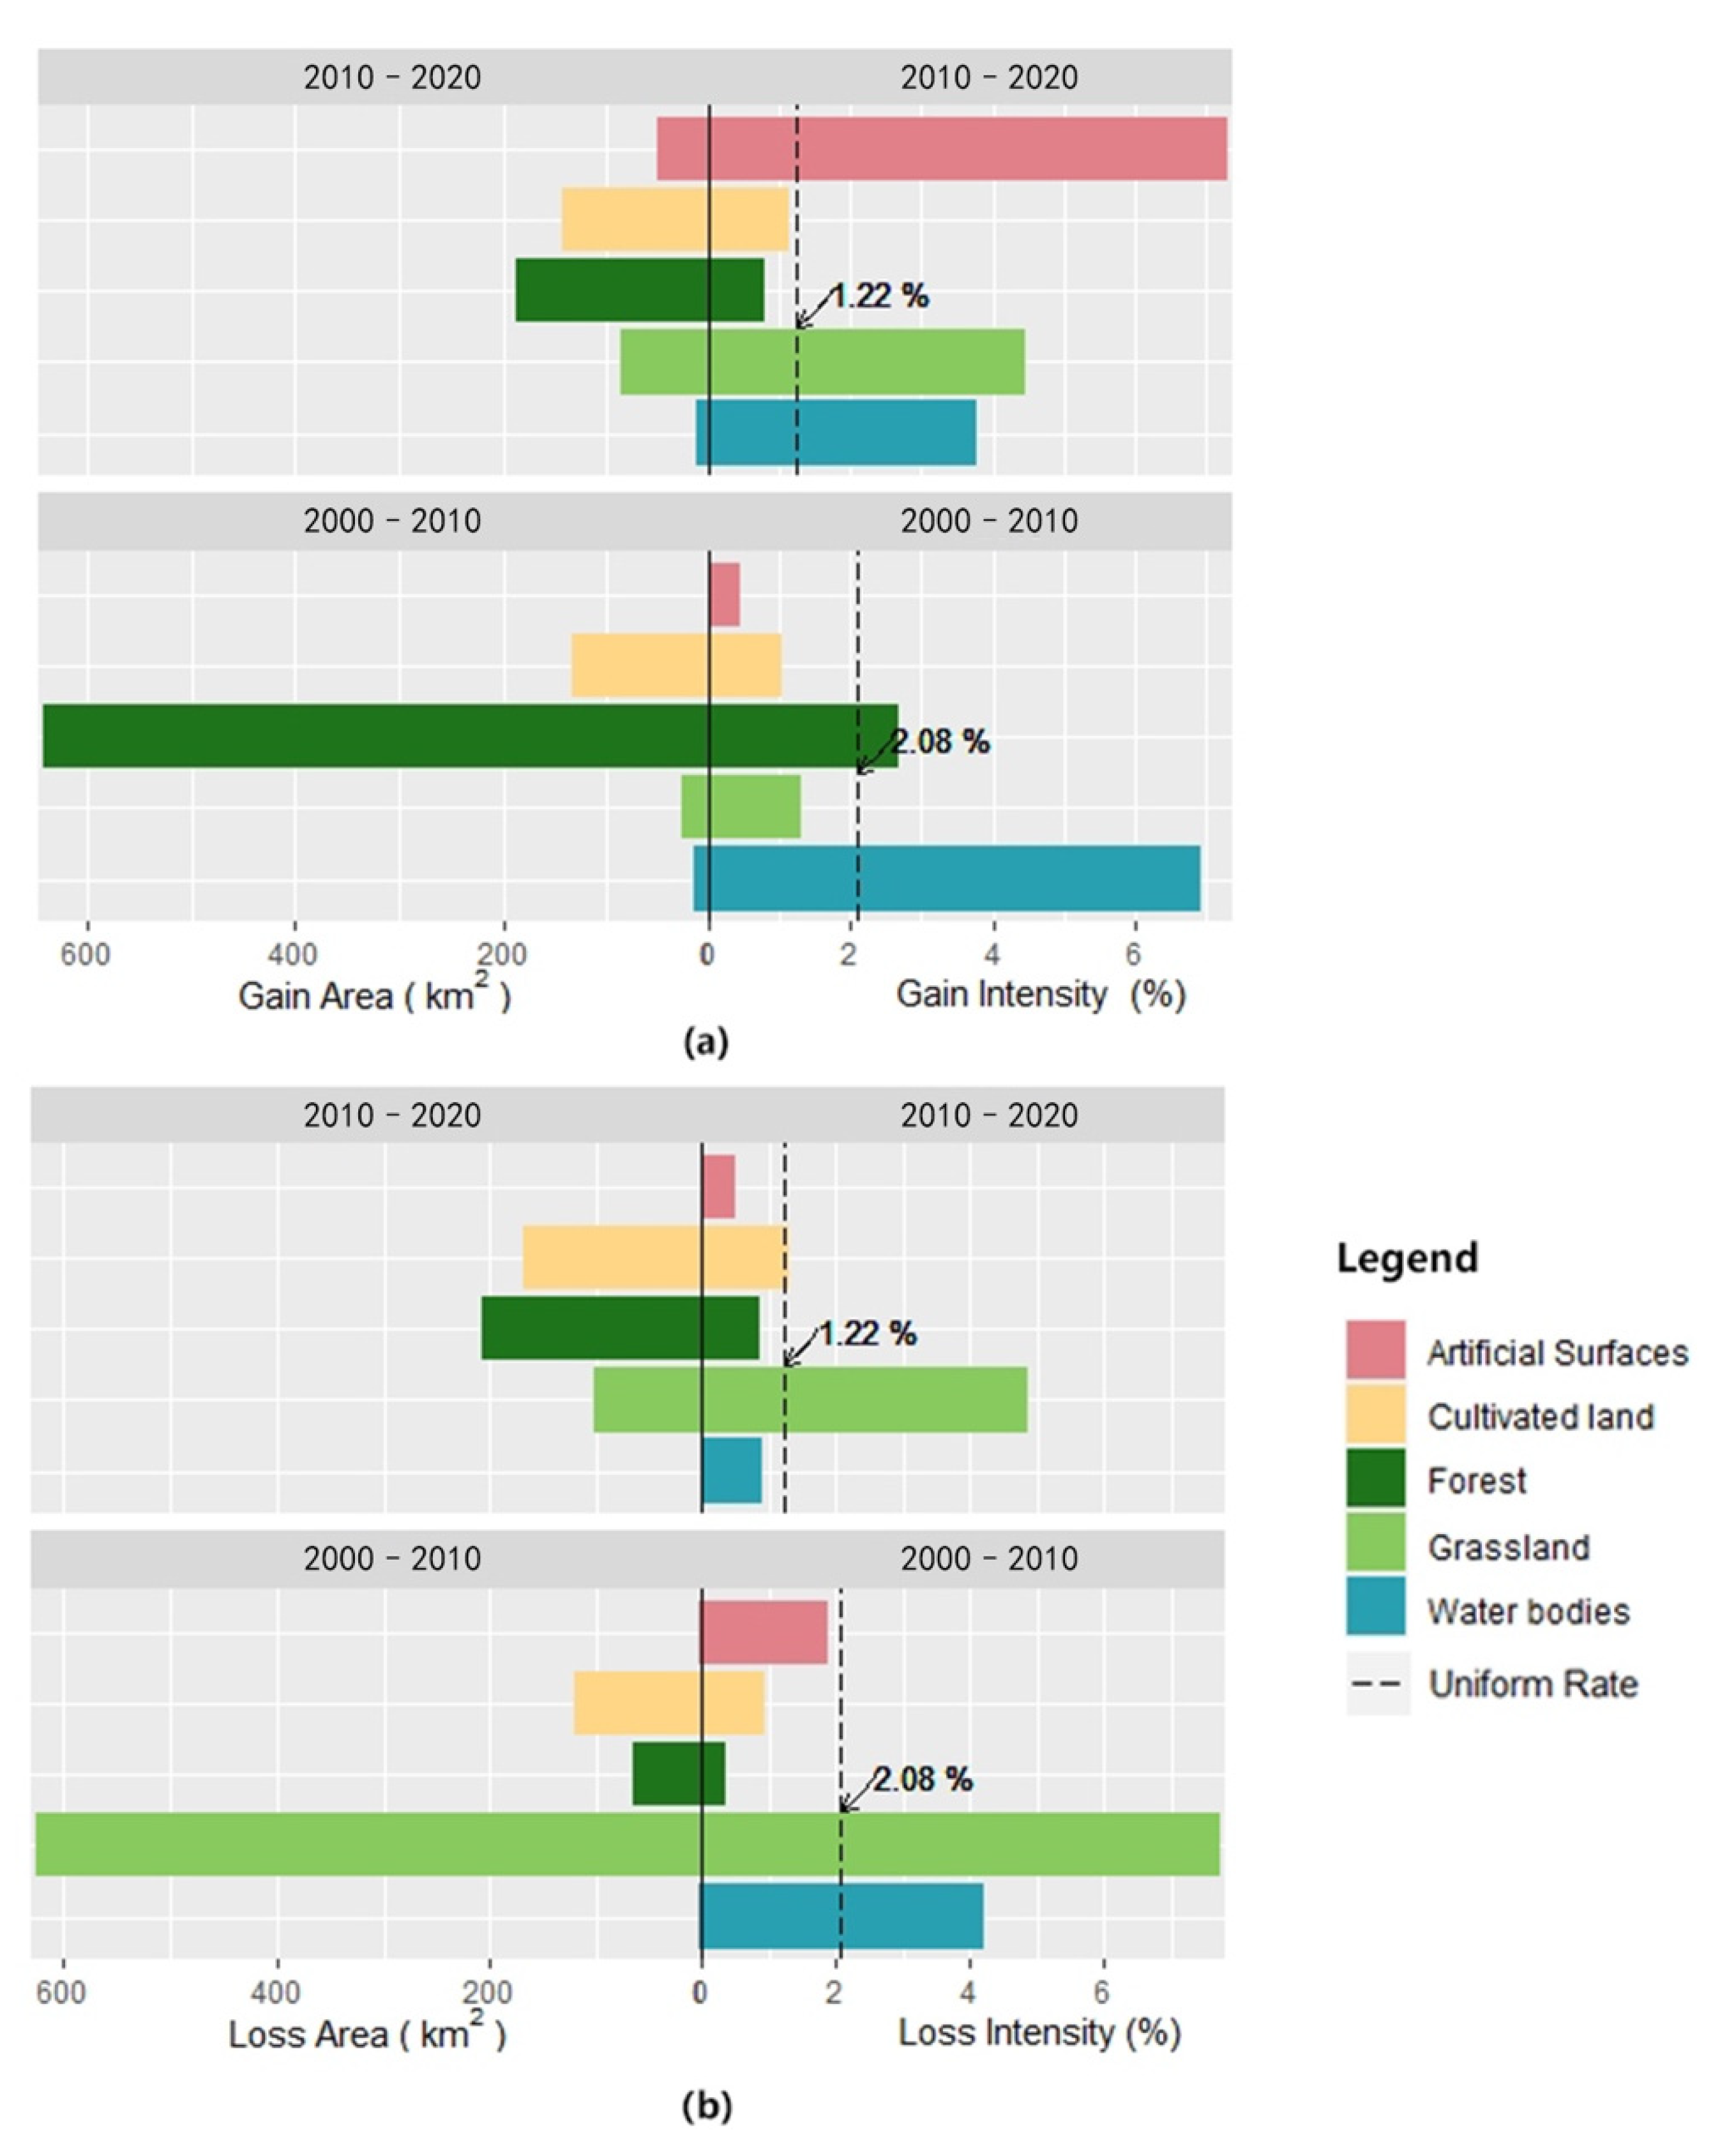
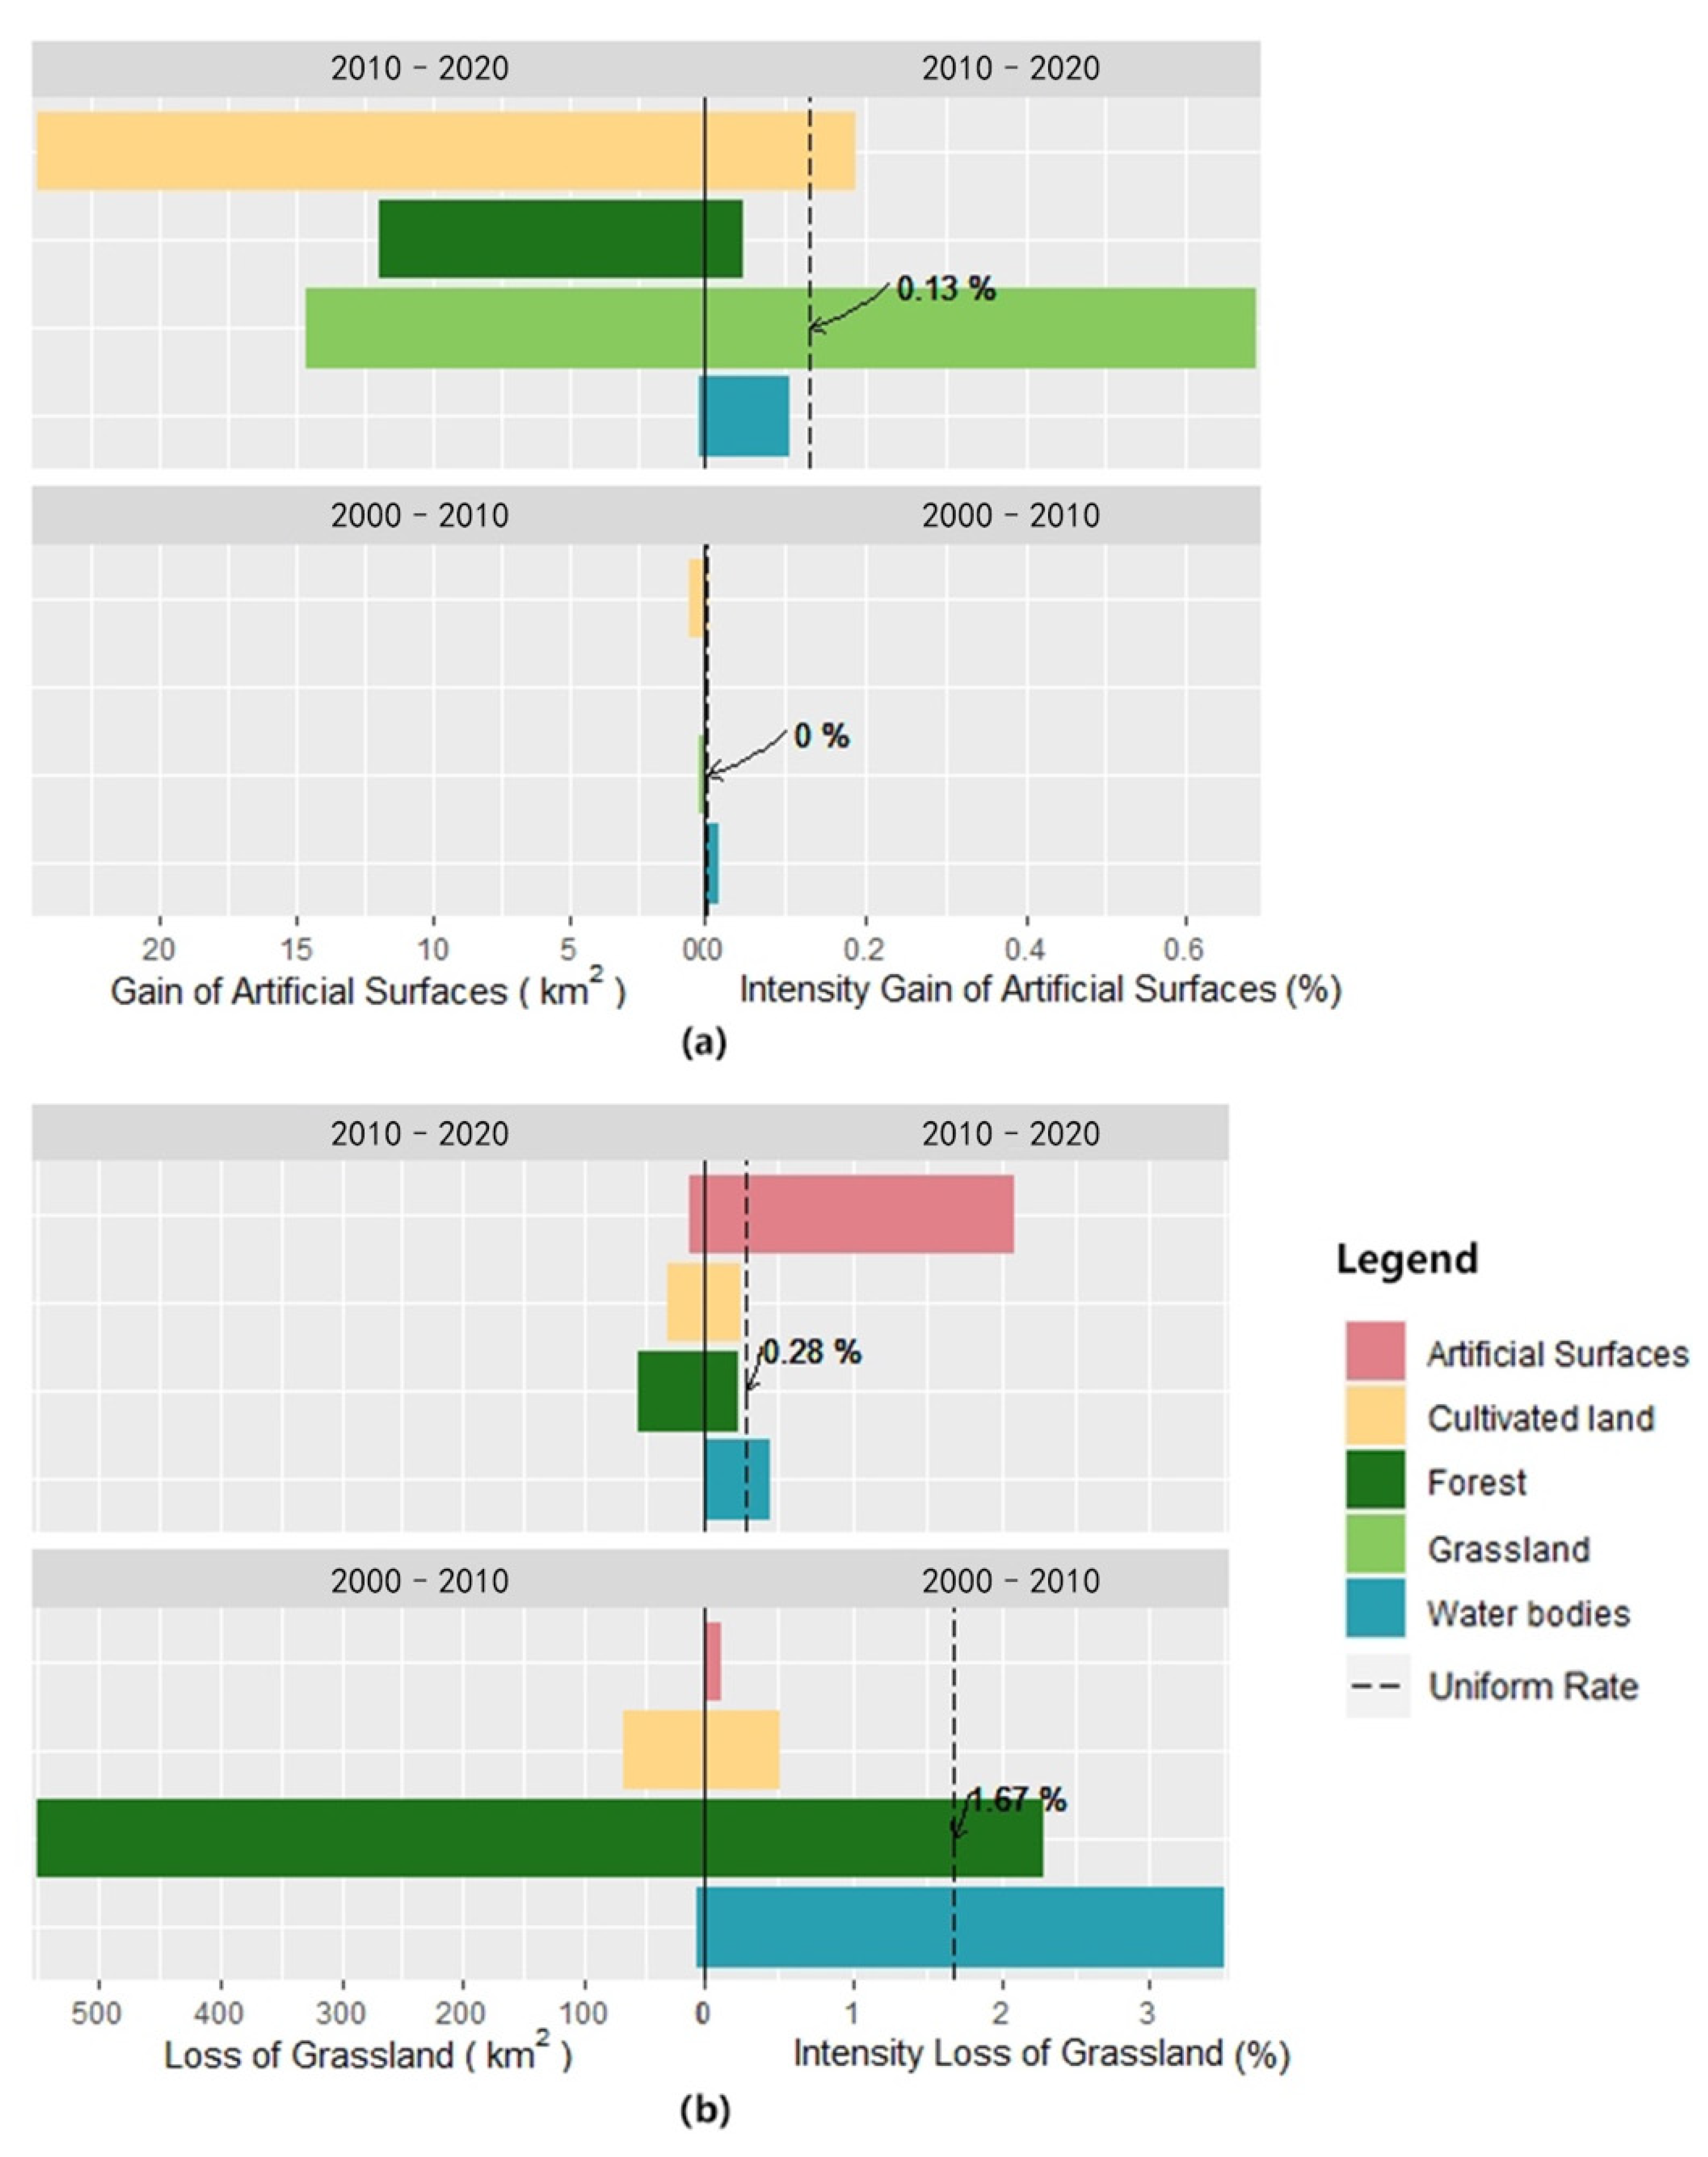
3.1.2. Results of Intensity Analysis
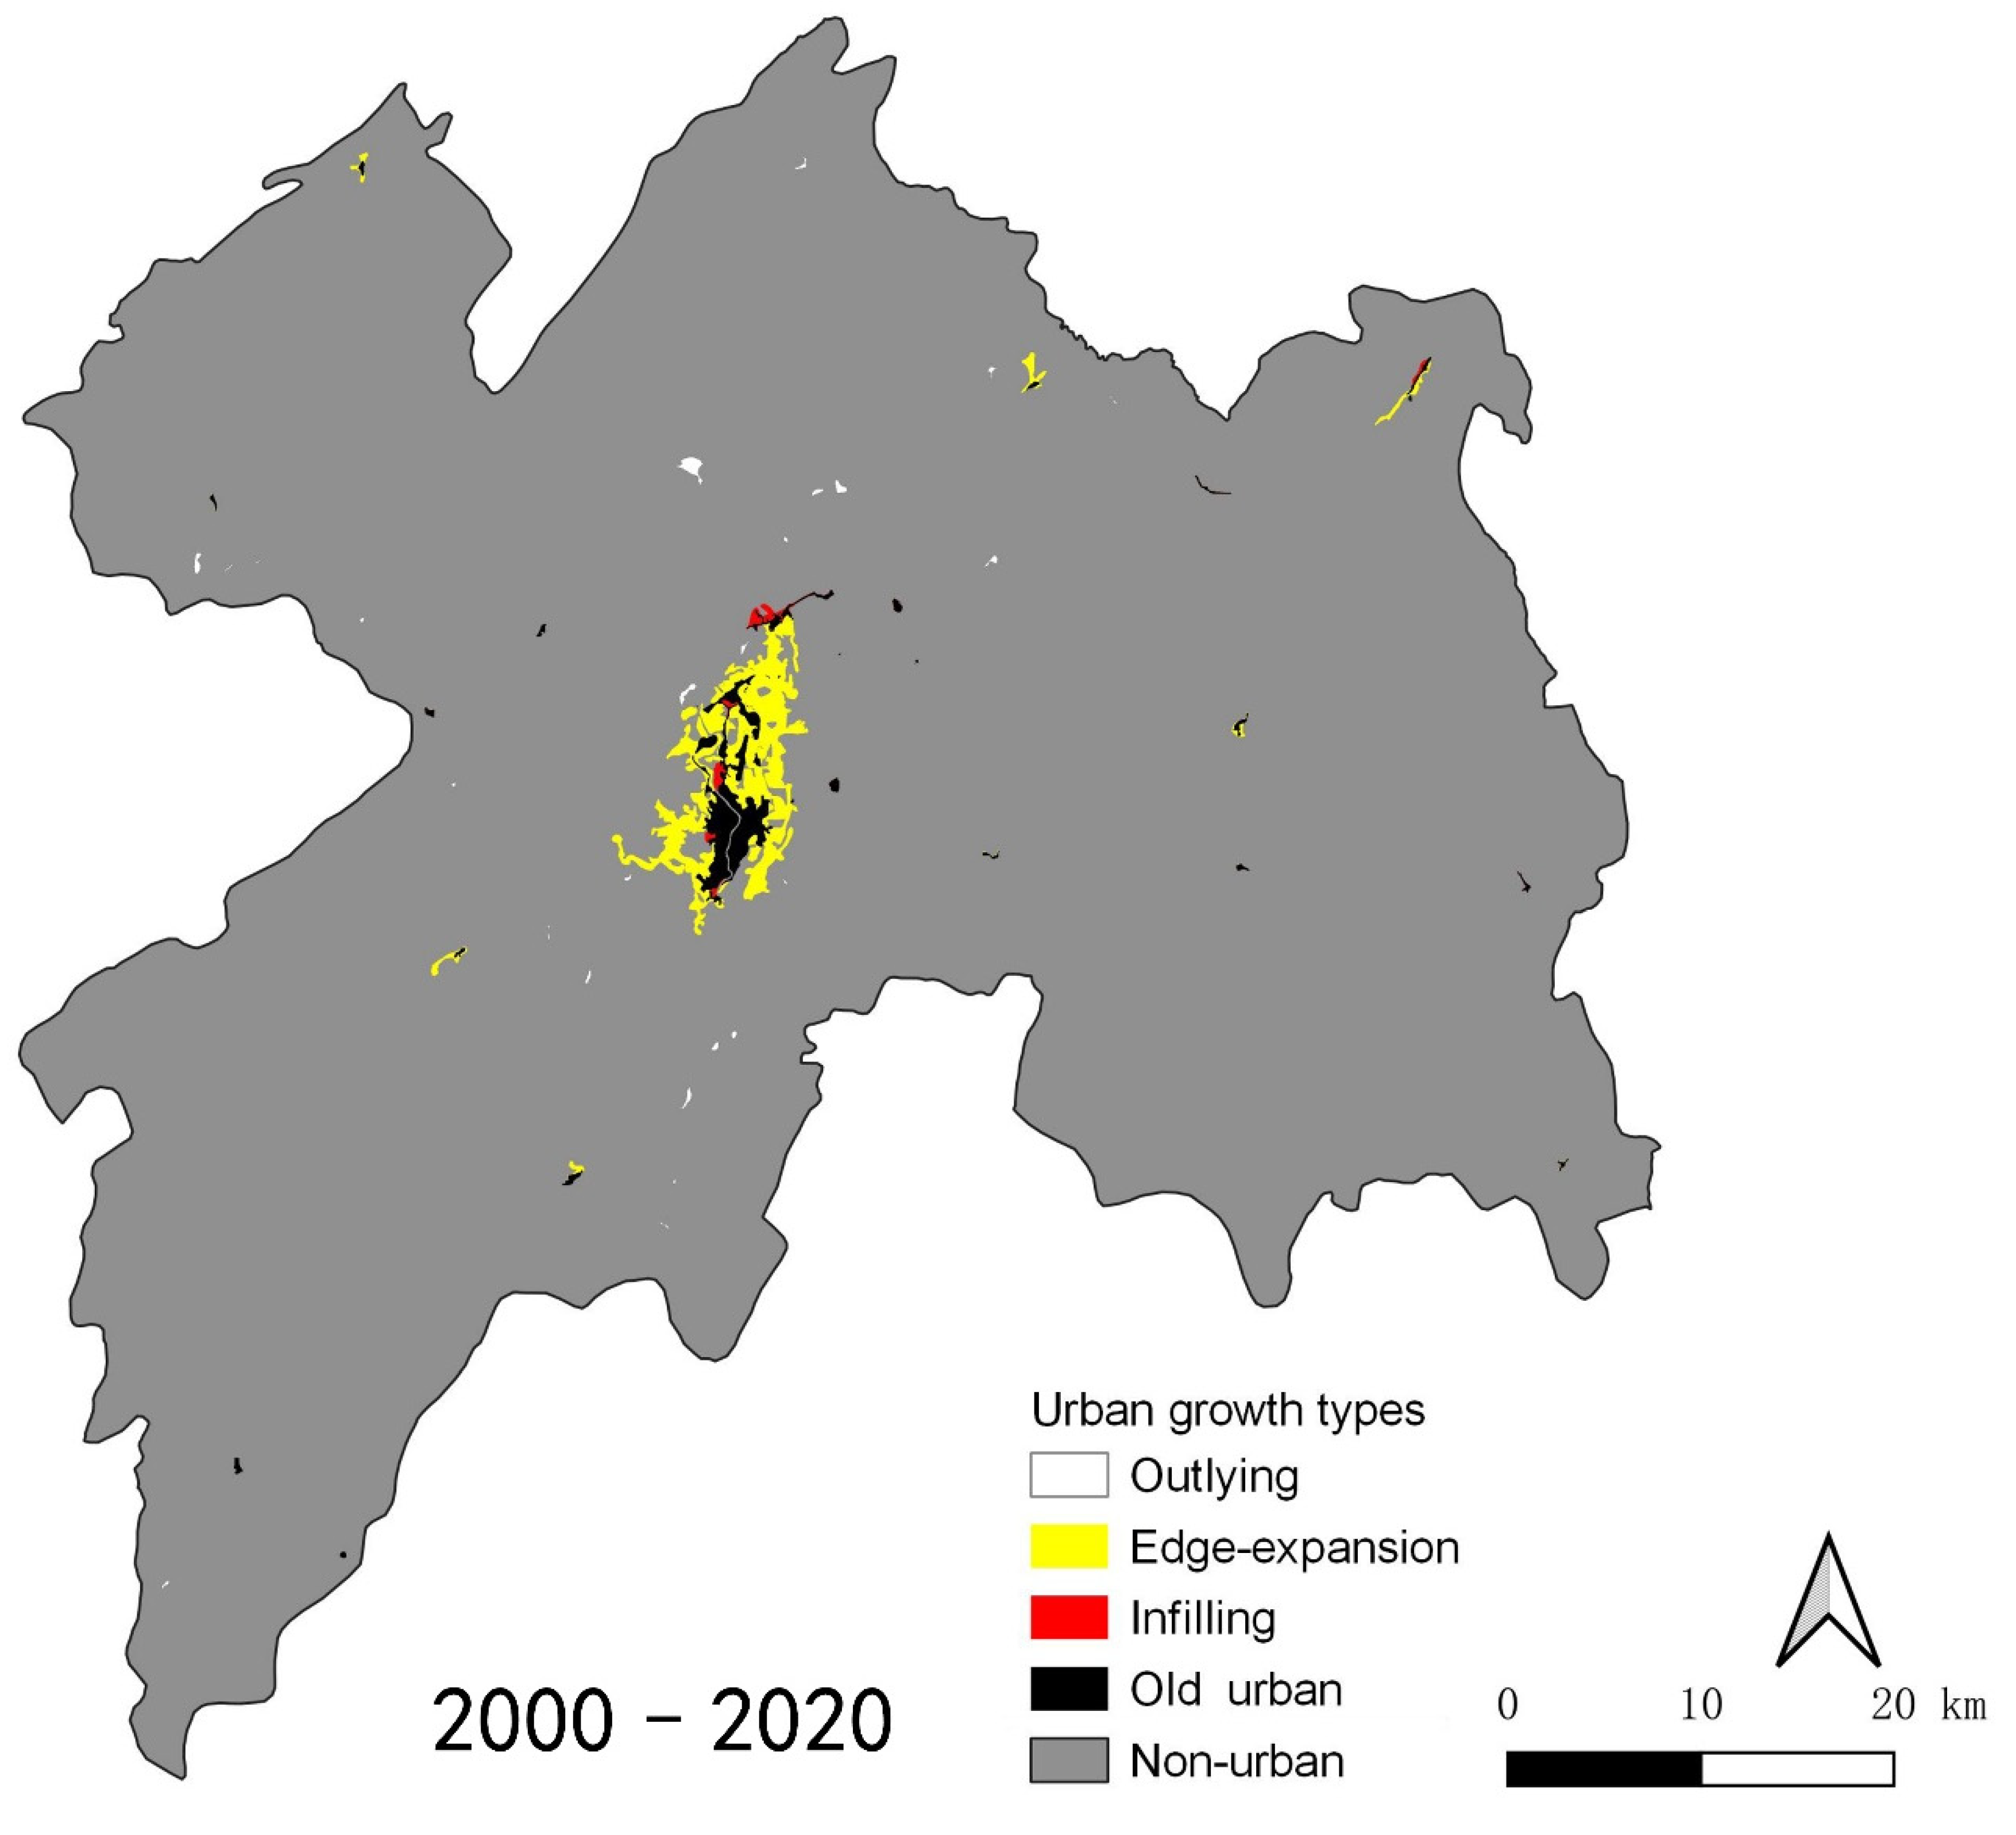
3.2. Urban Growth Pattern
3.3. Forest Fragmentation
4. Discussion
4.1. Insights from Analysis of Land-Use Change
4.2. Impacts of Land-Use Change on Landscape Fragmentation
4.3. Limitations
5. Conclusions
Author Contributions
Funding
Data Availability Statement
Acknowledgments
Conflicts of Interest
References
- Tovar, C.; Seijmonsbergen, A.C.; Duivenvoorden, J.F. Monitoring Land Use and Land Cover Change in Mountain Regions: An Example in the Jalca Grasslands of the Peruvian Andes. Landsc. Urban Plan. 2013, 112, 40–49. [Google Scholar] [CrossRef]
- Wang, Y.; Dai, E.; Yin, L.; Ma, L. Land Use/Land Cover Change and the Effects on Ecosystem Services in the Hengduan Mountain Region, China. Ecosyst. Serv. 2018, 34, 55–67. [Google Scholar] [CrossRef]
- Jia, L.; Ma, Q.; Du, C.; Hu, G.; Shang, C. Rapid Urbanization in a Mountainous Landscape: Patterns, Drivers, and Planning Implications. Landsc. Ecol. 2020, 35, 2449–2469. [Google Scholar] [CrossRef]
- FAO (Food and Agriculture Organization of the United Nations). Mountains as the Water Towers of the World: A Call for Action on the Sustainable Development Goals (SDGs). Available online: http://www.fao.org/fileadmin/templates/mountain_partnership/doc/POLICY_BRIEFS/SDGs_and_mountains_water_EN.pdf (accessed on 6 November 2020).
- Price, M.F. Mountains: Globally Important Ecosystems. Unasylva-FAO 1998, 49, 3–12. [Google Scholar]
- Bicudo da Silva, R.F.; Millington, J.D.A.; Moran, E.F.; Batistella, M.; Liu, J. Three Decades of Land-Use and Land-Cover Change in Mountain Regions of the Brazilian Atlantic Forest. Landsc. Urban Plan. 2020, 204, 103948. [Google Scholar] [CrossRef]
- FAO (Food and Agriculture Organization of the United Nations). The Vulnerability of Mountain Environments and Mountain People. Available online: https://www.fao.org/3/Y7352E/y7352e04.htm (accessed on 6 November 2020).
- Vannier, C.; Lefebvre, J.; Longaretti, P.-Y.; Lavorel, S. Patterns of Landscape Change in a Rapidly Urbanizing Mountain Region. Cybergeo 2016. UMR 8504 Géographie-cités. [Google Scholar] [CrossRef]
- Mansour, S.; Al-Belushi, M.; Al-Awadhi, T. Monitoring Land Use and Land Cover Changes in the Mountainous Cities of Oman Using GIS and CA-Markov Modelling Techniques. Land Use Policy 2020, 91, 104414. [Google Scholar] [CrossRef]
- Liang, X.; Li, Y. Identification of Spatial Coupling between Cultivated Land Functional Transformation and Settlements in Three Gorges Reservoir Area, China. Habitat Int. 2020, 104, 102236. [Google Scholar] [CrossRef]
- Xie, W.; Jin, W.; Chen, K.; Wu, J.; Zhou, C. Land Use Transition and Its Influencing Factors in Poverty-Stricken Mountainous Areas of Sangzhi County, China. Sustainability 2019, 11, 4915. [Google Scholar] [CrossRef] [Green Version]
- Liu, Y.; Yang, R.; Long, H.; Gao, J.; Wang, J. Implications of Land-Use Change in Rural China: A Case Study of Yucheng, Shandong Province. Land Use Policy 2014, 40, 111–118. [Google Scholar] [CrossRef]
- National Foresty and Grassland Administration. “Grain for Green” Regulation. Available online: http://www.forestry.gov.cn/main/3950/20170314/459878.html (accessed on 17 May 2021).
- Long, H.; Wu, X.; Wang, W.; Dong, G. Analysis of Urban-Rural Land-Use Change during 1995–2006 and Its Policy Dimensional Driving Forces in Chongqing, China. Sensors 2008, 8, 681–699. [Google Scholar] [CrossRef]
- Development and Reform Commission of Hunan Province The 13th Five-Year Plan on Hunan Wuling Mountian Area Development and Poverty Alleviation. Available online: http://fgw.hunan.gov.cn/xxgk_70899/tzgg/201710/t20171031_4628536.html (accessed on 20 May 2021).
- Aldwaik, S.Z.; Pontius, R.G. Intensity Analysis to Unify Measurements of Size and Stationarity of Land Changes by Interval, Category, and Transition. Landsc. Urban Plan. 2012, 106, 103–114. [Google Scholar] [CrossRef]
- Mallinis, G.; Koutsias, N.; Arianoutsou, M. Monitoring Land Use/Land Cover Transformations from 1945 to 2007 in Two Peri-Urban Mountainous Areas of Athens Metropolitan Area, Greece. Sci. Total Environ. 2014, 490, 262–278. [Google Scholar] [CrossRef]
- Huang, A.; Xu, Y.; Sun, P.; Zhou, G.; Liu, C.; Lu, L.; Xiang, Y.; Wang, H. Land Use/Land Cover Changes and Its Impact on Ecosystem Services in Ecologically Fragile Zone: A Case Study of Zhangjiakou City, Hebei Province, China. Ecol. Indic. 2019, 104, 604–614. [Google Scholar] [CrossRef]
- Peng, J.; Liu, Y.; Li, T.; Wu, J. Regional Ecosystem Health Response to Rural Land Use Change: A Case Study in Lijiang City, China. Ecol. Indic. 2017, 72, 399–410. [Google Scholar] [CrossRef]
- Pijanowski, B.C.; Robinson, K.D. Rates and Patterns of Land Use Change in the Upper Great Lakes States, USA: A Framework for Spatial Temporal Analysis. Landsc. Urban Plan. 2011, 102, 102–116. [Google Scholar] [CrossRef]
- Evans, T.P.; Moran, E.F. Spatial Integration of Social and Biophysical Factors Related to Landcover Change. Popul. Dev. Rev. 2002, 28, 165–186. [Google Scholar]
- Nechyba, T.J.; Walsh, R.P. Urban Sprawl. J. Econ. Perspect. 2004, 18, 177–200. [Google Scholar] [CrossRef] [Green Version]
- Liu, H.; Yuan, X.; Gan, S.; Yan, H.; Zhang, X.; He, Q. The Urban Space Expansion Analysis in Mountain Areas Based on GIS and RS. Appl. Mech. Mater. 2014, 444–445, 1255–1259. [Google Scholar] [CrossRef]
- Tang, J.; Li, Y.; Cui, S.; Xu, L.; Ding, S.; Nie, W. Linking Land-Use Change, Landscape Patterns, and Ecosystem Services in a Coastal Watershed of Southeastern China. Glob. Ecol. Conserv. 2020, 23, e01177. [Google Scholar] [CrossRef]
- Ferrara, A.; Salvati, L.; Sateriano, A.; Carlucci, M.; Gitas, I.; Biasi, R. Unraveling the ‘Stable’ Landscape: A Multi-Factor Analysis of Unchanged Agricultural and Forest Land (1987–2007) in a Rapidly-Expanding Urban Region. Urban Ecosyst. 2016, 19, 835–848. [Google Scholar] [CrossRef]
- Liu, Y.; Xu, Y. A Geographic Identification of Multidimensional Poverty in Rural China under the Framework of Sustainable Livelihoods Analysis. Appl. Geogr. 2016, 73, 62–76. [Google Scholar] [CrossRef]
- Jiao, W. Analyzing Multidimensional Measures of Poverty and Their Influences in China’s Qinba Mountains. Chin. J. Popul. Resour. Environ. 2020, 18, 214–221. [Google Scholar] [CrossRef]
- Zhou, L.; Xiong, L.Y. Natural Topographic Controls on the Spatial Distribution of Poverty-Stricken Counties in China. Appl. Geogr. 2018, 90, 282–292. [Google Scholar] [CrossRef]
- The Government of Enshi City. About Enshi City. Available online: http://www.es.gov.cn/zjes/ (accessed on 19 February 2021).
- Li, H.; Niu, X.; Wang, B.; Zhao, Z. Coupled Coordination of Ecosystem Services and Landscape Patterns: Take the Grain for Green Project in the Wuling Mountain Area as an Example. Acta Ecol. Sin. 2020, 40, 4316–4326. [Google Scholar]
- Zhang, J. Research on Ecological Security Assessment of Enshi. Doctoral thesis, Central China Normal University, Wuhan, China, 2015. [Google Scholar]
- Hubei Provincial People’s Government. All the 37 Poverty-Stricken Counties in Hubei Province Eliminated Poverty. Available online: http://www.hubei.gov.cn/hbfb/bmdt/202004/t20200423_2239712.shtml (accessed on 19 December 2020).
- Enshi Prefecture Statistics Bureau. Enshi Statistical Yearbook; Enshi Prefecture Statistics Bureau: Enshi, China, 2019. [Google Scholar]
- He, Q.; Zhou, J.; Tan, S.; Song, Y.; Zhang, L.; Mou, Y.; Wu, J. What Is the Developmental Level of Outlying Expansion Patches? A Study of 275 Chinese Cities Using Geographical Big Data. Cities 2020, 105, 102395. [Google Scholar] [CrossRef]
- Tachikawa, T.; Kaku, M.; Iwasaki, A.; Gesch, D.B.; Oimoen, M.J.; Zhang, Z.; Danielson, J.J.; Krieger, T.; Curtis, B.; Haase, J. ASTER Global Digital Elevation Model Version 2-Summary of Validation Results. Available online: https://pubs.er.usgs.gov/publication/70005960 (accessed on 10 November 2020).
- National Geomatics Center of China. GlobeLand30 Product Introduction. Available online: http://www.globallandcover.com/Page/EN_sysFrame/dataIntroduce.html?columnID=81&head=product¶=product&type=data (accessed on 8 November 2020).
- Jun, C.; Ban, Y.; Li, S. Open Access to Earth Land-Cover Map. Nature 2014, 514, 434. [Google Scholar] [CrossRef] [Green Version]
- Feng, Y.; Lei, Z.; Tong, X.; Gao, C.; Chen, S.; Wang, J.; Wang, S. Spatially-Explicit Modeling and Intensity Analysis of China’s Land Use Change 2000–2050. J. Environ. Manag. 2020, 263, 110407. [Google Scholar] [CrossRef]
- Sun, X.; Li, G.; Wang, J.; Wang, M. Quantifying the Land Use and Land Cover Changes in the Yellow River Basin While Accounting for Data Errors Based on GlobeLand30 Maps. Land 2021, 10, 31. [Google Scholar] [CrossRef]
- Dong, S.; Gao, B.; Pan, Y.; Li, R.; Chen, Z. Assessing the Suitability of FROM-GLC10 Data for Understanding Agricultural Ecosystems in China: Beijing as a Case Study. Remote Sens. Lett. 2020, 11, 11–18. [Google Scholar] [CrossRef]
- Gong, P.; Liu, H.; Zhang, M.; Li, C.; Wang, J.; Huang, H.; Clinton, N.; Ji, L.; Li, W.; Bai, Y.; et al. Stable Classification with Limited Sample: Transferring a 30-m Resolution Sample Set Collected in 2015 to Mapping 10-m Resolution Global Land Cover in 2017. Sci. Bull. 2019, 64, 370–373. [Google Scholar] [CrossRef] [Green Version]
- Venter, Z.S.; Barton, D.N.; Chakraborty, T.; Simensen, T.; Singh, G. Global 10 m Land Use Land Cover Datasets: A Comparison of Dynamic World, World Cover and Esri Land Cover. Remote Sens. 2022, 14, 4101. [Google Scholar] [CrossRef]
- Wang, H.; Wen, X.; Wang, Y.; Cai, L.; Peng, D.; Liu, Y. China’s Land Cover Fraction Change during 2001–2015 Based on Remote Sensed Data Fusion between Mcd12 and Cci-Lc. Remote Sens. 2021, 13, 341. [Google Scholar] [CrossRef]
- Exavier, R.; Zeilhofer, P. OpenLand: Quantitative Analysis and Visualization of LUCC. Available online: https://cran.r-project.org/package=OpenLand (accessed on 10 November 2020).
- Hijmans, R.J. Terra: Spatial Data Analysis. Available online: https://cran.r-project.org/package=terra (accessed on 6 November 2020).
- Pebesma, E. Simple Features for R: Standardized Support for Spatial Vector Data. R J. 2018, 10, 439. [Google Scholar] [CrossRef] [Green Version]
- Hesselbarth, M.H.K.; Sciaini, M.; With, K.A.; Wiegand, K.; Nowosad, J. Landscapemetrics: An Open-Source R Tool to Calculate Landscape Metrics. Ecography 2019, 42, 1648–1657. [Google Scholar] [CrossRef] [Green Version]
- Lovelace, R.; Martijn, T. ClockBoard: A Zoning System for Urban Analysis. Available online: https://zonebuilders.github.io/zonebuilder/articles/paper.html (accessed on 1 May 2021).
- Estoque, R.C.; Murayama, Y. Intensity and Spatial Pattern of Urban Land Changes in the Megacities of Southeast Asia. Land Use Policy 2015, 48, 213–222. [Google Scholar] [CrossRef]
- Teixeira, Z.; Marques, J.C.; Pontius, R.G. Evidence for Deviations from Uniform Changes in a Portuguese Watershed Illustrated by CORINE Maps: An Intensity Analysis Approach. Ecol. Indic. 2016, 66, 282–290. [Google Scholar] [CrossRef] [Green Version]
- Akinyemi, F.O.; Pontius, R.G.; Braimoh, A.K. Land Change Dynamics: Insights from Intensity Analysis Applied to an African Emerging City. J. Spat. Sci. 2017, 62, 69–83. [Google Scholar] [CrossRef]
- Pontius, R.G.; Gao, Y.; Giner, N.M.; Kohyama, T.; Osaki, M.; Hirose, K. Design and Interpretation of Intensity Analysis Illustrated by Land Change in Central Kalimantan, Indonesia. Land 2013, 2, 351–369. [Google Scholar] [CrossRef]
- Liu, X.; Li, X.; Chen, Y.; Tan, Z.; Li, S.; Ai, B. A New Landscape Index for Quantifying Urban Expansion Using Multi-Temporal Remotely Sensed Data. Landsc. Ecol. 2010, 25, 671–682. [Google Scholar] [CrossRef]
- Bosch, M.; Jaligot, R.; Chenal, J. Spatiotemporal Patterns of Urbanization in Three Swiss Urban Agglomerations: Insights from Landscape Metrics, Growth Modes and Fractal Analysis. Landsc. Ecol. 2020, 35, 879–891. [Google Scholar] [CrossRef]
- He, Q.; Zeng, C.; Xie, P.; Tan, S.; Wu, J. Comparison of Urban Growth Patterns and Changes between Three Urban Agglomerations in China and Three Metropolises in the USA from 1995 to 2015. Sustain. Cities Soc. 2019, 50, 101649. [Google Scholar] [CrossRef]
- Pili, S.; Serra, P.; Salvati, L. Landscape and the City: Agro-Forest Systems, Land Fragmentation and the Ecological Network in Rome, Italy. Urban For. Urban Green. 2019, 41, 230–237. [Google Scholar] [CrossRef]
- Peng, J.; Wang, Y.; Zhang, Y.; Wu, J.; Li, W.; Li, Y. Evaluating the Effectiveness of Landscape Metrics in Quantifying Spatial Patterns. Ecol. Indic. 2010, 10, 217–223. [Google Scholar] [CrossRef]
- Frank, S.; Fürst, C.; Koschke, L.; Witt, A.; Makeschin, F. Assessment of Landscape Aesthetics—Validation of a Landscape Metrics-Based Assessment by Visual Estimation of the Scenic Beauty. Ecol. Indic. 2013, 32, 222–231. [Google Scholar] [CrossRef]
- Wan, L.; Zhang, Y.; Zhang, X.; Qi, S.; Na, X. Comparison of Land Use/Land Cover Change and Landscape Patterns in Honghe National Nature Reserve and the Surrounding Jiansanjiang Region, China. Ecol. Indic. 2015, 51, 205–214. [Google Scholar] [CrossRef]
- Xiao, H.; Liu, Y.; Li, L.; Yu, Z.; Zhang, X. Spatial Variability of Local Rural Landscape Change under Rapid Urbanization in Eastern China. ISPRS Int. J. Geo-Inf. 2018, 7, 231. [Google Scholar] [CrossRef] [Green Version]
- Sakieh, Y.; Salmanmahiny, A. Performance Assessment of Geospatial Simulation Models of Land-Use Change—A Landscape Metric-Based Approach. Environ. Monit. Assess. 2016, 188, 169. [Google Scholar] [CrossRef]
- Li, C.; Li, J.; Wu, J. Quantifying the Speed, Growth Modes, and Landscape Pattern Changes of Urbanization: A Hierarchical Patch Dynamics Approach. Landsc. Ecol. 2013, 28, 1875–1888. [Google Scholar] [CrossRef]
- Fan, C.; Myint, S. A Comparison of Spatial Autocorrelation Indices and Landscape Metrics in Measuring Urban Landscape Fragmentation. Landsc. Urban Plan. 2014, 121, 117–128. [Google Scholar] [CrossRef]
- Girvetz, E.H.; Thorne, J.H.; Berry, A.M.; Jaeger, J.A.G. Integration of Landscape Fragmentation Analysis into Regional Planning: A Statewide Multi-Scale Case Study from California, USA. Landsc. Urban Plan. 2008, 86, 205–218. [Google Scholar] [CrossRef]
- Liu, S.; Dong, Y.; Deng, L.; Liu, Q.; Zhao, H.; Dong, S. Forest Fragmentation and Landscape Connectivity Change Associated with Road Network Extension and City Expansion: A Case Study in the Lancang River Valley. Ecol. Indic. 2014, 36, 160–168. [Google Scholar] [CrossRef]
- Wang, L.; Wen, C. Traditional Villages in Forest Areas: Exploring the Spatiotemporal Dynamics of Land Use and Landscape Patterns in Enshi Prefecture, China. Forests 2021, 12, 65. [Google Scholar] [CrossRef]
- Jaeger, J.A.G. Landscape Division, Splitting Index, and Effective Mesh Size: New Measures of Landscape Fragmentation. Landsc. Ecol. 2000, 15, 115–130. [Google Scholar] [CrossRef]
- Schmiedel, I.; Culmsee, H. The Influence of Landscape Fragmentation, Expressed by the ‘Effective Mesh Size Index’, on Regional Patterns of Vascular Plant Species Richness in Lower Saxony, Germany. Landsc. Urban Plan. 2016, 153, 209–220. [Google Scholar] [CrossRef]
- Mcgarigal, K. FRAGSTATS Help; University of Massachusetts: Amherst, MA, USA, 2015. [Google Scholar]
- Moser, B.; Jaeger, J.A.G.; Tappeiner, U.; Tasser, E.; Eiselt, B. Modification of the Effective Mesh Size for Measuring Landscape Fragmentation to Solve the Boundary Problem. Landsc. Ecol. 2007, 22, 447–459. [Google Scholar] [CrossRef]
- Luo, T.; Zhang, T.; Wang, Z.; Gan, Y. Driving Forces of Landscape Fragmentation Due to Urban Transportation Networks: Lessons from Fujian, China. J. Urban Plan. Dev. 2016, 142, 04015013. [Google Scholar] [CrossRef]
- Tarabon, S.; Calvet, C.; Delbar, V.; Dutoit, T.; Isselin-Nondedeu, F. Integrating a Landscape Connectivity Approach into Mitigation Hierarchy Planning by Anticipating Urban Dynamics. Landsc. Urban Plan. 2020, 202, 103871. [Google Scholar] [CrossRef]


| 2000–2010 | |||||
|---|---|---|---|---|---|
| Cultivated Land | Forest | Grassland | Water Bodies | Artificial Surfaces | |
| Cultivated land | 1167.0030 | 90.9099 | 24.1812 | 5.4252 | 0.5931 |
| Forest | 59.787 | 1756.0611 | 3.0996 | 2.6145 | 0.0216 |
| Grassland | 70.2594 | 549.6012 | 184.7556 | 8.4069 | 0.2412 |
| Water bodies | 3.0717 | 1.7901 | 0.4329 | 7.3557 | 0.0225 |
| Artificial surfaces | 0.7551 | 0.0891 | 0.2196 | 0.2061 | 18.9495 |
| 2010–2020 | |||||
|---|---|---|---|---|---|
| Cultivated Land | Forest | Grassland | Water Bodies | Artificial Surfaces | |
| Cultivated land | 1132.5762 | 129.1041 | 12.3498 | 2.4021 | 24.444 |
| Forest | 111.1356 | 2191.0716 | 75.2436 | 9.0846 | 11.916 |
| Grassland | 31.1373 | 56.313 | 109.0953 | 1.5453 | 14.598 |
| Water bodies | 0.8046 | 1.0908 | 0.0162 | 21.8385 | 0.2583 |
| Artificial surfaces | 0.6093 | 0.1341 | 0.0738 | 0.1476 | 18.8631 |
| 2000–2020 | |||||
|---|---|---|---|---|---|
| Cultivated Land | Forest | Grassland | Water Bodies | Artificial Surfaces | |
| Cultivated land | 1136.4705 | 107.6472 | 14.8239 | 6.4845 | 22.7358 |
| Forest | 74.0268 | 1691.9811 | 45.8109 | 7.8462 | 2.0853 |
| Grassland | 63.1512 | 577.2888 | 135.8649 | 11.3265 | 25.659 |
| Water bodies | 2.1555 | 0.8217 | 0.225 | 9.1089 | 0.369 |
| Artificial surfaces | 0.5112 | 0.1467 | 0.0639 | 0.2673 | 19.2303 |
| Urban Growth Type (2000–2020) | |||
|---|---|---|---|
| Outlying | Edge-Expansion | Infilling | |
| LEI interval | 0 | 50 < LEI ≤ 100 | 0 < LEI ≤ 50 |
| Area (km2) | 6.54 | 42.23 | 2.08 |
| Area (%) | 12.86 | 83.05 | 4.09 |
Publisher’s Note: MDPI stays neutral with regard to jurisdictional claims in published maps and institutional affiliations. |
© 2022 by the authors. Licensee MDPI, Basel, Switzerland. This article is an open access article distributed under the terms and conditions of the Creative Commons Attribution (CC BY) license (https://creativecommons.org/licenses/by/4.0/).
Share and Cite
Wen, C.; Wang, L. Landscape Dynamics in a Poverty-Stricken Mountainous City: Land-Use Change, Urban Growth Patterns, and Forest Fragmentation. Forests 2022, 13, 1756. https://doi.org/10.3390/f13111756
Wen C, Wang L. Landscape Dynamics in a Poverty-Stricken Mountainous City: Land-Use Change, Urban Growth Patterns, and Forest Fragmentation. Forests. 2022; 13(11):1756. https://doi.org/10.3390/f13111756
Chicago/Turabian StyleWen, Chen, and Luqi Wang. 2022. "Landscape Dynamics in a Poverty-Stricken Mountainous City: Land-Use Change, Urban Growth Patterns, and Forest Fragmentation" Forests 13, no. 11: 1756. https://doi.org/10.3390/f13111756