Article

The Effect of Intercropping Mulberry (Morus alba L.) with Peanut (Arachis hypogaea L.), on the Soil Rhizosphere Microbial Community

1
College of Forestry, Shenyang Agricultural University, Shenyang 110866, China
2
Research Station of Liaohe-River Plain Forest Ecosystem, Chinese Forest Ecosystem Research Network (CFERN), Shenyang Agricultural University, Tieling 112000, China
3
Institute of Modern Agricultural Research, Dalian University, Dalian 116622, China
4
Life Science and Technology College, Dalian University, Dalian 116622, China
*
Authors to whom correspondence should be addressed.
Forests 2022, 13(11), 1757; https://doi.org/10.3390/f13111757
Submission received: 28 September 2022 / Revised: 20 October 2022 / Accepted: 24 October 2022 / Published: 25 October 2022
(This article belongs to the Special Issue Microbial Community Composition and Function in Forest Soil)

Abstract

:
China is a country dominated by agriculture, but due to its geographical reasons, the western Liaoning region has caused sandstorms, and the desertified soil has reduced crop yields and suppressed the agricultural economy. Therefore, the concept of ecological agriculture and the agroforestry system received extensive attention. Arachis hypogaea are the main crop in the north of China. At present, the research on peanuts mainly focuses on grain crop intercropping, and there is limited research on the agroforestry of peanuts. In addition, Morus alba is a restorative plant emerging in China in recent years, which takes into account both ecological and economic benefits. Based on the above problems, we intercropped mulberry and peanut to explore their effects on farmland soil characteristics and rhizosphere soil bacterial and fungal communities. Our study showed that intercropping did not improve soil nutrients, but significantly reduced soil C:N, and reduced soil C:P and N:P to some extent. Intercropping improves the diversity and richness of soil microorganisms in farmland. The abundance of dominant bacterial and fungal phyla and genera increased in the soil. Actinobacteria were significantly negatively correlated with N:P, Proteobacteria was negatively correlated with TP and positively correlated with N:P., Ascomycota was positively correlated with soil nutrients and C:N, while Basidiomycota and Mortierellomycota were negatively correlated; Mycobacterium and RB41 were significantly correlated with phosphorus in soil, and Talaromyces were significantly positively correlated with soil nutrients and C:N. In conclusion, mulberry and peanut intercropping promoted soil humus, increased soil-available phosphorus content, and provided a good environment for microbial growth. These results provide new ideas for peanut agroforestry production and theoretical support for the construction of mulberry and peanut composite systems in Northeast China.

1. Introduction

Peanuts, Arachis Hypogaea L., are native to South America, but China is now the number one producer of the species [1]. Liaoning is a principal producing area of high-quality peanuts in China. The peanuts produced are favored by import enterprises for their good quality, high nutritional value and health function [2]. The northwest area of Liaoning Province is a main planting area for peanuts, but continuous mono-planting negatively impacts soil health. The results of poor soil health are a series of problems, such as the increased risk of soil erosion, decreased yield, decreased soil nutrient content, and soil microbial imbalance [3]. Soil and air pollution are exacerbated by the long-term overload of fertilizers that farmers apply to ensure peanut yields. Therefore, it is necessary to improve the ecological benefits under the condition of guaranteeing the sustainable planting of peanuts. Among the diverse forms of crop cultivation, intercropping is the most suitable choice for planting peanuts in northwest Liaoning Province [4,5].
Intercropping could increase the land equivalent ratio up to 1.66 [6] and both species obtained certain yield advantages [7]. In rhizosphere soil, intercropping increased urease activity to 22.73% [8], and increased soil C, N and K contents [9,10,11]. The efficiency of phosphorus uptake by plants was also improved [12]. Intercropping between peanuts and medicinal plants can increase peanut yield, improve soil microbial community composition, and reduce soil-borne pathogens [13]. Soil microorganisms are the link between plants and soil, which can maintain soil fertility and stability [14,15]. Plant uptake of soil nutrients is closely related to changes in microbial diversity and abundance [16]. Additionally, the composition and diversity of vegetation will also change the structure and diversity of soil microbial communities [17]. In relatively poor soils, soil nutrients are the main limiting factors for microbial nutrients [18]. Soil physicochemical properties and nutrients can change the structure and diversity of soil microbial communities and regulate soil microbial metabolism [19,20].
Intercropping with Morus alba L. is a new type of agroforestry. As a native tree species in China [21], Morus alba has the characteristics of strong adaptability, drought resistance and drought tolerance [22,23], and has certain ecological restoration effects on soil polluted by heavy metals [24,25]. At the same time, Morus alba has higher biomass than herbaceous plants, and its leaves and tender stems are easy to digest. It can be used as supplementary feed for livestock, which can also bring economic benefits to farmers. At present, there are few reports on Morus alba intercropping, and even fewer reports on Morus alba and peanut intercropping [26].
Therefore, this study used high-throughput sequencing technology to analyze the driving effect of Morus alba—peanut intercropping on soil microorganisms, and to determine the community composition and diversity of soil microorganisms under intercropping conditions. We also elucidate the relationship between soil microorganisms and physical and chemical properties. Our study provides theoretical support for the feasibility of the Morus alba—peanut agroforestry system in this area.

2. Materials and Methods

2.1. Test Varieties and Planting Patterns

The test area is located in Zhangwu County (42°07′–42°51′ N, 121°53′–122°58′ E), Liaoning Province, China, which is located on the southern edge of the Horqin Sandy Land, which is a typical sandstorm area in northwestern Liaoning Province. The experimental site was the Breeding Center of Zhangwu County Aerospace Park. The mulberry tree tested was the cultivar “Shen Sang No. 1” cultivated by the Forestry College of Shenyang Agricultural University (Annual). The peanuts were the local variety “Baisha 308” in Zhangwu County. The test soil was taken from the understory soil of Pinus sylvestris var. mongholica. Before the experiment, the SOC content of soil was 4.74 g kg−1, TN content was 0.44 g kg−1, TP content was 0.50 g kg−1. Three plant configurations were set up in the experiment: pure mulberry planting (LF), pure peanut planting (LD), and mulberry and peanut intercropping (LE). The size of the pot is 25 cm in the inner diameter of the mouth, 17 cm in the inner diameter of the bottom, and 30 cm in the height. The potted plants were located in the same plot, each pot of four plants, a mulberry and peanut mixed pot, two mulberry and two peanut plants. Three replicates were set for each treatment. The mulberry trees (annuals) were planted on 8 April 2021, and the peanuts (seeds) were sown on 7 May of the same year. During the experiment, only weeds were removed without fertilization.

2.2. Collection and Chemical Property Analysis of Soil Samples

After gently shaking off the soil around the root system, a soft brush was used to gently brush the soil adhering to the root system down as the rhizosphere soil. The plants in each replicate pot were removed, and rhizosphere soil was obtained. There were nine samples in three groups. The samples were stored in sterile labeled zip lock bags, and transported to the laboratory in an ice box. Then, plant root residues, stones, gravel, etc., were removed from the samples by sieving through a 100-mesh (the pore size of 0.150 mm) sieve. A part of the soil samples was air-dried and stored at 4 °C for the determination of soil chemical properties, and the other part of the soil samples were placed in centrifuge tubes and stored in a −180 °C refrigerator for the determination of soil microorganisms.
Soil pH (1:2.5 soil: deionized water slurries) was measured with a Leici PHS-3C pH meter [26]. Determination of soil total carbon (SOC) and nitrogen (TN) by the elemental analyzer (Elementar Vario EL III, Hanau, Germany). Soil total phosphorus (TP) was measured with an AA3 flow analyzer (AA3, Hamburg, Germany).

2.3. DNA Extraction and Sequencing of Soil Microorganisms

Soil genetic material was extracted from 0.25 g of fresh soil using OMEGA Mag-bind Soil DNA Kit (Omega M5636-02) (Omega Bio-Tek, Norcross, GA, USA). Follow-up steps follow the instructions of DNA Isolation Kit. After extraction, the DNA extraction quality (purity and integrity) was checked by 1% agarose gel electrophoresis, and the concentration and purity of the DNA extract were checked with a nucleic acid quantifier NanoDrop ND-1000 (Thermo Fisher Scientific, Waltham, MA, USA). The V3-V4 region of bacterial 16S rRNA gene was amplified with primers 338F (5′-ACTCCTACGGGAGGCAGCAG-3′) and 806R (5′-GGACTACHVGGGTWTCTAAT-3′); The fungal ITS region was amplified with primers ITS1F (5′-CTTGGTCATTTAGAGGAAGTAA-3′) and ITS2R (5′-GCTGCGTTCTTCATCGATGC-3′). PCR amplification products were detected by 2% agarose gel electrophoresis, and then recovered using AXYGEN’s gel recovery kit. The products were sent to Shanghai Paisenuo Biotechnology Co., Ltd (Shanghai, China), and the sequencing library was prepared using TruSeq Nano DNA LT Library Prep Kit (Illumina, Beijing, China).

2.4. Statistical Analysis

The fitting effect of the amplicon sequence variant (ASV) partitioning method and the environment is better than that of the OTU partitioning method, which can more accurately capture the community information. Therefore, in this study, the DADA2 method was used to perform the steps of depriving [27], quality filtering, denoise, splicing and decimalization to generate ASVs (https://docs.qiime2.org/2022.2/ (accessed on 10 November 2021). ASVs were extracted using QIIME2 (2019) to obtain the bacterial and fungal community composition of each sample at the phylum and genus, and displayed as a relative abundance heatmap. IBM SPSS Statistics 20.0 (Chicago, IL, USA) was used to analyze the correlation between soil nutrients and the relative abundance of bacteria, fungal phyla and genus, and a correlation heat map was constructed through the gene cloud tools, a free online platform for data analysis (https://www.genescloud.cn (accessed on 10 June 2022). Alpha diversity analysis was performed on ASVs including Good’s coverage, Shannon, Simpson, Pielou’s evenness and Observed species. In samples with high diversity, the ASV method would reduce the Chao1 and PD indices to a certain extent [28], so the above five indices are selected for alpha diversity analysis in this study. Hierarchical clustering was used to display the similarity between samples in the form of a hierarchical tree, and the clustering effect was measured by the branch length of the clustering tree. Visualization was performed using the ggtree package of the R script (the Bray–Curtis distance matrix and the Ward D clustering method). The Bray–Curtis distance was used to analyze the differences in microbial community structure among different soil samples [29], and visualized by principal coordinate analysis (PCoA) [30].

3. Results

3.1. Effects of Intercropping on Soil Carbon, Nitrogen and Phosphorus Stoichiometry

According to the data in Table 1, the pH values of the three configurations were all slightly alkaline, and the soil of LE was more alkaline, but there was no significant difference between LE and LD (p < 0.05). SOC, TN, TP and C:N showed LD > LE > LF, while N:P showed the opposite (p < 0.05). There was no significant difference in C:P among all treatments (LD > LF > LE).

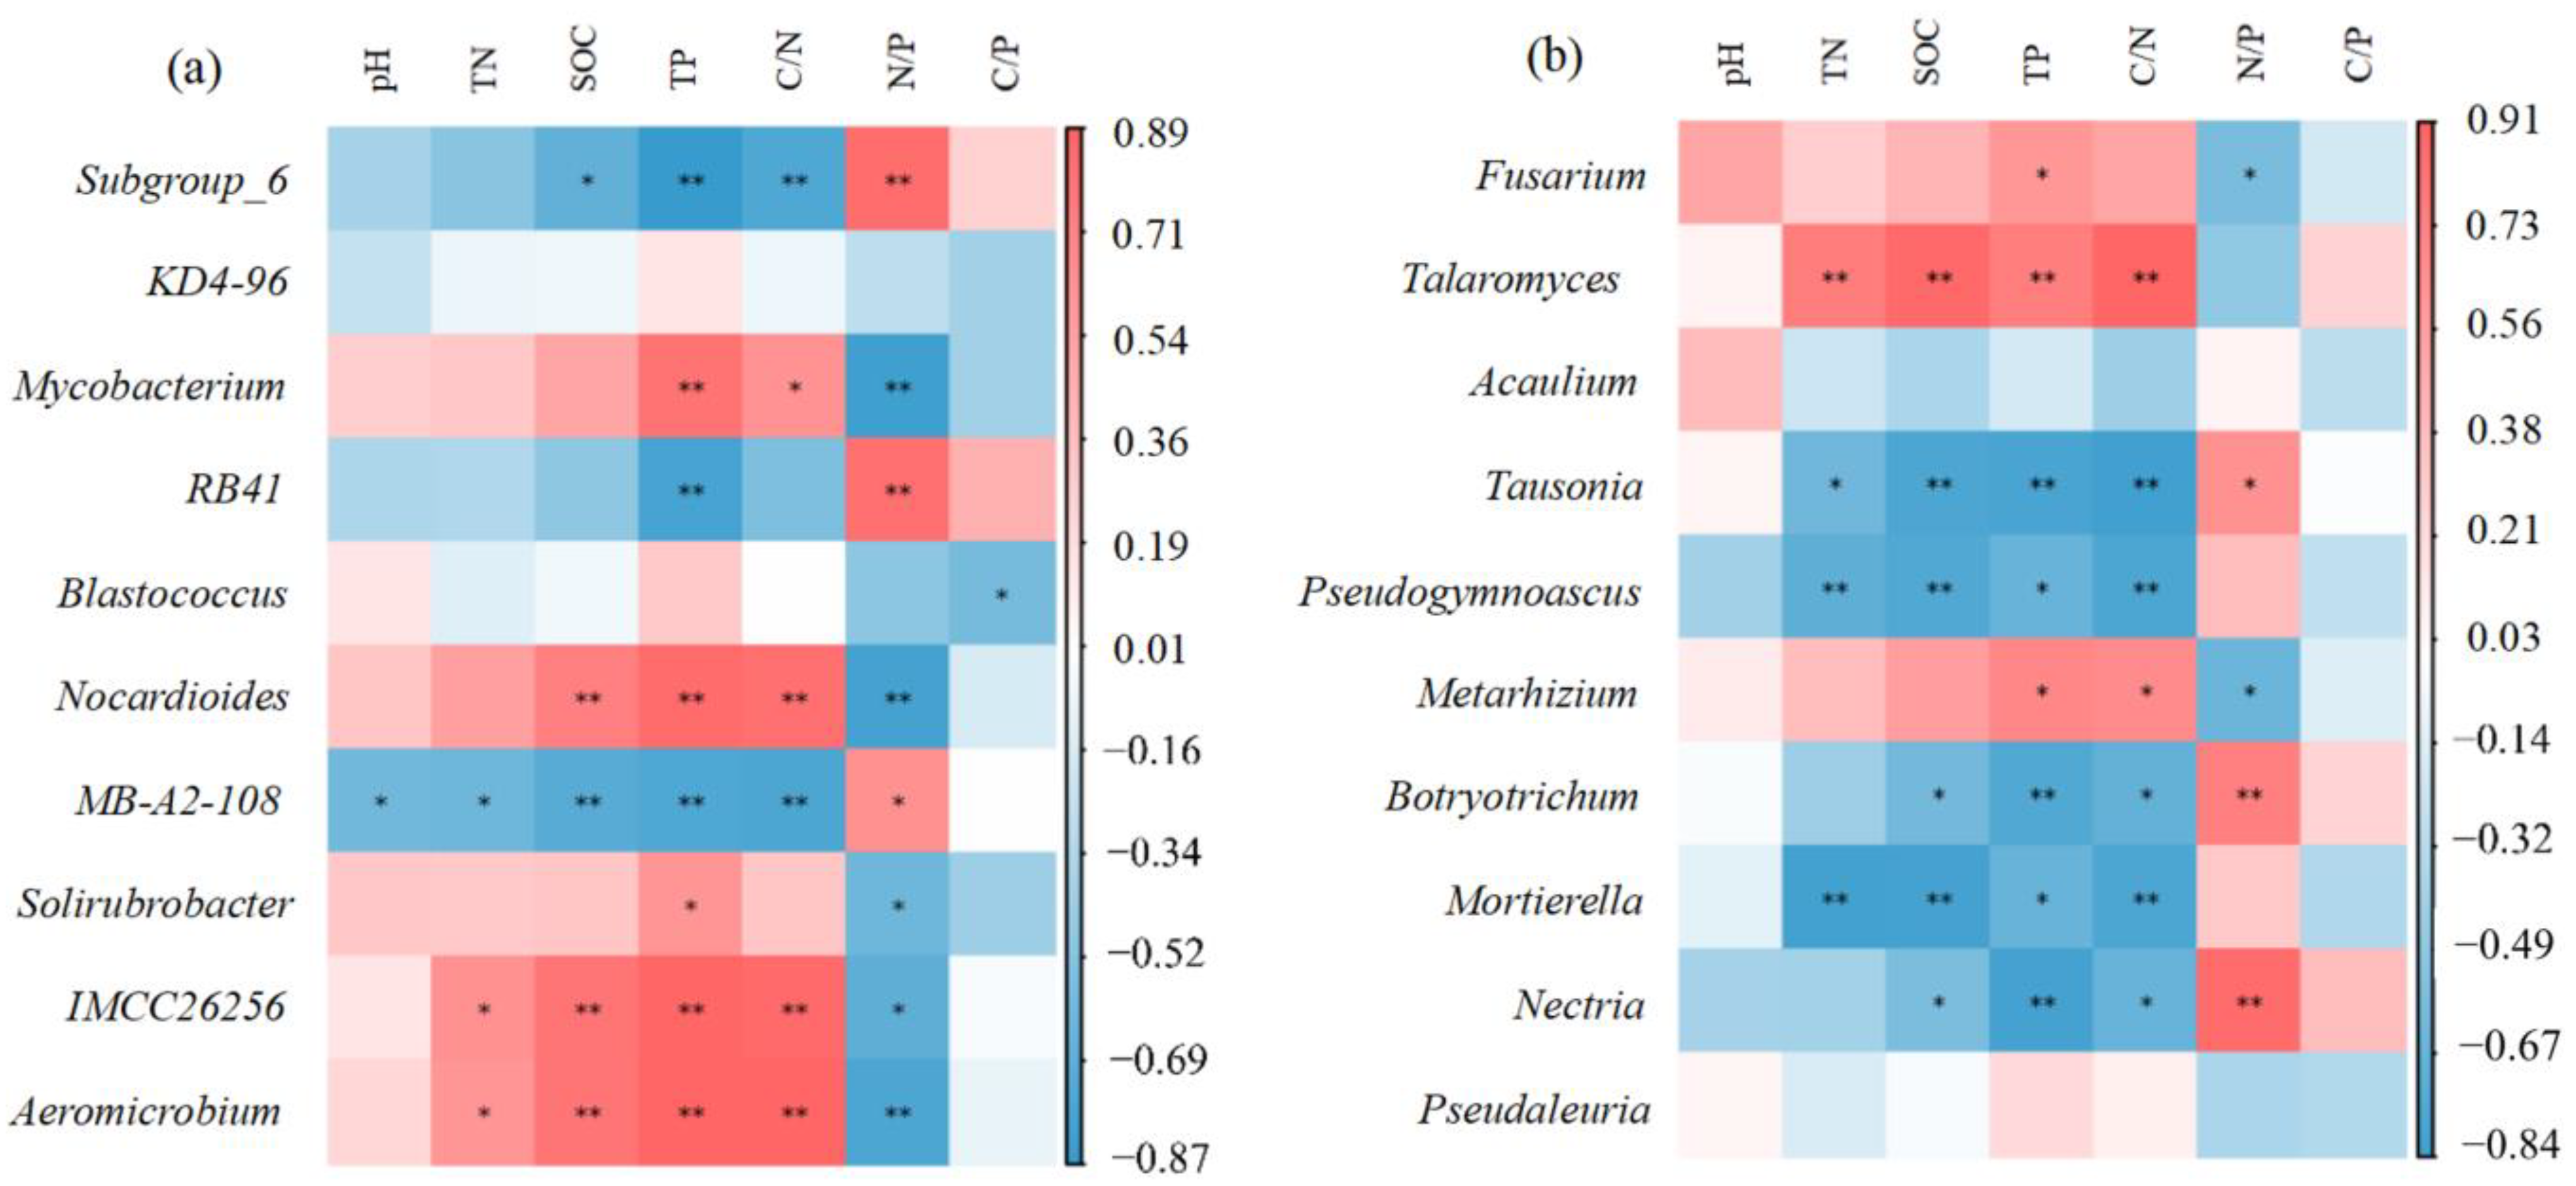
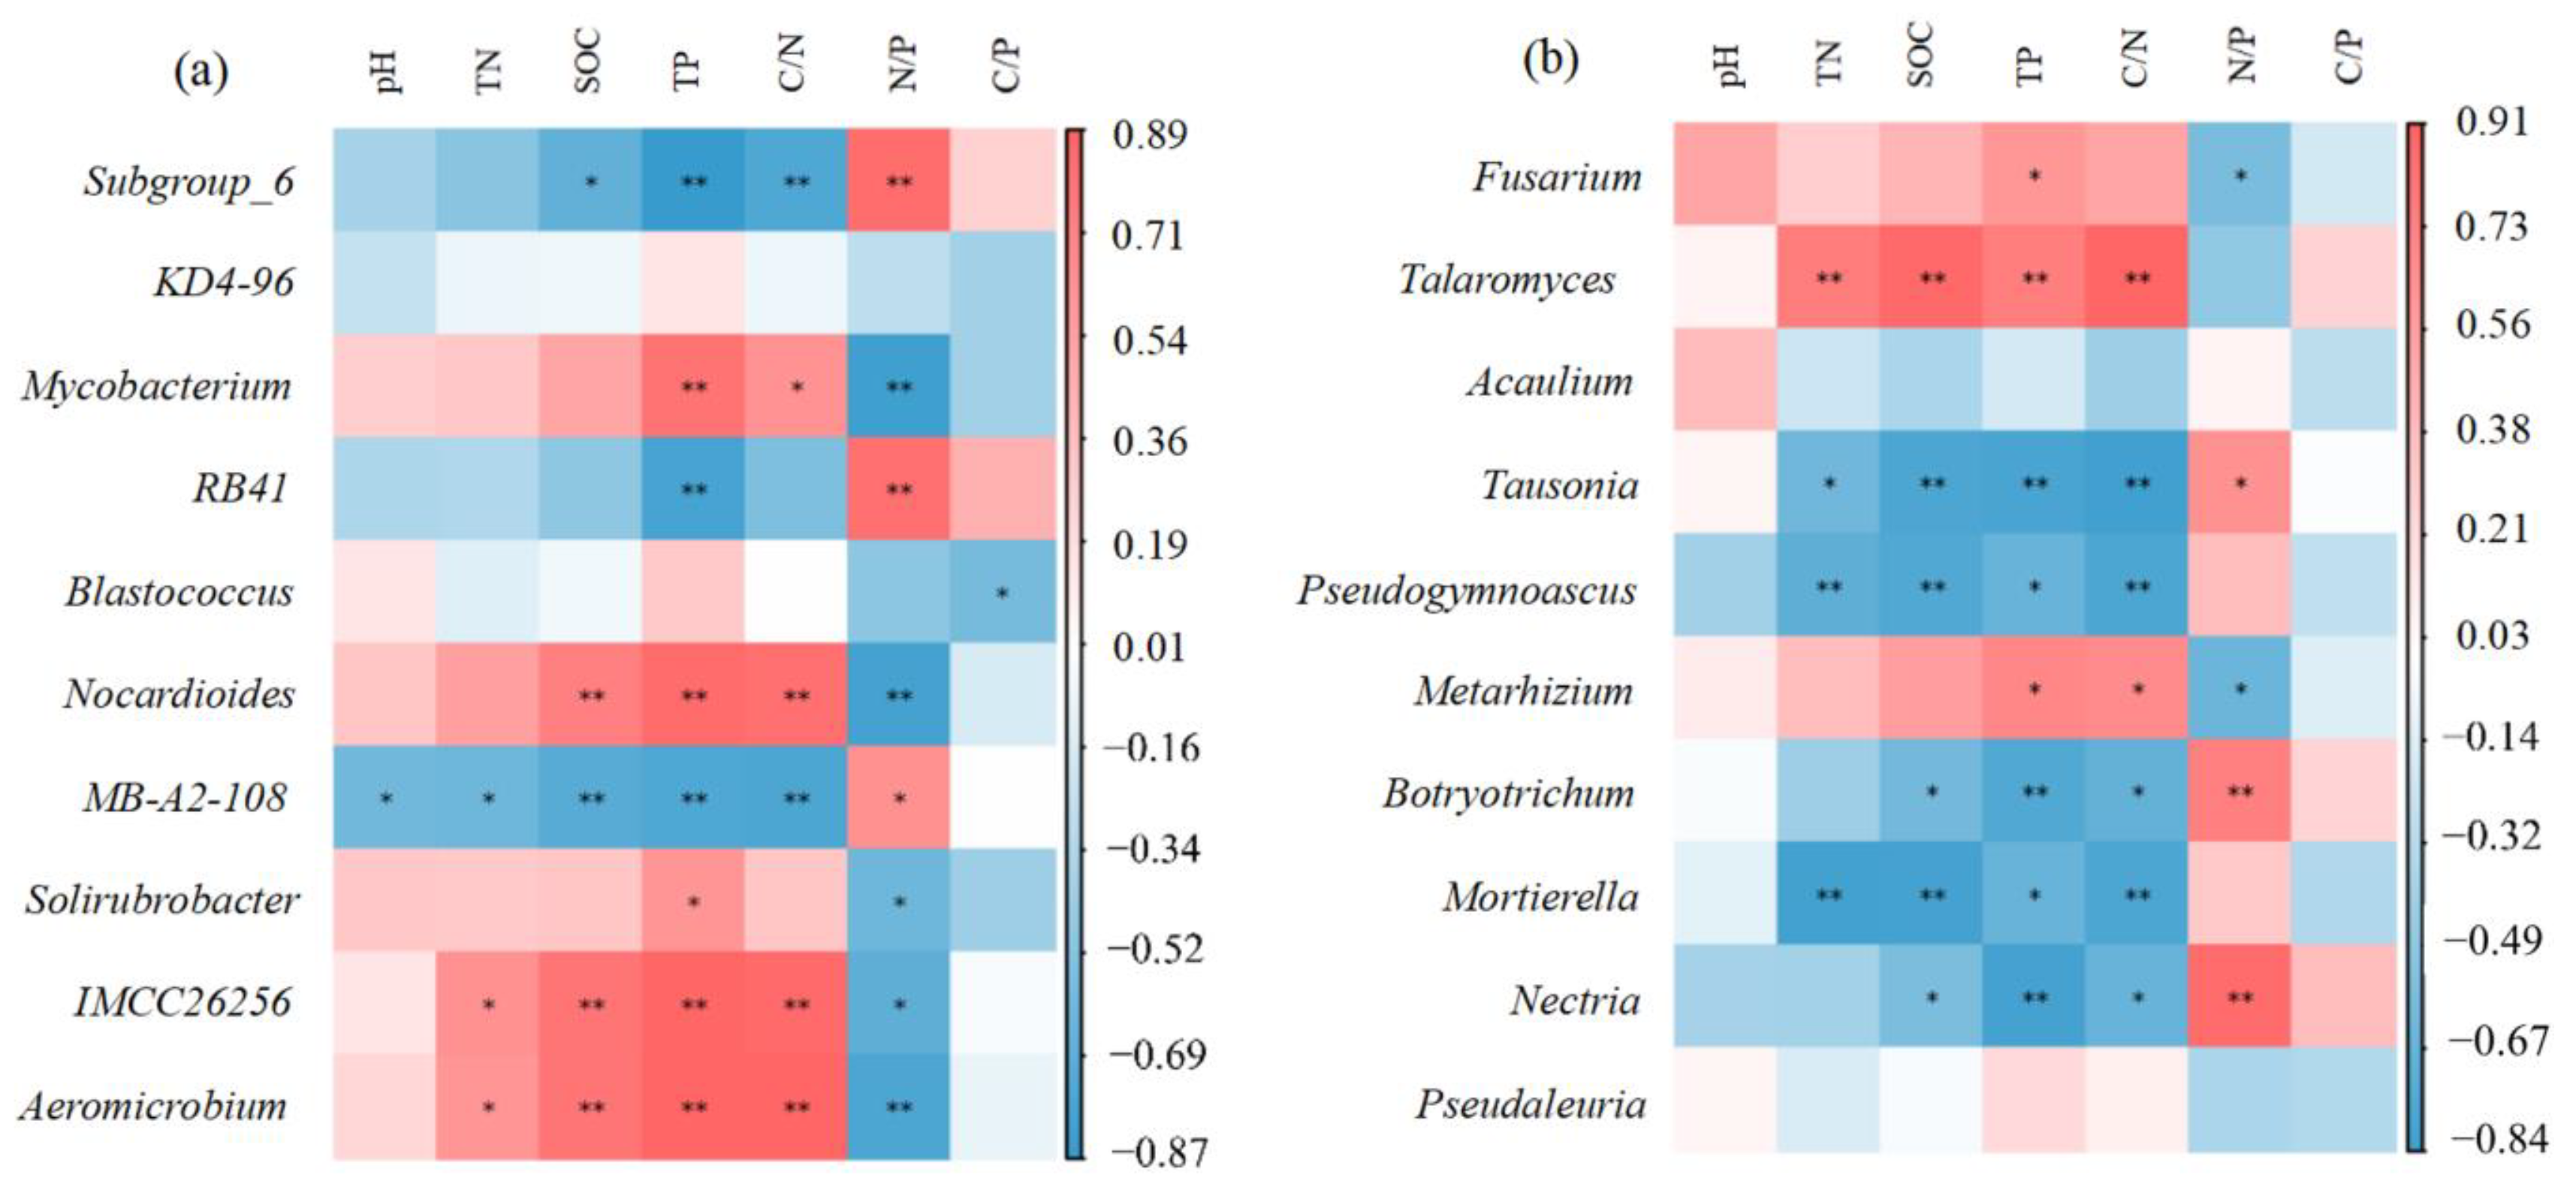
3.2. Correlation Analysis of Relative Abundances of Soil Microbial Communities and Soil Properties

The community structures of different treatments for the bacterial and fungal phyla were similar. The dominant bacterial phyla were Actinobacteria, Proteobacteria, Acidobacteria and Chloroflexi. Actinobacteria was the phylum with the highest relative abundance under the three treatments used in this study, with a relative abundance higher than 34%. The relative abundances of Proteobacteria were similar among the treatments, around 25%. In Acidobacteria, the relative abundance of LE was 3.75% lower than LF and 1.28% higher than LD. The difference between LE and LF is 0.25%, and between LF and LD, it is 0.53%, for Chloroflexi as Figure 1a shows some differences.
The dominant phyla of fungi were Ascomycota, Basidiomycota and Mortierellomycota. Among them, Ascomycota was the absolute dominant phylum, accounting for 83.91% of the total sequence numbers. The treatment with the highest abundance was LD (90.44%), followed by LE (84.86%), and the relative abundance of LF was the lowest (76.41%). The relative abundance of Basidiomycota and Mortierellomycota under different treatments were on the contrary (Figure 1b).
The relative abundance of bacteria in the phylum was not significantly correlated with pH and C:P (p > 0.05). The relative abundance of Actinobacteria was positively correlated with TP and C:N, and negatively correlated with N:P. Proteobacteria was negatively correlated with TP and positively correlated with N:P. Acidobacteria has a significant negative correlation with SOC and C:N, a very significant negative correlation with TP, and a very significant positive correlation with N:P. Except that Firmicutes had a significant positive correlation with N:P, other correlations were consistent with Acidobacteria. There was no significant correlation between the relative abundance of fungi in the phylum and N:P (p > 0.05) (Figure 2a). Ascomycota was positively correlated with TN, positively correlated with SOC, TP and C:N, and negatively correlated with N:P. Basidiomycota and Mortierellomycota showed opposite correlations with soil properties compared with Ascomycota (Figure 2b).
The community structures of different treatments at the bacterial and fungal genus were similar, but the relative abundances of fungal communities varies in different treatments. Among all bacterial genera, Subgroup_6 (19.13%) was the main genus with a total relative abundance of more than 10% in the three treatments. Among them, the relative abundance of LF was the highest at 7.69%, followed by LE at 6.28%, and the relative abundance of LD was the lowest at 5.16%. There were only four bacterial genera with relative abundance above 5%, KD4-96 (9.86%) (LF > LE > LD), Mycobacterium (LD > LE > LF) (6.10%), RB41 (5.87%) (LF > LD > LE), and Blastococcus (5.60%) (LE > LF > LD) (Figure 3a).
In all fungal genera, the main genera were Fusarium (34.24%), Talaromyces (26.67%), Acaulium (19.15%), Tausonia (15.65%), Pseudogymnoascus (13.87%) and Metarhizium (12.64%). The relative abundances of Fusarium, Talaromyces and Metarhizium in different treatments were LD > LE > LF. Additionally, the relative abundance of Talaromyces in LD was dozens of times that of LF and LE. The relative abundance of Acaulium in LE was the highest at 10.04%, followed by LF (6.29%), and the relative abundance in LD was the lowest at 2.19% (Figure 3b).
Among the top ten bacterial genera, the bacteria with low abundance were those with a high correlation between soil nutrients and soil stoichiometry. However, bacterial genera with higher abundance were mainly associated with TP and N:P in the soil. Subgroup_6 and RB41 were negatively correlated with TP, and positively correlated with N:P. Mycobacterium, on the contrary, was significantly positively correlated with TP and negatively correlated with N:P. Subgroup_6 was negatively correlated with C:N and positively correlated with Mycobacterium. There was no significant correlation between fungi and pH and C:P. Fusarium was positively correlated with TP and negatively correlated with N:P. Talaromyces was positively correlated with soil nutrients and C:N. Tausonia is the opposite of Talaromyces (Figure 4).

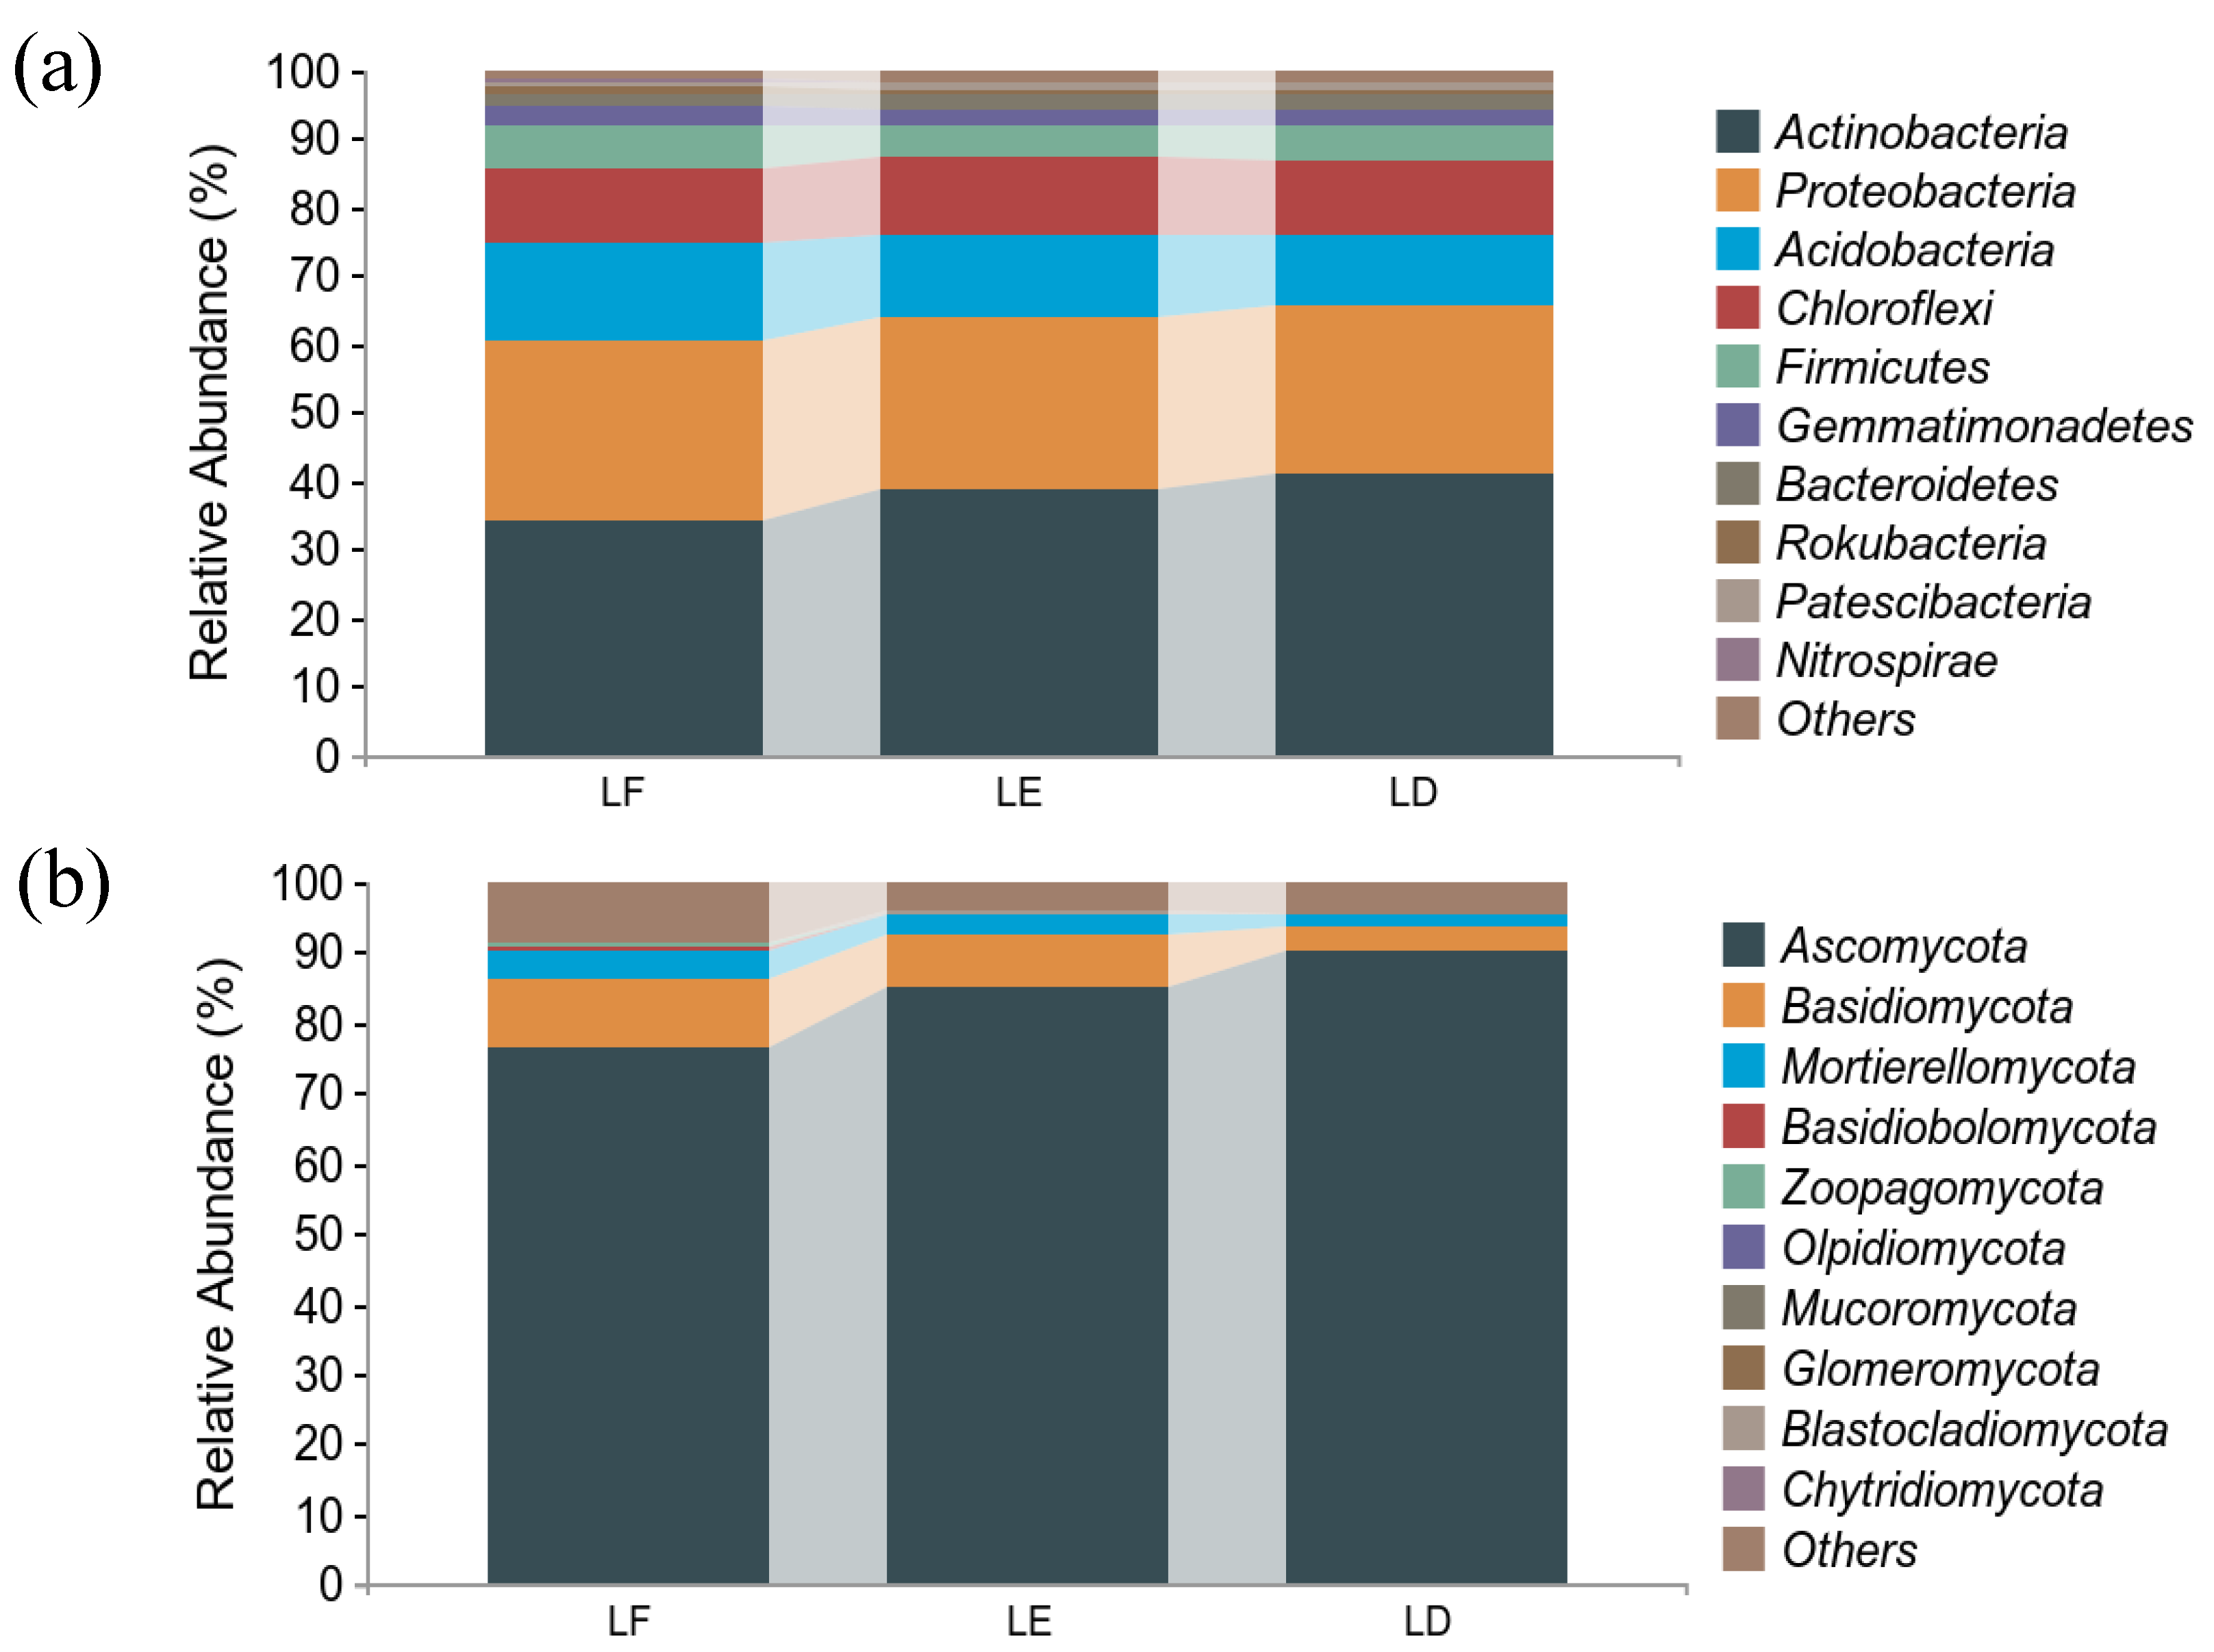
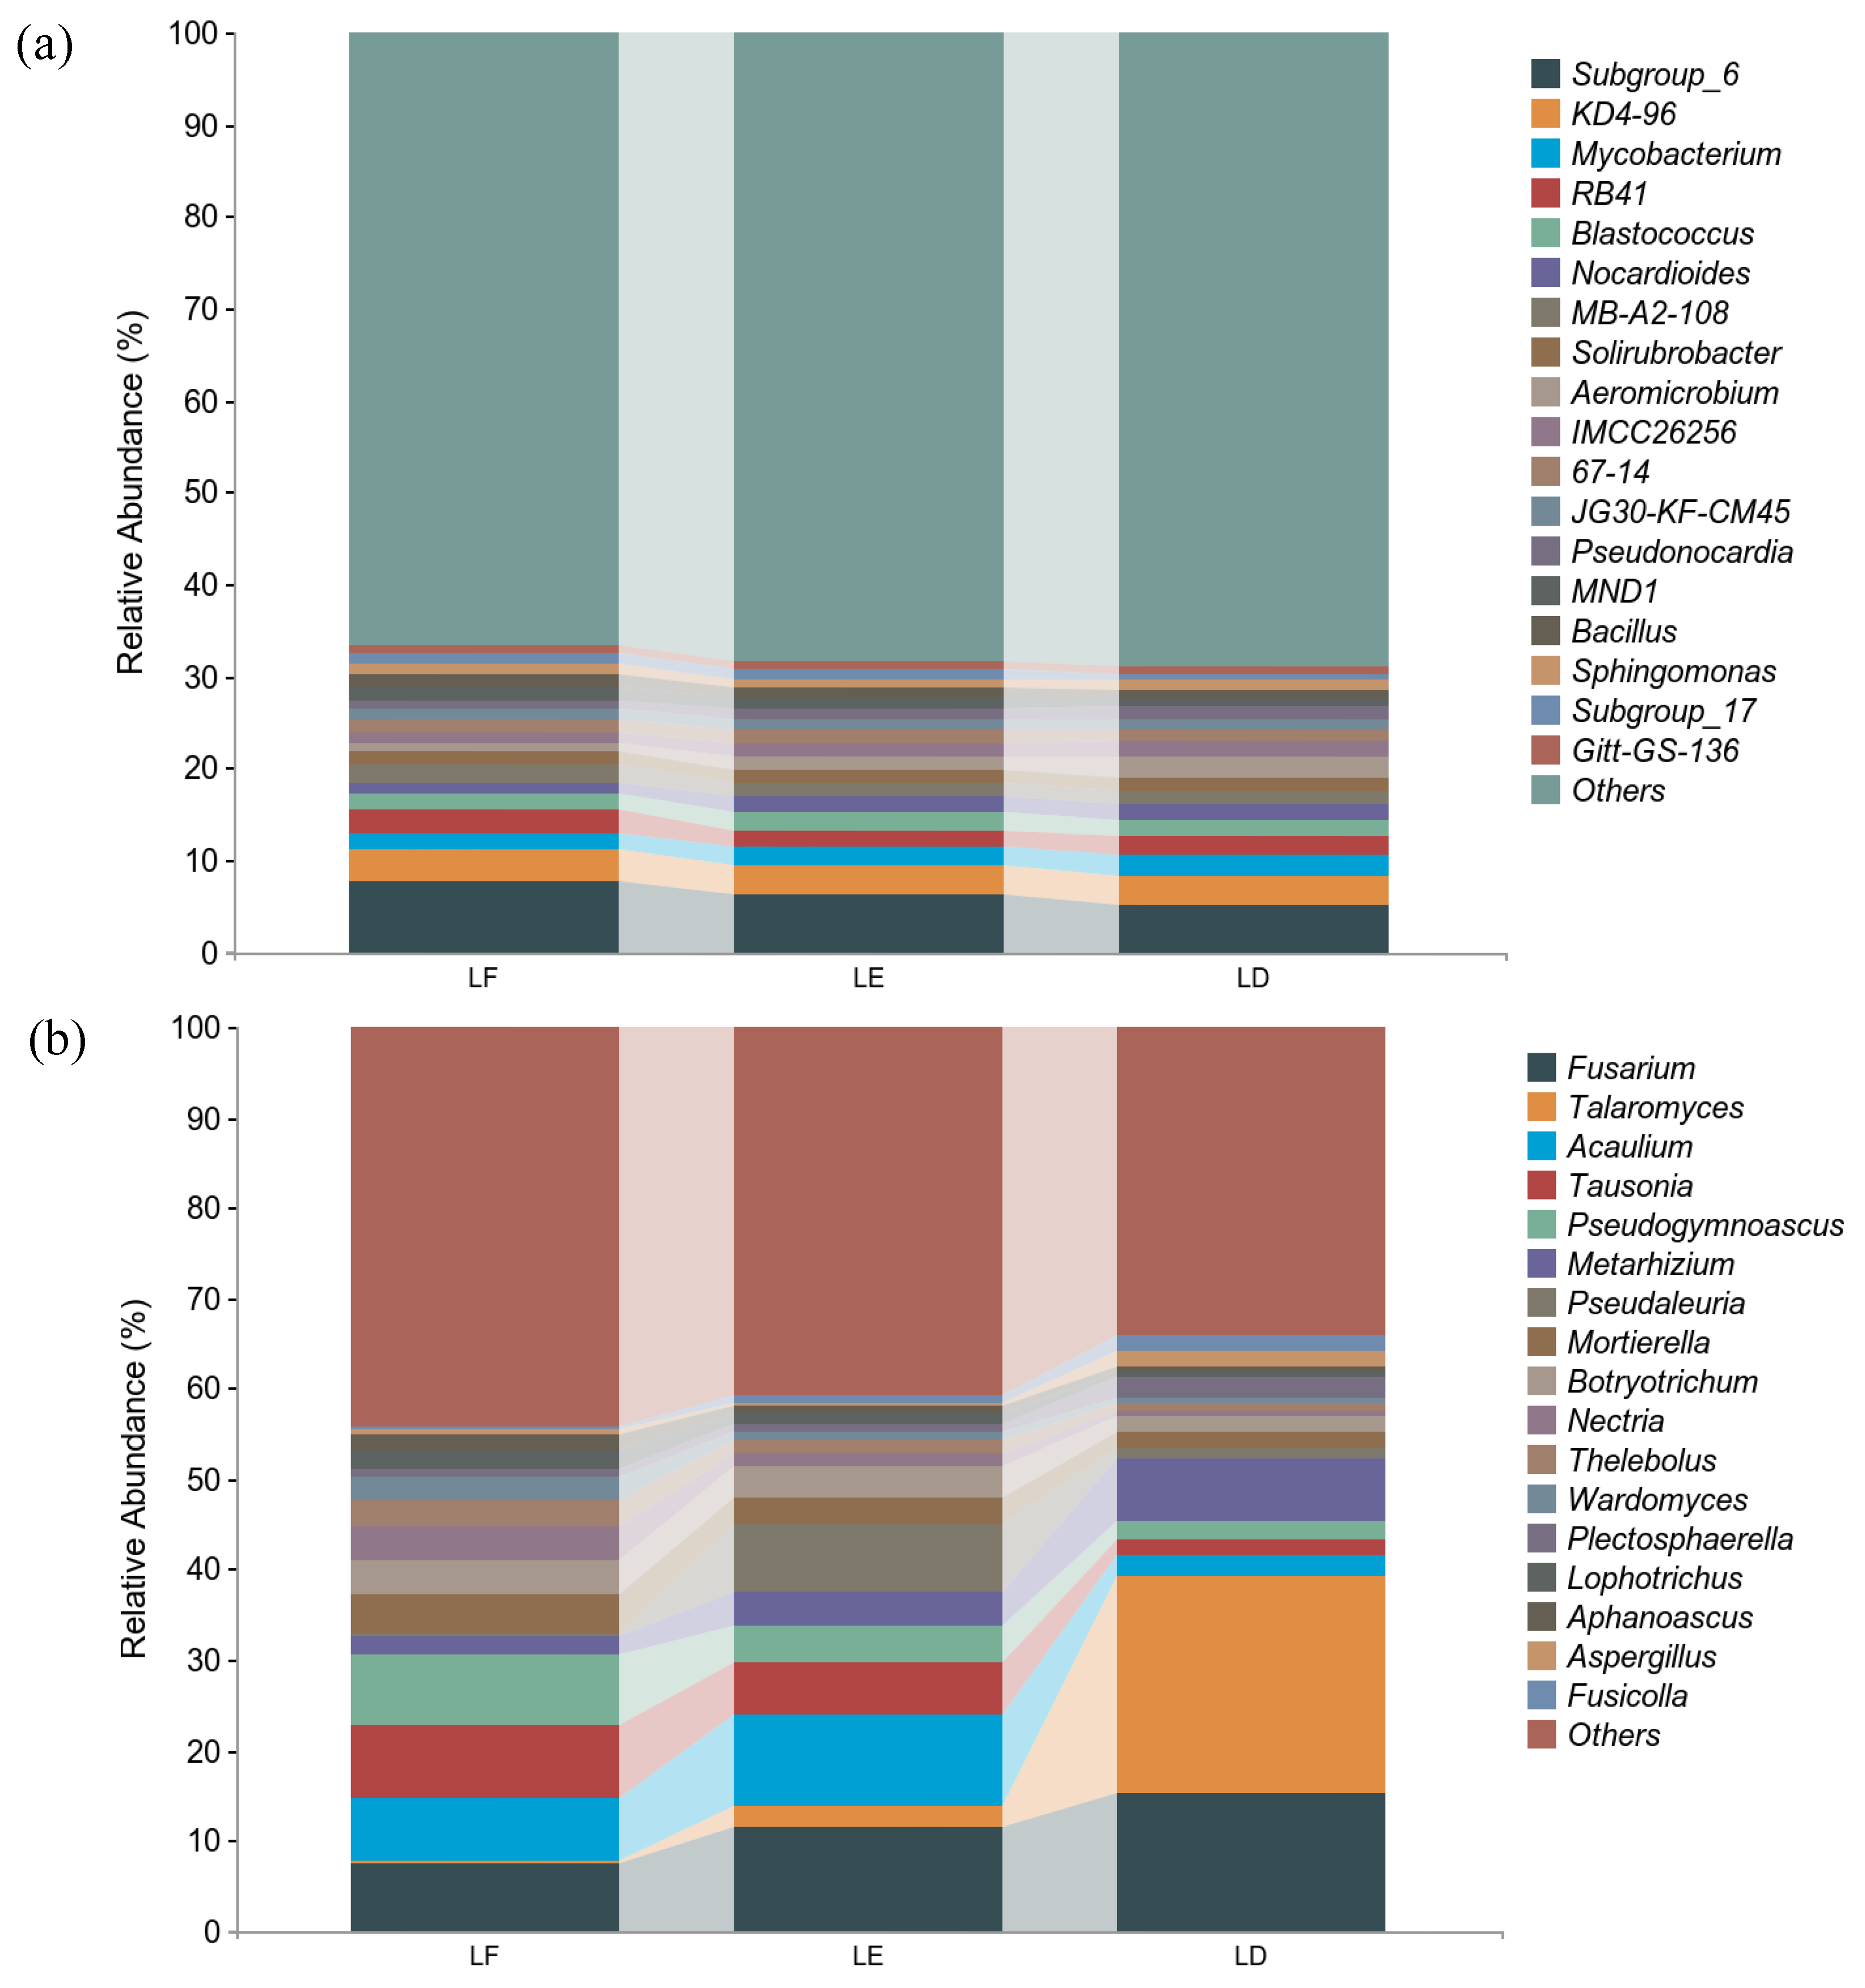
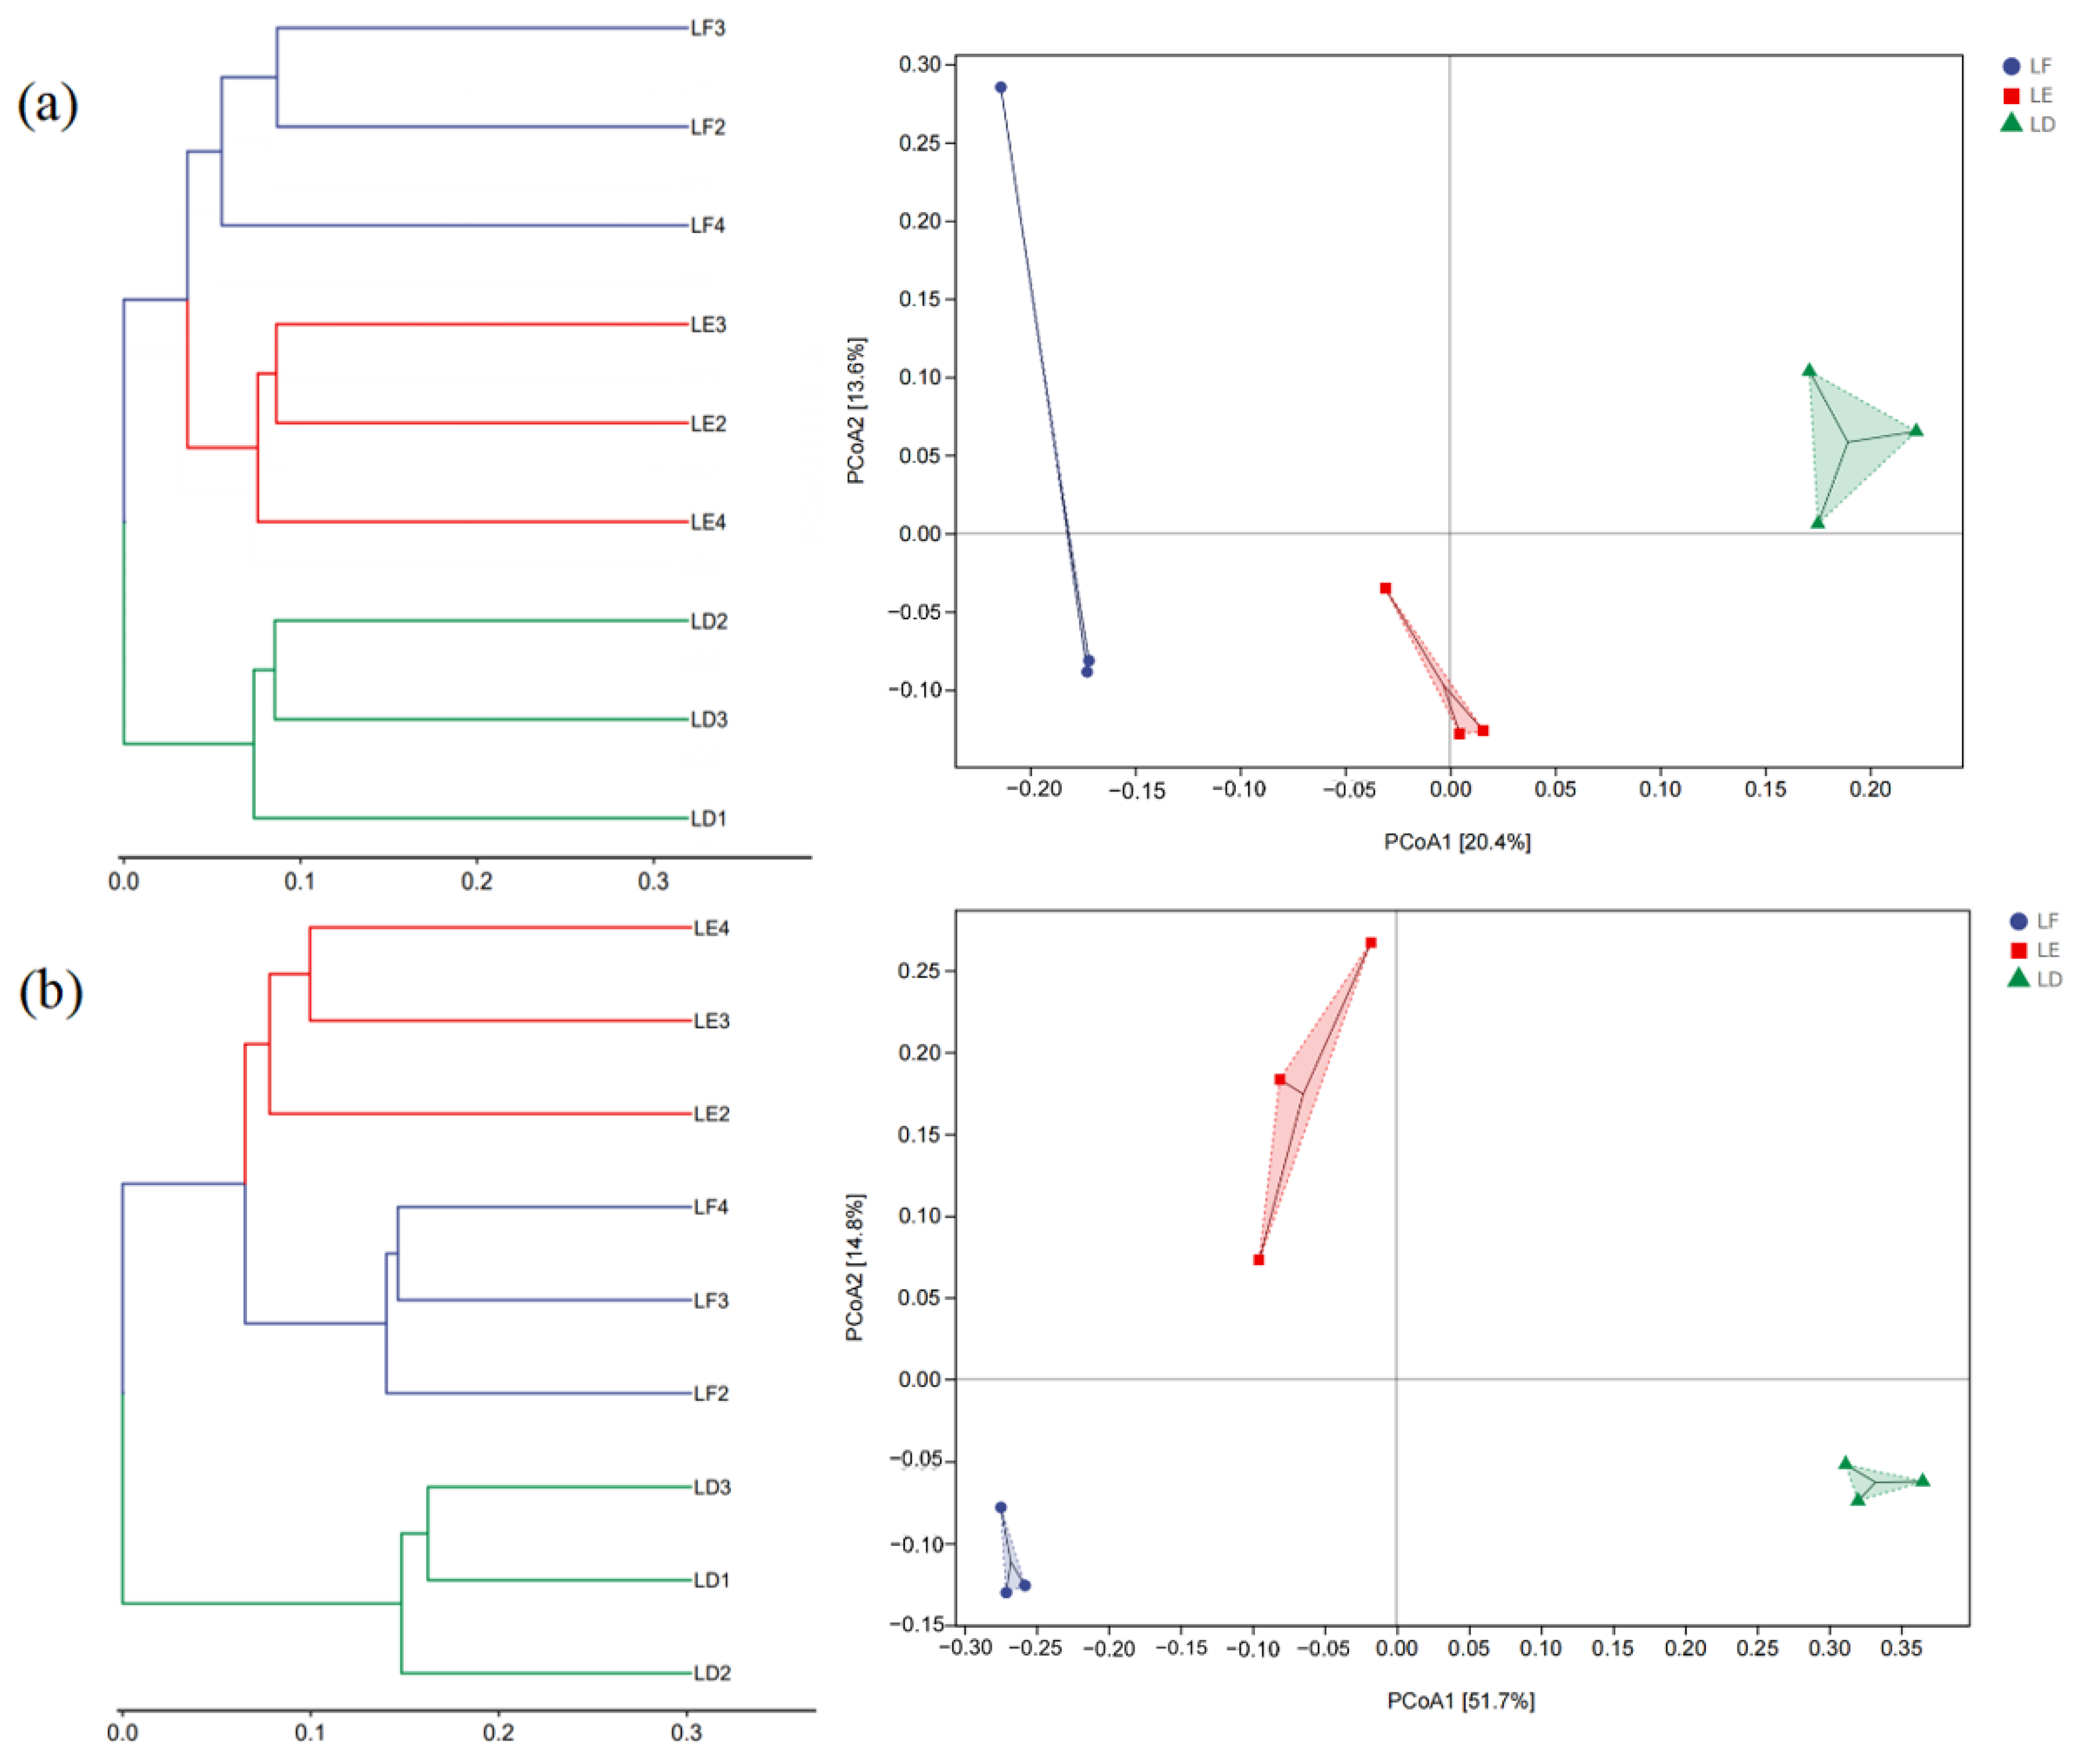
3.3. Structural Diversity of Soil Microbial Communities

The Good’s coverage (p = 0.408) and Pielou’s evenness (p = 0.810) indices of LE were higher than those of monoculture, while the Simpson (p = 0.521) and Observed species (p = 0.385) of bacteria were lower than those of monoculture. The Shannon (p = 0.711) index of group treatment was LF > LE > LD from large to small. The Shannon and Pielou’s evenness indices of the three treatments showed significant differences, and the Shannon and Pielou’s evenness indices of LF were significantly higher than those of the other two treatments (p < 0.05), while the other indices had no significant difference (p > 0.05). Each index showed LF > LE > LD (Figure 5).
PCoA1 and PCoA2, respectively, explained 20.4% and 13.6% of the bacterial community variations,. In the three groups of treatments in this experiment, LF was located in the negative semi-axis of PCoA1, LD was located in the positive semi-axis of PCoA1, and LE was located in the middle of LF and LD, near the zero line of PCoA1 (Figure 6a). PCoA1 and PCoA2 explained 51.7% and 14.8% of the fungal community variations, respectively. The fungal samples were also grouped along the PCoA1 axis, and their distribution was similar to the bacterial samples, but the LE fungal community was closer to the LF fungal community (Figure 6b).

4. Discussion

Intercropping can increase the content of various nutrients in the soil [31]. However, in the agroforestry system, the soil nutrient content of intercropping was lower than that of crop monoculture [32]. In the present study, the nitrogen content of peanut monocultural treatment was significantly higher than that of the other two groups of treatments. After intercropping with mulberry, the nitrogen fixed by peanut rhizobia could be used by mulberry, and this degree of nitrogen addition could increase the complexity of rhizosphere soil bacteria [33] Although SOC, TN and TP contents in the mixed soil were reduced compared with peanut monoculture, according to the soil ecological stoichiometry, it had a higher degree of humification [34], and the lower C:N was more conducive to the survival of soil microorganisms [35]. Low C:P ratios indicate that microorganisms release nutrients well in the process of organic matter decomposition and promote the release of soil-available phosphorus [36]. This study showed that intercropping could significantly reduce C:N in farmland soil, and reduce C:P and N:P to a certain extent. Lower C:P can increase the content of available P in soil. N:P ratio can be used as a diagnostic in-dicator for N saturation and as a threshold for nutrient limitation [37]. The N:P ratio in the study area was always less than 14, indicating that the nitrogen was limited during the intercropping period, and nitrogen fertilizer should be added appropriately.
Agroforestry not only improves soil nutrient status, but also has certain effects on soil microorganisms [38]. In this study, compared with peanut monoculture, intercropping of mulberry and peanut improved the diversity and richness of bacteria and fungi in soil. The reason may be that the root niche and rhizosphere exudates of crops changed after intercropping, resulting in changes of nutrient utilization in the intercropping system, and consequently the changes in soil bacterial and fungal community structure. The root exudates related to intercropping of mulberry and peanut will be further analyzed in the future. According to the results of hierarchical cluster analysis and principal coordinates analysis, mulberry monoculture and intercropping were closer and grouped. This indicated that mulberry was more authoritative than peanuts in the construction of bacterial flora in the agroforestry system. The distance of fungal communities was significantly different among the three treatments, proving that the taxonomic characteristics of fungi in each treatment were obvious than those of bacterial communities.
Agroforestry can increase the abundance of soil microorganisms [39]. This study also found that the relative abundance of bacteria and fungi in the phylum of mulberry and peanut intercropping was higher than that of peanut monoculture. The dominant bacterial phyla were Actinobacteria, Proteobacteria, Acidobacteria and Chloroflexi. Actinobacteria have the functions of degrading cellulose and decomposing organic matter efficiently [40]. There was a significant negative correlation between Actinomycetes and N:P. The intercropping pattern of mulberry and peanut with a lower N:P ratio was more suitable for the growth of actinomycetes. Proteobacteria are regnant in the soil under harsh environments such as salt and alkali. This phylum was also resistant to the harsh environment in the experimental area [41]. The abundance of Proteobacteria increased to a certain extent after intercropping with mulberry, and it was significantly negatively correlated with TN and C:N ratio. Proteobacteria predominated in fertile soils, so we hypothesized that intercropping improved the soil environment to make it more favorable for peanut growth [42]. Liu et al. found a significant negative relationship between Chlorobacteria and available phosphorus [43]. In this study, intercropping of mulberry and peanut increased the abundance of Chloroflexi, and the high abundance of Chloroflexi was conducive to the degradation of toxic and harmful substances in the soil [44,45]. Fungi also play an important role in the soil. Some fungi promote the growth of crops, and some fungi can also cause crop diseases [46]. Among the fungal phyla, Ascomycota of the peanut monoculture had the highest relative abundance. As Zhou et al., Ascomycota is associated with soil nitrogen, and the presence of numerous rhizobia in the rhizosphere of flowers leads to nitrogen accumulation in soil, which may be the cause of this situation [47]. Basidiomycota and Mortierellomycota were significantly negatively correlated with TN and TP, suggesting that low SOC, TN and TP contents were beneficial in increasing the abundance of these two fungi in the intercropping pattern of mulberry and peanut.
The soil microbial community structure of the genus was more complex. Subgroup_6 (19.13%) was the main genus with a total relative abundance of more than 10% in the three treatments. This genus belongs to the Acidobacteria, and it was negatively correlated with various soil nutrients, proving that Subgroup_6 is an oligotrophic lifestyle. As depicted in Figure 3a, mixing with mulberry increased the relative abundance of Subgroup_6 in the soil, which means that this intercropping method was very useful in improving soil nutrients. There were four preponderant bacterial genera, including KD4-96, Mycobacterium, RB41 and Blastococcus. They play a vital role in the decomposition of organic matter and the antagonism of pathogenic bacteria [48,49]. Mycobacterium and RB41 were significantly correlated with phosphorus in soil (Figure 4a). The relative abundance of fungi was significantly different among different treatments. The relative abundance of Talaromyces in peanut monoculture was 10 fold that of mixed cropping and 80 fold that of the mulberry monoculture. Talaromyces is a saprophytic mold with strong adaptability. Although it can increase soil fertility, Talaromyces is also an opportunistic pathogen of humans and animals [50]. It was significantly positively correlated with soil nutrients and soil C:N, and its abundance was also low in intercropping mode, which could reduce the risk of soil-borne diseases. Mortierella is a crucial component of soil microorganisms in the rhizosphere of mulberry, so it had the highest content in the monocultural treatment of mulberry. Mortierella can activate phosphatase and increase the content of phosphorus in soil, and intercropping treatment also increased the abundance of this group [51]. By regulating soil stoichiometry, intercropping can increase the abundance of various beneficial bacteria and fungi in farmland soil, and then regulate the soil ecological environment.

5. Conclusions

The soil nutrients of intercropping were significantly higher than that of pure mulberry planting, but lower than that of pure peanut planting. However, according to soil stoichiometry, the C:N of farmland was decreased by intercropping, and the N:P was significantly lower than that of pure mulberry planting. There were significant differences in bacterial and fungal communities among the three treatments. Intercropping can improve the diversity and richness of bacteria and fungi. The abundances of dominant phyla and genera in soils of intercropping patterns increased to varying degrees. These results indicated that intercropping could regulate the soil ecological environment by increasing soil stoichiometric characteristics, increasing soil bacterial and fungal diversity, and increasing the abundance of some beneficial microorganisms. Therefore, the Morus alba–peanut intercropping system is suitable for promotion in the Liaoning area.

Author Contributions

Conceptualization, Y.Z.; methodology, Y.W.; software, H.D.; formal analysis, M.L.; investigation, W.Z.; resources, M.L.; data curation, W.Z. writing—original draft preparation, M.L.; writing—review and editing, M.L.; project administration, Y.Y.; funding acquisition, Y.Z. All authors have read and agreed to the published version of the manuscript.

Funding

This research was funded by the Liaoning Province Scientific Research Funding Project, grant numbers LSNZD202002 and LSNQN202012, the and Science and Technology Program of Liaoning Province, grant number 2020020287-JH1/103-05-02.

Data Availability Statement

The data presented in this study are available on request from the corresponding author. The data are not publicly available due to the policy of the institute.

Conflicts of Interest

The authors declare no conflict of interest.

References

  1. Jovino, R.S.; Rosa, S.T.; Terezinha, R.R.; Jackson, S.C.R.; Barboza, C.J.A.; Maria, L.L.; Cavalcanti, S.R.; Rosália, S.C.E.; Rose, R.P.; Santiago, F.A.D.; et al. Elite Bradyrhizobium strains boost biological nitrogen fixation and peanut yield in tropical drylands. Braz. J. Microbiol. 2022, 53, 1623–1632. [Google Scholar] [CrossRef] [PubMed]
  2. Toomer, O.T. Nutritional chemistry of the peanut (Arachis hypogaea). Crit. Rev. Food 2017, 58(17), 1–12. [Google Scholar] [CrossRef] [PubMed]
  3. Li, X.G.; Kevin, P.B.; Yao, X.D.; Devin, C.D.; Ding, C.F.; Wang, X.X.; Ruan, H.H. Peanut plant growth was altered by monocropping-associated microbial enrichment of rhizosphere microbiome. Plant Soil 2020, 446, 655–669. [Google Scholar] [CrossRef]
  4. Wang, G.Z.; Li, X.G.; Xi, X.Q.; Cong, W.F. Crop diversification reinforces soil microbiome functions and soil health. Plant Soil 2022, 476, 375–383. [Google Scholar] [CrossRef]
  5. Bamboriya, S.D.; Bana, R.S.; Kuri, B.R.; Kumar, V.; Bamboriya, S.D.; Meena, R.P. Achieving higher production from low inputs using synergistic crop interactions under maize-based polyculture systems. Environ. Sustain. 2022, 5, 145–159. [Google Scholar] [CrossRef]
  6. Namazi, Y.; Rezaei, C.E.; Siavash, M.S.; Leonardo, B.M. The effects of microbial inoculation and intercropping on yield and active ingredients of savory (Satureja hortensis L.) intercropped with common bean (Phaseolus vulgaris L.). Int. J. Environ. Sci. 2022, 19, 8273–8288. [Google Scholar] [CrossRef]
  7. Feng, C.; Sun, Z.X.; Zhang, L.Z.; Feng, L.S.; Zheng, J.M.; Bai, W.; Gu, C.F.; Wang, Q.; Xu, Z.; Wopke, W. Maize/peanut intercropping increases land productivity: A meta-analysis. Field Crop Res. 2021, 270, 108208. [Google Scholar] [CrossRef]
  8. Jiang, Y.H.; Khan, M.U.; Lin, X.Q.; Lin, Z.M.; Lin, S.S.; Lin, W.X. Evaluation of maize/peanut intercropping effects on microbial assembly, root exudates and peanut nitrogen uptake. Plant Physiol. Bioch. 2022, 171, 75–83. [Google Scholar] [CrossRef]
  9. Surki, A.A.; Nazari, M.; Fallah, S.; Iranipour, R. Improvement of the soil properties, nutrients, and carbon stocks in different cereal–legume agroforestry systems. Int. J. Environ. Sci. 2020, 18, 1–8. [Google Scholar]
  10. Tang, X.M.; Zhong, R.C.; Jiang, J.; He, L.Q.; Huang, Z.P.; Shi, G.Y.; Wu, H.N.; Liu, J.; Xiong, F.Q.; Han, Z.Q.; et al. Cassava/peanut intercropping improves soil quality via rhizospheric microbes increased available nitrogen contents. BMC Biotechnol. 2020, 20, 13. [Google Scholar] [CrossRef] [Green Version]
  11. Zhao, X.H.; Dong, Q.Q.; Han, Y.; Zhang, K.Z.; Shi, X.L.; Yang, X.; Yuan, Y.; Zhou, D.Y.; Wang, K.; Wang, X.G.; et al. Maize/peanut intercropping improves nutrient uptake of side-row maize and system microbial community diversity. BMC Microbiol. 2022, 22, 14. [Google Scholar] [CrossRef]
  12. Phoenix, G.K.; Johnson, D.A.; Muddimer, S.P.; Leake, J.R.; Cameron, D.D. Niche differentiation and plasticity in soil phosphorus acquisition among co-occurring plants. Nat. Plants 2020, 6, 349–354. [Google Scholar] [CrossRef]
  13. Dai, C.C.; Chen, Y.; Wang, X.X.; Li, P.D. Effects of intercropping of peanut with the medicinal plant Atractylodes lancea on soil microecology and peanut yield in subtropical China. Agroforest Syst. 2013, 87, 417–426. [Google Scholar] [CrossRef]
  14. Bardgett, R.D.; Putten, W.H.V.D. Belowground biodiversity and ecosystem functioning. Nature 2014, 515, 505–511. [Google Scholar] [CrossRef]
  15. Sivojiene, D.; Kacergius, A.; Baksiene, E.; Maseviciene, A.; Zickiene, L. The influence of organic fertilizers on the abundance of soil microorganism communities, agrochemical indicators, and yield in east lithuanian lightsoils. Plants 2021, 10, 2648. [Google Scholar] [CrossRef]
  16. He, X.J.; Xie, H.; Gao, D.M.; Khashi, U.; Rahman, M.; Zhou, X.G.; Wu, F.Z. Biochar and intercropping with potato–onion enhanced the growth and yield advantages of tomato by regulating the soil properties, nutrientuptake, and soil microbial community. Front. Microbiol. 2021, 12, 695447. [Google Scholar] [CrossRef]
  17. Ke, P.J.; Zee, P.C.; Fukami, T. Dynamic plant-soil microbe interactions: The neglected effect of soil conditioning time. New Phytol. 2021, 231, 1546–1558. [Google Scholar] [CrossRef]
  18. Cui, Y.X.; Fang, L.C.; Guo, X.B.; Wang, X.; Zhang, Y.J.; Li, P.F.; Zhang, X.C. Ecoenzymatic stoichiometry and microbial nutrient limitation in rhizosphere soil in the arid area of the northern Loess Plateau, China. Soil Biol. Biochem. 2018, 116, 11–21. [Google Scholar] [CrossRef]
  19. Wang, M.; Chen, S.B.; Chen, L.; Wang, D. Responses of soil microbial communities and their network interactions to saline-alkaline stress in Cd-contaminated soils. Environ. Pollut. 2019, 252, 1609–1621. [Google Scholar] [CrossRef]
  20. Cheng, H.Y.; Yuan, M.S.; Tang, L.; Shen, Y.F.; Yu, Q.; Li, S.Q. Integrated microbiology and metabolomics analysis reveal responses of soil microorganisms and metabolic functions to phosphorus fertilizer on semiarid farm. Sci. Total Environ. 2022, 817, 152878. [Google Scholar] [CrossRef]
  21. Liu, Y.; Willison, J.H.M. Prospects for cultivating white mulberry (Morus alba) in the drawdown zone of the Three Gorges Reservoir, China. Environ Sci Pollut Res. 2013, 20, 7142–7151. [Google Scholar] [CrossRef] [PubMed]
  22. Durgadevi, R.; Vijayalakshmi, D. Mulberry with increased stomatal frequency regulates gas exchange traits for improved drought tolerance. Plant Physiol. Rep. 2020, 25, 24–32. [Google Scholar] [CrossRef]
  23. Li, R.X.; Su, X.Q.; Zhang, Y.P.; Wang, T.C. Molecular mechanism of mulberry response to drought stress revealed by complementary transcriptomic and iTRAQ analyses. BMC Plant Biol. 2022, 22, 36. [Google Scholar] [CrossRef] [PubMed]
  24. Wang, L.; Wang, N.; Ji, G. Responses of biomass allocation and photosynthesis in mulberry to Pb-contaminated soil. Acta Physiol. Plant 2022, 44, 43–52. [Google Scholar] [CrossRef]
  25. Wang, L.; Ji, G. Glutathione and calcium biomineralization of mulberry (Morus alba L.) involved in the heavy metal detoxification of lead-contaminated soil. J. Soil. Sci. Plant Nut. 2021, 21, 1182–1190. [Google Scholar] [CrossRef]
  26. Zhang, X.L.; Teng, Z.T.; Zhang, H.H.; Cai, D.J.; Zhang, J.Y.; Meng, F.J.; Sun, G.Y. Nitrogen application and intercropping change microbial community diversity and physicochemical characteristics in mulberry and alfalfa rhizosphere soil. J. For. Res. 2021, 32, 2121–2133. [Google Scholar] [CrossRef]
  27. Benjamin, J.C.; Paul, J.M.M.; Michael, J.R.; Andrew, W.H.; Amy, J.A.J.; Susan, P.H. Dada2: High-resolution sample inference from illumina amplicon data. Nat. Methods 2016, 13, 581–583. [Google Scholar]
  28. Zhong, H.; Liu, Y.J.; Wang, B.H.; He, M.J.; Wu, L. Effect of analysis method on 16S rRNA gene amplification and sequencing analysis results of bacterial community. Biotechnol. Bull. 2022, 38, 81–92. [Google Scholar]
  29. Bray, J.R.; Curtis, J.T. An ordination of the upland forest communities of southern wisconsin. Ecol. Monogr. 1957, 27, 327–349. [Google Scholar] [CrossRef]
  30. Ramette, A. Multivariate analyses in microbial ecology. Fems. Microbiol. Ecol. 2007, 62, 142–160. [Google Scholar] [CrossRef] [Green Version]
  31. Li, H.; Luo, H.; Tang, B.; Guo, H.; Cao, Z.; Zeng, Q.; Chen, S.; Chen, Z. Dynamic changes of rhizosphere soil bacterial community and nutrients in cadmium polluted soils with soybean-corn intercropping. BMC Microbiol. 2022, 22, 57. [Google Scholar] [CrossRef]
  32. Bainard, L.D.; Koch, A.M.; Gordon, A.M.; Klironomos, J.N. Growth response of crops to soil microbial communities from conventional monocropping and tree-based intercropping systems. Plant Soil 2013, 363, 345–356. [Google Scholar] [CrossRef]
  33. Wang, J.; Liao, L.R.; Ye, Z.C.; Liu, H.F.; Zhang, C.; Zhang, L.; Liu, G.B.; Wang, G.L. Different bacterial co-occurrence patterns and community assembly between rhizosphere and bulk soils under N addition in the plant-soil system. Plant Soil 2022, 471, 697–713. [Google Scholar] [CrossRef]
  34. Tomohiro, R.; Arizono, I.; Takemoto, Y. Economic design of double sampling Cpm control chart for monitoring process capability. Int. J. Prod. Econ. 2020, 221, 107468. [Google Scholar] [CrossRef]
  35. Kuramae, E.E.; Yergeau, E.; Wong, L.C.; Pijl, A.S.; Johannes, A.V.V.; Kowalchuk, G.A. Soil characteristics more strongly influence soil bacterial communities than land-use type. FEMS Microbiol. Ecol. 2012, 79, 12–24. [Google Scholar] [CrossRef] [Green Version]
  36. Yadav, A.; Bhatia, A.; Yadav, S.; Kumar, V.; Singh, B. The effects of elevated CO2 and elevated O3 exposure on plant growth, yield and quality of grains of two wheat cultivars grown in North India. Heliyon 2019, 5, e02317. [Google Scholar] [CrossRef] [Green Version]
  37. Lu, J.Y.; Tian, H.; Zhang, H.S.; Xiong, J.B.; Yang, H.M.; Liu, Y. Shoot-soil ecological stoichiometry of alfalfa under nitrogen and phosphorus fertilization in the Loess Plateau. Sci. Rep. 2021, 11, 15049. [Google Scholar] [CrossRef]
  38. Qiao, X.; Chen, X.W.; Lei, J.J.; Sai, L.H.; Xue, L.H. Apricot-based agroforestry system in Southern Xinjiang Province of China: Inflfluence on yield and quality of intercropping wheat. Agroforest Syst. 2020, 94, 477–485. [Google Scholar] [CrossRef] [Green Version]
  39. Zhang, G.L.; Chu, X.B.; Zhu, H.Y.; Zou, D.S.; Li, L.C.; Du, L.S. The response of soil nutrients and microbial community structures in long-term tea plantations and diverse agroforestry intercropping systems. Sustainability 2021, 13, 7799. [Google Scholar] [CrossRef]
  40. Zhou, G.X.; Zhang, J.B.; Zhang, C.Z.; Feng, Y.Z.; Chen, L.; Yu, Z.H.; Xin, X.L.; Zhao, B.Z. Effects of changes in straw chemical properties and alkaline soils on bacterial communities engaged in straw decomposition at different temperatures. Sci. Rep. 2016, 6, 22186. [Google Scholar] [CrossRef] [Green Version]
  41. Yang, Y.L.; Xu, M.; Zou, X.; Chen, J.; Zhang, J.; Zhang, J. Effects of different vegetation types on soil bacterial community characteristics in mountainous and hilly areas of central Guizhou. J. Ecol. Rural Environ. 2021, 37, 518–525. [Google Scholar]
  42. Joel, P.D.; Angel, V.; Joachim, M.S.; Don, A.C.; Jacqueline, E.V.D.W. Differences in bacterial diversity, composition and function due to long-term agriculture in soils in the eastern free state of South Africa. Diversity 2019, 11, 61. [Google Scholar]
  43. Liu, H.Y.; Xu, W.; Li, J.Y.; Yu, Z.Y.; Zeng, Q.C.; Tan, W.F.; Mi, W.T. Short-term effect of manure and straw application on bacterial and fungal community compositions and abundances in an acidic paddy soil. J. Soil Sediment 2021, 21, 3057–3071. [Google Scholar] [CrossRef]
  44. Zhang, L.; Zhang, P.; Yoza, B.; Liu, W.; Liang, H. Phytoremediation of metal-contaminated rare-earth mining sites using Paspalum conjugatum. Chemosphere 2020, 259, 127280. [Google Scholar] [CrossRef] [PubMed]
  45. Zhang, M.; Song, G.; Gelardi, D.L.; Huang, L.B.; Khan, E.; Mašek, O.; Parikh, S.J.; Sik, O.Y. Evaluating biochar and its modifications for the removal of ammonium, nitrate, and phosphate in water. Water Res. 2020, 186, 116303. [Google Scholar] [CrossRef]
  46. Kazerooni, E.A.; Rethinasamy, V.; Al-Sadi, A.M. Talaromyces pinophilus inhibits Pythium and Rhizoctonia-induced damping-off of cucumber. J. Plant Pathol. 2019, 101, 377–383. [Google Scholar] [CrossRef]
  47. Zhou, J.; Jiang, X.; Zhou, B.K.; Zhao, B.S.; Ma, M.C.; Guan, D.W.; Li, J.; Chen, S.F.; Cao, F.M.; Shen, D.L.; et al. Thirty four years of nitrogen fertilization decreases fungal diversity and alters fungal community composition in black soil in northeast China. Soil Biol. Biochem. 2016, 95, 135–143. [Google Scholar] [CrossRef]
  48. Bärbel, U.F.; Manfred, R.; Jörg, O. Blastocatella fastidiosa gen. nov., sp. nov., isolated from semiarid savanna soil-The first described species of Acidobacteria subdivision 4. Syst. Appl. Microbiol. 2013, 36, 82–89. [Google Scholar]
  49. Wang, Z.T.; Li, T.; Li, Y.Z.; Zhao, D.Q.; Han, J.; Liu, Y.; Liao, Y.C. Relationship between the microbial community and catabolic diversity in response to conservation tillage. Soil Till. Res. 2019, 196, 104431. [Google Scholar] [CrossRef]
  50. Shi, Y.X.; Meng, S.S.; Xie, X.W.; Chai, A.L.; Li, B.J. Dry Heat Treatment Reduces the Occurrence of Cladosporium cucumerinum, Ascochyta citrullina, and Colletotrichum orbiculare on the Surface and Interior of Cucumber Seeds. Horticult. Plant J. 2016, 2, 35–40. [Google Scholar] [CrossRef]
  51. Tan, Z.T.; Li, A.D.; Yang, R.; Cai, G.J.; Wu, F.C.; Guo, C.Y. Effects on community structure of soil fungi in Passiflora edulis continuous cropping. Mol. Plant Breed 2022, 20, 1373–1382. [Google Scholar]
Figure 1. Relative abundance of bacteria and fungi at phylum in rhizosphere soil. (a): Relative abundance of bacterial phylum-level species composition. (b): Relative abundance of fungal phylum-level species composition. LF: Morus alba; LD: Arachis hypogaea; LE: Morus alba-Arachis hypogaea.
Forests 13 01757 g001
Figure 2. Pearson correlation analysis between soil physicochemical properties and the top ten phyla of soil bacterial and fungal communities. Colors indicate relevance. The color corresponds to the ruler value on the right side of the image. Red means positive correlation, and blue means negative correlation. ** and * significant at 1% and 5% probability, respectively. (a) Correlation between bacterial phyla and soil properties. (b) Correlation between phylum fungi and soil properties.
Forests 13 01757 g002
Figure 3. Relative abundance of bacteria and fungi at phylum in rhizosphere soil. (a): Relative abundance of bacterial genus-level species composition. (b): Relative abundance of fungal genus-level species composition. LF: Morus alba; LD: Arachis hypogaea; LE: Morus alba-Arachis hypogaea.
Forests 13 01757 g003
Figure 4. Pearson correlation analysis between soil physicochemical properties and the top ten bacterial genera in soil bacterial and fungal communities. Colors indicate relevance. The color corresponds to the ruler value on the right side of the image. Red means positive correlation, and blue means negative correlation. ** and * significant at 1% and 5% probability, respectively. (a) Correlation between bacterial genera and soil properties. (b): Correlation between fungal genera and soil properties.
Forests 13 01757 g004
Figure 5. Alpha diversity of bacteria and fungi in rhizosphere soil. The upper and lower end lines of the box indicate the upper and lower quartiles (IQR); the median line indicates the median; the upper and lower edges indicate the maximum and minimum values (extreme values within 1.5-fold of the IQR range). The numbers under the diversity index labels are the p values of the Kruskal–Wallis test. (a): Analysis of α diversity of the soil bacterial community. (b): Analysis of α diversity of the soil fungal community. The relative abundance of bacteria and fungi at phylum in rhizosphere soil. LF: Morus alba; LD: Arachis hypogaea; LE: Morus alba-Arachis hypogaea.
Forests 13 01757 g005
Figure 6. Principal coordinate analysis and hierarchical clustering analysis of soil bacterial and fungal community composition in different treatments. (a): soil bacterial communities; (b): soil fungal communities. LF: Morus alba; LD: Arachis hypogaea; LE: Morus alba-Arachis hypogaea.
Forests 13 01757 g006
Table 1. Rhizosphere soil physicochemical properties and soil stoichiometry under different treatments.
Soil ChemistryLFLELD
pH Value7.91 ± 0.03 b8.02 ± 0.03 a7.96 ± 0.01 ab
TN (g kg−1)0.47 ± 0.01 b0.49 ± 0.01 b0.54 ± 0.02 a
SOC (g kg−1)4.54 ± 0.18 c5.34 ± 0.15 b6.79 ± 0.30 a
TP (g kg−1)0.44 ± 0.01 c0.58 ± 0.01 b0.65 ± 0.02 a
C:N9.70 ± 0.19 c10.90 ± 0.11 b12.56 ± 0.18 a
N:P1.07 ± 0.05 a0.84 ± 0.05 b0.85 ± 0.02 b
C:P10.42 ± 0.62 a9.23 ± 0.22 a10.59 ± 0.78 a
The values represent the mean ± standard error. Significant differences in the mean values of variables in each plant configuration by treatment are indicated by different lowercase letters (p < 0.05). The significance in difference among treatments was tested by Duncan (p < 0.05). LF: Morus alba; LD: Arachis hypogaea; LE: Morus alba-Arachis hypogaea.
Publisher’s Note: MDPI stays neutral with regard to jurisdictional claims in published maps and institutional affiliations.

