Article

Identification and Characterization of Salt-Responsive MicroRNAs in Taxodium hybrid ‘Zhongshanshan 405’ by High-Throughput Sequencing

Jiangsu Key Laboratory for the Research and Utilization of Plant Resources, Institute of Botany, Jiangsu Province and Chinese Academy of Sciences (Nanjing Botanical Garden Mem. Sun Yat-Sen), Nanjing 210014, China
*
Author to whom correspondence should be addressed.
Forests 2022, 13(10), 1685; https://doi.org/10.3390/f13101685
Submission received: 24 August 2022 / Revised: 19 September 2022 / Accepted: 12 October 2022 / Published: 13 October 2022

Abstract

:
MicroRNAs (miRNAs) are a type of noncoding RNA participating in the post-transcriptional regulation of gene expression that regulates plant responses to salt stress. Small RNA sequencing was performed in this study to discover the miRNAs responding to salt stress in Taxodium hybrid ‘Zhongshanshan 405’, which is tolerant to salinity stress. A total of 52 miRNAs were found to be differentially expressed. The target genes were enriched with gene ontology (GO), including protein phosphorylation, cellular response to stimulus, signal transduction, ATP and ADP binding, showing that miRNAs may play key roles in regulating the tolerance to salt stress in T. hybrid ‘Zhongshanshan 405’. Notably, a G-type lectin S-receptor-like serine/threonine-protein kinase (GsSRK) regulated by novel_77 and novel_2 miRNAs and a mitogen-activated protein kinase kinase kinase (MAPKKK) regulated by novel_41 miRNA were discovered under both short- and long-term salt treatments and can be selected for future research. This result provides new insights into the regulatory functions of miRNAs in the salt response of T. hybrid ‘Zhongshanshan 405’.

1. Introduction

Salt stress can seriously endanger plant growth and development. About one fifth of agricultural lands and half of the croplands in the world suffer from salt stress [1]. High salinity can also lead to secondary stresses such as oxidative stress and nutritional imbalance, leading to cell damage, growth inhibition and crop yield reduction [2]. Taxodium is an excellent wetland species and important landscape plant living in river and coastal floodplains [3]. It has a long lifespan, is relatively free from pest problems, is plentiful in its natural environment and is generally tolerant to flooding, salt and hurricanes [4]. To combine the best characteristics of superior parents, different species of Taxodium were undertaken to produce hybrids called Taxodium hybrids ‘Zhongshanshan’ (hereafter referred to as T. hybrid), excellent woody plants for the afforestation of wetland and coastal areas in southeastern China [5], where they currently play an important role in the water system and coastal floodplains areas [6]. In addition, previous studies have shown that T. hybrid is tolerant to salinity stress [7,8]. To analyze the genetic basis of this salt tolerance, RNA-Seq and the analysis of differentially expressed genes in T. hybrid subjected to salt stress have been performed. Those studies indicated that genes related to transport, signal transductions and genes of unknown function were involved in salt tolerance [8].
miRNAs are endogenous short (21–24 nucleotides) and non-coding RNAs, which are important in post-transcriptional gene regulation through mRNA degradation or inhibition of mRNA translation [9]. miRNAs play significant roles in the regulation of many biological processes, including stress responses in plants [10]. The expression of plant miRNAs can be altered in response to several abiotic stress stimuli, such as drought, salinity, extreme temperatures and others [11,12]. In response to a high salt environment, miRNA regulates changes in gene expression involved in a wide range of biological processes, including signal transduction [13,14]. Next-generation sequencing (NGS) technologies have generated extensive sequencing data for detecting salt-sensitive miRNAs in different plant species [13,15]. Many miRNAs and genes responding to salt stress have been studied at the level of transcription with these technologies [13,16] and indicate that plant responses to salt treatment may be determined by miRNA-directed gene regulation. Understanding the role of T. hybrid miRNAs under salt stress will help identify the genes involved and provide insights into the regulatory mechanism underlying salt tolerance in Taxodium, thereby providing a basis for more effective plant breeding.
High-throughput sequencing technology was used in this study to identify differentially expressed miRNAs of T. hybrid under high salt stress conditions. To investigate the underlying mechanism of the miRNA-mediated regulation of gene expression under a salt environment, the potential target genes of differentially expressed miRNAs were analyzed through Gene Ontology (GO) enrichment and pairs of miRNAs and target genes with opposite expression patterns in such comparisons were chosen for analysis of regulation mechanism. This study helps to study the potential regulatory mechanism of miRNA-mediated responses to salt stress in T. hybrid. The specific miRNAs in T. hybrid can be used to breed salt-tolerant plants growing on marginal lands.

2. Materials and Methods

2.1. Plant Materials

The process of plant growth and high salt treatments were consistent with the previous method of Yu [8]. Briefly, T. hybrid ‘Zhongshanshan 405’ were planted in plastic pots in a ventilated greenhouse. After one year, the plantlets of uniform growth were carefully removed from the soil to avoid injury, their roots were washed with tap water and groups of seedlings were placed in 1/2 Hoagland solution. After 1 week, seedlings were transferred to containers with 0, 100 or 200 mM NaCl solutions in 1/2 Hoagland solution.
After the seedlings were subjected to salt stress for different times, the total roots were harvested, frozen in liquid nitrogen and stored at −80 °C until analysis. Four sample types were taken for sequencing, negative control (0 mM NaCl treated for 1 h) (T1), 100 mM NaCl treated for 1 h (T2), 200 mM NaCl treated for 1 h (T3) or 24 h (T4). Three biological replicates of each sample type were used.

2.2. Small RNA Library Construction and High-Throughput Sequencing

Total RNA was extracted with Trizol reagent following the manufacturer’s protocol (Takara Bio Inc., Otsu, Japan). RNA degradation and contamination was monitored on 1% agarose gels. RNA purity was checked using a NanoPhotometer® spectrophotometer (IMPLEN, CA, USA). RNA concentrations were tested with a Qubit® RNA Assay Kit in a Qubit® 2.0 Fluorimeter (Life Technologies, CA, USA). RNA integrity was measured with the RNA Nano 6000 Assay Kit of the Agilent Bioanalyzer 2100 system (Agilent Technologies, CA, USA). Sequencing libraries of small RNAs were generated from 3 µg RNA of each sample with NEBNext® Multiplex Small RNA Library Prep Set for Illumina® (New England Biolabs, Inc., Ipswich, MA, USA) as per the manufacturer’s instructions, and index codes were added to attribute sequences to each sample. Index-coded samples were clustered on a cBot Cluster Generation System with TruSeq SR Cluster Kit v3-cBot-HS (Illumina, San Diego, CA, USA). The resulting library preparations were sequenced on an Illumina Hiseq 2500 platform to generate 50 bp single-end reads after cluster generation.

2.3. Data Filtering and Mapping Reads

Clean data were obtained by deleting reads that contained poly-N, poly nucleotides, 5′ adapter contaminants, missing the 3′ adapter or insert tag and low-quality reads by custom perl and python scripts. The length distribution of the clean reads was then sorted to analyze the composition of the sRNA data, and the sRNAs of 18–30 nt were kept for further analyses. The small RNA tags were mapped to reference sequences by Bowtie (bowtie-0.12.9, Baltimore, MD, USA) without mismatch to analyze their expression and distribution on the reference [8].

2.4. Identification of Known MicroRNAs and Novel MicroRNAs

To map each unique small RNA to only one annotation, we followed the following priority rule: known miRNA > rRNA > tRNA > snRNA > snoRNA > repeat > gene > NAT-siRNA > gene > novel miRNA > ta-siRNA. Taking miRBase20.0 as a reference, we used modified software mirdeep2 [17] and srna-tools-cli to obtain potential miRNAs and to draw the secondary structures. miREvo and mirdeep2 were integrated to predict novel miRNAs [17,18].

2.5. Analyzing sRNA Expression

TPM (transcript per million) was calculated to show miRNA expression levels by the following criteria: normalized expression = mapped readcount/Total reads * 1,000,000 [3]; differential expression analysis was performed with the DESeq R package (1.8.3, European Molecular Biology Laboratory Heidelberg, Germany); the Benjamini and Hochberg method was selected for adjusting p-values and an adjusted p-value of 0.05 was set as the default threshold for significantly differential expression.

2.6. Target Prediction

Predicting the target gene of miRNA was performed by psRobot_tar in psRobot [19] for plants, using the following parameters: penalty score threshold: 3.0; five prime boundary of essential sequence: 1; three prime boundary of essential sequence: 31; maximal number of permitted gaps: 0; position after which with gaps permitted: 1. GOseq-based Wallenius non-central hyper-geometric distribution [20], which could adjust for gene length bias, was implemented for GO-enrichment analysis.

2.7. Validation of miRNAs’ Expression by Real-Time Quantitative PCR (QRT-PCR)

To validate the high-throughput sequencing, six miRNAs with differential expression patterns were randomly selected and tested with qRT-PCR. RNA was reverse-transcribed to cDNA with the miRNA First-Strand cDNA Synthesis Kit (Tiangen, Beijing, China) with the addition of 5 pmol of forward and reverse primers in a final volume of 20 μL (Table S1). The reaction system was constructed using the SYBR® Premix Ex Taq™ II (Tli RNaseH Plus), ROX plus (Takara) according to recommendations of the manufacturer. qRT-PCR conditions were set as follows: 95 °C 30 s; 40 cycles of 95 °C 5 s, 60 °C 40 s; followed by a melt curve. Each transcript abundance of miRNA was normalized relative to U6 snRNA [21], and the relative miRNA expression was calculated according to the 2−∆∆Ct method. There were three biological replicates per sample and three technical replicates per reaction. Statistical analysis was performed by one-way ANOVA with the least significant difference (LSD) test using the statistical program SPSS 21.0 (IBM-SPSS Inc, Chicago, IL, USA) for Windows. Values were considered statistically different when p < 0.05. All figures were represented by OriginPro 9.1 software (Microcal, Northampton, MA, USA).

3. Results

3.1. Deep-Sequencing of sRNAs

To identify miRNAs involved in the regulation of the salt resistance of T. hybrid, high-throughput sequencing technique was used to construct libraries from the treated samples. Over 10 million reads were generated from the initial libraries, and after filtering out adapter sequences and removing low quality sequences, over 93.90% remained as clean reads (Table 1). The sequences lengths ranged from 18–30 nt, with 21–24 nt small RNAs highly enriched.

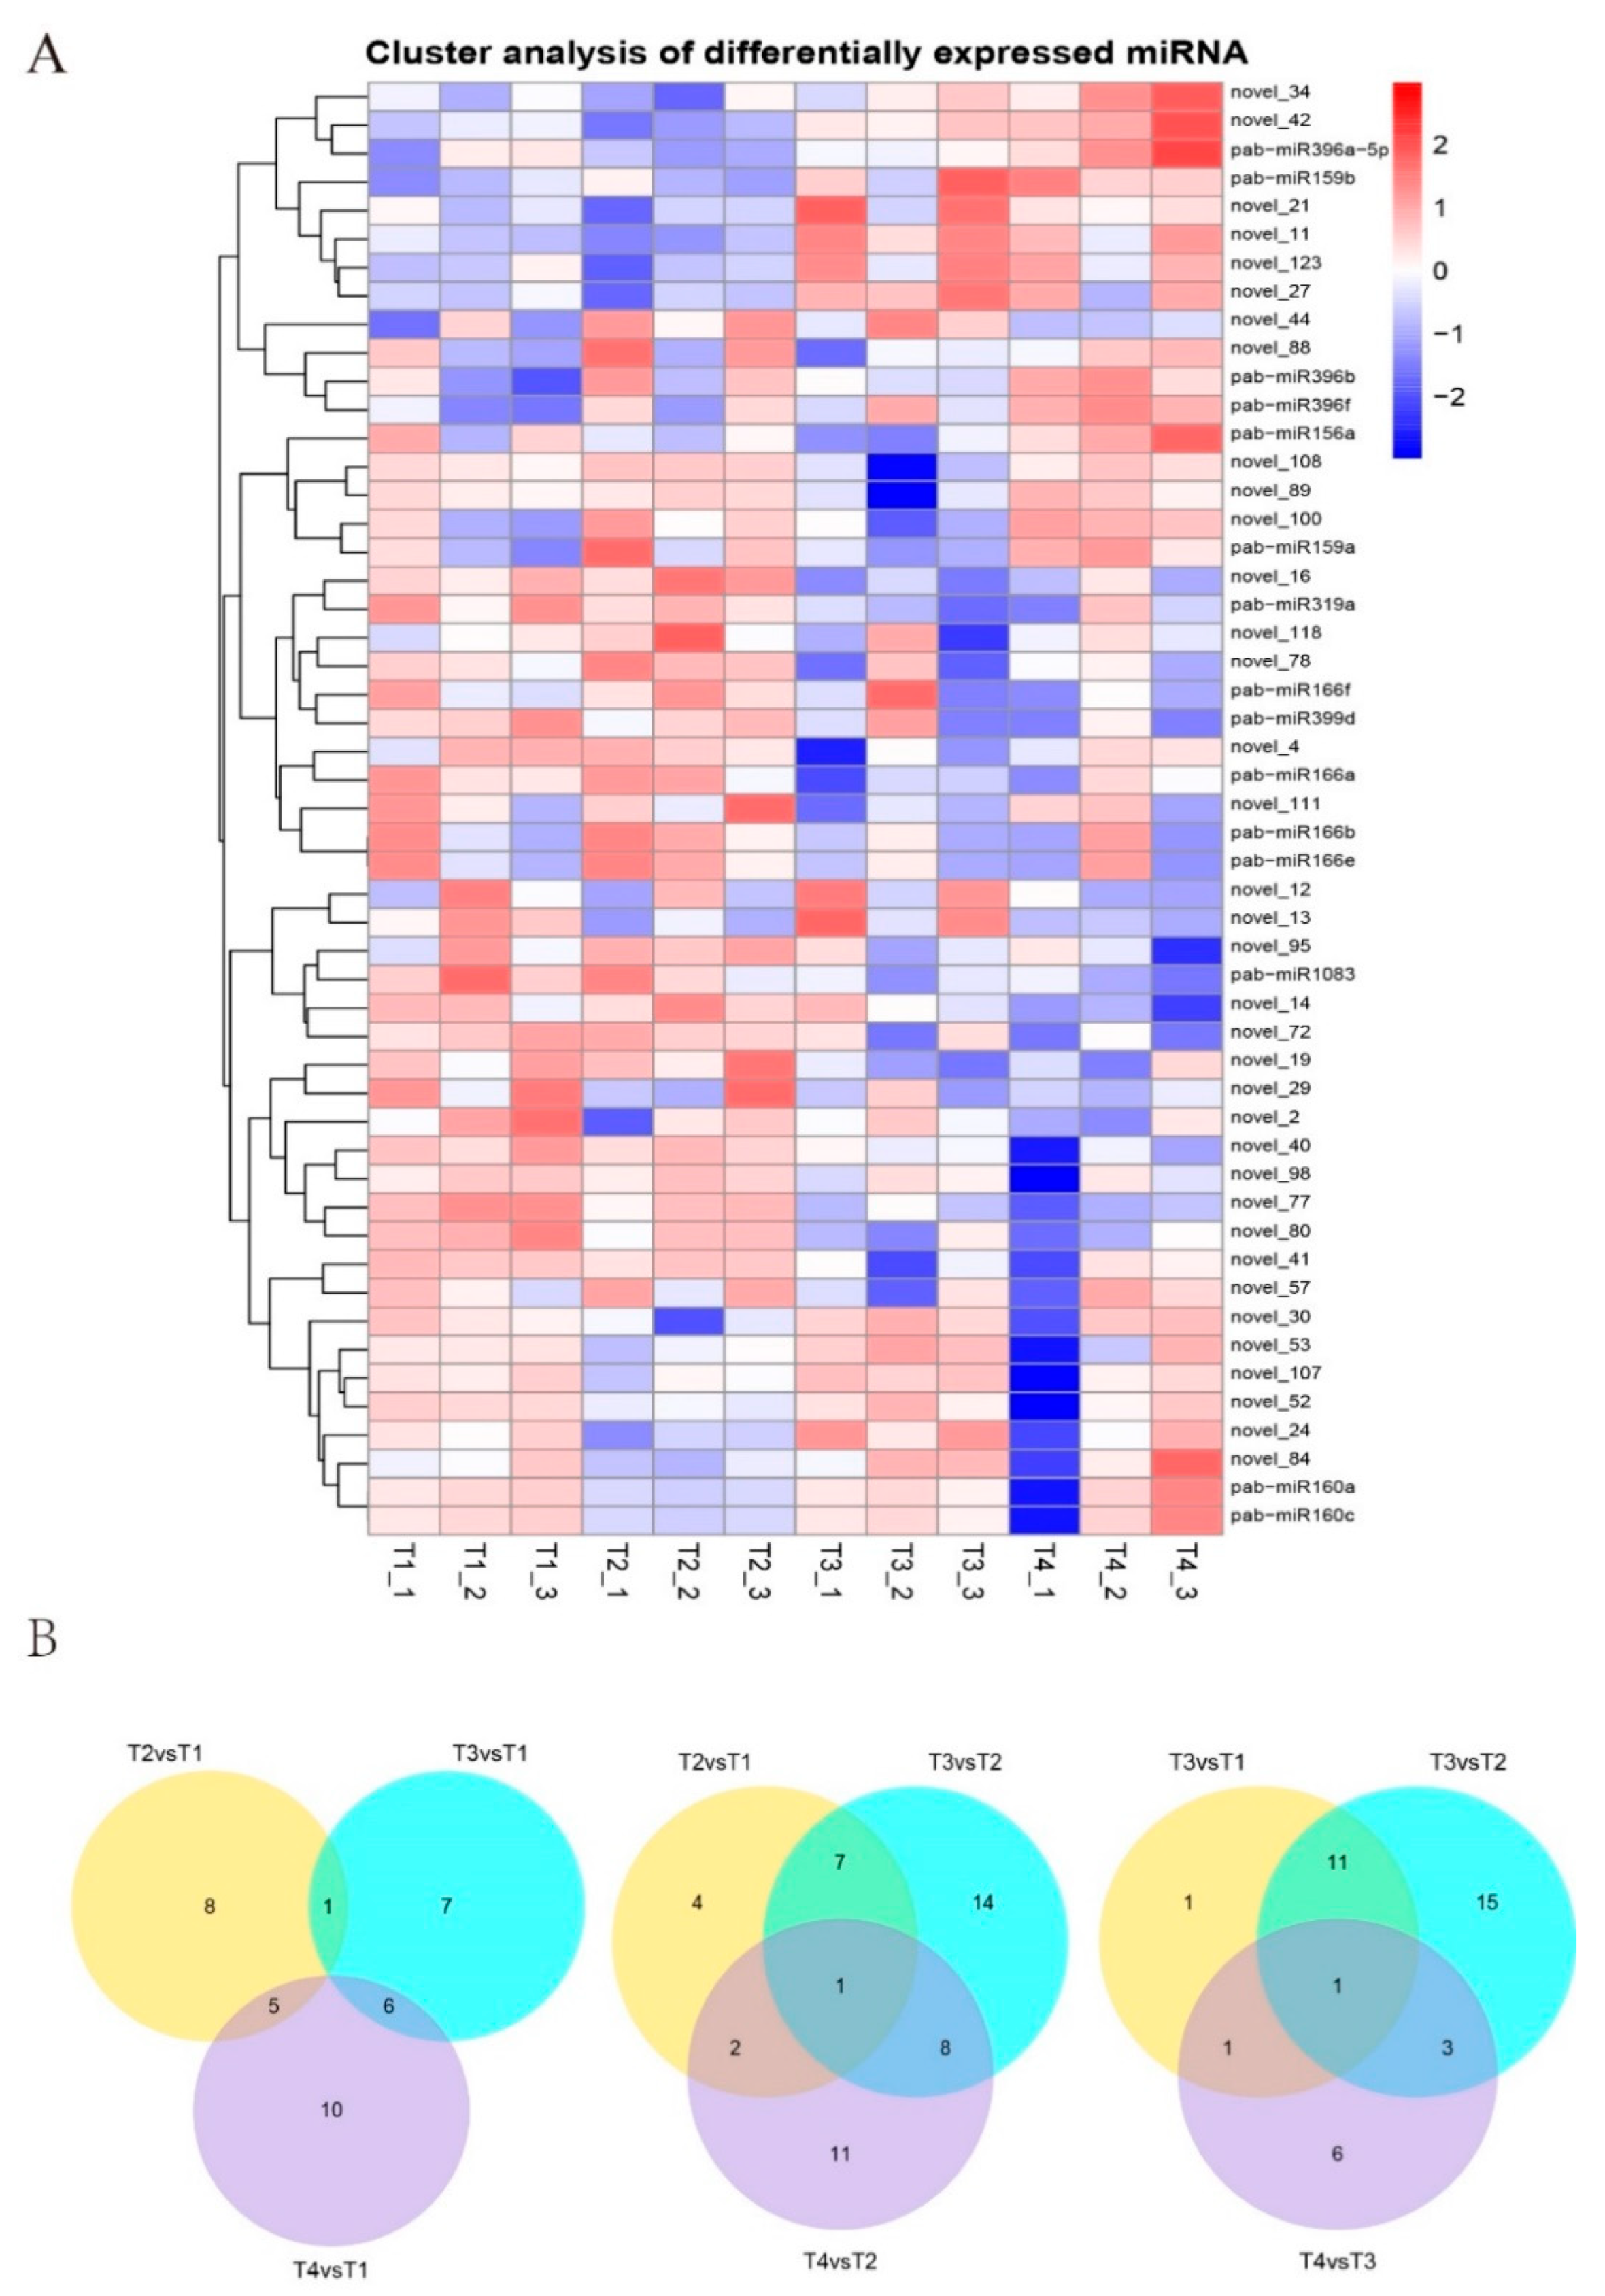
3.2. Identification of Known miRNAs and Novel miRNAs

To identify miRNAs in T. hybrid, the mapped sRNA library was compared to known plant miRNAs in the miRBase 20.0 database (www.mirbase.org, accessed on 19 September 2022). A total of 49 known plant miRNAs were identified. In addition, 98 candidate novel miRNAs were predicted based on their secondary structure (Table 2). At the same time, 155 miRNA hairpins and 68 star miRNAs were identified (Table 2).
To identify differentially expressed miRNAs, their expression levels were normalized, clustered and are presented in a heatmap in Figure 1A. The results showed that the expressions of some miRNAs were upregulated after salt treatments, while some other miRNAs were higher expressed in the control group (T1) and the short-term and low concentration of salt treatment (T2) than in the high concentration (T3) and long-term (T4) of salt treatments. Among them, 14, 14 and 21 miRNAs were differentially expressed relative to the T1 (control) in T2, T3 and T4, respectively. In addition, one, five and six miRNAs were shared by T2 vs. T1 and T3 vs. T1, T2 vs. T1 and T4 vs. T1, and T3 vs. T1 and T4 vs. T1, respectively, and one and one miRNAs were shared by the group of T2 vs. T1, T3 vs. T2, T4 vs. T2 and the group of T3 vs. T1, T3 vs. T2, T4 vs. T3 (Figure 1B). T4 vs. T3 represented a comparison between long- and short- term salt treatments, and 11 miRNAs were differentially expressed in this comparison group. These are listed in Table S2.

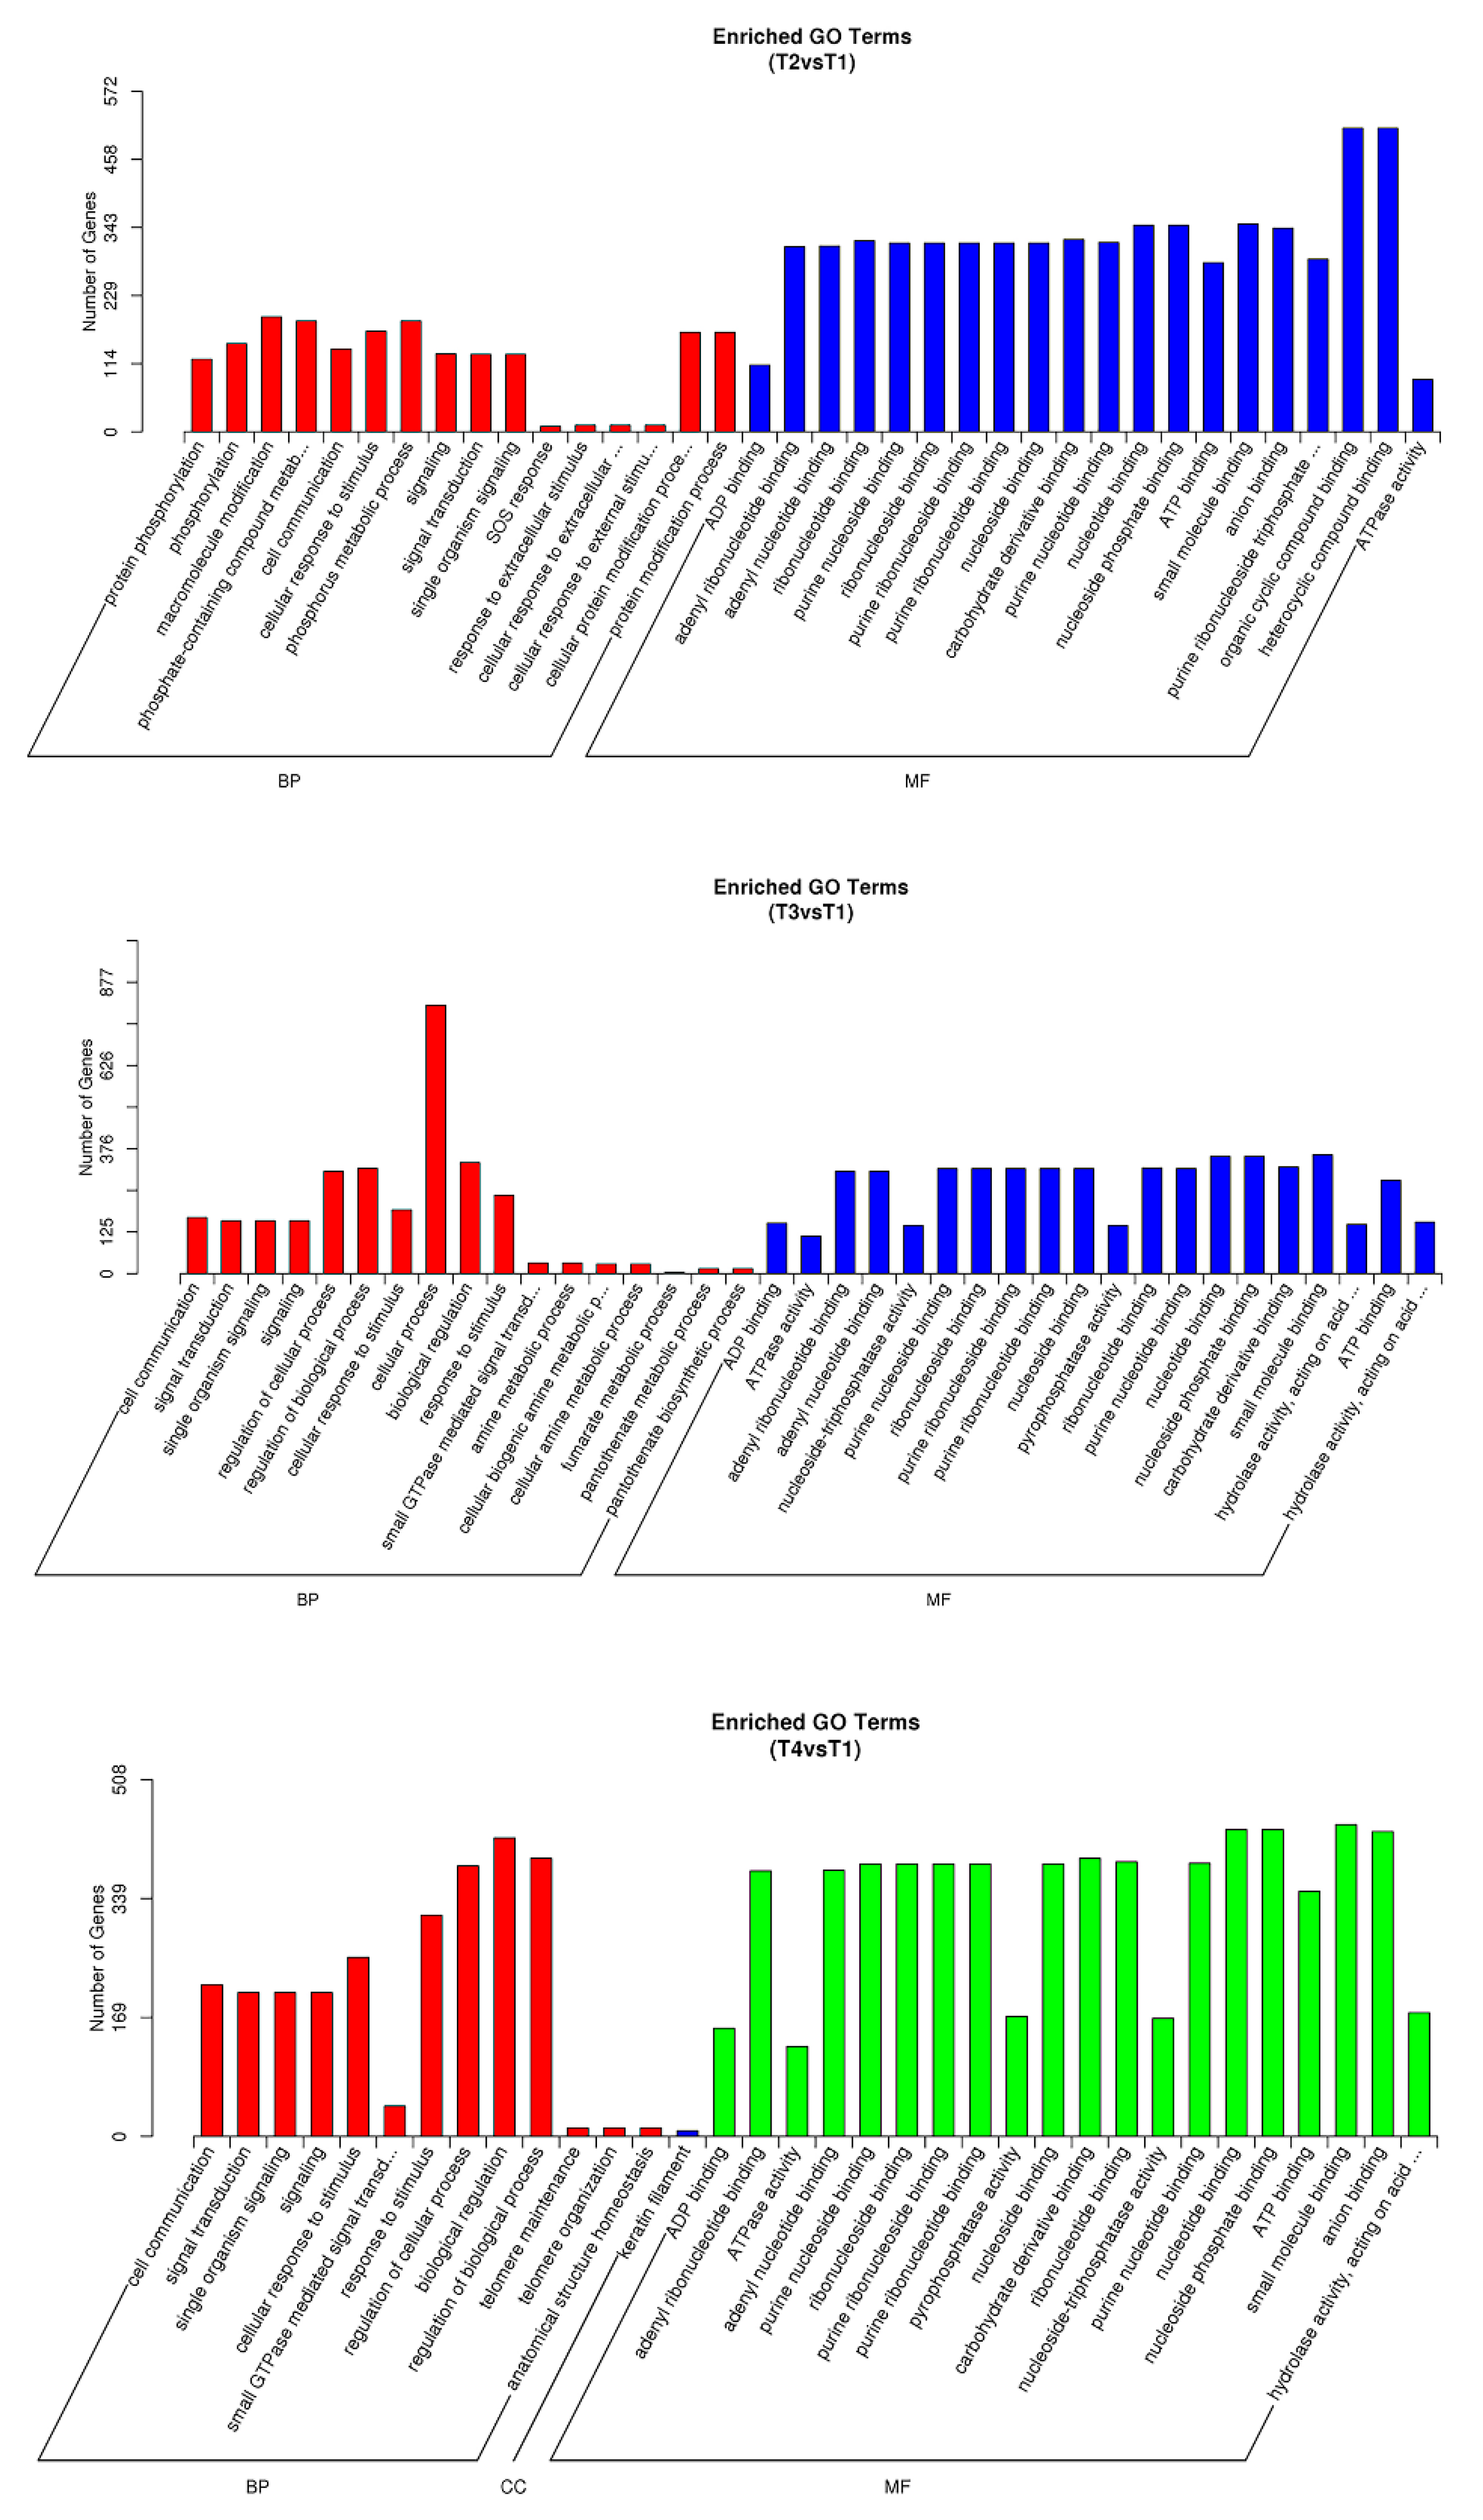
3.3. Target Prediction for Known and Novel miRNAs

A total of 8737 potential target genes were predicted from the transcripts of T. hybrid libraries (Files S1 and S2). A gene ontology enrichment analysis for each group of target genes is presented in Figure 2. Most target genes were enriched in a biological process, such as ADP binding, adenyl ribonucleotide binding, ATPase activity and others, while fewer genes were enriched in a molecular function and the fewest genes were enriched in cellular components, indicating the important roles of binding, catalytic, transporter activity and others in response to salt treatments. Subsequently, pairs of miRNAs and target genes with opposite expression patterns in such comparisons were chosen based on the analysis of transcriptome [8], such as the zinc finger CCCH domain-containing protein and glycosyltransferase family protein and others. Under short-term and low concentration of salt treatment (T1 vs. T2), related proteins such as polyprotein, TIR-NBS-LRR protein and others may be regulated by miRNAs, while when the treatment concentration increased (T1 vs. T3 and T2 vs. T3), some kinases and transcription factors, which may be regulated by miRNAs, became involved in response to high salinity. Compared with short-term treatment, prolonged salt treatment (T1 vs. T4 and T3 vs. T4) also stimulated a number of miRNAs related to protein kinase, transport and energy synthesis. Among them, a G-type lectin S-receptor-like serine/threonine-protein kinase (GsSRK) and a mitogen-activated protein kinase kinase kinase (MAPKKK) were discovered in both T1 vs. T3 and T1 vs. T4 comparisons. These can now be selected for future research (Table 3).

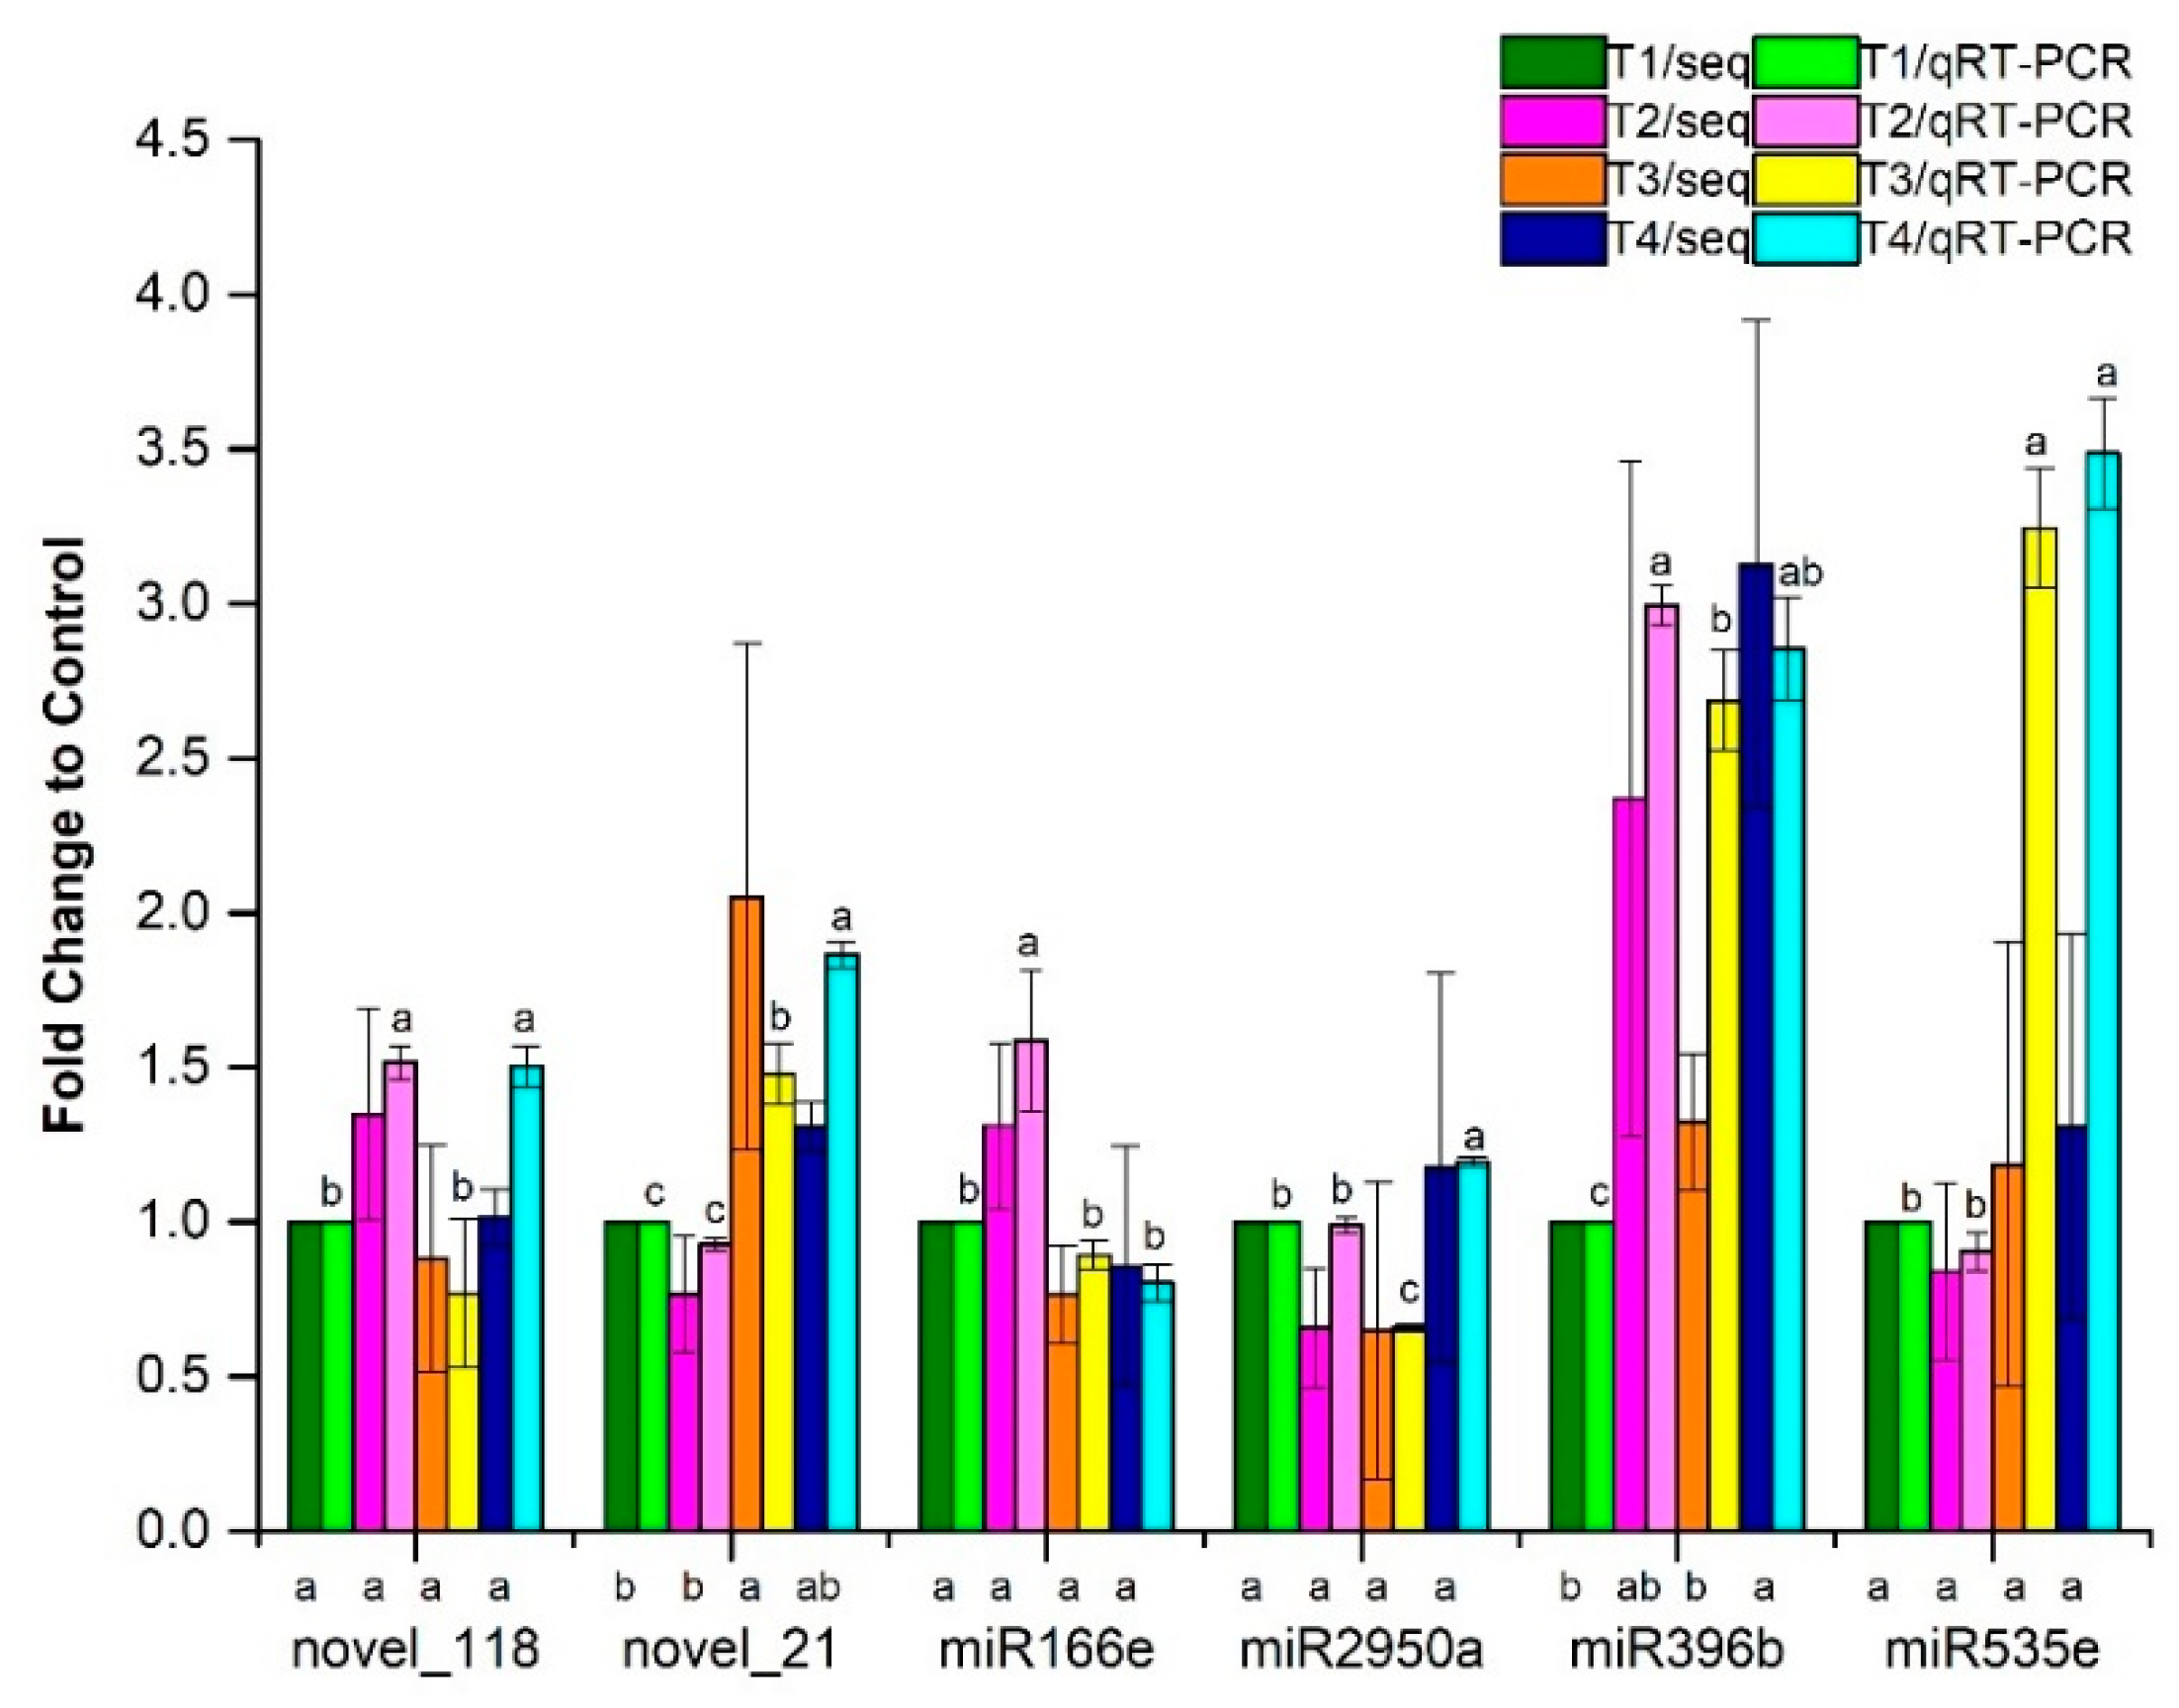
3.4. QRT-PCR Validation

We randomly chose six differentially expressed miRNAs and analyzed the relative changes in expression by qRT-PCR (Table S1). The expression data of the six miRNAs are presented in Figure 3 and File S3. The results showed that the expression patterns of most miRNAs tested with qRT-PCR were similar with the sequencing data (Figure 3). Additionally, it was proved again that differentially expressed miRNAs in this study responded differently to low and high concentration, short- and long-term salt treatments.

4. Discussion

miRNAs play an important role in the regulation of plant growth and development [10,11]. The sRNA transcriptome is complex and significantly different in different plant species and organs [22]. Changes in miRNA expression profiles in several plant species under salt-stress conditions have been reported [23,24,25]. In a previous study, RNA-Seq had been performed to analyze changes in the transcriptome of T. hybrid roots treated with NaCl in order to describe the genetic basis of salt tolerance [8]. Here, we have specifically monitored miRNAs’ expression in T. hybrid subjected to short- (1 h) and long-term (24 h) salt treatments.
A total of 49 known plant miRNAs and 98 candidate novel miRNAs were identified from sRNA-Seq libraries. Among them, a total of 52 miRNAs exhibited altered expression in response to salt stress. Most target genes were enriched in biological process, while fewer genes were enriched in molecular function and the fewest genes were enriched in cellular components. The majority of the predicted target genes of miRNAs with altered expression were protein-coding genes involved in protein phosphorylation, cellular response to stimuli, signal transduction, ADP binding, ATP binding, ribonucleoside binding and others, suggesting that T. hybrid may rapidly alter these functions under salt stress, which is consistent with previous reports [26,27,28]. For example, the putative target gene related with protein phosphorylation was reported to interact with the salt-inducible TaMIRs, suggesting that it could be involved in the mediation of salt response in wheat [26]. An miRNome analysis also showed that response to stimuli was the main GO feature of miRNA-targeted genes in the wheat-root response to salt stress [27]. GO-enrichment analysis showed that the main function of the target genes of salinity stress-responsive miRNAs in wild emmer wheat was the binding of molecules, such as ATP binding, ADP binding and others [28].
In our study, several miRNA and target genes showed opposite expression under salt stress; the results showed that kinases and transcription factors, which may be regulated by miRNAs, were mainly involved in response to high salinity. Additionally, prolonged salt treatment stimulated a number of miRNA related to transport and energy synthesis. GsSRK and MAPKKK were indicated as potential target genes of differentially mobilized miRNAs in both the T1 vs. T3 and the T1 vs. T4 comparisons. The GsSRK in soybean has been shown to be induced by salt stress and to improve plant tolerance to salt stress when heterologously expressed in Arabidopsis [29]. In this study, novel_77 and novel_2, which putatively target GsSRK, both showed different expression patterns under salt treatments. This is similar to that observed for miR535c and a target gene GsSRK, which were differentially expressed in response to high salinity in banana roots [30]. Mitogen-activated protein kinase (MAPK) cascades participate in salt-stress signaling responses in plants [31]. Upstream signals activate the MAPKKK, which eventually causes the activation of the specific MAP kinases and in turn phosphorylates various downstream targets and regulates the stress responses of organisms [32]. MAPKKK genes were induced by salt in Arabidopsis and negatively regulated salt tolerance [33,34]. In addition, 23 MAPKKK genes were predicted to be targeted by 11 miRNAs in barley [35]. One novel miRNA identified in this study, novel_41, potentially interacts with MAPKKK, and this interaction may play an important role in the T. hybrid response to high salinity environments. These results indicated that GsSRK and MAPKKK may be regulated by miRNA in response to and participate in improving salt tolerance in T. hybrids. The specific regulatory mechanisms and functions need to be further studied and verified.

5. Conclusions

In conclusion, the discovery of microRNAs responding to salt stress provide an extensive perspective about salt tolerance in T. hybrid ‘zhongshanshan405’. Sequencing and qRT-PCR validation indicated that some miRNAs exhibited distinct expression patterns under different salt treatments. The prediction and annotation of miRNA-mediated target genes provided favorable information for future gene function studies, which will provide new information about factors that regulate salt tolerance in T. hybrid ‘Zhongshanshan405’. Taken together, our study provides valuable information for further identification of the function of miRNAs related to salt tolerance.

Supplementary Materials

The following supporting information can be downloaded at: https://www.mdpi.com/article/10.3390/f13101685/s1, Table S1: The list of miRNA primers used for qRT-PCR; Table S2: The number of differentially expressed miRNAs; File S1: annotate; File S2: sequences; File S3: data.

Author Contributions

Conceptualization, C.Y. and Z.W.; investigation, Z.W., F.Z., Q.S. and R.Z.; resources, Y.Y. and C.Y.; writing—original draft preparation, Z.W.; writing—review and editing, Z.W., F.Z., Y.Y. and C.Y. All authors have read and agreed to the published version of the manuscript.

Funding

This research was funded by the Natural Science Foundation of Jiangsu Province (BK20200291) and Jiangsu Long-Term Scientific Research Base for Taxodium Rich. Breeding and Cultivation [LYKJ(2021)05].

Data Availability Statement

Raw data are available at NCBI’s SRA with accession number PRJNA864881.

Conflicts of Interest

The authors declare no conflict of interest.

References

  1. Paul, D.; Lade, H. Plant-growth-promoting rhizobacteria to improve crop growth in saline soils: A review. Agron. Sustain. Dev. 2014, 34, 737–752. [Google Scholar] [CrossRef]
  2. Akula, R.; Ravishankar, G.A. Influence of abiotic stress signals on secondary metabolites in plants. Plant Signal. Behav. 2011, 6, 1720–1731. [Google Scholar] [CrossRef] [PubMed]
  3. Zhou, L.; Creech, D.L.; Krauss, K.W.; Yunlong, Y.; Kulhavy, D.L. Can we improve the salinity tolerance of genotypes of taxodium by using varietal and hybrid crosses? HortScience 2010, 45, 1773–1778. [Google Scholar] [CrossRef] [Green Version]
  4. Creech, D.; Zhou, L.; Yunlong, Y.; Eguiluz-Piedra, T. Can Taxodium be improved. Arnoldia 2011, 69, 11–20. [Google Scholar]
  5. Qi, B.; Yang, Y.; Yin, Y.; Xu, M.; Li, H. De novo sequencing, assembly, and analysis of the Taxodium ‘Zhongshansa’ roots and shoots transcriptome in response to short-term waterlogging. BMC Plant Biol. 2014, 14, 1–12. [Google Scholar] [CrossRef] [PubMed] [Green Version]
  6. Wang, Z.; Gu, C.; Xuan, L.; Hua, J.; Shi, Q.; Fan, W.; Yin, Y.; Yu, F. Identification of suitable reference genes in Taxodium ‘Zhongshanshan’under abiotic stresses. Trees 2017, 31, 1519–1530. [Google Scholar] [CrossRef]
  7. Xuan, L.; Hua, J.; Zhang, F.; Wang, Z.; Pei, X.; Yang, Y.; Yin, Y.; Creech, D.L. Identification and functional analysis of Thadh1 and Thadh4 genes involved in tolerance to waterlogging stress in Taxodium hybrid ‘Zhongshanshan 406’. Genes 2021, 12, 225. [Google Scholar] [CrossRef]
  8. Yu, C.; Xu, S.; Yin, Y. Transcriptome analysis of the Taxodium ‘Zhongshanshan 405’ roots in response to salinity stress. Plant Physiol. Biochem. 2016, 100, 156–165. [Google Scholar] [CrossRef]
  9. Pattanayak, D.; Solanke, A.U.; Kumar, P.A. Plant RNA interference pathways: Diversity in function, similarity in action. Plant Mol. Biol. Report. 2013, 31, 493–506. [Google Scholar] [CrossRef]
  10. Sunkar, R.; Li, Y.-F.; Jagadeeswaran, G. Functions of microRNAs in plant stress responses. Trends Plant Sci. 2012, 17, 196–203. [Google Scholar] [CrossRef]
  11. Saini, A.; Li, Y.; Jagadeeswaran, G.; Sunkar, R. Role of microRNAs in plant adaptation to environmental stresses. In Micrornas in Plant Development and Stress Responses; Springer: Berlin/Heidelberg, Germany, 2012; pp. 219–232. [Google Scholar]
  12. Gupta, O.P.; Sharma, P. Potential role of small RNAs during stress in plants. In Molecular Approaches in Plant Abiotic Stress; CRC Press: Boca Raton, FL, USA, 2013; pp. 67–89. [Google Scholar]
  13. Alzahrani, S.M.; Alaraidh, I.A.; Khan, M.A.; Migdadi, H.M.; Alghamdi, S.S.; Alsahli, A.A. Identification and characterization of salt-responsive microRNAs in Vicia faba by high-throughput sequencing. Genes 2019, 10, 303. [Google Scholar] [CrossRef] [PubMed]
  14. Ding, D.; Zhang, L.; Wang, H.; Liu, Z.; Zhang, Z.; Zheng, Y. Differential expression of miRNAs in response to salt stress in maize roots. Ann. Bot. 2009, 103, 29–38. [Google Scholar] [CrossRef] [PubMed] [Green Version]
  15. Shriram, V.; Kumar, V.; Devarumath, R.M.; Khare, T.S.; Wani, S.H. MicroRNAs as potential targets for abiotic stress tolerance in plants. Front. Plant Sci. 2016, 7, 817. [Google Scholar] [CrossRef] [Green Version]
  16. Sun, X.; Xu, L.; Wang, Y.; Yu, R.; Zhu, X.; Luo, X.; Gong, Y.; Wang, R.; Limera, C.; Zhang, K. Identification of novel and salt-responsive miRNAs to explore miRNA-mediated regulatory network of salt stress response in radish (Raphanus sativus L.). BMC Genom. 2015, 16, 1–16. [Google Scholar] [CrossRef] [Green Version]
  17. Friedländer, M.R.; Mackowiak, S.D.; Li, N.; Chen, W.; Rajewsky, N. Mirdeep2 accurately identifies known and hundreds of novel microRNA genes in seven animal clades. Nucleic Acids Res. 2012, 40, 37–52. [Google Scholar] [CrossRef] [PubMed] [Green Version]
  18. Wen, M.; Shen, Y.; Shi, S.; Tang, T. Mirevo: An integrative microRNA evolutionary analysis platform for next-generation sequencing experiments. BMC Bioinform. 2012, 13, 1–10. [Google Scholar] [CrossRef] [Green Version]
  19. Wu, H.-J.; Ma, Y.-K.; Chen, T.; Wang, M.; Wang, X.-J. Psrobot: A web-based plant small RNA meta-analysis toolbox. Nucleic Acids Res. 2012, 40, W22–W28. [Google Scholar] [CrossRef]
  20. Young, M.D.; Wakefield, M.J.; Smyth, G.K.; Oshlack, A. Gene ontology analysis for RNA-seq: Accounting for selection bias. Genome Biol. 2010, 11, 1–12. [Google Scholar] [CrossRef] [Green Version]
  21. Schmittgen, T.D.; Lee, E.J.; Jiang, J.; Anasuya, S.; Yang, L.Q.; Elton, T.S.; Chen, C. Real-time PCR quantification of precursor and mature microRNA. Methods 2008, 44, 31–38. [Google Scholar] [CrossRef] [Green Version]
  22. Lu, Z.; Jiang, B.; Zhao, B.; Mao, X.; Lu, J.; Jin, B.; Wang, L. Liquid profiling in plants: Identification and analysis of extracellular metabolites and miRNAs in pollination drops of Ginkgo biloba. Tree Physiol. 2020, 40, 1420–1436. [Google Scholar] [CrossRef]
  23. Xie, F.; Stewart Jr, C.N.; Taki, F.A.; He, Q.; Liu, H.; Zhang, B. High-throughput deep sequencing shows that micro RNA s play important roles in switchgrass responses to drought and salinity stress. Plant Biotechnol. J. 2014, 12, 354–366. [Google Scholar] [CrossRef] [PubMed]
  24. Yin, Z.; Han, X.; Li, Y.; Wang, J.; Wang, D.; Wang, S.; Fu, X.; Ye, W. Comparative analysis of cotton small RNAs and their target genes in response to salt stress. Genes 2017, 8, 369. [Google Scholar] [CrossRef] [PubMed] [Green Version]
  25. Kumar, V.; Khare, T.; Shriram, V.; Wani, S.H. Plant small RNAs: The essential epigenetic regulators of gene expression for salt-stress responses and tolerance. Plant Cell Rep. 2018, 37, 61–75. [Google Scholar] [CrossRef]
  26. Lu, W.; Li, J.; Liu, F.; Gu, J.; Guo, C.; Xu, L.; Zhang, H.; Xiao, K. Expression pattern of wheat miRNAs under salinity stress and prediction of salt-inducible miRNAs targets. Front. Agric. China 2011, 5, 413–422. [Google Scholar] [CrossRef]
  27. Eren, H.; Pekmezci, M.; Okay, S.; Turktas, M.; Inal, B.; Ilhan, E.; Atak, M.; Erayman, M.; Unver, T. Hexaploid wheat (Triticum aestivum) root mirnome analysis in response to salt stress. Ann. Appl. Biol. 2015, 167, 208–216. [Google Scholar] [CrossRef]
  28. Feng, K.; Nie, X.; Cui, L.; Deng, P.; Wang, M.; Song, W. Genome-wide identification and characterization of salinity stress-responsive miRNAs in wild emmer wheat (Triticum turgidum ssp. Dicoccoides). Genes 2017, 8, 156. [Google Scholar] [CrossRef] [Green Version]
  29. Sun, X.-L.; Yu, Q.-Y.; Tang, L.-L.; Ji, W.; Bai, X.; Cai, H.; Liu, X.-F.; Ding, X.-D.; Zhu, Y.-M. GsSRK, a g-type lectin s-receptor-like serine/threonine protein kinase, is a positive regulator of plant tolerance to salt stress. J. Plant Physiol. 2013, 170, 505–515. [Google Scholar] [CrossRef]
  30. Lee, W.S.; Gudimella, R.; Wong, G.R.; Tammi, M.T.; Khalid, N.; Harikrishna, J.A. Transcripts and microRNAs responding to salt stress in Musa acuminata colla (aaa group) cv. Berangan roots. PLoS ONE 2015, 10, e0127526. [Google Scholar] [CrossRef]
  31. Yang, Y.; Guo, Y. Unraveling salt stress signaling in plants. J. Integr. Plant Biol. 2018, 60, 796–804. [Google Scholar] [CrossRef] [Green Version]
  32. Parihar, P.; Singh, S.; Singh, R.; Singh, V.P.; Prasad, S.M. Effect of salinity stress on plants and its tolerance strategies: A review. Environ. Sci. Pollut. Res. 2015, 22, 4056–4075. [Google Scholar] [CrossRef]
  33. Gao, L.; Xiang, C.-B. The genetic locus at1g73660 encodes a putative MAPKKK and negatively regulates salt tolerance in Arabidopsis. Plant Mol. Biol. 2008, 67, 125–134. [Google Scholar] [CrossRef] [PubMed]
  34. Wu, J.; Wang, J.; Pan, C.; Guan, X.; Wang, Y.; Liu, S.; He, Y.; Chen, J.; Chen, L.; Lu, G. Genome-wide identification of MAPKK and MAPKKK gene families in tomato and transcriptional profiling analysis during development and stress response. PLoS ONE 2014, 9, e103032. [Google Scholar] [CrossRef] [PubMed]
  35. Cui, L.; Yang, G.; Yan, J.; Pan, Y.; Nie, X. Genome-wide identification, expression profiles and regulatory network of MAPK cascade gene family in barley. BMC Genom. 2019, 20, 1–20. [Google Scholar] [CrossRef] [PubMed]
Figure 1. Expression analysis of miRNAs. (A) Cluster analysis of relative differential expression of 52 miRNAs. The bar represents the scale of the expression abundance for each miRNA (log10(TPM + 1)), where, relative to control levels, red represents miRNA with high expression and blue represents miRNA with low expression; T1-1-T1-3 indicated three biological replicates of T1 sample (control), T2-1-T2-3 indicated three biological replicates of T2 sample (100 mM NaCl, 1 h), T3-1-T3-3 indicated three biological replicates of T3 sample (200 mM NaCl, 1 h), T4-1-T4-3 indicated three biological replicates of T4 sample (200 mM NaCl, 24 h). (B) Differentially expressed miRNAs among different salt treatments presented by VENN analysis.
Forests 13 01685 g001
Figure 2. Gene ontology (GO) classifications of putative targets of differentially expressed miRNAs in T. hybrid subjected to salt stress in T2 vs. T1, T3 vs. T1 and T4 vs. T1, respectively. BP—biological process; MF—molecular function; CC—cellular component.
Forests 13 01685 g002
Figure 3. Validation of six miRNAs by qRT-PCR. T1-T4/seq indicated relative expression level of miRNAs calculated based on TPM and the significance was indicated below the bar chart, T1-T4/seq indicated relative expression level of miRNAs calculated based on 2−∆∆Ct, and different lowercase letters indicating statistically significant difference were indicated above the bar chart.
Forests 13 01685 g003
Table 1. Summary of filtered data produced by small RNA sequencing.
SampleTotal ReadsN% > 10%Low Quality5 Adapter Contamine3 Adapter Null or Insert Nullwith ployA/T/G/CClean Reads
T1-113,212,250 (100.00%)34 (0.00%)10,535 (0.08%)10,746 (0.08%)419,301 (3.17%)11,549 (0.09%)12,760,085 (96.58%)
T1-214,554,682 (100.00%)34 (0.00%)10,988 (0.08%)15,718 (0.11%)422,272 (2.90%)16,198 (0.11%)14,089,472 (96.80%)
T1-311,047,511 (100.00%)33 (0.00%)6373 (0.06%)13,511 (0.12%)371,044 (3.36%)11,949 (0.11%)10,644,601 (96.35%)
T2-110,616,411 (100.00%)21 (0.00%)4386 (0.04%)17,123 (0.16%)269,497 (2.54%)19,629 (0.18%)10,305,755 (97.07%)
T2-214,511,597 (100.00%)33 (0.00%)7570 (0.05%)20,556 (0.14%)450,817 (3.11%)20,197 (0.14%)14,012,424 (96.56%)
T2-313,778,931 (100.00%)32 (0.00%)7794 (0.06%)17,722 (0.13%)784,585 (5.69%)30,837 (0.22%)12,937,961 (93.90%)
T3-112,036,280 (100.00%)28 (0.00%)7326 (0.06%)8488 (0.07%)369,020 (3.07%)18,987 (0.16%)11,632,431 (96.64%)
T3-210,291,894 (100.00%)10 (0.00%)4139 (0.04%)11,050 (0.11%)455,849 (4.43%)12,135 (0.12%)9,808,711 (95.31%)
T3-311,345,585 (100.00%)26 (0.00%)4628 (0.04%)6330 (0.06%)348,991 (3.08%)7011 (0.06%)10,978,599 (96.77%)
T4-111,909,066 (100.00%)36 (0.00%)5711 (0.05%)8714 (0.07%)407,633 (3.42%)10,874 (0.09%)11,476,098 (96.36%)
T4-212,833,399 (100.00%)32 (0.00%)6067 (0.05%)15,353 (0.12%)519,695 (4.05%)8185 (0.06%)12,284,067 (95.72%)
T4-312,115,728 (100.00%)35 (0.00%)8663 (0.07%)9867 (0.08%)474,255 (3.91%)14,847 (0.12%)11,608,061 (95.81%)
Table 2. Quantity of the known miRNAs and predicted novel miRNAs in T. hybrid.
TypesTotalT1-1T1-2T1-3T2-1T2-2T2-3T3-1T3-2T3-3T4-1T4-2T4-3
Mapped known miRNAsMature49364339313029402629193126
Hairpin55384844343432433133223628
Mapped novel miRNAsMature98888883777472806277577370
Hairpin100929388848079856783668176
Star68444240372530391740163218
Notes: Mature referred to the miRNA mature body on the alignment; Hairpin referred to the miRNA precursor on the alignment; Star referred to the number of miRNA reads matched to the 3.3. Differentially Expressed miRNAs between Salt-Treated Samples and Control
Table 3. Identified pairs of miRNAs and target genes with opposite expression patterns under salt treatment.
miRNATargetExpectationTarget AccessibilityTarget DescriptionInhibitionMultiplicity
T1 vs. T2novel_118CL16860Contig14.518.248Putative polyproteinCleavage1
novel_13CL15Contig44.520.381Probable disease resistance proteinTranslation1
novel_16T3_Unigene_BMK.33047418.583Putative truncated TIR-NBS-LRR proteinTranslation1
novel_52CL10744Contig14.510.073Zinc finger CCCH domain-containing protein 35Translation1
novel_78CL25843Contig14.512.165Probable nucleoredoxin 1Translation1
miR160aCL8543Contig145.964Chaperone protein dnaJ 11Translation1
miR396bCL5428Contig13.522.527Glycosyltransferase family protein 2Cleavage1
T1 vs. T3novel_123CL27539Contig14.513.132RNA-binding protein 25Cleavage1
novel_21CL18504Contig1424.442TMV resistance protein NTranslation1
novel_41CL2111Contig1512.456Mitogen-activated protein kinase kinase kinaseCleavage1
novel_4CL1685Contig14.512.818Ethylene-responsive transcription factor RAP2-13Cleavage1
novel_77T2_Unigene_BMK.143864.516.719G-type lectin S-receptor-like serine/threonine-protein kinaseCleavage1
miR156aCL14355Contig1418.821RNA and export factor-binding protein 2Cleavage1
miR319aCL11314Contig1417.74Beta-amylase 1 isoform 1Cleavage1
T1 vs. T4novel_100CL24684Contig14.517.879ATP synthase subunitCleavage1
novel_13CL4989Contig1420.269Salicylate O-methyltransferaseCleavage1
novel_14CL1013Contig13.518.997Probable LRR receptor-like serine/threonine-protein kinaseCleavage1
novel_29CL11748Contig1218.906Glycerol-3-phosphate 2-O-acyltransferase 6Translation1
novel_2CL14285Contig1416.055G-type lectin S-receptor-like serine/threonine-protein kinaseTranslation1
novel_40CL1182Contig1518.447Disease resistance RPP13-like protein 4Translation1
novel_41CL2111Contig1512.456Mitogen-activated protein kinase kinase kinaseCleavage1
novel_42CL1146Contig12.513.999F-box/LRR-repeat protein 17Cleavage1
novel_77CL1110Contig2419.906Cysteine-rich receptor-like protein kinaseCleavage1
novel_98CL13461Contig1414.38Homeobox-leucine zipper protein ATHB-13Cleavage1
miR159aCL12428Contig1316.021Chlorophyll a-b binding protein 7Translation1
miR396a-5pCL10009Contig1520.004DNA replication licensing factor mcm5Cleavage1
miR396fCL2465Contig1418.647U-box domain-containing protein 12Cleavage1
miR399dCL1025Contig1520.819Tonoplast dicarboxylate transporterCleavage1
T2 vs. T3novel_100CL772Contig34.513.205Transcription factor MYB59Cleavage1
novel_108CL805Contig1414.766LRR receptor-like serine/threonine-protein kinaseTranslation1
novel_111CL1347Contig23.514.988Subtilisin-like proteaseCleavage1
novel_123CL14243Contig14.512.566Trehalose-phosphataseTranslation1
novel_16CL22Contig4521.524TMV resistance proteinTranslation1
novel_24CL228Contig12.520.215TMV resistance proteinCleavage1
novel_30CL14581Contig14.519.087Xyloglucan endotransglucosylase/hydrolaseTranslation1
novel_41CL23589Contig14.513.732Chaperone protein dnaJCleavage1
novel_52T3_Unigene_BMK.329944.523.774Protein LURP-one-relatedCleavage1
novel_77T2_Unigene_BMK.143864.516.719G-type lectin S-receptor-like serine/threonine-protein kinaseCleavage1
novel_78CL10767Contig1517.257BON1-associated proteinTranslation1
novel_88CL15264Contig1414.363Cysteine-rich receptor-like protein kinaseTranslation1
novel_89T3_Unigene_BMK.16696317.651Squamosa promoter-binding-like proteinCleavage1
pab-miR159aCL2378Contig1316.57Cinnamoyl CoA reductaseTranslation1
pab-miR319aCL26045Contig1417.17Disease resistance protein RPS2Cleavage1
T3 vs. T4novel_108CL1146Contig1413.459F-box/LRR-repeat protein 17Translation1
novel_13CL4989Contig1420.269Salicylate O-methyltransferaseCleavage1
novel_14CL1013Contig13.518.997Probable LRR receptor-like serine/threonine-protein kinaseCleavage1
miR156aCL24146Contig1315.592Probable LRR receptor-like serine/threonine-protein kinaseCleavage1
miR159aCL12428Contig1316.021Chlorophyll a-b binding protein 7Translation1
miR396a-5pCL10009Contig1520.004DNA replication licensing factor mcm5Cleavage1
miR396bCL2465Contig14.518.647U-box domain-containing protein 12Cleavage1
miR396fCL13812Contig14.516.915Potassium transporter 1Translation1
Publisher’s Note: MDPI stays neutral with regard to jurisdictional claims in published maps and institutional affiliations.

