Article

Effects of Biochar Application Pyrolyzed at Different Temperatures on Soil Properties, Growth and Leaf Secondary Metabolite Accumulation in Cyclocarya paliurus

1
College of Forestry, Nanjing Forestry University, Nanjing 210037, China
2
Co-Innovation Center for Sustainable Forestry in Southern China, Nanjing Forestry University, Nanjing 210037, China
*
Author to whom correspondence should be addressed.
Forests 2022, 13(10), 1572; https://doi.org/10.3390/f13101572
Submission received: 29 August 2022 / Revised: 20 September 2022 / Accepted: 22 September 2022 / Published: 26 September 2022

Abstract

:
Cyclocarya paliurus is a well-known multifunctional tree species and its leaves are in especially high demand for tea production and medical utilization in China. To meet the enormous requirements of its leaf production, lots of C. paliurus plantations have been established for harvesting the leaves, producing a large quantity of pruning residues during their management. In this study, biochar at different pyrolysis temperatures (300 °C, 500 °C and 700 °C) were prepared, utilizing the pruning residues, and the effects of biochar additions pyrolyzed at different temperatures on soil properties, growth and leaf secondary metabolite accumulation in C. paliurus were investigated. The results showed that the chemical properties and FT-IR spectra of wheel wingnut-based biochar were significantly influenced by the pyrolysis temperatures, and the application of biochars pyrolyzed at different temperatures significantly affected soil pH and nutrient availability, as well as the growth, nutrient uptake and secondary metabolite accumulation of C. paliurus seedlings (p < 0.05). Correlation analysis indicated that the total contents of polyphenols, flavonoids and triterpenoids in C. paliurus leaves were negatively correlated with the contents of total phosphorus (P) and total potassium (K) in the leaves, but positively correlated with the ratios of carbon (C)/nitrogen (N) and C/P. After 200 days of biochar treatment, the highest biomass production and leaf secondary metabolite accumulation in C. paliurus were obtained in the addition of biochar pyrolyzed at 500 °C. The findings from this pot experiment provide a potential application in C. paliurus plantations, though long-term field experiments are required to optimize the quantity of biochar addition, based on soil conditions and stand age at the planting sites.

1. Introduction

Biochar is a solid material generated by the carbonization of biomass [1]. Forestry and agriculture are the most important sources of biomass [2,3], because a huge of amount of biomass residues are produced annually as a by-product of commercial forestry and agriculture. Many previous studies have reported on the huge potential for organic residues to be converted into energy, biofuels, high-value chemicals, feed or soil amendments [4,5]; therefore, there has been increasingly more attention paid to biochar in recent years [6]. Biochar is not only characterized by excellent surface area, porosity and stability, but also by its alkalinity, high cation exchange capacity (CEC), and carbon content [6,7,8]. Thus, biochar is widely used in areas of agriculture, environment and energy [9,10,11]. Biochar can act as a soil amendment to improve soil physicochemical and biological properties to increase crop growth [12,13]. Moreover, biochar can also be directly transformed to carbon sinks in soil and reduce soil CO2 and N2O emissions through various mechanisms [14,15,16].
Pyrolysis temperature plays a key role in biomass thermochemical conversion in the process of biochar preparation [7]. Biochar at higher pyrolysis temperature has larger surface area, higher pH and porosity than biochar pyrolyzed at lower temperature, whereas the volatile matter and product yield show an opposite pattern [7,8]. Some studies have reported the applications of biochar pyrolyzed at different temperatures. For example, Vu et al. [17] pointed out that coffee husk biochar pyrolyzed at low temperature was able to replace expensive commercial absorbents for wastewater-derived ammonium, while Uchimiya et al. [18] reckoned biochar produced at a temperature of more than 400 °C possessed high surface area and micropores for contaminant sorption. It was noted that the optimum pyrolysis temperature is related to the biomass type and its application purpose. Yuan et al. [19] proposed that crop straw biochar pyrolyzed at 300 °C had greater capacity to improve soil acidity than that produced at 500 °C, whereas Hagner et al. [20] reported that the utilization of birch (Betula spp.) biochar pyrolyzed at an intermediate temperature (375 °C) obtained the highest ryegrass yield. Therefore, it is imperative to identify biochar properties derived from different biomass at various pyrolysis temperatures in order to select an appropriate biochar for clear-cut applications.
Wheel wingnut [Cyclocarya paliurus (Batal.) Iljinskaja] is classified as Juglandaceae, which is only distributed in China [21]. Ample evidence suggests that C. paliurus leaves are rich in bioactive substances, including polysaccharides, polyphenols, flavonoids, and triterpenoids [22,23,24]. Owing to the highly pharmaceutical and sanitarian values of C. paliurus leaves, the National Health and Family Planning Commission of China gave permission for C. paliurus leaves to be a new food raw material in 2013 [25], and quantities of C. paliurus leaves are required for tea production and medical use every year, resulting in the destruction of large areas of its natural forests. Thus, the best choice for solving this problem was to develop C. paliurus plantations for leaf production [26]. In practice, C. paliurus plantations are pruned every two years to obtain more leaf production as well as for convenient harvesting of leaves, and this produces a large amount of pruning residues. It is estimated that the residue quantity produced from the C. paliurus plantation at Dashishan Farm is approximately 1.5 t/ha every two years. Conventionally, local people picked up the pruning residues for fuelwood; however, as bottled gas and pipeline natural gas have become widely used in the countryside, fewer and fewer people have been willing to collect the pruning residue for fuelwood in recent years. If the residues are left unattended on the site, it might create disease and environmental problems. From the view of environmental protection and energy utilization, the best option is to apply the pruning residues to the soil as biochar for improving soil quality and C. paliurus growth, and to form an organic cycle within the plantations.
Most previous reports have focused on the effects of biochar on soil properties, plant nutrition and growth, while little attention has been paid to secondary metabolite accumulation and the relationship between soil and plant after biochar application. In this study, utilizing the pruning residues from C. paliurus plantations, biochars pyrolyzed at different temperatures were prepared. In the analysis of the prepared biochar properties, the effects of the biochar application on soil properties, growth and leaf secondary metabolite accumulation in C. paliurus were evaluated in a pot experiment. Results from this study provide a theoretical basis for biochar production from the pruning residues and future application in C. paliurus management.

2. Materials and Methods

2.1. Preparation and Characterization of Wheel Wingnut-Based Biochar

To produce high-quality wheel wingnut-based biochar, the pruning residues were collected from the C. paliurus plantation in Dashishan, Changzhou, China (31°24′ N, 119°26′ E) in December, 2020, and then sent to Zhongxin Lantian Environmental Protection Equipment Co., Ltd., Henan, China for biochar making. The detailed process was as follows. The pruning residues were chopped to 2–3 cm and dried in an oven, and, then, equably put into a high-temperature furnace. The dried residues were pyrolyzed at 300 °C, 500 °C and 700 °C (heating rate 10 °C·min−1, maintaining the temperature for 2 h) in a condition of hypoxia, and the biochar made at these three temperatures were named W300, W500, and W700, respectively. When the residue biomass pyrolysis was at the end, the biochar was dried and pulverized to a fine powder, which was sieved through 0.2 mm and used for further analysis (Figure S1). In the process of biochar preparation, the biochar yield of W300 was recorded by 30.30%, W500 was recorded by 25.80%, and W700 was recorded by 21.30%, respectively.
To determine the physical properties of the biochar, an ASAP2020 accelerated surface area and porosimetry system (ASAP2020, Micromeritics, Norcross, GA, USA) was used for the measurement of the specific surface area and pore volume by N2 adsorption isotherms at 77 K. Then, the (Brunauer-Emmett-Teller) BET surface area, total pore volume, t-plot micropore area, and t-plot micropore volume were obtained for the biochar pyrolyzed at various temperatures. The BET surface area and total pore volumes were calculated by the BET model, while the t-plot micropore area, and t-plot micropore volume were calculated by applying the Barrett-Joyner-Halenda (BJH) model [27].
In order to identify various kinds of functional groups in the biochar, Fourier-transform infrared spectroscopy (FT-IR) of the biochar was conducted and analyzed by a FT-IR spectrometer (Vertex 80v, Bruker, Germany) over 500–4500 cm−1 wavenumbers [7].

2.2. Plant Material and Experimental Design

The C. paliurus seeds were collected from Jinzhongshan, Guangxi, China (24°62′ N, 104°95′ E) in November 2018. The germinated seeds were sown into nonwoven containers after breaking the seed dormancy with reference to the method of Fang et al. [28]. After a year of growth, C. paliurus seedlings, with a similar size, were selected and transferred to a greenhouse in late March 2021, and then the stems were shortened to 8 cm height before conducting the pot experiment.
The pot experiment was carried out in a greenhouse located in the Xiashu forest farm of Nanjing Forestry University (31°59′ N, 119°14′ E) in March 2021. A single factor completely random block design was used to establish the experiment in three replicates with four treatments. The four treatments were control (CK, no biochar addition), and three biochar additions (named as W300, W500 and W700, respectively). For the treatments of the three biochar additions, the biochar was mixed with soil according to biochar: soil = 15%:85% (v/v) in the study.
The soil used in the pot experiment was a typical yellow-brown soil with the textural class of clay loam, and was air dried and passed through a 5-mm sieve to remove rock and plant material. It had a pH of 4.0, total carbon (total C) of 8.87 g·kg−1, total nitrogen (total N) of 0.73 g·kg−1, total phosphorus (total P) of 0.24 g·kg−1, and total potassium (total K) of 14.27 g·kg−1, respectively.
The pot size in the experiment was 15 cm (top diameter) × 10 cm (bottom diameter) × 14 cm (pot height). After the different biochar (W300, W500 and W700) and soil were fully mixed by hand, the pots were filled with the various mixtures in an equal amount. One seedling was planted in each pot, and twenty-four seedlings were included in each treatment with 8 seedlings per replicate. In total, ninety-six seedlings were used in the experiment. During the experimental period, all the seedlings were watered regularly to ensure their growth, while pesticide was also sprayed twice to protect the seedlings from pest damage.

2.3. Data Collection and Measurement

2.3.1. Growth and Biomass Measurement

In the pot experiment, the seedling height and ground diameter of C. paliurus were measured at 50, 100, 150 and 200 days after the treatments, whereas the biomass measurement was only done at 200 days. Based on the mean seedling height and ground diameter, one standard plant was selected in each replicate (e.g., 3 plants in each treatment were sampled) for the biomass determination. The sample plant in each replicate was completely dug, washed, and the whole plant separated into three parts (leaf, shoot, and root). The collected samples were dried in an oven at 70 °C for 72 h. Total biomass of the sampling seedling was obtained by summing the values for the three parts.

2.3.2. Nutrient Content Measurement

The soil in the pot was sampled at 0, 50, 100, 150, and 200 days. The soil was randomly collected twice by a soil sampler (height: 10 cm, inner diameter: 1.5 cm) from each pot, and mixed thoroughly to make a composite sample within the same replicate. The soil samples were taken to the laboratory in a freezing box and were divided into two parts. One part was stored in a refrigerator at a temperature of 4 °C with the aim of measuring the contents of ammonium nitrogen (NH4+-N), nitrate nitrogen (NO3-N), available phosphorus (available P), and available potassium (available K), while another part sample was air-dried with the aim of determining the pH value, and contents of total C, total N, total P, and total K. The leaf samples of the seedlings were also collected as the third expanded leaf from the top in each replicate, and sampled at 100, 150 and 200 days after the treatments to measure the leaf nutrient contents.
The pH values of biochar and soil were measured by a pH meter. The pH of biochar samples was determined using distilled water with a ratio of 1:20 (w/v) [29], while the values of soil samples were measured at 1:2.5 (w/v-soil/distilled water) [20].
The contents of total C and total N in biochar [7], soil [30] and leaves [27] were conducted by means of an elemental analyzer (Vario Macro Cube, Elementar, Germany). The contents of total P and total K in biochar and soil were extracted by nitric acid, perchloric acid and hydrofluoric acid digestion [31], but a 5:1 (v/v) solution of nitric acid: perchloric acid was used for the overnight digestion of total P and total K in C. paliurus leaves [32]. The total P content was quantified with the Mo-Sb colorimetric method (Specord 200 plus, Jena, Germany), whereas the total K content was measured with the flame photometry method (AA7000, Shimadzu, Japan) [33].
Inorganic nitrogen in the soil was extracted with 2.0 M potassium chloride. The contents of NH4+-N and NO3-N were measured by the indophenol blue colorimetric method [34]. The available P content was quantified by acid extraction then followed by Mo-Sb colorimetry [35]. Available K content was quantified by flame photometry after extraction with 1.0 M ammonium acetate solution (pH 7.0) [36].

2.3.3. Secondary Metabolite Measurement

The leaf samples were collected as the third expanded leaves, as mentioned above, and sampled at 100, 150 and 200 days after the treatment to measure the contents of secondary metabolites. The extracting of secondary metabolites in C. paliurus leaves was described by Cao et al. in [37]. Total polyphenol content was determined according to Xie et al. [38], and a standard gallic acid was used as a reference to calculated the concentration of polyphenols at 410 nm. Total flavonoid content was measured at 410 nm using rutin as a reference [39], whereas total triterpenoid content was determined by the method described by Fan et al. [40], using oleanolic acid as a reference and measuring at 550 nm. The secondary metabolite accumulation in the leaves per plant was calculated based on the corresponding concentrations of secondary metabolites and leaf biomass.

2.4. Statistical Analysis

Analysis of variance (ANOVA) was used to analyze the impact of pyrolyzed temperatures on properties of wheel wingnut-based biochar, and the impacts of different biochar applications on growth, soil properties and secondary metabolite accumulation, followed by Duncan’s test with p < 0.05. Relationships among different indices were evaluated by Pearson’s correlation analysis. All statistical analyses were conducted using SPSS 24.0 software (SPSS, Chicago, IL, USA). All values were presented as mean ± standard deviation (SD).

3. Results

3.1. Effects of Pyrolysis Temperature on Biochar Properties

The BET surface area, total pore volume, t-plot micropore area and t-plot volume of wheel wingnut-based biochar pyrolyzed at different temperatures are shown in Table 1. With increase of pyrolysis temperature, the indices all increased gradually. The minimum values were all found in W300, followed by W500, and maximum values were found in W700. Compared with W700, the BET surface area decreased by 96.27% in W300, and 64.27% in W500, respectively. Likewise, the total pore volume decreased by 95.28% in W300 and 64.89% in W500 in comparison with W700. However, the micropores in the biochar were only detected at the pyrolysis temperature of ≥500 °C, and a dramatic increase was found in the range 500 to 700 °C (Table 1).
Pyrolysis temperature had a significant influence on the biochar chemical properties (Table 2, p < 0.05). With increase in the biochar pyrolysis temperature, the biochar pH ranged from 6.71 (W300) to 9.51 (W700). W300, W500 and W700 could be summarized as alkaline biochar. Similar variation trends in the contents of total C, total P, and total K, as well as in C/N, were also observed. However, the highest content of total N and C/P ratio occurred in the biochar pyrolyzed at 300 °C (W300).
The FT-IR spectra of the biochar pyrolyzed at three temperatures are presented in Figure 1. It seems that the three types of biochar produced similar FT-IR graphs except for a slight change in peak intensity sharpness. A strong and broad peak was found between 3500–3200 cm−1 for all the biochar, but the absorption peaks decreased with increasing pyrolysis temperature, and the lowest value was observed in W700. The same variation pattern was observed at wavenumber of 1623 cm−1. However, the minimum transmittances at 1112 cm−1 and 617 cm−1 were recorded for W500. ANOVA results showed that there was a significant difference in absorption peaks among the three biochar at 2923 cm−1 and 1384 cm−1, but no significant difference was detected between W500 and W700.

3.2. Effects of Biochar Additions on the Soil Properties

3.2.1. Soil pH

Biochar additions obviously modified the soil pH values (Figure 2), showing a positive effect on soil pH. However, there existed a significant difference in the soil pH value among the biochar treatments (Figure 2, p < 0.05). In brief, the highest soil pH, during the experimental period, was obtained with the W700 treatment, followed by the treatments of W500, W300, and CK, in line with the biochar pH values (Table 2). Moreover, the difference in soil pH values became more significant among the treatments with increasing treatment time. In comparison with CK at 200 days after treatment, the soil pH increased by 12.77% due to W300, 18.06% due to W500, and 25.03% due to W700, respectively.

3.2.2. Total Nutrient Contents

Additions of biochar pyrolyzed at different temperatures significantly affected the total nutrient contents in the soil (Figure 3, p < 0.05). Overall, soil nutrients of total C, total P and total K increased with the biochar additions (Figure 3A,C,D).
The highest values of all total nutrient contents in the soil were found at the beginning of biochar addition, then the contents decreased at 100 or 150 days and, finally, slightly increased at 200 days. After 200 days of treatment, the total C contents in W300, W500 and W700 increased by 197.85%, 233.90%, and 264.80%, when compared with CK, while the contents of total P and total K were enhanced by 5.35%–17.11%, 14.73%–25.58% and 25.38%–30.56%, respectively. However, no significant difference in the total N content was found among the treatments at 200 days (Figure 3B).
Biochar additions also significantly impacted the C/N and C/P (Figure 3E,F, p < 0.05), and the values in CK were much lower than those in biochar treatments. The highest value of C/N occurred in W700 (31.48), followed by W500 (28.81), W300 (25.70), and CK (8.97) at 200 days of treatment. The C/P in W300 was significantly higher than other treatments at the start of the experiment; however, at the end of the experiment (after 200 days of treatment) the C/P was in the order of W700 (101.09%) > W500 (92.61%) > W300 (79.43%) > CK (34.79%).

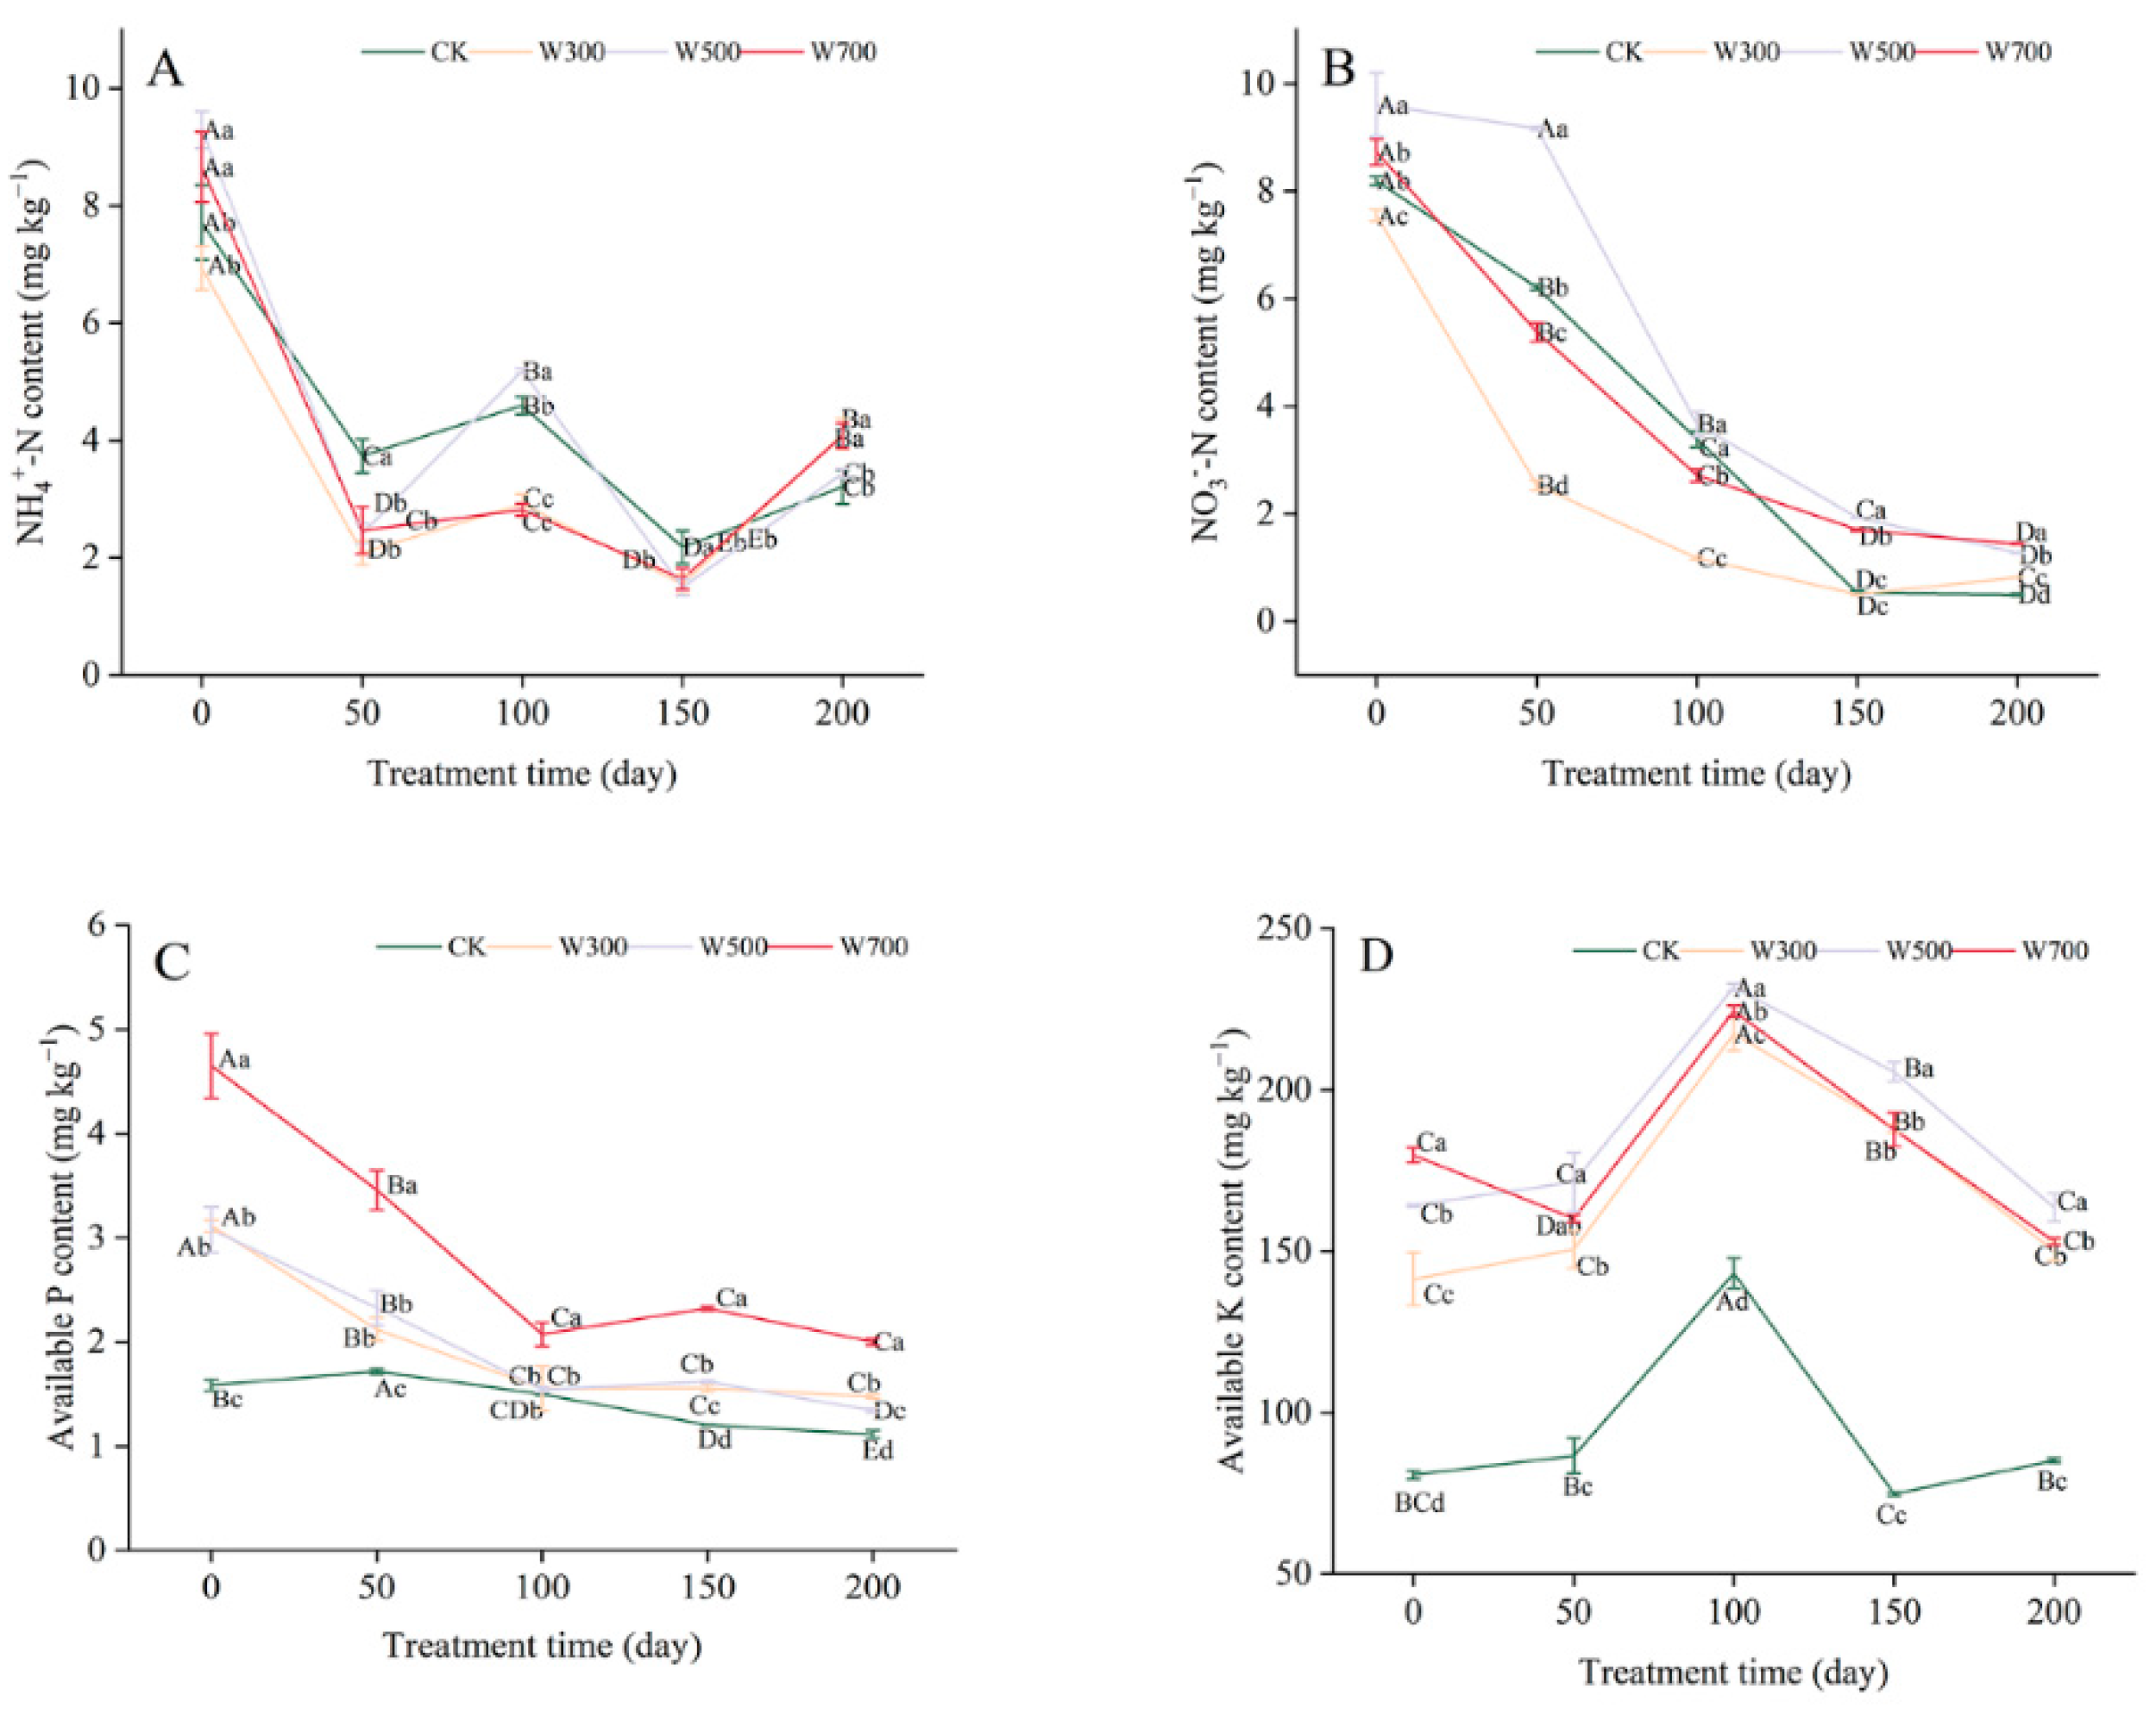
3.2.3. Available Nutrient Contents

Biochar additions significantly influenced the available nutrient contents in the soil (Figure 4, p < 0.05). In most cases, biochar addition increased the soil’s available nutrient contents, whereas the available nutrient contents measured showed a decreasing tendency with the extension of treatment time, except for the available K content in the soil (Figure 4D).
After 200 days of treatment, the soil’s available N content (NH4+-N + NO3-N) in W300, W500 and W700 increased by 28.13%–64.47%, 7.19%–157.56%, and 27.13%–190.09%, when compared with CK, while the available P contents were enhanced by 32.62%, 20.24% and 79.44%, respectively. Regarding the soil’s available K content, the highest value was observed in W500 at 200 days after treatment, which was 6.48%, 8.25% and 47.95% higher than in W700, W300 and CK, respectively.

3.3. Effects of Biochar Additions on Growth and Nutrient in C. paliurus

3.3.1. Growth and Biomass Production

The height, ground diameter and total biomass of C. paliurus seedlings were significantly affected by the biochar additions after 200 days of treatment (Table 3, p < 0.05), and the best performance in height growth and biomass accumulation was observed in the W500 treatment (Figure S2). It seems that W700 addition was not beneficial to the seedling growth, except for ground diameter growth (Table 3). Compared with W500 treatment, the leaf biomass production decreased by 12.07% in CK, 13.22% in W300 and 32.76% in W700, respectively, while a similar variation trend was also found in the total biomass (Table 3).

3.3.2. Leaf Nutrient Contents

The dynamics in nutrient contents of C. paliurus leaves are shown in Figure 5. Generally, biochar additions had a positive effect on the contents of total N, total P and total K in the leaves for all the sampling times, whereas the positive effect on total C content was only observed at 200 days after treatment. The highest contents of total C and total N were found in W500, while the lowest was observed in CK at 200 days (Figure 5A,B). However, the total P content in leaves showed a diverse pattern among the biochar addition treatments (Figure 5C), e.g., the total P content in the leaves was ranked as W300 > W500 > W700 at 100 and 150 days after treatment, while a completely reversed trend was found at 200 days after treatment. Moreover, no significant difference in the total K content was detected among the biochar addition treatments at 200 days after treatment, even if a significant difference was observed among the biochar addition treatments at 100 and 150 days after treatment (Figure 5D, p < 0.05).
There were significant differences in the ratios of C/N and C/P among the treatments (Figure 5E,F). During the experimental period, the C/N in CK was higher than those in the biochar addition treatments, and the lowest C/N was observed in W500 treatment at all sampling times. As presented in Figure 5F, the C/P for all treatments maintained an increased trend with the extension of treatment time. At 200 days after treatment, the greatest C/P in C. paliurus leaves was found in W300, reaching 687.95. Compared with CK, the C/P increased by 8.94% in W300 but had decreased by 16.03% in W500, and 28.42% in W700, respectively, by the end of the experiment (200 days).

3.4. Effects of Biochar Additions on Leaf Secondary Metabolite Accumulations

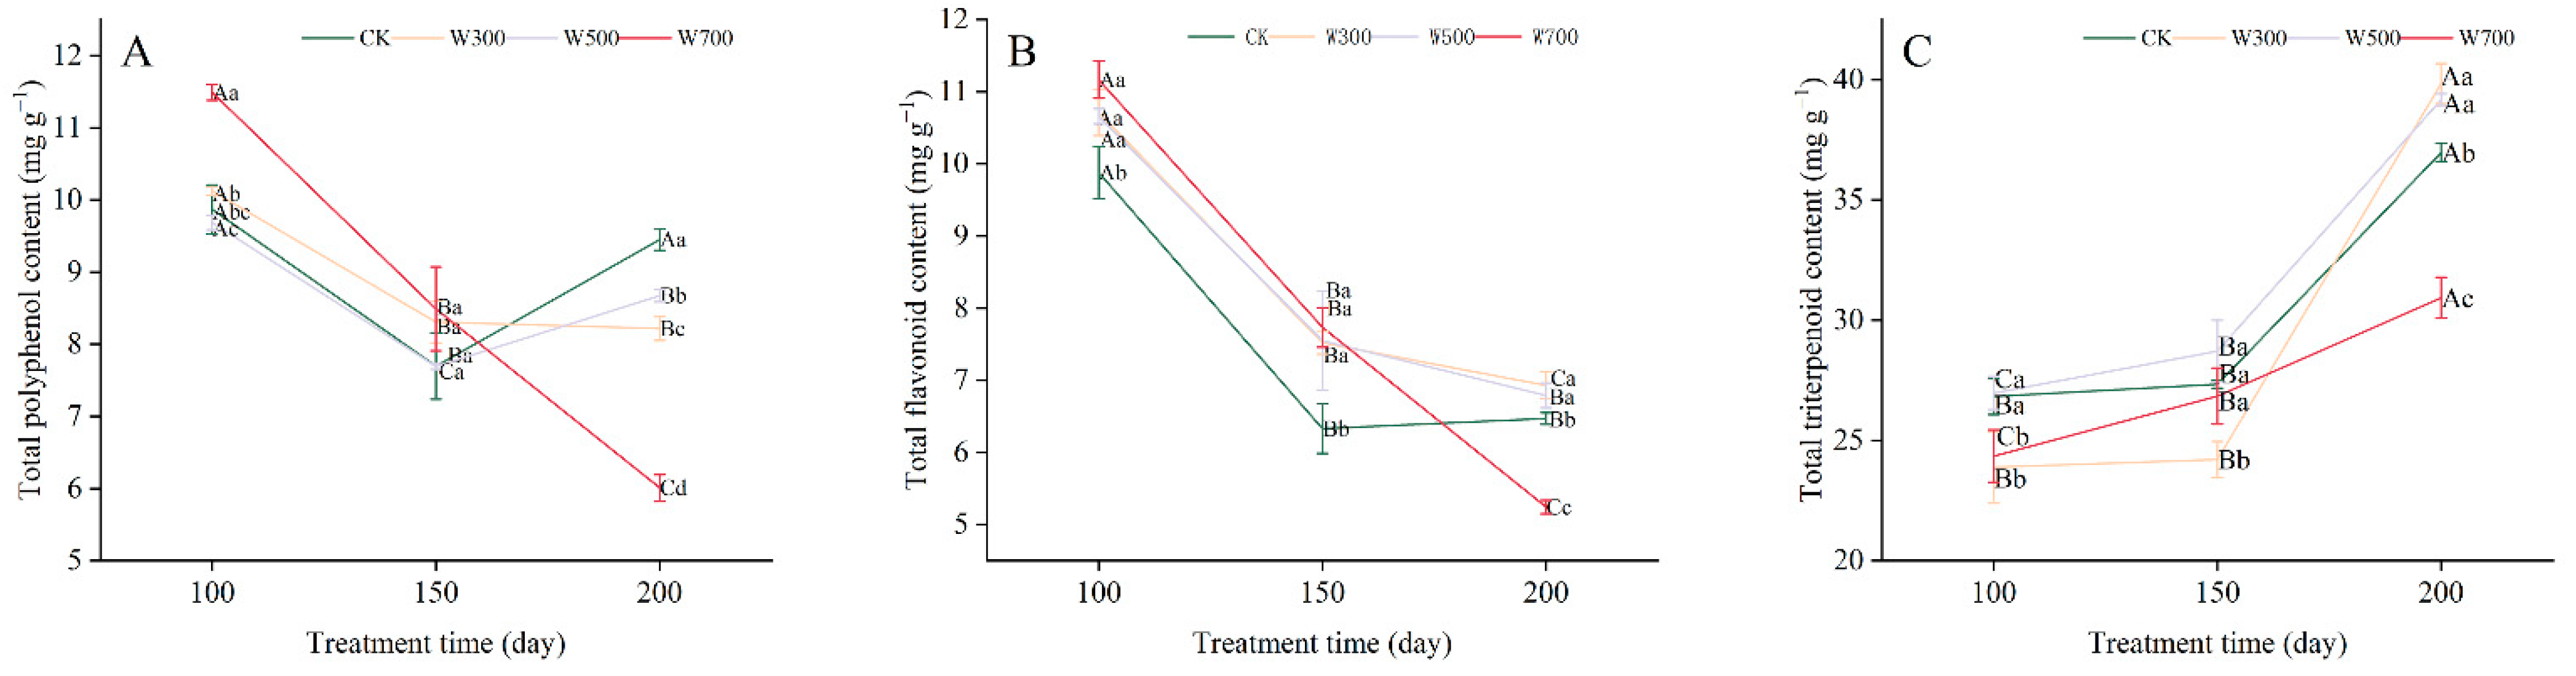
3.4.1. Secondary Metabolite Contents

Figure 6 shows the dynamics in secondary metabolite contents of C. paliurus leaves among different treatments. With the extension of treatment time, the leaf total flavonoid content in all treatments showed a decreasing trend, while an increasing tendency was observed in the total triterpenoid content (Figure 6B,C).
Additions of biochar pyrolyzed at different temperatures significantly affected the total contents of measured secondary metabolites in the leaves (Figure 6, p < 0.05). At the end of the experiment (200 days after treatment), the total polyphenol content in W300, W500 and W700 had decreased by 13.05%, 8.22%, and 36.40%, respectively, when compared with CK. However, the highest contents in total flavonoids and total triterpenoids appeared in the W300 addition (Figure 6B,C). Compared with the W300, the total flavonoid content in CK, W500 and W700 decreased by 6.64%, 2.02% and 24.34%, respectively, while the total triterpenoid content reduced by 7.20% in CK, 1.67% in W500, and 22.35% in W700.

3.4.2. Secondary Metabolite Accumulations

The secondary metabolite accumulations in the leaves were calculated by leaf biomass multiplied by their corresponding secondary metabolite content at the end of the experiment (200 days after treatment). As shown in Table 4, biochar additions had a significant effect on accumulations of polyphenols, flavonoids and triterpenoids in the leaves (p < 0.05). For all measured secondary metabolites, the highest accumulation was found in W500, while the lowest value was observed in W700. Compared with CK, the accumulation of total polyphenols, total flavonoids and total triterpenoids increased by 4.39%, 19.51% and 20.52% in the W500 addition, but decreased by 51.32%, 37.93%, and 36.0% in the treatment with W700 addition, respectively.

3.5. Correlation Analysis

Pearson correlation analysis showed that the total N content of C. paliurus leaves was significantly and positively corrected with the contents of total N, NH4+-N and NO3-N in the soil (Figure 7A, p < 0.05), while the leaf total K content was positively correlated with the soil’s available K content (p < 0.01). However, the total P content in C. paliurus leaves had no significant correlation with the contents of available P and total P in the soil (Figure 7A, p > 0.05).
Pearson correlation analysis also indicated that the total polyphenol content in C. paliurus leaves was significantly and negatively correlated with the contents of total P (p < 0.01) and total K in the leaves (Figure 7B, p < 0.05), but positively correlated with the ratios of C/N and C/P (p < 0.05). Similarly, the contents of total flavonoids and total triterpenoids in C. paliurus leaves were significantly negatively correlated with leaf total P (p < 0.01), but positively correlated to C/P (p < 0.01).

4. Discussion

4.1. Effects of Pyrolysis Temperatures on Biochar Properties

The physicochemical properties of biochar are greatly influenced by pyrolysis conditions, especially pyrolysis temperature [41,42]. In the experiment, the BET surface area, total pore volume, t-plot micropore area and t-plot micropore volume all increased by enhancing pyrolysis temperature, in line with previous studies from other biomass residues, such as maize stalk, Lantana camara, pine needle, black gram, rice straw and canola stalk [7,43]. The possible reason is the substances, such as volatiles, tars, and other products, were decomposed into volatile gases at high temperature conditions [7], and large BET surface areas and higher total pore volumes formed in the biochar. Meanwhile, the present study showed that micropores were only observed in wheel wingnut-based biochar pyrolyzed at the temperatures of 500 and 700 °C (W500 and W700), rather than at a temperature of 300 °C (Table 1), demonstrating that a relatively high temperature is required to form micropores in the biochar. The result further confirmed that hemicellulose and other organic substances rupture when the pyrolysis temperature increases from 400 to 600 °C, resulting in the formation of large pores (micro) within the biochar [7].
It is widely accepted that biochar is an alkaline material, as abundant inorganic minerals and ashes were generated as by-products in the process of pyrolysis [6,44], and the decomposition of acidic functional groups happened synchronously [19]. As expected, the highest element content in biochar was carbon (more than 68%) and the total C content of biochar increased with increasing pyrolysis temperature (Table 1), which might be subject to prolonged thermal contact and stable aromatic hydrocarbons formation resulting in thermochemical carbon-hydrogen and carbon-carbon fracture [7]. The results also showed that the total contents of K and P in the biochar increased by enhancing pyrolysis temperature, in accordance with the results from Zhao et al. [45] and Figueiredo et al. [46]. However, our results found the total N content decreased as pyrolysis temperature increased. This may mainly be attributed to emission of different nitrogen groups. For instance, Bagreev et al. [47] reported that total N would decline as the form of NH4+-N or NO3-N at low temperature and as pyridine at high temperature (>600 °C).

4.2. Effects of Biochar Addition on Soil Property

As an emerging soil amendment, biochar application enables improvement in soil properties. Xi et al. [29] reported that the application of rice straw biochar increased the pH by 0.1–0.28 units through a pot experiment. The present pot experiment also showed that addition of wheel wingnut-based biochar enhanced the pH by 12.8%–25.0%, compared with CK (Figure 2), depending on the pyrolysis temperature. As reported, a significant decrease in soil pH has occurred in southern China over the past 20 years [48]; thus, biochar is regarded as a promising soil amendment to alleviate the pH of acid soil.
Many studies have shown that biochar application improves soil total nutrient contents [49,50]. This study indicated that biochar additions were beneficial to soil nutrients of total C, total P and total K (Figure 3), and increased the soil’s available nutrient contents (Figure 4). For example, W500 addition was conducive to increasing the contents of soil NH4+-N and available K, while W700 addition was in favor of enhancing available P content. Wu et al. [51] reported that the C/N ratio of around 25 was optimal for soil microorganisms to decompose organic matter. In this study, the C/N ratios ranged from 25.7 to 28.81 in the soil with W300 and W500 additions at 200 days after treatment, which is in favor of nutrient mineralization, but the C/N reached 31.5 in the soil with W700 addition (Figure 3). A high level of NH4+-N content in the W700 treatment may be explained by the high CEC [52] and better aeration conditions [53] in the biochar pyrolyzed at high temperatures. Moreover, biochar additions also showed a capacity to significantly increase the soil’s available K content (Figure 4D), which might be due to increase in the activity of potassium-dissolving bacteria [54].
It is known that soil mineralization and nitrification occur in a suitable soil pH, and soil pH is an important factor to influence soil N cycling [55]. During the experimental period, the available nutrient contents in the soil (except for available K) decreased over time in the present study (Figure 4), which may be subject to continuous increase of soil pH and available nutrient absorption by C. paliurus seedlings.

4.3. Effects of Biochar Addition on Plant Growth and Secondary Metabolite Accumulation

Biochar addition can not only improve soil physicochemical properties and nutrient availability [56], but also promote plant chlorophyll synthesis, increase the accumulation of photosynthetic products, and thereby promote plant growth [57]. In recent years, many scholars have explored the effect of biochar at different pyrolysis temperatures on plant growth but less on secondary metabolite accumulation in plants. For instance, Naeem et al. [58] indicated that the addition of wheat straw biochar pyrolyzed at 300 °C could gain a higher biomass of maize than the addition of biochar pyrolyzed at 400 °C and 500 °C. However, our result found that W500 addition was more beneficial to the biomass accumulation of C. paliurus seedlings (Table 3), whereas a negative effect was detected in the W700 treatment. The possible reason was that a high soil C/N in the W700 addition might have reduced the ability of soil microbials to decompose organic matter, and might even have competed for nitrogen with the plants [51].
Some foregoing studies have shown that biochar has the capacity to improve plant secondary metabolites. Saha et al. [59] reported that biochar application increased the contents of total phenolics and flavonoids in Andrographis paniculate in a pot experiment, while Petruccelli et al. [60] reported that biochar application promoted the total phenol and flavonoid contents in tomatoes, but the effects differed among the different types of biochar raw material. This study demonstrated that biochar addition had a significant effect on total contents of polyphenols, flavonoids and triterpenoids in the leaves, whereas an obvious and negative effect was detected in W500 addition with the extension of treatment time (Figure 6), not fully in agreement with the results from the A. paniculatea [59] and tomatoes [60]. Pearson correlation analysis showed that the secondary metabolite contents in C. paliurus leaves were positively and significantly correlated with the ratios of C/N and C/P in the leaves (Figure 7), supporting the carbon-nutrient balance hypothesis which asserts that the ratio of carbon to nutrients can affect the allocation of resources in primary metabolites and secondary metabolites. Biochar additions significantly modified the ratio of C/N and C/P in the leaves of C paliurus (Figure 5), and, thereby, affected primary and secondary metabolic pathways and the content of secondary metabolites in the leaves of C. paliurus seedlings.
An important aim for C. paliurus cultivation is to harvest its leaves with higher bioactive substance accumulation. Even though the highest contents of measured secondary metabolites in the leaves did not occur in the W500 addition at 200 days after treatment (Figure 6), the greatest accumulations of secondary metabolites per plant were all found in W500 addition (Table 4), suggesting that the accumulations of secondary metabolites in C. paliurus leaves were mainly influenced by its leaf biomass production.

5. Conclusions

Pyrolysis temperatures significantly influenced the chemical properties and FT-IR spectra of wheel wingnut-based biochar. A pot experiment revealed the application of biochar pyrolyzed at different temperatures had significant effects on soil pH and nutrient availability, and, thereby, affected the growth, nutrient uptake and secondary metabolite accumulation of C. paliurus seedlings. The pH values and total nutrient contents in the soil increased as biochar pyrolysis temperature increased, whereas the soil’s available nutrient contents and leaf contents of secondary metabolites varied among the additions of biochar pyrolyzed at different temperatures. However, the W500 addition obtained the highest biomass production and leaf secondary metabolite accumulation in C. paliurus after 200 days of biochar treatment. Therefore, we suggest that wheel wingnut-based biochar pyrolyzed at 500 °C would be most suitable for future application in C. paliurus plantation. Unlike agricultural crops planted on flat land, C. paliurus plantations for leaf production are mostly planted in mountainous areas. It is recommended that biochar addition in C. paliurus plantations should be done near the planting holes during the planting. However, long-term field experiments are required to optimize the biochar addition quantity, based on the soil property and stand age at the planting sites in the future.

Supplementary Materials

The following supporting information can be downloaded at: https://www.mdpi.com/article/10.3390/f13101572/s1, Figure S1: The appearance of wheel wingnut-based biochar pyrolyzed at different temperatures. Figure S2: The photographs of C. paliurus growth among different treatments at 200 days after treatment.

Author Contributions

R.D.: Investigation, data curation, original draft writing. Z.L.: investigation, data curation. X.S.: investigation, data curation. S.F.: conceptualization, writing—review and editing, funding acquisition, and supervision. All authors have read and agreed to the published version of the manuscript.

Funding

This work was supported by the Key Research and Development Program of Jiangsu Province (BE2019388) and the National Natural Science Foundation of China (No. 32071750).

Institutional Review Board Statement

Not applicable.

Informed Consent Statement

Not applicable.

Data Availability Statement

The data presented in this study are available on request from the corresponding author. The data are not publicly available due to privacy restrictions.

Acknowledgments

We acknowledge Xiangxiang Fu, Wanxia Yang, Jian Qin, Ziqi Song, and Shichao, Zhou from Nanjing Forestry University for their laboratory assistance and suggestions to the manuscript.

Conflicts of Interest

The authors declare no conflict of interest.

References

  1. Mohan, D.; Sarswat, A.; Ok, Y.S.; Pittman, C.U. Organic and inorganic contaminants removal from water with biochar, a renewable, low cost and sustainable adsorbent—A critical review. Bioresour. Technol. 2014, 160, 191–202. [Google Scholar] [CrossRef] [PubMed]
  2. Welfle, A.; Gilbert, P.; Thornley, P. Increasing biomass resource availability through supply chain analysis. Biomass Bioenergy 2014, 70, 249–266. [Google Scholar] [CrossRef]
  3. Carnaje, N.P.; Talagon, R.B.; Peralta, J.P.; Shah, K.; Paz-Ferreiro, J. Development and characterisation of charcoal briquettes from water hyacinth (Eichhornia crassipes)-molasses blend. PLoS ONE 2018, 13, e0207135. [Google Scholar] [CrossRef] [PubMed]
  4. Romero-García, J.M.; Niño, L.; Martínez-Patiño, C.; Álvarez, C.; Castro, E.; Negro, M.J. Biorefinery based on olive biomass. State of the art and future trends. Bioresour. Technol. 2014, 159, 421–432. [Google Scholar] [CrossRef]
  5. Jesus, M.; Romani, A.; Mata, F.; Domingues, L. Current options in the valorisation of vine pruning residue for the production of biofuels, biopolymers, antioxidants, and bio-composites following the concept of biorefinery: A Review. Polymers 2022, 14, 1640. [Google Scholar] [CrossRef]
  6. Chen, W.F.; Meng, J.; Han, X.R.; Lan, Y.; Zhang, W.M. Past, present, and future of biochar. Biochar 2019, 1, 75–87. [Google Scholar] [CrossRef]
  7. Das, S.K.; Ghosh, G.K.; Avasthe, R.K.; Sinha, K. Compositional heterogeneity of different biochar: Effect of pyrolysis temperature and feedstocks. J. Environ. Manag. 2021, 278, 111501. [Google Scholar] [CrossRef]
  8. Tomczyk, A.; Sokolowska, Z.; Boguta, P. Biochar physicochemical properties: Pyrolysis temperature and feedstock kind effects. Rev. Environ. Sci. Bio/Technol. 2020, 19, 191–215. [Google Scholar] [CrossRef]
  9. Asai, H.; Samson, B.K.; Stephan, H.M.; Songyikhangsuthor, K.; Homma, K.; Kiyono, Y.; Inoue, Y.; Shiraiwa, T.; Horie, T. Biochar amendment techniques for upland rice production in Northern Laos1. Soil physical properties, leaf SPAD and grain yield. Field Crops Res. 2009, 111, 81–84. [Google Scholar] [CrossRef]
  10. Lehmann, J.; Gaunt, J.; Rondon, M. Bio-char sequestration in terrestrial ecosystems—A review. Mitig. Adapt. Strateg. Glob. Chang. 2006, 11, 403–427. [Google Scholar] [CrossRef]
  11. Deng, L.F.; Dong, G.; Cai, X.X.; Tang, J.J.; Yuan, H.R. Biochar derived from the inner membrane of passion fruit as cathode catalyst of microbial fuel cells in neutral solution. J. Fuel Chem. Technol. 2018, 46, 120–128. [Google Scholar]
  12. Wang, H.; Lin, K.; Hou, Z.; Richardson, B.; Gan, J. Sorption of the herbicide terbuthylazine in two New Zealand forest soils amended with biosolids and biochars. J. Soils Sediments 2010, 10, 283–289. [Google Scholar] [CrossRef]
  13. Wang, D.; Jiang, P.K.; Zhang, H.B.; Yuan, W.Q. Biochar production and applications in agro and forestry systems: A review. Sci. Total. Environ. 2020, 723, 137775. [Google Scholar] [CrossRef] [PubMed]
  14. Cao, Y.C.; Pawłowski, A. Life cycle assessment of two emerging sewage sludge-to-energy systems: Evaluating energy and greenhouse gas emissions implications. Bioresour. Technol. 2013, 127, 81–91. [Google Scholar] [CrossRef] [PubMed]
  15. Chintala, R.; Mollinedo, J.; Schumacher, T.E.; Malo, D.D.; Julson, J. Effect of biochar on chemical properties of acidic soil. Arch. Agron. Soil. Sci. 2014, 60, 393–404. [Google Scholar] [CrossRef]
  16. Cayuela, M.L.; Van Zwieten, L.; Singh, B.P.; Jefery, S.; Roig, A.; Sánchez-Monedero, M.A. Biochar’s role in mitigating soil nitrous oxide emissions: A review and meta-analysis. Agric. Ecosyst. Environ. 2014, 191, 5–16. [Google Scholar] [CrossRef]
  17. Vu, N.T.; Do, K.U. Insights into adsorption of ammonium by biochar derived from low temperature pyrolysis of coffee husk. Biomass Convers. Biorefinery 2021. [Google Scholar] [CrossRef]
  18. Uchimiya, M.; Wartelle, L.H.; Lima, I.M.; Klasson, K.T. Sorption of deisopropylatrazine on broiler litter biochars. J. Agric. Food. Chem. 2010, 58, 12350–12356. [Google Scholar] [CrossRef]
  19. Yuan, J.H.; Xu, R.K.; Zhang, H. The forms of alkalis in the biochar produced from crop residues at different temperatures. Bioresour. Technol. 2011, 102, 3488–3497. [Google Scholar] [CrossRef]
  20. Hanger, M.; Kemppainen, R.; Jauhiainen, L.; Tiilikkala, K.; Setala, H. The effects of birch (Betula spp.) biochar and pyrolysis temperature on soil properties and plant growth. Soil Tillage Res. 2016, 163, 224–234. [Google Scholar] [CrossRef]
  21. Fang, S.Z.; Yang, W.X.; Chu, X.L.; Shang, X.L.; She, C.Q.; Fu, X.X. Provenance and temporal variations in selected flavonoids in leaves of Cyclocarya paliurus. Food Chem. 2011, 124, 382–1386. [Google Scholar] [CrossRef]
  22. Xie, J.H.; Xie, M.Y.; Nie, S.P.; Shen, M.Y.; Wang, Y.X.; Li, C. Isolation, chemical composition and antioxidant activities of a water-soluble polysaccharide from Cyclocarya paliurus (Batal.) Iljinskaja. Food Chem. 2010, 119, 1626–1632. [Google Scholar] [CrossRef]
  23. Liu, Y.; Cao, Y.N.; Fang, S.Z.; Wang, T.L.; Yin, Z.Q.; Shang, X.L.; Yang, W.X.; Fu, X.X. Antidiabetic effect of Cyclocarya paliurus leaves depends on the contents of antihyperglycemic flavonoids and antihyperlipidemic triterpenoids. Molecules 2018, 23, 1042. [Google Scholar] [CrossRef] [PubMed]
  24. Zhou, M.M.; Chen, P.; Lin, P.; Fang, S.Z.; Shang, X.L. A comprehensive assessment of bioactive metabolites, antioxidant and antiproliferative activities of Cyclocarya paliurus (Batal.) Iljinskaja leaves. Forests 2019, 10, 625. [Google Scholar] [CrossRef]
  25. Xie, J.H.; Wang, Z.J.; Shen, M.Y.; Nie, S.P.; Gong, B.; Li, H.S.; Zhao, Q.; Li, W.J.; Xie, M.Y. Sulfated modifification, characterization and antioxidant activities of polysaccharide from Cyclocarya paliurus. Food Hydrocolloids 2016, 53, 7–15. [Google Scholar] [CrossRef]
  26. Qin, J.; Yue, X.L.; Fang, S.Z.; Qian, M.Y.; Zhou, S.T.; Shang, X.L.; Yang, W.X. Responses of nitrogen metabolism, photosynthetic parameter and growth to nitrogen fertilization in Cyclocarya paliurus. For. Ecol. Manag. 2021, 502, 119715. [Google Scholar] [CrossRef]
  27. El-Azazy, M.; Nabil, I.; Hassan, S.S.; El-Shafie, A.S. Adsorption characteristics of pristine and magnetic olive stones biochar with respect to clofazimine. Nanomaterials 2021, 11, 963. [Google Scholar] [CrossRef]
  28. Fang, S.Z.; Wang, J.Y.; Wei, Z.Y.; Zhu, Z.X. Methods to break seed dormancy in Cyclocarya paliurus (Batal.) Iljinskaja. Sci. Hortic. 2006, 110, 305–309. [Google Scholar] [CrossRef]
  29. Xi, J.G.; Li, H.; Xi, J.M.; Tan, S.B.; Zheng, J.L.; Tan, Z.X. Effect of returning biochar from different pyrolysis temperatures and atmospheres on the growth of leaf-used lettuce. Environ. Sci. Pollut. Res. 2020, 27, 35802–35813. [Google Scholar] [CrossRef]
  30. Steiner, C.; Teixeira, W.G.; Lehmann, J.; Nehls, T.; de Macedo, J.L.V.; Blum, W.E.H.; Zech, W. Long term effects of manure, charcoal and mineral fertilization on crop production and fertility on a highly weathered Central Amazonian upland soil. Plant Soil 2007, 291, 275–290. [Google Scholar] [CrossRef]
  31. Lu, R.K. Analytical Methods of Soil Agricultural Chemistry; Agricultural Science Press: Beijing, China, 1999; pp. 190–191. [Google Scholar]
  32. Li, T.T.; Li, Y.Q.; Sun, Z.J.; Xi, X.L.; Sha, G.L.; Ma, C.Q.; Tian, Y.K.; Wang, C.H.; Zheng, X.D. Resveratrol alleviates the KCl salinity stress of Malus hupehensis rhed. Front. Plant Sci. 2021, 12, 650485. [Google Scholar] [CrossRef] [PubMed]
  33. Shen, J.; Guo, M.J.; Wang, Y.G.; Yuan, X.Y.; Dong, S.Q.; Song, X.E.; Guo, P.Y. An investigation into the beneficial effects and molecular mechanisms of humic acid on foxtail millet under drought conditions. PLoS ONE 2020, 15, e0234029. [Google Scholar] [CrossRef] [PubMed]
  34. Sims, G.K.; Ellsworth, T.R.; Mulvaney, R.L. Microscale determination of inorganic nitrogen in water and soil extracts. Commun. Soil Sci. Plant Anal. 2008, 26, 303–316. [Google Scholar] [CrossRef]
  35. Guo, L.Z.; Li, J.H.; He, W.; Liu, L.; Huang, D.; Wang, K. High nutrient uptake efficiency and high water use efficiency facilitate the spread of Stellera chamaejasme L. in degraded grasslands. BMC Ecol. 2019, 19, 50. [Google Scholar] [CrossRef]
  36. Zhang, D.X.; Pan, G.X.; Wu, G.; Kibue, G.W.; Li, L.Q.; Zhang, X.H.; Zheng, J.W.; Zheng, J.F.; Cheng, K.; Joseph, S.; et al. Biochar helps enhance maize productivity and reduce greenhouse gas emissions under balanced fertilization in a rainfed low fertility inceptisol. Chemosphere 2016, 142, 106–113. [Google Scholar] [CrossRef]
  37. Cao, Y.N.; Fang, S.Z.; Yin, Z.Q.; Fu, X.X.; Shang, X.L.; Yang, W.X.; Yang, H.M. Chemical fingerprint and multicomponent quantitative analysis for the quality evaluation of Cyclocarya paliurus leaves by HPLC–Q–TOF–MS. Molecules 2017, 22, 1927. [Google Scholar] [CrossRef]
  38. Xie, P.J.; Huang, L.X.; Zhang, C.H.; Zhang, Y.L. Phenolic compositions, and antioxidant performance of olive leaf and fruit (Olea europaea L.) extracts and their structure-activity relationships. J. Funct. Foods 2015, 16, 460–471. [Google Scholar] [CrossRef]
  39. Li, F.M.; Tan, J.; Nie, S.P.; Dong, C.Y.; Li, C. The study on determination methods of total flavonoids in Cyclocarya paliurus. Food Sci. 2006, 4, 34–37. (In Chinese) [Google Scholar] [CrossRef]
  40. Fan, J.P.; He, C.H. Simultaneous quantification of three major bioactive triterpene acids in the leaves of Diospyros kaki by high-performance liquid chromatography method. J. Pharm. Biomed. 2006, 41, 950–956. [Google Scholar] [CrossRef]
  41. Al-Wabel, M.I.; Al-Omran, A.; El-Naggar, A.H.; Nadeem, M.; Usman, A.R. A Pyrolysis temperature induced changes in characteristics and chemical composition of biochar produced from conocarpus wastes. Bioresour. Technol. 2013, 131, 374–379. [Google Scholar] [CrossRef]
  42. Mendez, A.; Terradillos, M.; Gasco, G. Physicochemical and agronomic properties of biochar from sewage sludge pyrolysed at different temperatures. J. Anal. Appl. Pyrol. 2013, 102, 124–130. [Google Scholar] [CrossRef]
  43. Yang, C.D.; Liu, J.J.; Lu, S.G. Pyrolysis temperature affects pore characteristics of rice straw and canola stalk biochars and biochar-amended soils. Geoderma 2021, 397, 115097. [Google Scholar] [CrossRef]
  44. Atkinson, C.J.; Fitzgerald, J.D.; Hipps, N.A. Potential mechanisms for achieving agricultural benefits from biochar application to temperate soils: A review. Plant Soil 2010, 337, 1–18. [Google Scholar] [CrossRef]
  45. Zhao, L.; Cao, X.D.; Masek, O.; Zimmerman, A. Heterogeneity of biochar properties as a function of feedstock sources and production temperatures. J. Hazard. Mater. 2013, 256, 1–9. [Google Scholar] [CrossRef] [PubMed]
  46. Figueiredo, C.; Lopes, H.; Coser, T.; Vale, A.; Busato, J.; Aguiar, N.; Novotny, E.; Canellas, L. Influence of pyrolysis temperature on chemical and physical properties of biochar from sewage sludge. Arch. Argon. Soil Sci. 2018, 64, 881–889. [Google Scholar] [CrossRef]
  47. Bagreev, A.; Bandosz, T.J.; Locke, D.C. Pore structure and surface chemistry of adsorbents obtained by pyrolysis of sewage sludge-derived fertilizer. Carbon 2001, 39, 1971–1979. [Google Scholar] [CrossRef]
  48. Li, B.; Wang, S.C.; Zhang, Y.; Qiu, D.W. Acid Soil Improvement Enhances Disease Tolerance in Citrus Infected by Candidatus Liberibacter asiaticus. Int. J. Mol. Sci. 2020, 21, 3614. [Google Scholar] [CrossRef]
  49. Chang, Y.B.; Liu, W.G.; Mao, Y.Q.; Yang, T.; Chen, Y.G. Biochar Addition Alters C: N: P Stoichiometry in Moss Crust-Soil Continuum in Gurbantunggut Desert. Plants 2022, 11, 814. [Google Scholar] [CrossRef]
  50. Lasota, J.; Babiak, T.; Blonska, E. C: N: P stoichiometry associated with biochar in forest soils at historical charcoal production sites in Poland. Geoderma Reg. 2022, 28, e00482. [Google Scholar] [CrossRef]
  51. Wu, Y.; Xu, G.; Lv, Y.C.; Shao, W.B. Effects of biochar amendment on soil physical and chemical properties: Current status and knowledge gaps. Adv. Earth Sci. 2014, 29, 68–79. [Google Scholar]
  52. Abujabhah, I.S.; Doyle, R.; Bound, S.A.; Bowman, J.P. The effect of biochar loading rates on soil fertility, soil biomass, potential nitrification, and soil community metabolic profiles in three different soils. J. Soil Sediments 2016, 16, 2211–2222. [Google Scholar] [CrossRef]
  53. Sanchez-Garcia, M.; Alburquerque, J.A.; Sanchez-Monedero, M.A.; Roig, A.; Cayuela, M.L. Biochar accelerates organic matter degradation and enhances N mineralisation during composting of poultry manure without a relevant impact on gas emissions. Bioresour. Technol. 2015, 192, 272–279. [Google Scholar] [CrossRef] [PubMed]
  54. Zhang, M.Y.; Riza, M.; Liu, B.; Xia, H.; El-desouki, Z.; Jiang, C.C. Two-year study of biochar: Achieving excellent capability of potassium supply via alter clay mineral composition and potassium-dissolving bacteria activity. Sci. Total Environ. 2020, 717, 137286. [Google Scholar] [CrossRef] [PubMed]
  55. Bolan, N.S.; Saggar, S.; Luo, J.F.; Bhandral, R.; Singh, J. Gaseous emissions of nitrogen from grazed pastures: Processes, measurements and modelling, environmental implications, and mitigation. Adv. Agron. 2004, 84, 37–120. [Google Scholar] [CrossRef]
  56. Kavitha, B.; Reddy, P.V.L.; Kim, B.; Lee, S.S.; Paddey, S.K.; Kim, K.H. Benefits and limitations of biochar amendment in agricultural soils: A review. J. Environ. Manag. 2018, 227, 146–154. [Google Scholar] [CrossRef]
  57. Abideen, Z.; Koyro, H.W.; Huchzermeyer, B.; Ansari, R.; Zulfiqar, F.; Gul, B. Ameliorating effects of biochar on photosynthetic efficiency and antioxidant defence of Phragmites karka under drought stress. Plant Biol. 2020, 22, 259–266. [Google Scholar] [CrossRef]
  58. Naeem, M.A.; Khalid, M.; Aon, M.; Abbas, G.; Tahir, M.; Amjad, M.; Murtaza, B.; Yang, A.Z.; Akhtar, S.S. Effect of wheat and rice straw biochar produced at different temperatures on maize growth and nutrient dynamics of a calcareous soil. Arch. Agron. Soil Sci. 2017, 63, 2048–2061. [Google Scholar] [CrossRef]
  59. Saha, A.; Basak, B.B.; Gajbhiye, N.A.; Kalariya, K.A.; Manivel, P. Sustainable fertilization through co-application of biochar and chemical fertilizers improves yield, quality of Andrographis paniculata and soil health. Ind. Crops Prod. 2019, 140, 111607. [Google Scholar] [CrossRef]
  60. Petruccelli, R.; Bonetti, A.; Traversi, M.L.; Faraloni, C.; Valagussa, M.; Pozzi, A. Influence of biochar application on nutritional quality of tomato (Lycopersicon esculentum). Crop Pasture Sci. 2015, 66, 747–755. [Google Scholar] [CrossRef] [Green Version]
Figure 1. Fourier-transform infrared spectroscopy (FT-IR) of wheel wingnut-based biochar at different pyrolysis temperatures.
Forests 13 01572 g001
Figure 2. Effects of biochar pyrolyzed at different temperatures on soil pH values sampled at 0, 50, 100, 150 and 200 days after treatment. CK: without biochar; W300: with biochar pyrolyzed at 300 °C; W500: with biochar pyrolyzed at 500 °C; W700: with biochar pyrolyzed at 700 °C. Different uppercase letters indicate significant differences among the different sampling times in the same treatment, while different lowercase letters indicate significant differences among the different treatments at the same sampling time according to Duncan’s test (p < 0.05), respectively.
Forests 13 01572 g002
Figure 3. Effects of biochar pyrolyzed at different temperatures on soil total contents of carbon (A), nitrogen (B), phosphorus (C), and potassium (D), as well as the ratios C/N (E), and C/P (F) at 0, 50, 100, 150 and 200 days after treatment. CK: without biochar; W300: with biochar pyrolyzed at 300 °C; W500: with biochar pyrolyzed at 500 °C; W700: with biochar pyrolyzed at 700 °C. Different uppercase letters indicate significant differences among the different sampling times in the same treatment, while different lowercase letters indicate significant differences among different treatments at the same sampling time according to Duncan’s test (p < 0.05), respectively.
Forests 13 01572 g003
Figure 4. Effects of biochar pyrolyzed at different temperatures on soil available contents of NH4+-N (A), NO3-N (B), available P (C), and available K (D) at 0, 50, 100, 150 and 200 days of treatment. CK: without biochar; W300: with biochar pyrolyzed at 300 °C; W500: with biochar pyrolyzed at 500 °C; W700: with biochar pyrolyzed at 700 °C. Different uppercase letters indicate significant differences among the different sampling times in the same treatment, while different lowercase letters indicate significant differences among different treatments at the same sampling time according to Duncan’s test (p < 0.05), respectively.
Forests 13 01572 g004
Figure 5. Effects of biochar pyrolyzed at different temperatures on the total contents of carbon (A), nitrogen (B), phosphorus (C), and potassium (D) in the leaves of C. paliurus, as well as the ratio of C/N (E), and C/P (F) at 100, 150 and 200 days after treatment. CK: without biochar; W300: with biochar pyrolyzed at 300 °C; W500: with biochar pyrolyzed at 500 °C; W700: with biochar pyrolyzed at 700 °C. Different uppercase letters represent significant differences among the different sampling times in the same treatment, while different lowercase letters indicate significant differences among different treatments at the same sampling time according to Duncan’s test (p < 0.05), respectively.
Forests 13 01572 g005
Figure 6. Effects of biochar pyrolyzed at different temperatures on the total contents of polyphenols (A), flavonoids (B), and triterpenoids (C) in the leaves of C. paliurus at 100, 150 and 200 days after treatment. CK: without biochar; W300: with biochar pyrolyzed at 300 °C; W500: with biochar pyrolyzed at 500 °C; W700: with biochar pyrolyzed at 700 °C. Different uppercase letters represent significant differences among the different sampling times in the same treatment, while different lowercase letters indicate significant differences among different treatments at the same sampling time according to Duncan’s test (p < 0.05), respectively.
Forests 13 01572 g006
Figure 7. Pearson correlation heatmap between soil nutrient contents and leaf nutrient contents (A) as well as between leaf nutrient contents and secondary metabolite contents (n = 32) (B). The * and ** symbols represent significance at 0.05 and 0.01 probability levels, respectively. Abbreviations: TPC: total polyphenol content; TFC: total flavonoid content; TTC: total triterpenoid content.
Forests 13 01572 g007
Table 1. Basic physical properties of wheel wingnut-based biochar pyrolyzed at different temperatures.
Biochar TypeBET Surface Area (m2·g−1)Total Pore Volume (cm3·g−1)t-Plot Micropore Area (m2·g−1)t-Plot Micropore Volume (cm3·g−1)
W3002.052.50 × 10−300
W50019.601.86 × 10−21.416.2 × 10−4
W70054.855.29 × 10−237.081.96 × 10−2
Table 2. Basic chemical properties of wingnut-based biochar pyrolyzed at different temperatures.
Biochar TypepHTotal Carbon (g·kg−1)Total Nitrogen (g·kg−1)Total Phosphorus (g·kg−1)Total Potassium (g·kg−1)C/NC/P
W3006.71 ± 0.02 c681.30 ± 3.95 c11.27 ± 0.12 a2.21 ± 0.03 c3.75 ± 0.13 c60.47 ± 0.72 c308.90 ± 2.45 a
W5009.38 ± 0.01 b754.23 ± 4.63 b10.00 ± 0.10 b2.56 ± 0.04 b5.52 ± 0.08 b75.43 ± 0.91 b294.85 ± 2.99 b
W7009.51 ± 0.06 a784.60 ± 4.22 a7.37 ± 0.06 c3.15 ± 0.02 a8.65 ± 0.08 a106.51 ± 1.17 a248.88 ± 1.84 c
Different lowercase letters indicate significant difference in biochar properties among three biochar pyrolyzed at different temperatures according to Duncan’s test (p < 0.05). All values were presented as mean ± standard deviation (SD).
Table 3. Effects of wheel wingnut-based biochar pyrolyzed at different temperatures on growth and biomass accumulation of C. paliurus seedlings after 200 days of treatment.
TreatmentSeedling Height (cm)Ground Diameter (mm)Biomass (g·Plant−1)
LeafShootRootTotal
CK44.56 ± 0.38 b9.82 ± 0.09 b1.53 ± 0.11 b6.36 ± 0.18 b4.33 ± 0.15 b12.35 ± 0.19 b
W30043.40 ± 0.62 c9.70 ± 0.22 b1.51 ± 0.07 b6.65 ± 0.17 b4.52 ± 0.17 b12.68 ± 0.35 b
W50049.93 ± 0.60 a9.78 ± 0.27 b1.74 ± 0.12 a7.41 ± 0.23 a5.23 ± 0.19 a14.37 ± 0.38 a
W70042.33 ± 0.40 d10.48 ± 0.32 a1.17 ± 0.07 c4.14 ± 0.39 c3.79 ± 0.07 c9.09 ± 0.43 c
Different lowercase letters represent significant difference among growth and biomass accumulation of C. paliurus seedlings according to Duncan’s test (p < 0.05). All values were presented as mean ± standard deviation (SD).
Table 4. Effects of wheel wingnut-based biochar pyrolyzed at different temperatures on secondary metabolite accumulations in C. paliurus leaves.
TreatmentAccumulation (mg·Plant−1)
Total PolyphenolTotal FlavonoidTotal Triterpenoid
CK14.43 ± 1.26 a9.88 ± 0.73 b56.46 ± 4.65 b
W30012.44 ± 0.79 b10.49 ± 0.54 ab60.28 ± 2.82 b
W50015.07 ± 1.04 a11.80 ± 1.09 a68.05 ± 4.96 a
W7007.03 ± 0.23 c6.13 ± 0.23 c36.16 ± 1.22 c
Different lowercase letters represent significant difference among secondary metabolite accumulations in C. paliurus leaf according to Duncan’s test (p < 0.05). All values were presented as mean ± standard deviation (SD).
Publisher’s Note: MDPI stays neutral with regard to jurisdictional claims in published maps and institutional affiliations.

