Article

Characterizing Global Patterns of Mangrove Canopy Height and Aboveground Biomass Derived from SRTM Data

by
Aslan Aslan
1,2,* and
Mohammed Othman Aljahdali
3,*
1
Innovation Centre for Tropical Science (ICTS), Bogor 16113, Indonesia
2
PT Amman Mineral Nusa Tenggara, Mataram 83126, Indonesia
3
Biological Sciences Department, King Abdulaziz University, Jeddah 21589, Saudi Arabia
*
Authors to whom correspondence should be addressed.
Forests 2022, 13(10), 1545; https://doi.org/10.3390/f13101545
Submission received: 6 August 2022 / Revised: 11 September 2022 / Accepted: 16 September 2022 / Published: 21 September 2022
(This article belongs to the Special Issue Biodiversity, Health, and Ecosystem Services of Mangroves)

Abstract

:
Numerous studies have been done using remotely sensed data to produce global mangrove height and biomass maps; however, little is known about the worldwide pattern of mangroves in the Northern and Southern Hemispheres that corresponds to their height and biomass. The objective of this study was to investigate whether there is a specific pattern that can be seen between northern and southern mangroves according to height and biomass. Based on an empirical model, we processed Shuttle Radar Topographic Mission (SRTM) elevation data in combination with 450 field data points to produce a global mangrove height map and its corresponding aboveground biomass (AGB) per hectare at 30 m spatial resolution. We also refined the global mangrove area maps and provided a set of equations to determine the maximum mangrove height at any given latitude. Results showed that 10,639,916 ha of mangroves existed globally in the year 2000, with a total AGB of 1.696 Gt. Even though the areal coverage of mangroves was higher in the Northern Hemisphere, the total mangrove AGB was higher in the Southern Hemisphere. The majority of mangroves in both hemispheres were found to be between 6 and 8 m tall, although height distribution differed in each hemisphere. The global mangrove height equation for northern and southern mangroves produced from this study can be used by relevant stakeholders as an important reference for developing an appropriate management plan for the sustainability of the global mangrove ecosystem.

1. Introduction

Mangrove forests of the tropics and subtropics are important for coastal protection, conservation of biological diversity, and protection of coral reefs and seagrass beds [1]. They provide habitat, spawning grounds, and nutrients for three-quarters of all commercially fished species in the tropics [2]. Mangroves are also among the most carbon-rich forests in the tropics, [3] providing potentially low-cost options for carbon sequestration and storage [4,5]. Despite these values, studies indicate that over the past century, mangroves have been heavily deforested [6]. Recent studies suggest that although mangrove deforestation continues at variable rates depending on the region, its global rate may have slowed down to <1% y−1 since 2000 [7].
Accurate global mangrove maps are important as most of the world’s mangroves occur in developing tropical countries where technical and financial constraints may limit regional mangrove mapping efforts. Mangrove atlases exist that provide information on global and national level mangrove coverage at different spatial scales [8]. A global mangrove area map of 30 m spatial resolution, called the Mangrove Forest of the World (MFW), has been developed using Landsat images from multiple years [9]. An improved version of the global mangrove map, named the Global Database of Continuous Mangrove Forest Cover for the 21st Century (CGMFC-21), has been recently released [7], which provides a continuous land cover map for the year 2000 and annual deforestation of mangrove areas for 2000–2012.
All existing maps of global mangroves provide the two-dimensional spatial distribution of the mangrove biome or mangrove presence or absence. Canopy height, a third dimension, is an essential parameter for understanding the vertical structure, estimating aboveground biomass (AGB) and carbon storage, and exploring distributions of mangrove habitat for a great number of mammals, birds, reptiles, fish, amphibians, and insects. Studies have demonstrated the utility of data from active remote sensing sensors such as radar and lidar and stereo data from optical sensors such as ASTER and SPOT for producing dependable estimates of mangrove heights in multiple locations throughout the world [10,11].
Mangroves expressed a pattern between degradation and regeneration according to environmental stresses and anthropogenic activities [12]. Several environmental factors, particularly physical factors such as distance from the sea or the estuary bank, temperature, ocean currents, salinity, frequency and duration of tidal inundation, and soil composition, affect the spatial distribution and species composition of mangroves [13,14,15,16,17]. While tidal ranges control the lateral extent of mangroves through inundation frequency [13], temperature is a primary constraint on the distribution and maximum biomass of mangrove ecosystems [18]. Although mangroves are salt-tolerant plants, salinity limits their growth as very few mangroves survive above a soil salinity of about 70–80 ppt [18]. In nature and under favorable conditions, mangroves can grow up to ~40 m tall in equatorial regions [19]. A recent study discovered that the tallest mangrove could reach 62.8 m in Gabon, West Africa [20].
A study on the vertical structure of mangroves (i.e., height) is very crucial because it not only provides a predictor of aboveground biomass but also assists us in understanding the details and successional changes of production and competition in vegetal communities, site productivity, nutrient cycling, nutrient budget, amount of carbon, predicting future change due to climate change, and overall managing the forest in a sustainable way [21]. Over the years, forest ecologists have developed three major methods for estimating forest biomass and carbon stocks: the harvest method, the mean-tree method, and the allometric equation method [21]. Of these three methods, the allometric is the most widely used one due to its simple approach. The allometric equation works by developing a relationship between the measurable parameters of the tree such as trunk diameter and height. Ideally, diameter at breast height (DBH) is the best predictor to estimate a tree’s biomass; however, remotely sensed sensors have limitations in detecting the diameter of trees compared to sensing their vertical structure (height). Hence, scholars have often used height as the sole parameter for estimating the biomass of forests. Our published study demonstrated that using the SRTM height, the model could accurately estimate mangrove biomass at the genus level in the Mimika District of Papua, Indonesia [22]. The model estimates of mangroves biomass was within 90% confidence intervals of area-weighted biomass derived from field measurements.
Remotely sensed data derived from active sensors such as Synthetic Aperture Radar (SAR) or passive (optical) sensors have been widely used to obtain information on the vertical structure and composition of the mangrove ecosystem. Several studies have pointed out that the usage of radar data is a common approach for estimating mangrove canopy heights at local, regional, and global scales, and NASA’s Shuttle Radar Topography Mission (SRTM) elevation data have been most widely used for this purpose [20,22,23,24,25,26]. Some other scholars have used SAR data from newer sensors, i.e., the European Space Agency’s TanDEM-X, to estimate mangrove height [10,27]. Meanwhile, a study by Aslan et al. [28] has demonstrated that optically based remotely sensed data such as ALOS PRISM can also be used to map mangrove height. The study further indicated that in the absence of SAR-based elevation data (such as SRTM and TanDEM-X), the ALOS PRISM data can be used to map mangrove height.
A recent study [20] produced a global mangrove height and aboveground biomass map based on SRTM elevation data. Still, the study lacked the ability to characterize the spatial trends of global mangrove heights and their linked standing biomass across latitude for the Northern and Southern Hemispheres. Several studies have shown that the ecological distribution of mangroves is highly correlated and limited by the latitudinal distribution of sea surface temperature [29,30]. However, these studies also lack information to determine which hemisphere has the tallest mangrove and contains the highest mangrove AGB biomass, or vice versa.
Therefore, our principal objective in this study was to discover and evaluate a global pattern between the Northern and Southern Hemispheres of mangrove canopy height and its correspondence to aboveground biomass. This could be done first by establishing a global model of mangrove canopy heights based on SRTM elevation data, and second, by assessing the global distribution of mangrove biomass using an appropriate empirical model derived from canopy height. In this case, we examined the spatial trends of global mangrove heights and offered a set of equations representing the relationships between maximum mangrove height and latitude for the Northern and Southern Hemispheres.
A secondary objective was to refine existing global maps of mangrove distribution by identifying and excluding areas in existing maps that had SRTM elevations higher than the feasible maximum canopy heights for mangroves. Both objectives demonstrate mangrove health and population dynamics, which are linked with environmental stresses, climate change, and nutrient limitations.

2. Materials and Methods

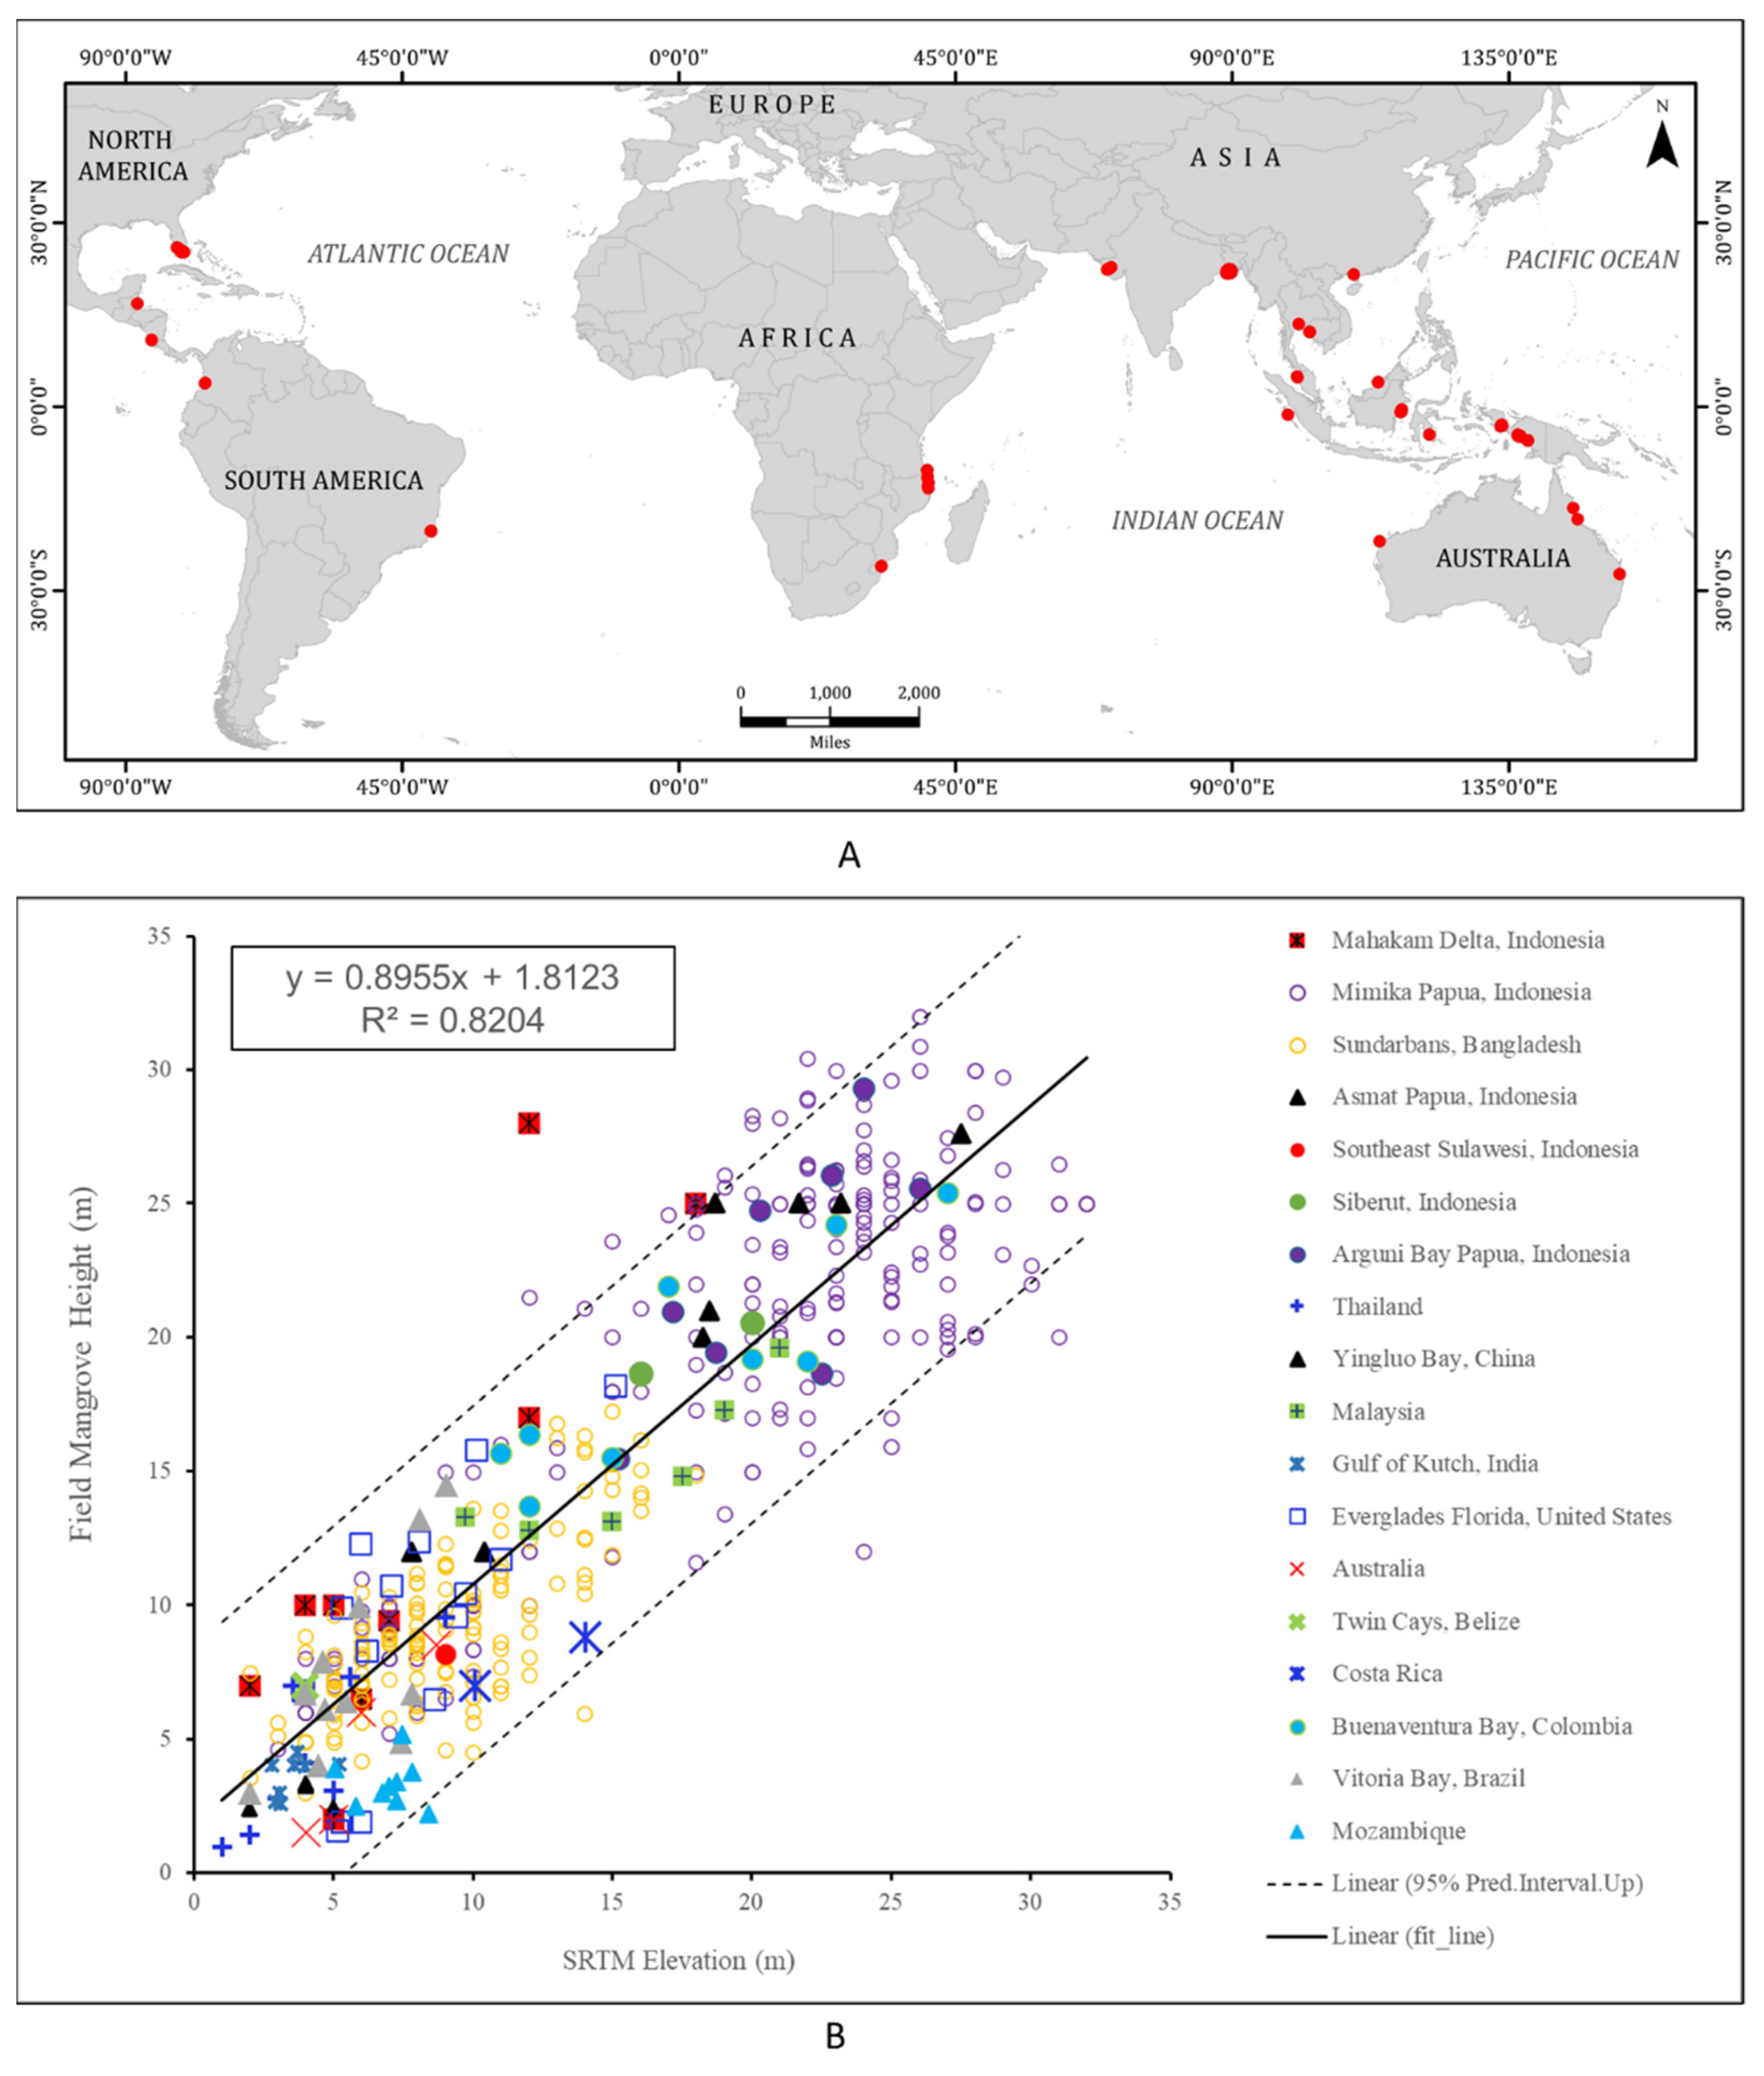
2.1. Field Data and SRTM Height

We obtained 450 data points from two sources: peer-reviewed published literature and original data from recent field surveys, to determine the relationships between SRTM data and mangrove canopy height (Figure 1). The field data were collected from 5 locations: (1) Arguni Bay of Papua, Indonesia; (2) Mimika District of Papua, Indonesia; (3) Asmat District of Papua, Indonesia; (4) Mahakam Delta of Kalimantan, Indonesia; and (5) the Sundarbans Forest in Bangladesh. For Arguni Bay, Asmat, and Mimika sites, field data were collected between 2013 and 2015. The data collection followed protocols for assessing the structure, biomass, and carbon stocks of mangrove forests [31], using six 10 m radius circular subplots located every 25 m along the center transect of a larger 40 m by 125 m rectangular survey plot for large trees. Tree height was measured using a hypsometer or clinometer and estimated to the nearest meter. Details of tree inventories and the analysis can be found in [22]. For the Mahakam Delta site, field data were collected in June 2014 using the method in [31]. The heights of adult mangrove trees were measured using a handheld laser rangefinder, and young trees were measured with telescopic measuring rods in each sampling plot. For the Sundarbans site, field data were collected in 2009 using a grid-sampling method at 4 min intervals of latitude and 2 min intervals of longitude. Tree heights were measured using a digital range finder based on the height of three co-dominant mangrove species. Descriptions of the Sundarbans data collection campaign can be found in [32]. To obtain data from published studies, we conducted an exhaustive literature review and extracted data from papers that provided field GPS locations and canopy heights of mangroves (Figure 1). In total, 42 species of mangroves were represented in our field data set, covering a geographic range of 25.48° N to 27.28° S latitude (Table 1).
We used correlation analysis to determine relationships between the field-based canopy height data and SRTM data at 30 m spatial resolution. In February of 2000, NASA’s SRTM radar system flew onboard the Space Shuttle Endeavour during the 11-day STS-99 mission and produced a set of quality-controlled digital elevation model (DEM) data on a near-global scale from 56° S to 60° N at consistent spatial resolution. Although other newer sensors, such as the German Aerospace Center (DLR) TanDEM-X, provide radar data with global coverage that can be used to estimate canopy heights [27], data from those sensors are not freely available for all mangrove areas of the world. Two other DEM data sets derived from optical sensors, namely, the ASTER-GDEM and JAXA-DSM, also provide global data, but their coverage in the tropical coastal areas is not continuous, and these data sets have not been verified for anomalies and artifacts in the coastal areas. The SRTM product is one of the quality-controlled sets of DEM data that is freely available for global-scale studies. Even though the STRM data sets from 2000 are somewhat dated, recent studies have indicated that the average rate of global mangrove deforestation has been <1% y-1 since 2000 [7] and that the growth and expansion of mangroves occur at decadal time scales. Therefore, the use of SRTM data was considered the most appropriate and cost efficient for studying current patterns of global mangrove heights [22].
We downloaded the SRTM DEM data from the US Geological Survey National Centre for Earth Resources Observation and Science through the Earth Explorer data portal (http://earthexplorer.usgs.gov/ (accessed on 28 June 2017). The SRTM DEM data have been shown to correspond with mangrove canopy height because mangrove trees normally grow in intertidal zones; thus, a ground elevation close to the mean sea level can be used to identify mangrove heights at the per-pixel level [46,47].

2.2. Empirical Models

Using the 450 field-based mangrove canopy heights and their corresponding SRTM values in a scatterplot, we developed a linear correlation model (Figure 1):
H f = 0.8955   H s + 1.81223
where Hf is the field-based canopy height of a 30 m SRTM pixel and Hs is the DEM height value of that SRTM pixel. The accuracy of the model was evaluated with k-fold cross validation analysis. The k-fold cross validation analysis is used in ecological studies to evaluate model performance where observations are drawn only from a set of available locations [48], and it assesses how effectively the model reflects a quantity proportional to the probability of occurrence [49]. This canopy height model was then used to produce canopy height maps at a consistent 30 m pixel scale for global mangrove areas. For this study, we used the mangrove map produced in [7] to mask the global mangrove areas. The intercept value in Equation (1) shows a discrepancy of ~1.8 m between the actual ground elevation and the SRTM DEM, similar to what has been reported in previous studies [26].
For mangrove biomass, we used an empirical equation proposed in the study of principle trends of mangrove [50]:
A G B = 10.8 H + 34.994
where AGB is the aboveground biomass (tons ha−1) and H is the mean canopy height of mangroves in an area (ha). The study used mangrove height and AGB measurements from 43 globally distributed sites to obtain a highly significant correlation of mangrove AGB with the mean canopy height of an area [50]. Among the existing ‘mangrove height vs. AGB’ models, the Saenger and Snedaker model shown in Equation (2) is the only one that was developed for a unit area (ha−1) rather than for individual trees and stands and was therefore most appropriate for use in the present study since our canopy height maps are also presented on an area basis.

3. Results

3.1. Mangrove Heights and Vertical Accuracy

A compilation of 42 species of mangroves from published studies with the addition of previously unpublished field-based mangrove height data (Table 1) allowed us to derive a relationship between field-based and SRTM measurements of canopy heights, including data from all continents and latitudes (Figure 1). Although there was scatter around the trend line (Figure 1), the correlation was linear with a highly significant correlation coefficient (Pearson’s r = 0.91, R2 = 0.82), and residuals were similarly distributed for all levels of heights. Although the absolute vertical accuracy of the SRTM elevation data is 16 m (at 90% confidence) (see USGS EROS Archive—Digital Elevation—SRTM Mission Summary | U.S. Geological Survey), several scholars have pointed out that the vertical accuracy of SRTM is higher than what has been reported by USGS when compared to the field canopy height measurement. For example, Simard et al. [20] reported a root mean square error (RMSE) of 3.6 m between the SRTM height estimation of basal area (SRTMHba) and in situ mangrove height basal area (Hba) measurements. Similarly, our previous published study showed that there was a strong correlation between the SRTM elevation data and the 98th percentiles of field canopy height (H.98) measurements with a mean absolute error (MAE) of 3.0 m derived from 10,000 bootstrapped simulations [22]. In this study, our mangrove canopy height model derived from SRTM elevation data and the field-based measurements of existing mangrove heights from globally distributed sites produced an average error of 2.62 m for MAE and 3.36 m for RMSE. Therefore, using SRTM elevation data in this study is appropriate as we are only studying height in relatively flat coastal areas where the impacts of topography on the SRTM elevation error are negligible.
Based on the map [7], globally, there were 118,784,099 SRTM pixels of mangroves at 30 m resolution. We used Equation (1) with SRTM data to estimate the canopy height of each mangrove pixel. The resulting heights ranged from 2.78 m to >1000 m, but the vast majority of the height data were <40 m. Mangroves do not grow taller than 40 m [19]. In the Hamilton and Casey map [7], 562,800 pixels had height values >40 m. We excluded those pixels (called type-A inaccuracy henceforth) and produced a refined map of the global mangrove area and canopy heights at 30 m resolution (Figure 2). Our results indicated that 10,639,916 ha of mangroves existed globally in the year 2000.
The latitudinal distribution of mangrove heights and the areas occupied by each height class are shown in Figure 3. For clarity of display, the latitudes are binned at 1° and the heights are binned at 1 m (Figure 3A). Results indicated that the tallest mangroves were present near the equator and that the maximum height of mangroves declined in both hemispheres as the distance from the equator increased. In the Northern Hemisphere, 5–17 m tall mangroves occupied relatively large areas between 4°–13° N latitude and 22° N latitude. In the Southern Hemisphere, a large area of mangroves existed between 1°–3° S latitude, with a canopy height range of 6–28 m. At 8° S latitude, another extensive coverage of 10–20 m tall mangroves was present. A relatively large area of mangroves also existed between 11°–22° S latitude, with canopy heights of 5–12 m.
Our study revealed that the maximum heights of mangroves were strongly correlated to latitude, but the trends were not symmetrical for both hemispheres. Using a best-fit line for the tallest mangroves across latitudes, we developed a set of two equations, one for each hemisphere, which can be used to derive the maximum height of mangroves for any specific latitude:
For   the   Northern   Hemisphere   ( 0 ° 30 °   N ) : H f = 38.97 0.6418 × | l a t i t u d e | 0.0169 × | l a t i t u d e | 2 For   the   Southern   Hemisphere   ( 0 ° 38 °   S ) : H f = 38.97 1.5601 × | l a t i t u d e | 0.0177 × | l a t i t u d e | 2
where Hf is the canopy height of a 30 m SRTM pixel, and the latitude values are in degrees (in absolute format). Although after correcting the type-A inaccuracy the maximum height of mangroves in our global data set was 39.5 m, binning of the data at 1° latitude reduced the maximum height to 38.97 m (Equation (3)).
Most mangroves in both hemispheres were between 6 and 8 m tall, although their height distribution differed (Figure 3B). The Northern Hemisphere had a larger area of shorter mangroves, and the Southern Hemisphere had a larger area of taller mangroves. Total mangrove areas were 5.63 million ha in the Northern Hemisphere and 4.97 million ha in the Southern Hemisphere.

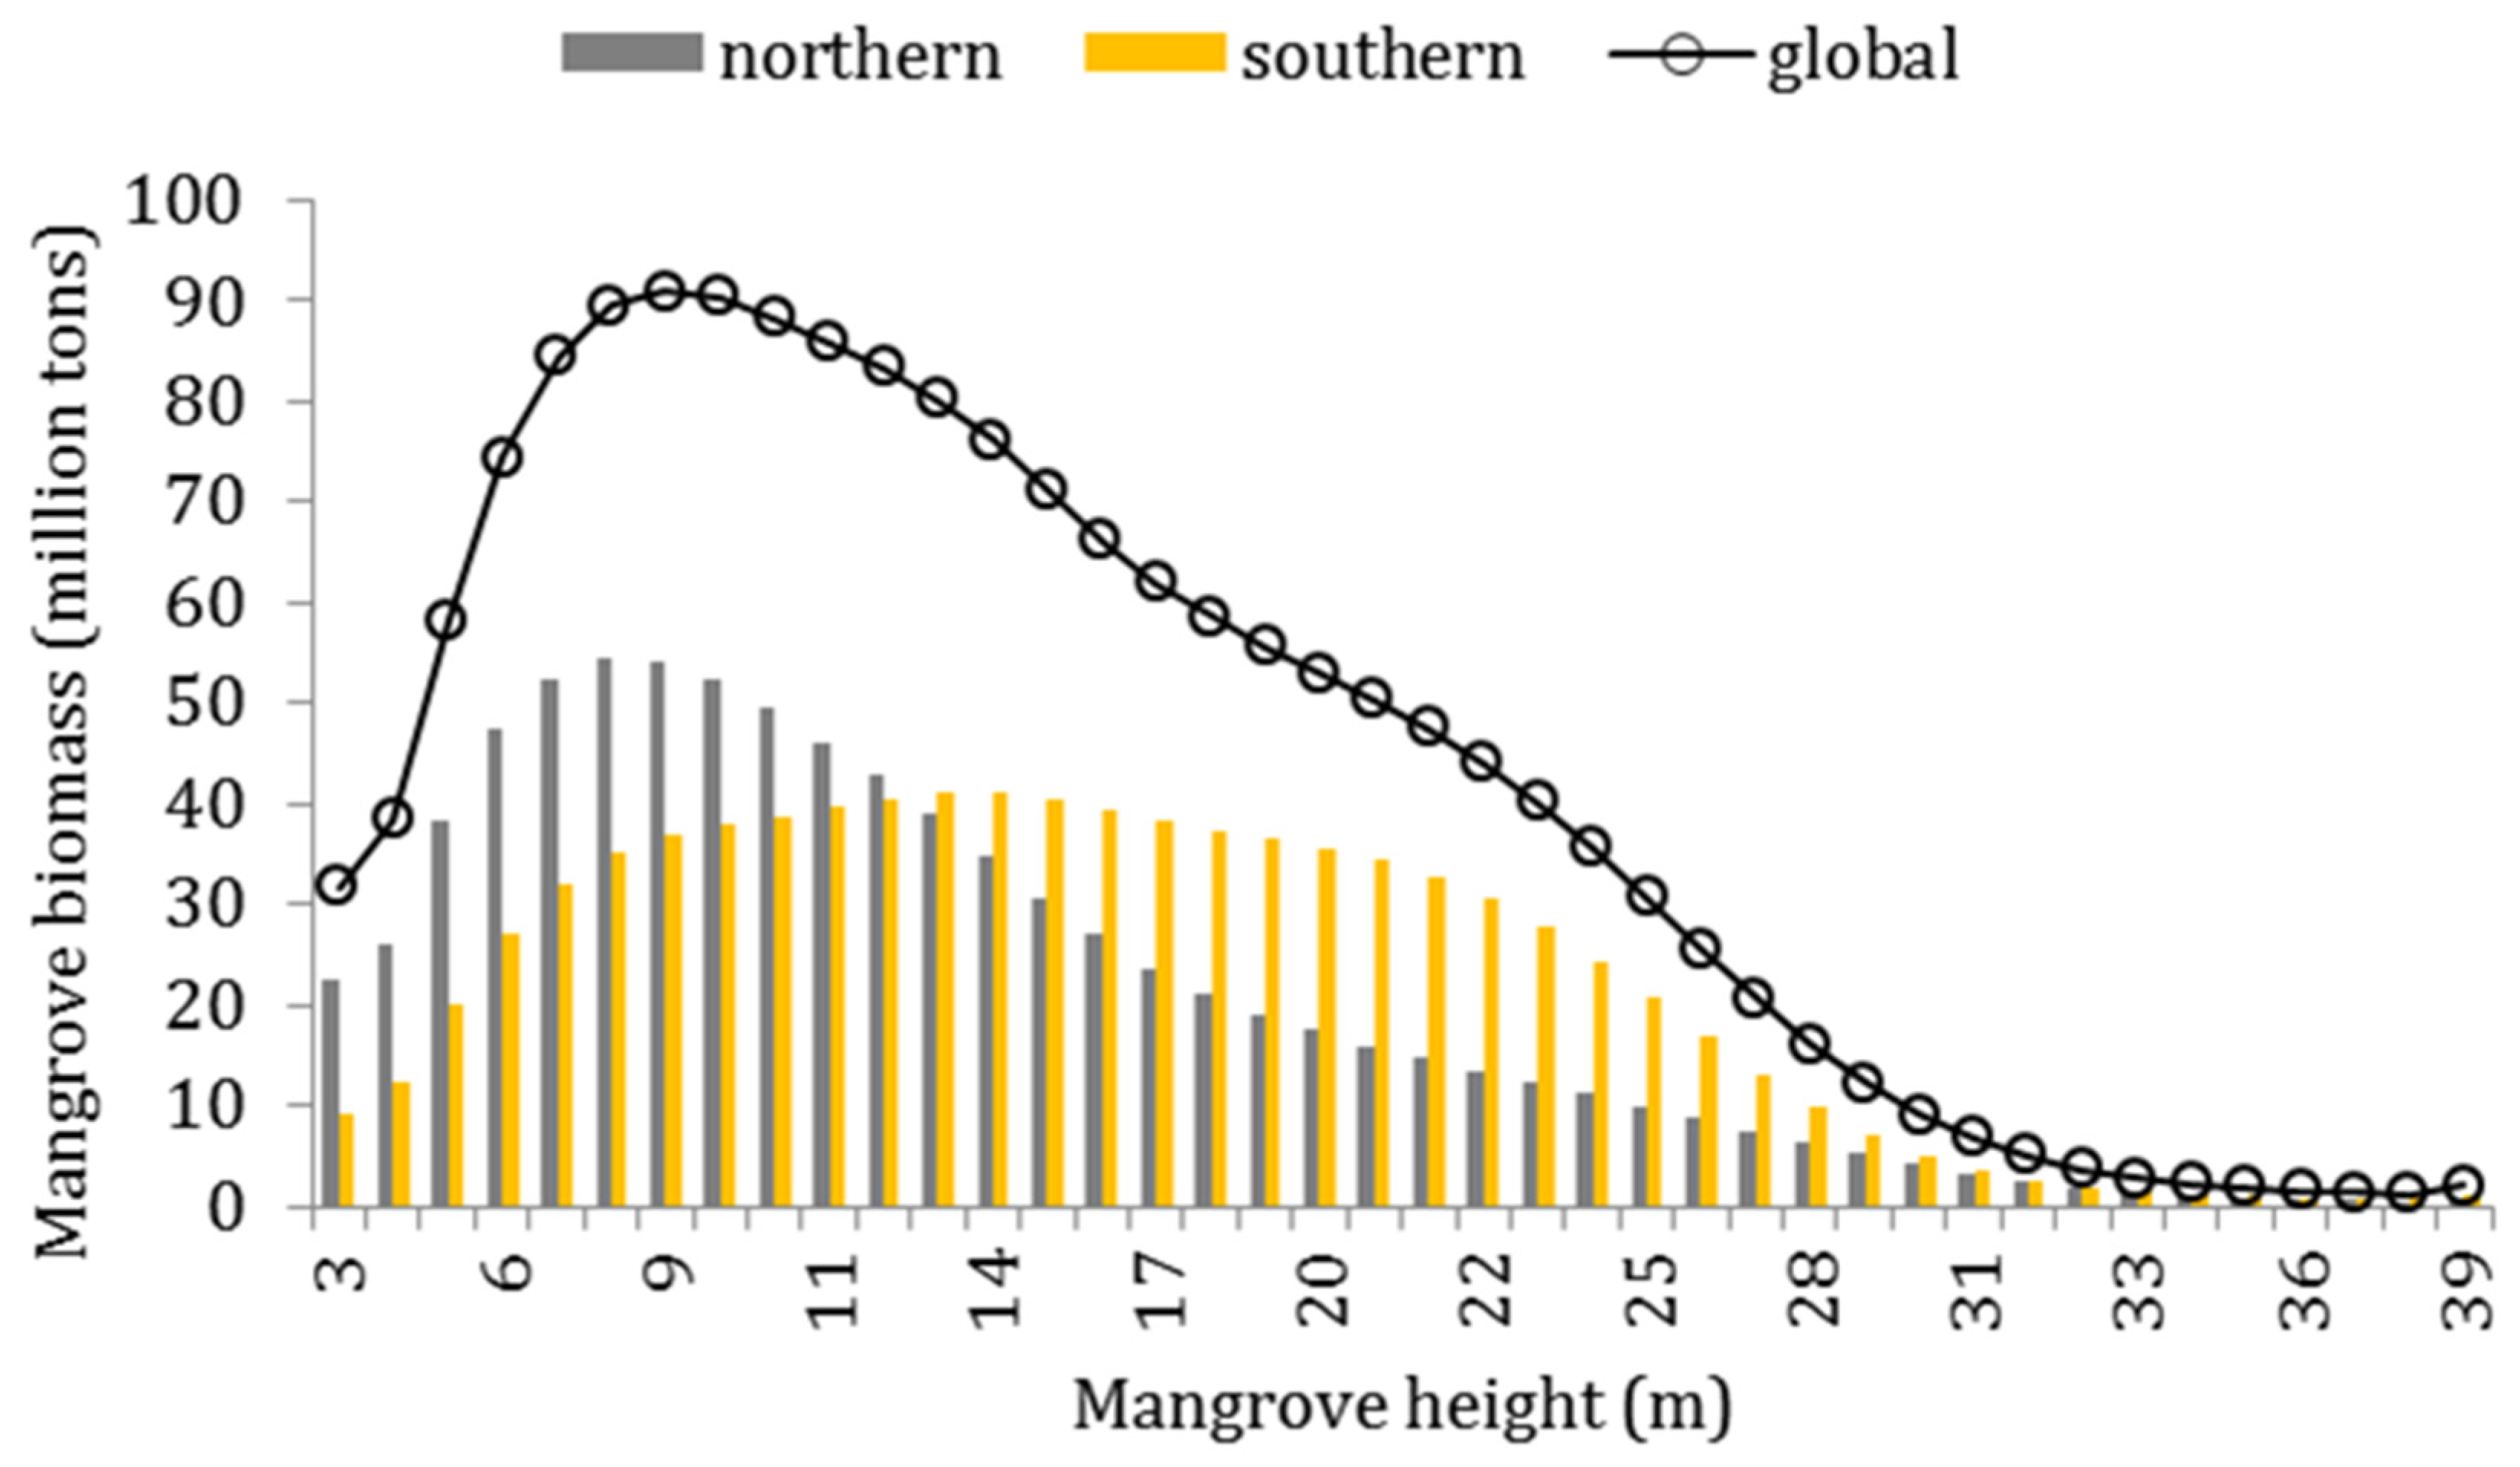
3.2. Mangrove Biomass

Biomass distributions across different classes of mangrove heights were distinct for each hemisphere (Figure 4).
Figure 4 shows that biomass versus mangrove height had a positively skewed distribution in the Northern Hemisphere, with the peak at 8 m. In the Southern Hemisphere, biomass was rather normally distributed across the height classes, with the peak at 14 m. Total global mangrove biomass was 1.696 billion metric tons (Gt) in 2000, of which 820.8 million tons were in the Northern Hemisphere and 875.5 million tons in the Southern Hemisphere. Although mangroves of the Northern Hemisphere occupied >651,000 ha more land than in the Southern Hemisphere, the mangrove biomass of the Southern Hemisphere was 54.7 million tons more than that of the Northern Hemisphere. This is due to the greater extent of taller mangroves in the Southern Hemisphere (Figure 3B). Another study that produced a mangrove biomass model as a function of mangrove height and latitude revealed that mangrove tree height is a good indicator of forest biomass, which increased at lower latitudes in the neotropics [51].

3.3. Mangrove-Rich Countries

The provided lists of mangrove areas are in the most mangrove-rich countries in the world. Since we excluded the 562,800 pixels (or 50,652 ha) of type-A inaccuracy from the existing global mangrove maps, the new calculation of those areas also changed accordingly [7]. We recalculated the mangrove area and biomass of the 15 most mangrove-rich countries in the world following [9], which are presented in Table 2.
Discrepancies in the mangrove areas of different countries among the three studies are due to the way area estimates were calculated. The MFW map was based on the presence/absence of mangroves for each pixel, whereas the CGMFC-21 map was developed using the fraction of mangrove coverage within each 30 m pixel. Hence, the latter had a much lower estimate of global mangrove areas compared to the former. We used the CGMFC-21 map but considered each mangrove pixel on a presence/absence basis since we estimated the area-based height at each pixel. Therefore, our estimates of mangrove areas are generally higher than the CGMFC-21 estimates but lower than the MFW estimates (Table 2). Exceptions occurred where our correction of type-A inaccuracy led to the exclusion of areas that were included in the CGMFC-21 map. This was the case for Indonesia, where the CGMFC-21 estimated 2,407,313 ha of mangroves but our results estimated 2,393,244 ha. The coastlines of Indonesian islands have mangroves and hills next to each other, and thus both the MFW and CGMFC-21 maps delineate a considerably large area of non-mangroves as mangroves. Our study corrected those inaccuracies.

4. Discussion

In this study, we presented a global mangrove height map at 30 m pixel resolution. None of the current global mangrove maps differentiate among mangroves of different heights. One hectare of 39 m tall mangroves in Papua, Indonesia, and another hectare of 3 m tall mangroves in the Florida Keys, USA, are identical in the current mangrove area maps—just one hectare of mangroves.
In reality, taller and shorter mangroves perform different ecosystem functions. Studies suggest that the biogeographical regions with taller mangroves are associated with more mangrove-dwelling vertebrate species [52]. Taller mangroves also contain higher aboveground biomass and sequester more carbon from the atmosphere compared to shorter mangroves. Although the soil carbon content of mangrove forests depends on many factors, results from recent global studies may indicate that the biogeography, soil, and climate that are conducive to the growth of taller mangroves may also contribute positively to higher soil carbon contents [53]. For example, the soil carbon content of taller mangrove areas in Indonesia was found to be approximately six times higher than that of shorter mangrove areas in the Dominican Republic [54]. Shorter mangrove ecosystems are characterized by rapid growth and areal expansion, shoreline stabilization, and contribution to spawning and feeding grounds and habitats for fish, other aquatic animals, and waterfowl [55]. Therefore, quantifying and mapping global mangrove height at a consistent spatial scale adds an essential dimension for monitoring the functionalities, spatiotemporal dynamics, patterns of biomass and carbon storage, and ecosystem services of mangroves.
The global mangrove height map produced in this study is reliable for use at local, regional, and global scales as it corresponds well with the results reported by previously published studies [20]: taller mangroves exist near the equator and shorter mangroves abound in other areas. Our results showed that the maximum heights of mangroves are likely constrained by environmental factors such as sea surface temperature that correlate well with latitude, with the taller mangroves following the warmest waters that are generally found near the equator and vice versa.
A recent study by Simard et al. [20] suggested that 74% of the global trends in maximum canopy height are affected by temperature and cyclone frequency, with other geophysical factors influencing the observed variability at local and regional scales. Additional research is necessary to elucidate how environmental conditions limit or optimize mangrove height and how they may be impacted by climate change. The frequency distribution of canopy heights demonstrated that the taller the mangroves, the scarcer they are (Figure 3B). This is a significant pattern with global implications for directing mangrove conservation and climate mitigation efforts. Given the scarcity of taller mangroves, their conservation should take precedence. The mangrove height map produced in this study provides a resource for conservation agencies and policymakers to identify shorter and taller mangroves within each country or area of interest to manage and conserve those forests accordingly.
In addition to type-A inaccuracy, our analysis indicated that another type of inaccuracy (termed type-B) is also present in the global maps of mangrove distribution. Some coastal areas with vegetation heights < 40 m but not mangroves are delineated as mangroves in the current maps. Two examples of type-B inaccuracy are given in Figure 5.
Using our global mangrove height map and Google Earth images, we were able to visually locate the type-B inaccuracy areas in different parts of the world, although the cumulative areas under type-B inaccuracy seemed to be relatively small compared to the regions under type-A inaccuracy. The present study was based on mangrove heights only, and thus it could not automatically identify the areas with type-B inaccuracy. Therefore, those areas are still included in our global mangrove height map. One suggestion to correct the type-B inaccuracy would be to superimpose country-level residential and land use maps on the mangrove map produced in this study and further refine the map by excluding the known non-mangrove areas.
Additionally, we realized that the mangrove canopy height model in this study has other limitations; in particular, the mangrove field height data used in developing the model may not truly represent the tallest mangrove in the world, as the study by Simard et al. [20] discovered that the tallest mangrove in the world was recorded in Gabon, West Africa, with a height of 62.8 m. One significant issue to resolve from this study is to update the current extent of mangroves and biomass with newer remotely sensed data that possess high spatial accuracy as there may be significant changes that have occurred in mangrove extent across the world in recent times since the launch of SRTM in February 2000. As a result, using higher-resolution SAR data such as TanDEM-X, ICESat, and GEDI may further refine the global mangrove map by identifying and excluding constructed areas, housing, and other known non-mangrove land cover [56].
Results from our study revealed the distribution patterns of mangrove biomass in the Northern and Southern Hemispheres. Even though the areal coverage of mangroves was higher in the Northern Hemisphere, total mangrove biomass was higher in the Southern Hemisphere. These high spatial resolution estimates of mangrove biomass can be combined with the global mangrove soil carbon data [57] and annual mangrove deforestation and land use conversion data [58] to examine the carbon loss due to disturbance and land change of global mangroves.

5. Conclusions

In this study, we investigated the reliability of SRTM-based elevation data to characterize global patterns of mangrove canopy height and aboveground biomass. Despite the limitations of SRTM-based elevation data, such as the fact that our produced empirical model may not truly represent the tallest mangrove in the world, this study demonstrated that SRTM-based elevation data perform well for discerning mangrove height across latitude and for characterizing aboveground biomass of mangroves between the Northern and Southern Hemispheres. Our model showed good agreement between modeled and measured canopy height from all sites, which covered a geographic range from 25.48° N to 27.28° S latitude, as illustrated by higher R2 and small values of MAE and RMSE (R2 = 0.82, 2.62 m, and 3.36 m). Our results indicate that although the area coverage of mangroves was higher in the Northern Hemisphere, total mangrove standing biomass was higher in the Southern Hemisphere. Our model also showed that taller mangroves were more concentrated near the equator region and became shorter as the latitude increased. Such findings of mangrove height differentiation among the globe in both hemispheres provide clear evidence that mangrove population dynamics may be driven by climate change, nutrient availability, environmental stresses, and other anthropogenic activities. In addition, we refined the estimation of global mangrove area and canopy heights at 30 m resolution by removing 562,800 pixels with height values >40 m (called type-A inaccuracy). Our results revealed that 10,639,916 ha of mangroves existed globally in the year 2000, with a total AGB of 1.696 Gt. Additional research using recent satellite imagery data that are freely available, e.g., TanDEM-X, GEDI, and ICESat, is recommended to improve the current extent of global mangroves and their corresponding aboveground biomass. The global mangrove height equation for northern and southern mangroves produced from this study can be used by relevant stakeholders as an important reference for developing an appropriate management plan for the sustainability of the global mangrove ecosystem.

Author Contributions

Conceptualization, A.A; methodology, A.A.; software, A.A.; validation, A.A., M.O.A.; formal analysis, A.A; writing—original draft preparation, A.A.; writing—review and editing, M.O.A.; A.A.; visualization, A.A.; funding acquisition, M.O.A. All authors have read and agreed to the published version of the manuscript.

Funding

This project was funded by the Deanship of Scientific Research (DSR) at King Abdulaziz University, Jeddah, under grant no. (G:434-130-1442).

Acknowledgments

The authors thank the Deanship of Scientific Research (DSR) at King Abdulaziz University, Jeddah, for technical and financial support. The authors thanks Faiz Rahman for his constructive inputs in the manuscript.

Conflicts of Interest

The authors declare no conflict of interest.

References

  1. Guannel, G.; Arkema, K.; Ruggiero, P.; Verutes, G. The Power of Three: Coral Reefs, Seagrasses and Mangroves Protect Coastal Regions and Increase Their Resilience. PLoS ONE 2016, 11, e0158094. [Google Scholar] [CrossRef] [PubMed]
  2. Hutchison, J.; Spalding, M.; zu Ermgassen, P. The role of mangroves in fisheries enhancement. Nature Conserv. Wetl. Int. 2014, 54, 434. [Google Scholar]
  3. Donato, D.C.; Kauffman, J.B.; Murdiyarso, D.; Kurnianto, S.; Stidham, M.; Kanninen, M. Mangroves among the Most Carbon-Rich Forests in the Tropics. Nat. Geosci. 2011, 4, 293–297. [Google Scholar] [CrossRef]
  4. Pendleton, L.; Donato, D.C.; Murray, B.C.; Crooks, S.; Jenkins, W.A.; Sifleet, S.; Craft, C.; Fourqurean, J.W.; Kauffman, J.B.; Marbà, N.; et al. Estimating Global “Blue Carbon” Emissions from Conversion and Degradation of Vegetated Coastal Ecosystems. PLoS ONE 2012, 7, e43542. [Google Scholar] [CrossRef] [PubMed]
  5. Siikamäki, J.; Sanchirico, J.N.; Jardine, S.L. Global Economic Potential for Reducing Carbon Dioxide Emissions from Mangrove Loss. Proc. Natl. Acad. Sci. USA 2012, 109, 14369–14374. [Google Scholar] [CrossRef] [PubMed]
  6. Polidoro, B.A.; Carpenter, K.E.; Collins, L.; Duke, N.C.; Ellison, A.M.; Ellison, J.C.; Farnsworth, E.J.; Fernando, E.S.; Kathiresan, K.; Koedam, N.E.; et al. The Loss of Species: Mangrove Extinction Risk and Geographic Areas of Global Concern. PLoS ONE 2010, 5, e10095. [Google Scholar] [CrossRef] [PubMed]
  7. Hamilton, S.E.; Casey, D. Creation of a High Spatio-Temporal Resolution Global Database of Continuous Mangrove Forest Cover for the 21st Century (CGMFC-21). Glob. Ecol. Biogeogr. 2016, 25, 729–738. [Google Scholar] [CrossRef]
  8. Osborne, D.J.; Spalding, M.D.; Blasco, F.; Field, C.D. (Eds.) World Mangrove Atlas. International Society for Mangrove Ecosystems, Okinawa 903-01, Japan. 178 pp. ISBN 4-906584-03-9. Price US$ 60.00 (Hardback). J. Trop. Ecol. 1998, 14, 723–724. [Google Scholar] [CrossRef]
  9. Giri, C.; Ochieng, E.; Tieszen, L.L.; Zhu, Z.; Singh, A.; Loveland, T.; Masek, J.; Duke, N. Status and Distribution of Mangrove Forests of the World Using Earth Observation Satellite Data. Glob. Ecol. Biogeogr. 2011, 20, 154–159. [Google Scholar] [CrossRef]
  10. Lagomasino, D.; Fatoyinbo, T.; Lee, S.K.; Feliciano, E.; Trettin, C.; Simard, M. A Comparison of Mangrove Canopy Height Using Multiple Independent Measurements from Land, Air, and Space. Remote Sens. 2016, 8, 327. [Google Scholar] [CrossRef]
  11. Persson, H.; Wallerman, J.; Olsson, H.; Fransson, J.E.S. Estimating Forest Biomass and Height Using Optical Stereo Satellite Data and a DTM from Laser Scanning Data. Can. J. Remote Sens. 2014, 39, 251–262. [Google Scholar] [CrossRef]
  12. Aljahdali, M.O.; Munawar, S.; Khan, W.R. Monitoring Mangrove Forest Degradation and Regeneration: Landsat Time Series Analysis of Moisture and Vegetation Indices at Rabigh Lagoon, Red Sea. Forests 2021, 12, 52. [Google Scholar] [CrossRef]
  13. Ellison, J.C. Factors Influencing Mangrove Ecosystems. In Mangroves: Ecology, Biodiversity and Management; Springer: Singapore, 2021; pp. 97–115. [Google Scholar] [CrossRef]
  14. Lugo, A.E.; Snedaker, S.C. The Ecology of Mangroves. Annu. Rev. Ecol. Syst. 2003, 5, 39–64. [Google Scholar] [CrossRef]
  15. Tomlinson, P.B. The Botany of Mangroves; Cambridge University Press: Cambridge, UK, 2016. [Google Scholar] [CrossRef]
  16. Alongi, D.M. Present State and Future of the World’s Mangrove Forests. Environ. Conserv. 2002, 29, 331–349. [Google Scholar] [CrossRef]
  17. Blasco, F.; Saenger, P.; Janodet, E. Mangroves as Indicators of Coastal Change. CATENA 1996, 27, 167–178. [Google Scholar] [CrossRef]
  18. Twilley, R.R.; Chen, R.H.; Hargis, T. Carbon Sinks in Mangroves and Their Implications to Carbon Budget of Tropical Coastal Ecosystems. Water Air Soil Pollut. 1992, 64, 265–288. [Google Scholar] [CrossRef]
  19. Duke, N.C.; Schmitt, K. Mangroves: Unusual Forests at the Seas Edge. In Tropical Forestry Handbook; Springer: Berlin/Heidelberg, Germany, 2015; pp. 1–24. [Google Scholar] [CrossRef]
  20. Simard, M.; Fatoyinbo, L.; Smetanka, C.; Rivera-Monroy, V.H.; Castañeda-Moya, E.; Thomas, N.; Van der Stocken, T. Mangrove Canopy Height Globally Related to Precipitation, Temperature and Cyclone Frequency. Nat. Geosci. 2019, 12, 40–45. [Google Scholar] [CrossRef]
  21. Komiyama, A.; Ong, J.E.; Poungparn, S. Allometry, Biomass, and Productivity of Mangrove Forests: A Review. Aquat. Bot. 2008, 89, 128–137. [Google Scholar] [CrossRef]
  22. Aslan, A.; Rahman, A.F.; Warren, M.W.; Robeson, S.M. Mapping Spatial Distribution and Biomass of Coastal Wetland Vegetation in Indonesian Papua by Combining Active and Passive Remotely Sensed Data. Remote Sens. Environ. 2016, 183, 65–81. [Google Scholar] [CrossRef]
  23. Simard, M.; Pinto, N.; Fisher, J.B.; Baccini, A. Mapping Forest Canopy Height Globally with Spaceborne Lidar. J. Geophys. Res. Biogeosci. 2011, 116, 4021. [Google Scholar] [CrossRef]
  24. Fatoyinbo, T.E.; Simard, M. Height and Biomass of Mangroves in Africa from ICESat/GLAS and SRTM. Int. J. Remote Sens. 2012, 34, 668–681. [Google Scholar] [CrossRef]
  25. Fatoyinbo, T.E.; Simard, M.; Washington-Allen, R.A.; Shugart, H.H. Landscape-Scale Extent, Height, Biomass, and Carbon Estimation of Mozambique’s Mangrove Forests with Landsat ETM+ and Shuttle Radar Topography Mission Elevation Data. J. Geophys. Res. Biogeosci. 2008, 113, G2. [Google Scholar] [CrossRef]
  26. Simard, M.; Rivera-Monroy, V.H.; Mancera-Pineda, J.E.; Castañeda-Moya, E.; Twilley, R.R. A Systematic Method for 3D Mapping of Mangrove Forests Based on Shuttle Radar Topography Mission Elevation Data, ICEsat/GLAS Waveforms and Field Data: Application to Ciénaga Grande de Santa Marta, Colombia. Remote Sens. Environ. 2008, 112, 2131–2144. [Google Scholar] [CrossRef]
  27. Lee, S.K.; Fatoyinbo, T.; Lagomasino, D.; Osmanoglu, B.; Simard, M.; Trettin, C.; Rahman, M.; Ahmed, I. Large-Scale Mangrove Canopy Height Map Generation from TanDEM-X Data by Means of Pol-InSAR Techniques. Int. Geosci. Remote Sens. Symp. 2015, 2015, 2895–2898. [Google Scholar] [CrossRef]
  28. Aslan, A.; Rahman, A.F.; Robeson, S.M. Investigating the Use of Alos Prism Data in Detecting Mangrove Succession through Canopy Height Estimation. Ecol. Indic. 2017, 87, 136–143. [Google Scholar] [CrossRef]
  29. Ximenes, A.C.; Ponsoni, L.; Lira, C.F.; Koedam, N.; Dahdouh-Guebas, F. Does Sea Surface Temperature Contribute to Determining Range Limits and Expansion of Mangroves in Eastern South America (Brazil)? Remote Sens. 2018, 10, 1787. [Google Scholar] [CrossRef]
  30. Woodroffe, C.D.; Grindrod, J. Mangrove Biogeography: The Role of Quaternary Environmental and Sea-Level Change. J. Biogeogr. 1991, 18, 479. [Google Scholar] [CrossRef]
  31. Kauffman, J.B.; Donato, D.C. Protocols for the Measurement, Monitoring and Reporting of Structure, Biomass and Carbon Stocks in Mangrove Forests; CIFOR: Bogor, Indonesia, 2012. [Google Scholar]
  32. Mizanur Rahman, M.; Nabiul Islam Khan, M.; Fazlul Hoque, A.K.; Ahmed, I. Carbon Stock in the Sundarbans Mangrove Forest: Spatial Variations in Vegetation Types and Salinity Zones. Wetl. Ecol. Manag. 2015, 23, 269–283. [Google Scholar] [CrossRef]
  33. Kangkuso, A.; Jamili, J.; Septiana, A.; Raya, R.; Sahidin, I.; Rianse, U.; Rahim, S.; Alfirman, A.; Sharma, S.; Nadaoka, K. Allometric models and aboveground biomass of Lumnitzera racemosa Willd. Forest in Rawa Aopa Watumohai National Park, Southeast Sulawesi, Indonesia. For. Sci. Technol. 2016, 12, 43–50. [Google Scholar]
  34. Bismark, M.; Subiandono, E.; Heriyanto, N.M. Keragaman dan potensi jenis serta kandungan karbon hutan mangrove di Sungai Subelen Siberut, Sumatera Barat. J. Penelit. Hutan Konserv. Alam 2008, 5, 297–306. [Google Scholar] [CrossRef]
  35. Wannasiri, W.; Nagai, M.; Honda, K.; Santitamnont, P.; Miphokasap, P. Extraction of mangrove biophysical parameters using airborne LiDAR. Remote Sens. 2013, 5, 1787–1808. [Google Scholar] [CrossRef]
  36. Wang, G.; Guan, D.M.; Peart, R.; Chen, Y.; Peng, Y. Ecosystem carbon stocks of mangrove forest in Yingluo Bay, Guangdong Province of South China. For. Ecol. Manag. 2013, 310, 539–546. [Google Scholar] [CrossRef]
  37. Goessens, A.; Satyanarayana, B.; van der Stocken, T.; Zuniga, M.Q.; Mohd-Lokman, H.; Sulong, I.; Dahdouh-Guebas, F. Is Matang Mangrove Forest in Malaysia sustainably rejuvenating after more than a century of conservation and harvesting management? PLoS ONE 2014, 9, e105069. [Google Scholar] [CrossRef] [PubMed]
  38. Shah, K.; Kamal, A.H.M.; Rosli, Z.; Hakeem, K.R.; Hoque, M.M. Composition and diversity of plants in Sibuti mangrove forest, Sarawak, Malaysia. For. Sci. Technol. 2016, 12, 70–76. [Google Scholar] [CrossRef]
  39. Rajkumar, S.Y.; Ketan, M.; Salvi, H.; Kamboj, R.D. Age and Growth relation of mangrove Avicennia marina (Forssk.) Vierh. In Gulf of Kachchh (GoK), India. Gulf of Kachchh (Gok), India (22 June 2018). Appl. Sci. Rep. 2017, 17. [Google Scholar] [CrossRef]
  40. Krauss, K.W.; Thomas, W.D.; Twilley, R.R.; Smith, T.J., III; Whelan, K.R.T.; Sullivan, K.J. Woody Debris in the Mangrove Forests of South Florida 1. Biotrop. J. Biol. Conserv. 2005, 37, 9–15. [Google Scholar]
  41. Lovelock, C.E.; Marilyn, C.B.; Martin, K.C.; Feller, I.C. Nutrient enrichment increases mortality of mangroves. PLoS ONE 2009, 4, e5600. [Google Scholar] [CrossRef]
  42. Loría-Naranjo, M.; Samper-Villarreal, J.; Cortés, J. Structural complexity and species composition of Potrero Grande and Santa Elena mangrove forests in Santa Rosa National Park, North Pacific of Costa Rica. Rev. Biol. Trop. 2014, 62, 33–41. [Google Scholar] [CrossRef]
  43. Blanco, J.F.; Bejarano, A.C.; Lasso, J.; Cantera, J.R. A new look at computation of the complexity index in mangroves: Do disturbed forests have clues to analyze canopy height patchiness? Wetl. Ecol. Manag. 2011, 9, 91–101. [Google Scholar] [CrossRef]
  44. Zamprogno, G.C.; Tognella, M.M.P.; Quaresma, V.D.S.; da Costa, M.B.; Pascoalini, S.S.; Couto, G.F.D. The structural heterogeneity of an urbanised mangrove forest area in southeastern Brazil: Influence of environmental factors and anthropogenic stressors. Braz. J. Oceanogr. 2016, 64, 157–172. [Google Scholar] [CrossRef] [Green Version]
  45. Bandeira, S.O.; Macamo, C.C.F.; Kairo, J.G.; Amade, F.; Jiddawi, N.; Paula, J. Evaluation of mangrove structure and condition in two trans-boundary areas in the Western Indian Ocean. Aquatic Conserv. Mar. Freshwater Ecosyst. 2009, 19, S46–S55. [Google Scholar] [CrossRef]
  46. Simard, M.; Zhang, K.; Rivera-Monroy, V.; Ross, M.; Ruiz, P.; Castañeda-Moya, E.; Twilley, R.; Rodriguez, E. Mapping Height and Biomass of Mangrove Forests in Everglades National Park with SRTM Elevation Data. Photogramm. Eng. Remote Sens. 2006, 72, 299–311. [Google Scholar] [CrossRef]
  47. Ramsey, E.; Lu, Z.; Rangoonwala, A.; Rykhus, R. Multiple Baseline Radar Interferometry Applied to Coastal Land Cover Classification and Change Analyses. GISci. Remote Sens. 2006, 43, 283–309. [Google Scholar] [CrossRef]
  48. Pohjankukka, J.; Pahikkala, T.; Nevalainen, P.; Heikkonen, J. Estimating the Prediction Performance of Spatial Models via Spatial K-Fold Cross Validation. Int. J. Geogr. Inf. Sci. 2017, 31, 2001–2019. [Google Scholar] [CrossRef]
  49. Steyerberg, E.W.; Vickers, A.J.; Cook, N.R.; Gerds, T.; Gonen, M.; Obuchowski, N.; Pencina, M.J.; Kattan, M.W. Assessing the Performance of Prediction Models: A Framework for Some Traditional and Novel Measures. Epidemiology 2010, 21, 128. [Google Scholar] [CrossRef]
  50. Saenger, P.; Snedaker, S.C. Pantropical Trends in Mangrove Above-Ground Biomass and Annual Litterfall. Oecologia 1993, 96, 293–299. [Google Scholar] [CrossRef]
  51. Cintrón, G.; Schaeffer-Novelli, Y. Características y desarrollo estructural de los manglares de Norte y Sur América. Ciencia Interamericana 1985, 25, 4–15. [Google Scholar]
  52. Luther, D.A.; Greenberg, R. Mangroves: A Global Perspective on the Evolution and Conservation of Their Terrestrial Vertebrates. Bioscience 2009, 59, 602–612. [Google Scholar] [CrossRef]
  53. Rovai, A.S.; Twilley, R.R.; Castañeda-Moya, E.; Midway, S.R.; Friess, D.A.; Trettin, C.C.; Bukoski, J.J.; Stovall, A.E.L.; Pagliosa, P.R.; Fonseca, A.L.; et al. Macroecological Patterns of Forest Structure and Allometric Scaling in Mangrove Forests. Glob. Ecol. Biogeogr. 2021, 30, 1000–1013. [Google Scholar] [CrossRef]
  54. Boone Kauffman, J.; Arifanti, V.B.; Hernández Trejo, H.; del Carmen Jesús García, M.; Norfolk, J.; Cifuentes, M.; Hadriyanto, D.; Murdiyarso, D. The Jumbo Carbon Footprint of a Shrimp: Carbon Losses from Mangrove Deforestation. Front. Ecol. Environ. 2017, 15, 183–188. [Google Scholar] [CrossRef]
  55. Barbier, E.B. Progress and Challenges in Valuing Coastal and Marine Ecosystem Services. Rev. Environ. Econ. Policy 2020, 6, 1–19. [Google Scholar] [CrossRef] [Green Version]
  56. Rossi, C.; Gernhardt, S. Urban DEM Generation, Analysis and Enhancements Using TanDEM-X. ISPRS J. Photogramm. Remote Sens. 2013, 85, 120–131. [Google Scholar] [CrossRef]
  57. Jardine, S.L.; Siikamäki, J.V. A Global Predictive Model of Carbon in Mangrove Soils. Environ. Res. Lett. 2014, 9, 104013. [Google Scholar] [CrossRef]
  58. Hansen, M.C.; Potapov, P.V.; Moore, R.; Hancher, M.; Turubanova, S.A.; Tyukavina, A.; Thau, D.; Stehman, S.V.; Goetz, S.J.; Loveland, T.R.; et al. High-Resolution Global Maps of 21st-Century Forest Cover Change. Science 2013, 342, 850–853. [Google Scholar] [CrossRef] [Green Version]
Figure 1. Relationship between mangrove canopy height from SRTM elevation and globally distributed field-based data. Field data sites are shown as red dots on the world map (A). A linear relationship was derived between the field-based height data and SRTM elevation data (B).
Forests 13 01545 g001
Figure 2. Global mangrove canopy height map at 30 m pixel size. For clarity of display, global mangrove areas were resampled from the original 30 m SRTM pixel to 0.1° grid and shown in three different panels. (A) Asia and Australia; (B) Americas; and (C) Africa and southwest Asia.
Forests 13 01545 g002
Figure 3. Mangrove height distribution across different latitudes and height classes: (A) latitudinal distribution (38° S to 30° N) of mangrove canopy heights and the areas occupied by each height class are shown. For clarity of display, the latitudes are binned at 1° and the heights are binned at 1 m. The tallest mangroves were located near the equator, and the maximum height of mangroves declined in both hemispheres as the distance from the equator increased. Areal coverages of mangroves at each latitude and height class are shown by the color distribution. (B) Mangrove areas at different heights differed for the Northern and Southern Hemispheres.
Forests 13 01545 g003
Figure 4. Biomass distribution across classes of mangrove heights for each hemisphere and the globe. The Northern Hemisphere contained a positive skew in the distribution, whereas the Southern Hemisphere contained a normal distribution. Although the Northern Hemisphere contained more mangrove areas than the Southern Hemisphere, the Southern Hemisphere had more mangrove biomass (875.5 million tons) than the Northern Hemisphere (820.8 million tons).
Forests 13 01545 g004
Figure 5. Two examples of type-B inaccuracy are shown. A valley on the northwest coast of Bali is shown on the top right. Another area along the east coast of East Java is shown on the top left. In each case, the mangrove height maps are shown on the left, and the Google Earth images of the respective areas are shown on the right. The demarcated vegetation in both areas was non-mangrove but was included in the maps of Giri et al. [9] and Hamilton and Casey [7]. Our height-based method could not identify these areas where canopies are <40 m tall, so these areas remain as inaccuracies in our global mangrove height maps.
Forests 13 01545 g005
Table 1. Locations and mangrove species that were represented in the field data set that was used to produce the ‘height vs. SRTM model’ in this study.
NoLocationSRTM ElevationField Mangrove HeightLongitudeLatitudeMangrove SpeciesReferences
1Mahakam Delta, Indonesia5.010.0117.5296327−0.614998372R. mucronata, A. germinans, Nypa fruticans, S. alba, R. apiculata, Bruguiera sp.Unpublished field data
2Mimika Papua, Indonesia7.08.0136.7123396−4.797423469R. mucronata, R. apiculata, R. stylosa, Avicennia sp., Sonneratia sp., Nypa fruticans, S. alba, R. apiculata, B. exaristat, B. gymnorrhiza, B. hainesii, B. parviflora, B. sexangula, B. cylindrica, Ceriops, Camptostemon, LumnitzeraUnpublished field data
3Sundarbans, Bangladesh10.09.289.4964204722.07774034Heritiera fomes, Nypa fruticans, Bruguiera gymnorrhiza, R. apiculata, R. mucronata, Xylocarpus granatum, X. mekongensisUnpublished field data
4Asmat Papua, Indonesia21.625.0138.0509175−5.47876875R. mucronata, R. apiculata, R. stylosa, Avicennia sp., Sonneratia sp., Nypa fruticans, S. alba, R. apiculata, B. exaristat, B. gymnorrhiza, B. hainesii, B. parviflora, B. sexangula, B. cylindrica, Ceriops, CamptostemonUnpublished field data
5Arguni Bay Papua, Indonesia18.719.4133.7809701−3.07832475R. mucronata, R. apiculata, R. stylosa, Avicennia sp., Sonneratia sp., Nypa fruticans, S. alba, R. apiculata, Bruguiera sp.Unpublished field data
6Southeast Sulawesi-Indonesia9.08.2122.056104−4.553076L. racemosaKangkuso et al. [33]
7Siberut, Indonesia20.020.599.0538105−1.3072485R. apiculata, R. mucronata, B. cylindrica, B. gymnorrhiza, Xylocarpus granatum, Barringtonia racemosa, Ceriops tagal, Aegyceras corniculatum, Lumnitzera littorea, Avicennia albaBismark et al. [34]
8Thailand3.02.8102.152919912.52941738Avicennia alba, Avicennia officinalisWannasiri et al. [35]
9Yingluo Bay, China2.02.4109.75931221.56500025Avicennia marina, Sonneratia apetala, A. corniculatum, K. obavata, B. gymnorrhiza, R. stylosaWang et al. [36]
10Matang, Malaysia17.514.8100.60038474.853099667R. apiculata, B. parvilora, B. sexangula, R. mucronata, Avicennia albaGoessens et al. [37]
11Sibuti Serawak, Malaysia21.019.6113.7369453.987122667R. apiculata, X. granatum, X. mekongensis, Nypa fruticans, Intsia bijuga, Thespesia populnea, Excoecaria agallocha, Acrostichum speciosum, Phoenix paludosaShah et al. [38]
12Gulf of Kutch, India4.04.069.8775517522.48217463A. marinaRajkumar et al. [39]
13Everglades Florida, United States5.39.9−81.0610261325.4852244R. mangle, A. germinans, L. racemosaKrauss et al. [40]
14Brisbane, Australia8.78.5153.033468−27.282594A. marinaLovelock et al. [41]
15Exmouth, Australia4.01.5113.94707−21.961995A. marinaLovelock et al. [41]
16Hinchinbrook, Australia6.06.0146.166667−18.333333R. mangle, A. germinans, R. lamarckiiLovelock et al. [41]
17Port Douglas, Australia5.02.0145.44973−16.499527R. mangle, A. marinaLovelock et al. [41]
18Twin Cay, Belize4.07.0−88.10041916.832535R. mangleLovelock et al. [41]
19Potrero Grande, Costa Rica14.08.8−85.78643610.851285A. germinans, L. racemosa, R. mangle, R. racemosa, P. rhizophoraeLoría-Naranjo et al. [42]
20Santa Elena, Costa Rica10.17.0−85.7844810.91266A. germinans, A. bicolor, L. racemosa, R. mangle, R. racemosa, P. rhizophoraeLoría-Naranjo et al. [42]
21Buenaventura Bay, Colombia23.024.2−77.0913943.830060111R. mangle, R. racemosa, A. germinans, L. racemosa, Pelliciera rhizophoraeBlanco et al. [43]
22Vitoria Bay, Brazil4.67.9−40.33386427−20.27102091Avicennia schaueriana, L. racemosa, R. mangleZamprogno et al. [44]
23Mngoji2, Mozambique7.83.840.36687−10.361206A. marina, C. tagal, R. mucronata, S. albaBandeira et al. [45]
24Mngoji1, Mozambique7.55.240.414096−10.346828A. marina, R. mucronata, S. albaBandeira et al. [45]
25Ulo, Mozambique7.32.740.447664−11.415561A. marina, C. tagal, R. mucronata, S. albaBandeira et al. [45]
26Luchete, Mozambique8.42.240.425148−11.585771A. marina, C. tagal, R. mucronata, S. albaBandeira et al. [45]
27Ibo, Mozambique6.83.040.57073−12.384053A. marina, C. tagal, R. mucronata, S. albaBandeira et al. [45]
28Pemba, Mozambique7.33.440.485629−13.050629A. marina, B. gymnorhiza, C. tagal, R. mucronata, S. albaBandeira et al. [45]
29Mecufi, Mozambique7.03.240.54862−13.296666A. marina, B. gymnorhiza, C. tagal, R. mucronata, S. albaBandeira et al. [45]
30Saco, Mozambique5.03.932.914154−26.035665A. marina, B. gymnorhiza, C. tagal, R. mucronataBandeira et al. [45]
31Sangala, Mozambique5.82.532.944879−25.991996A. marina, B. gymnorhiza, C. tagal, R. mucronataBandeira et al. [45]
Table 2. Mangrove area and biomass of the 15 most mangrove-rich countries in the world. A comparison of MFW, CGMFC-21, and our results are shown. The areas (ha) of tall (≥20 m) and short-to-medium (<20 m) mangroves and total mangrove biomass (tons) are also provided.
NoCountryMFW
(ha)
CGMFC-21
(ha)
This Study
(ha)
Tall
≥20 m
(ha)
Short to Medium <20 m
(ha)
Aboveground Biomass (tons)
1Indonesia3,112,9892,407,3132,393,244562,5961,830,648472,150,415
2Brazil962,683772,131853,902112,345741,556150,725,476
3Australia977,975332,651770,1677806762,36198,882,395
4Nigeria653,669265,704568,23525,147543,08874,975,813
5Malaysia505,386496,868497,11620,937476,17883,931,536
6Papua New Guinea480,121418,992426,987122,093304,89493,626,647
7Mexico741,917302,103390,9229803381,12054,288,866
8Bangladesh436,570177,390366,710853365,85652,675,523
9Myanmar494,584279,260323,39812,893310,50547,050,344
10Mozambique318,851122,620276,396556275,84032,788,751
11Guinea Bissau 338,65274,518238,901891238,01029,593,836
12Cuba421,538166,036227,513240227,27328,682,781
13Philippines263,137209,105218,8832029216,85425,492,129
14Madagascar278,07885,222214,9141057213,85730,091,223
15India368,27682,506159,7702940156,83020,015,239
Publisher’s Note: MDPI stays neutral with regard to jurisdictional claims in published maps and institutional affiliations.

