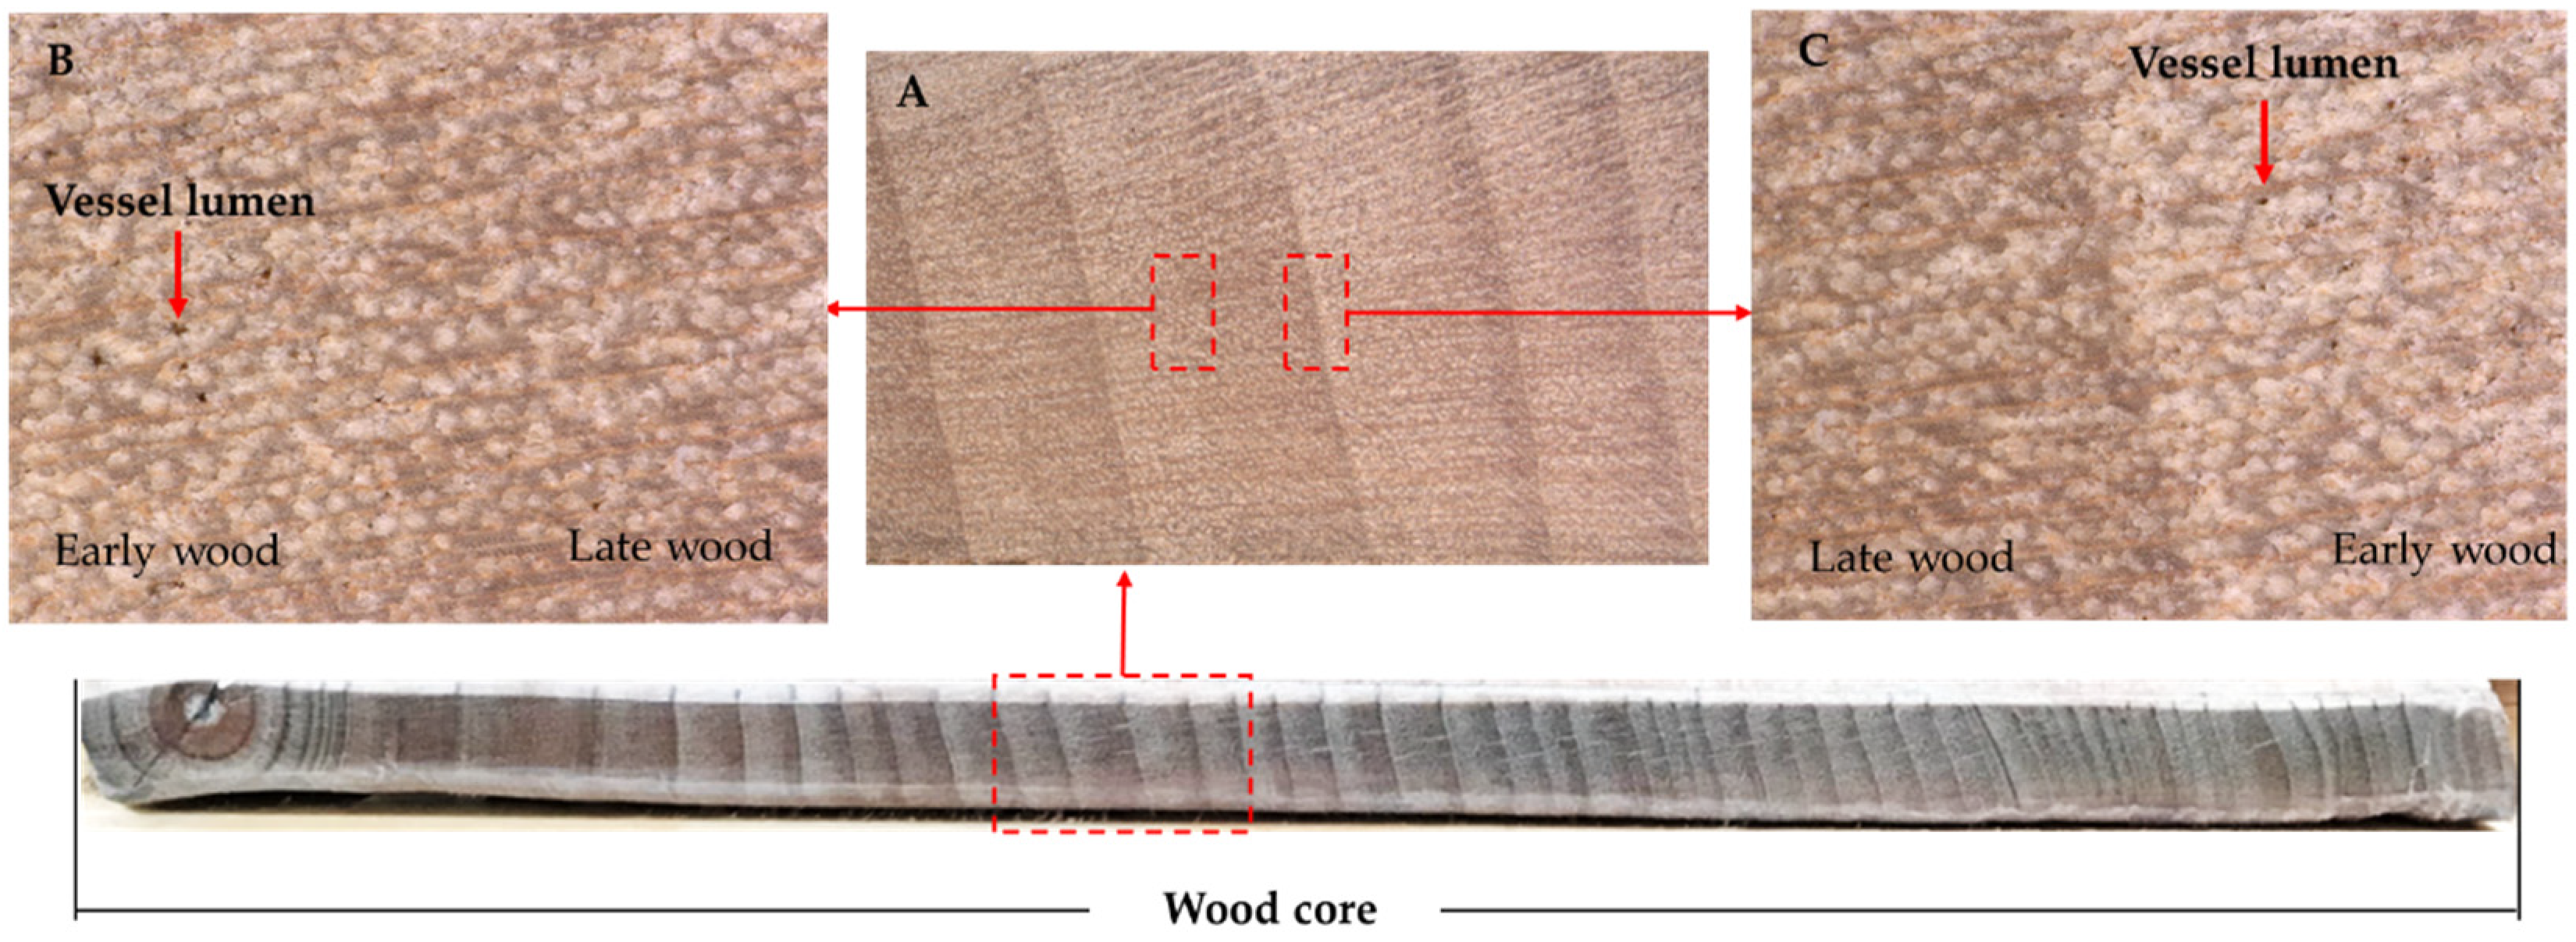
Figure 1.
The cross section of wood core of S. superba in 54-year-old. (A) Locally enlarged part of wood core, the pale band was early wood and the dark band was late wood. (B) The transition between early wood and late wood on a left-to-right time axis. The early wood had larger vessel lumen and more vessel elements, while the late wood had smaller vessel lumen and less vessel elements. (C) The annual ring border between late wood and early wood.
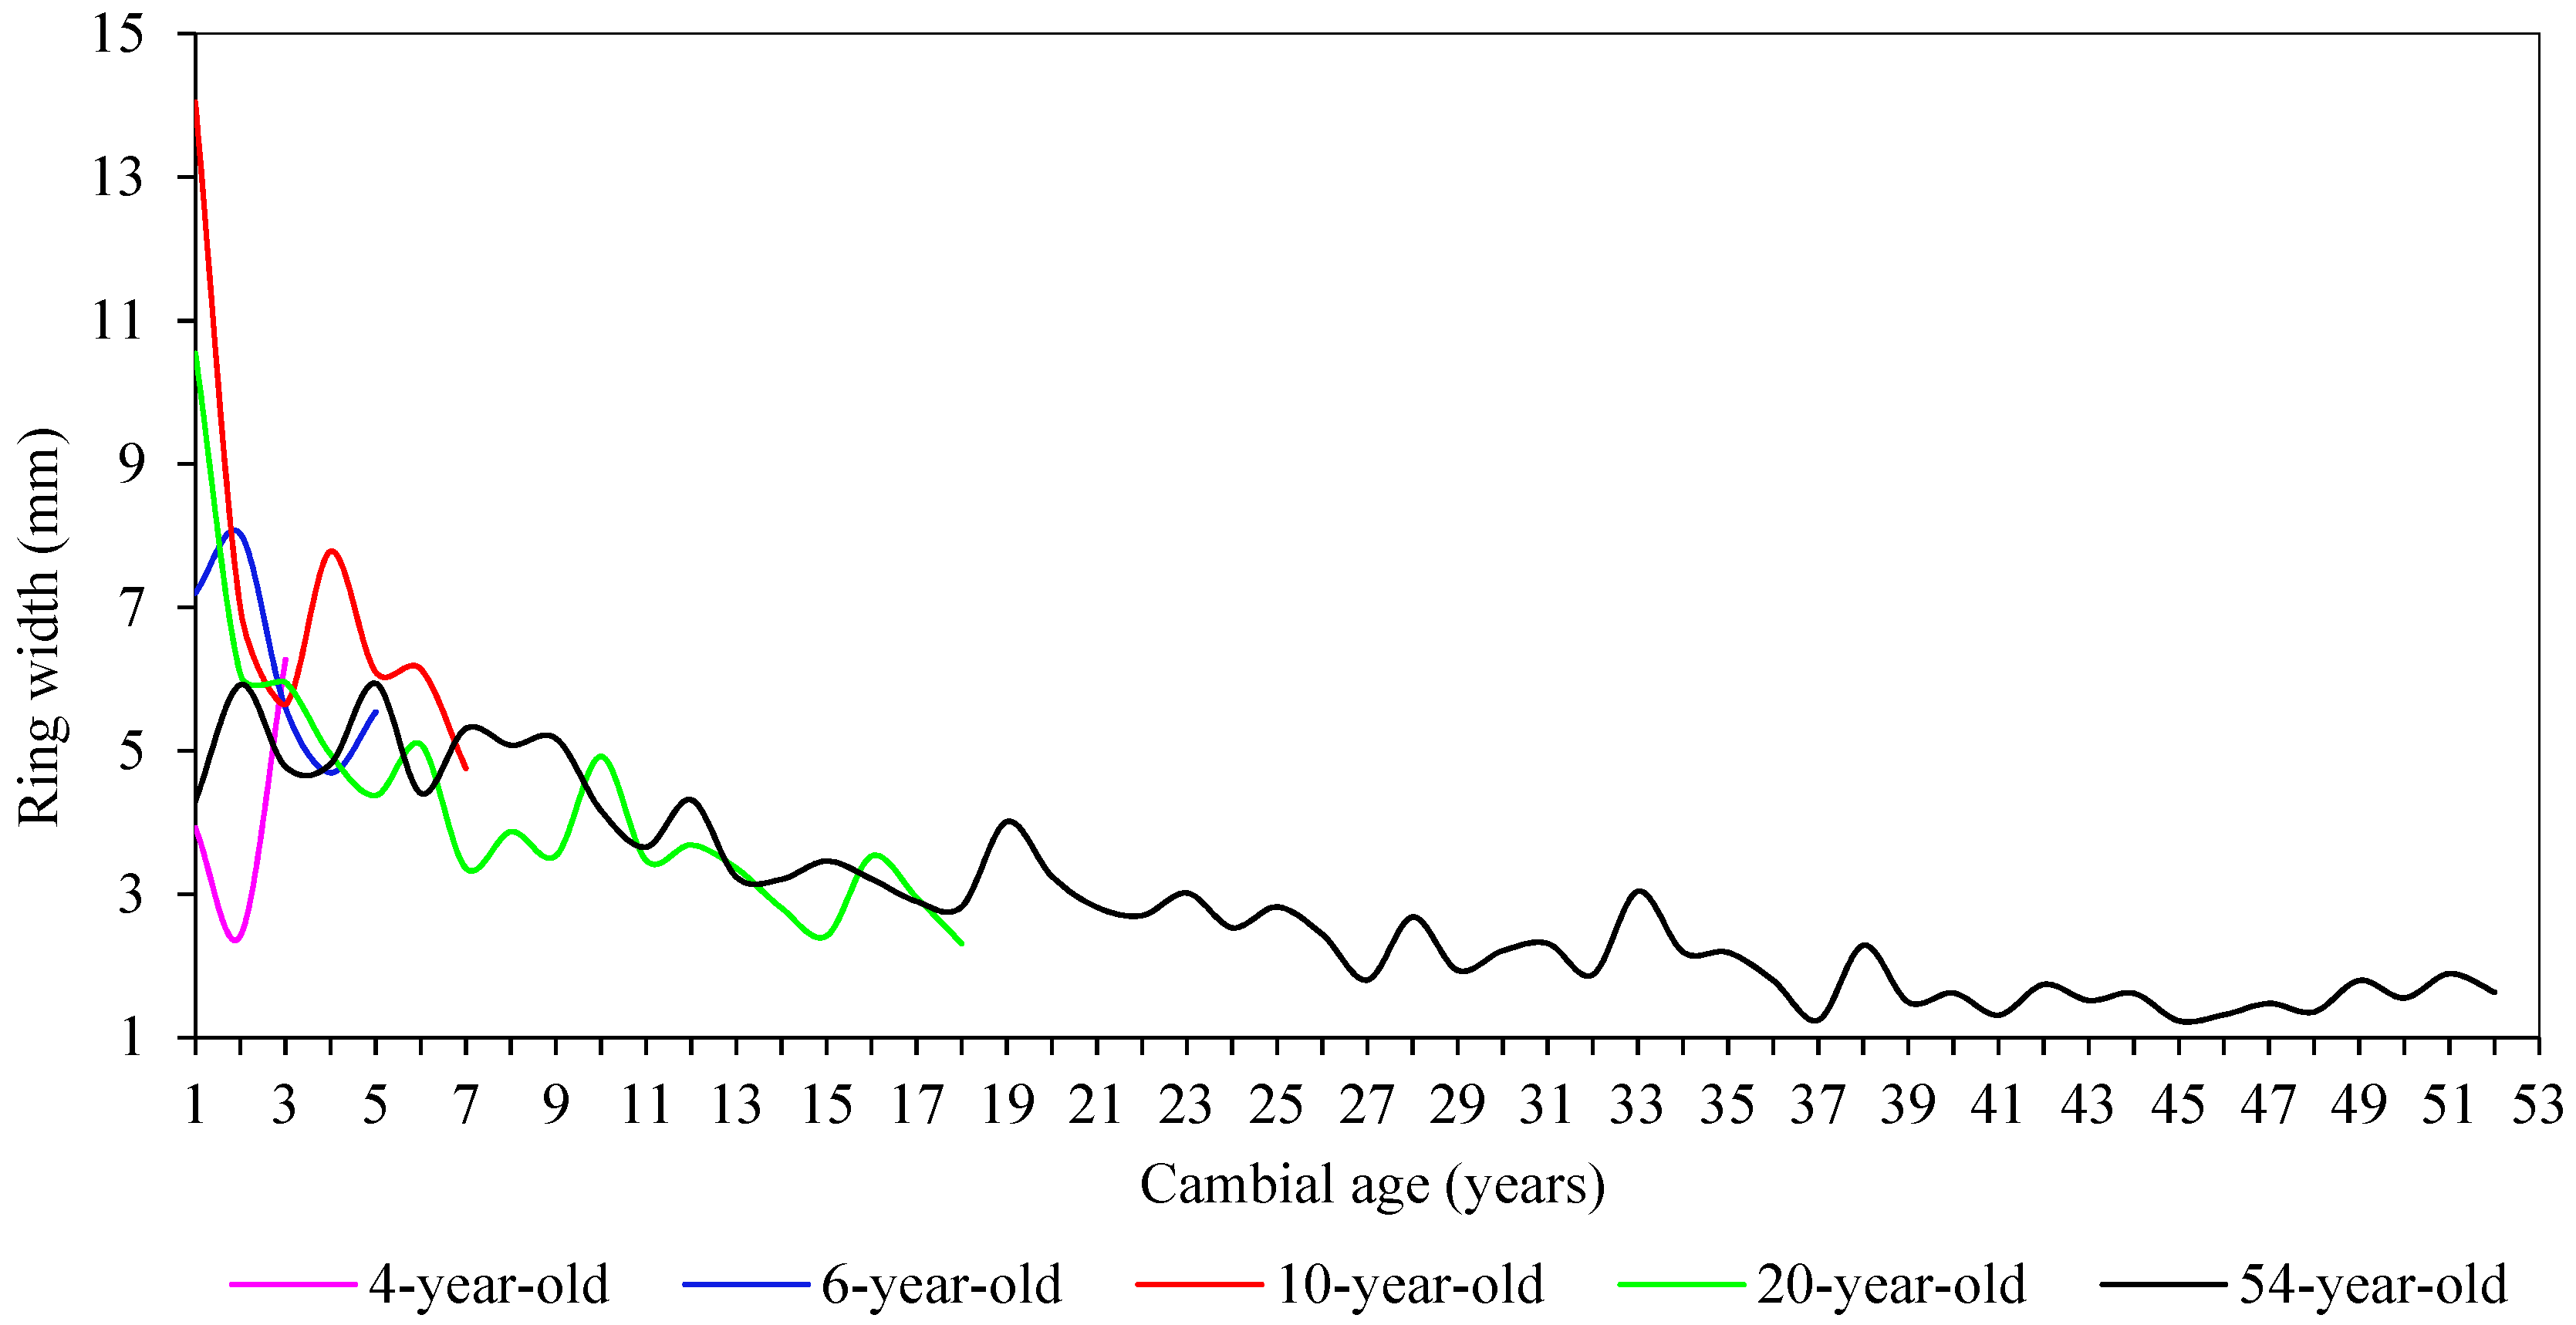
Figure 2.
The radial variation of annual ring width versus cambial age of S. superba.
Figure 2.
The radial variation of annual ring width versus cambial age of S. superba.
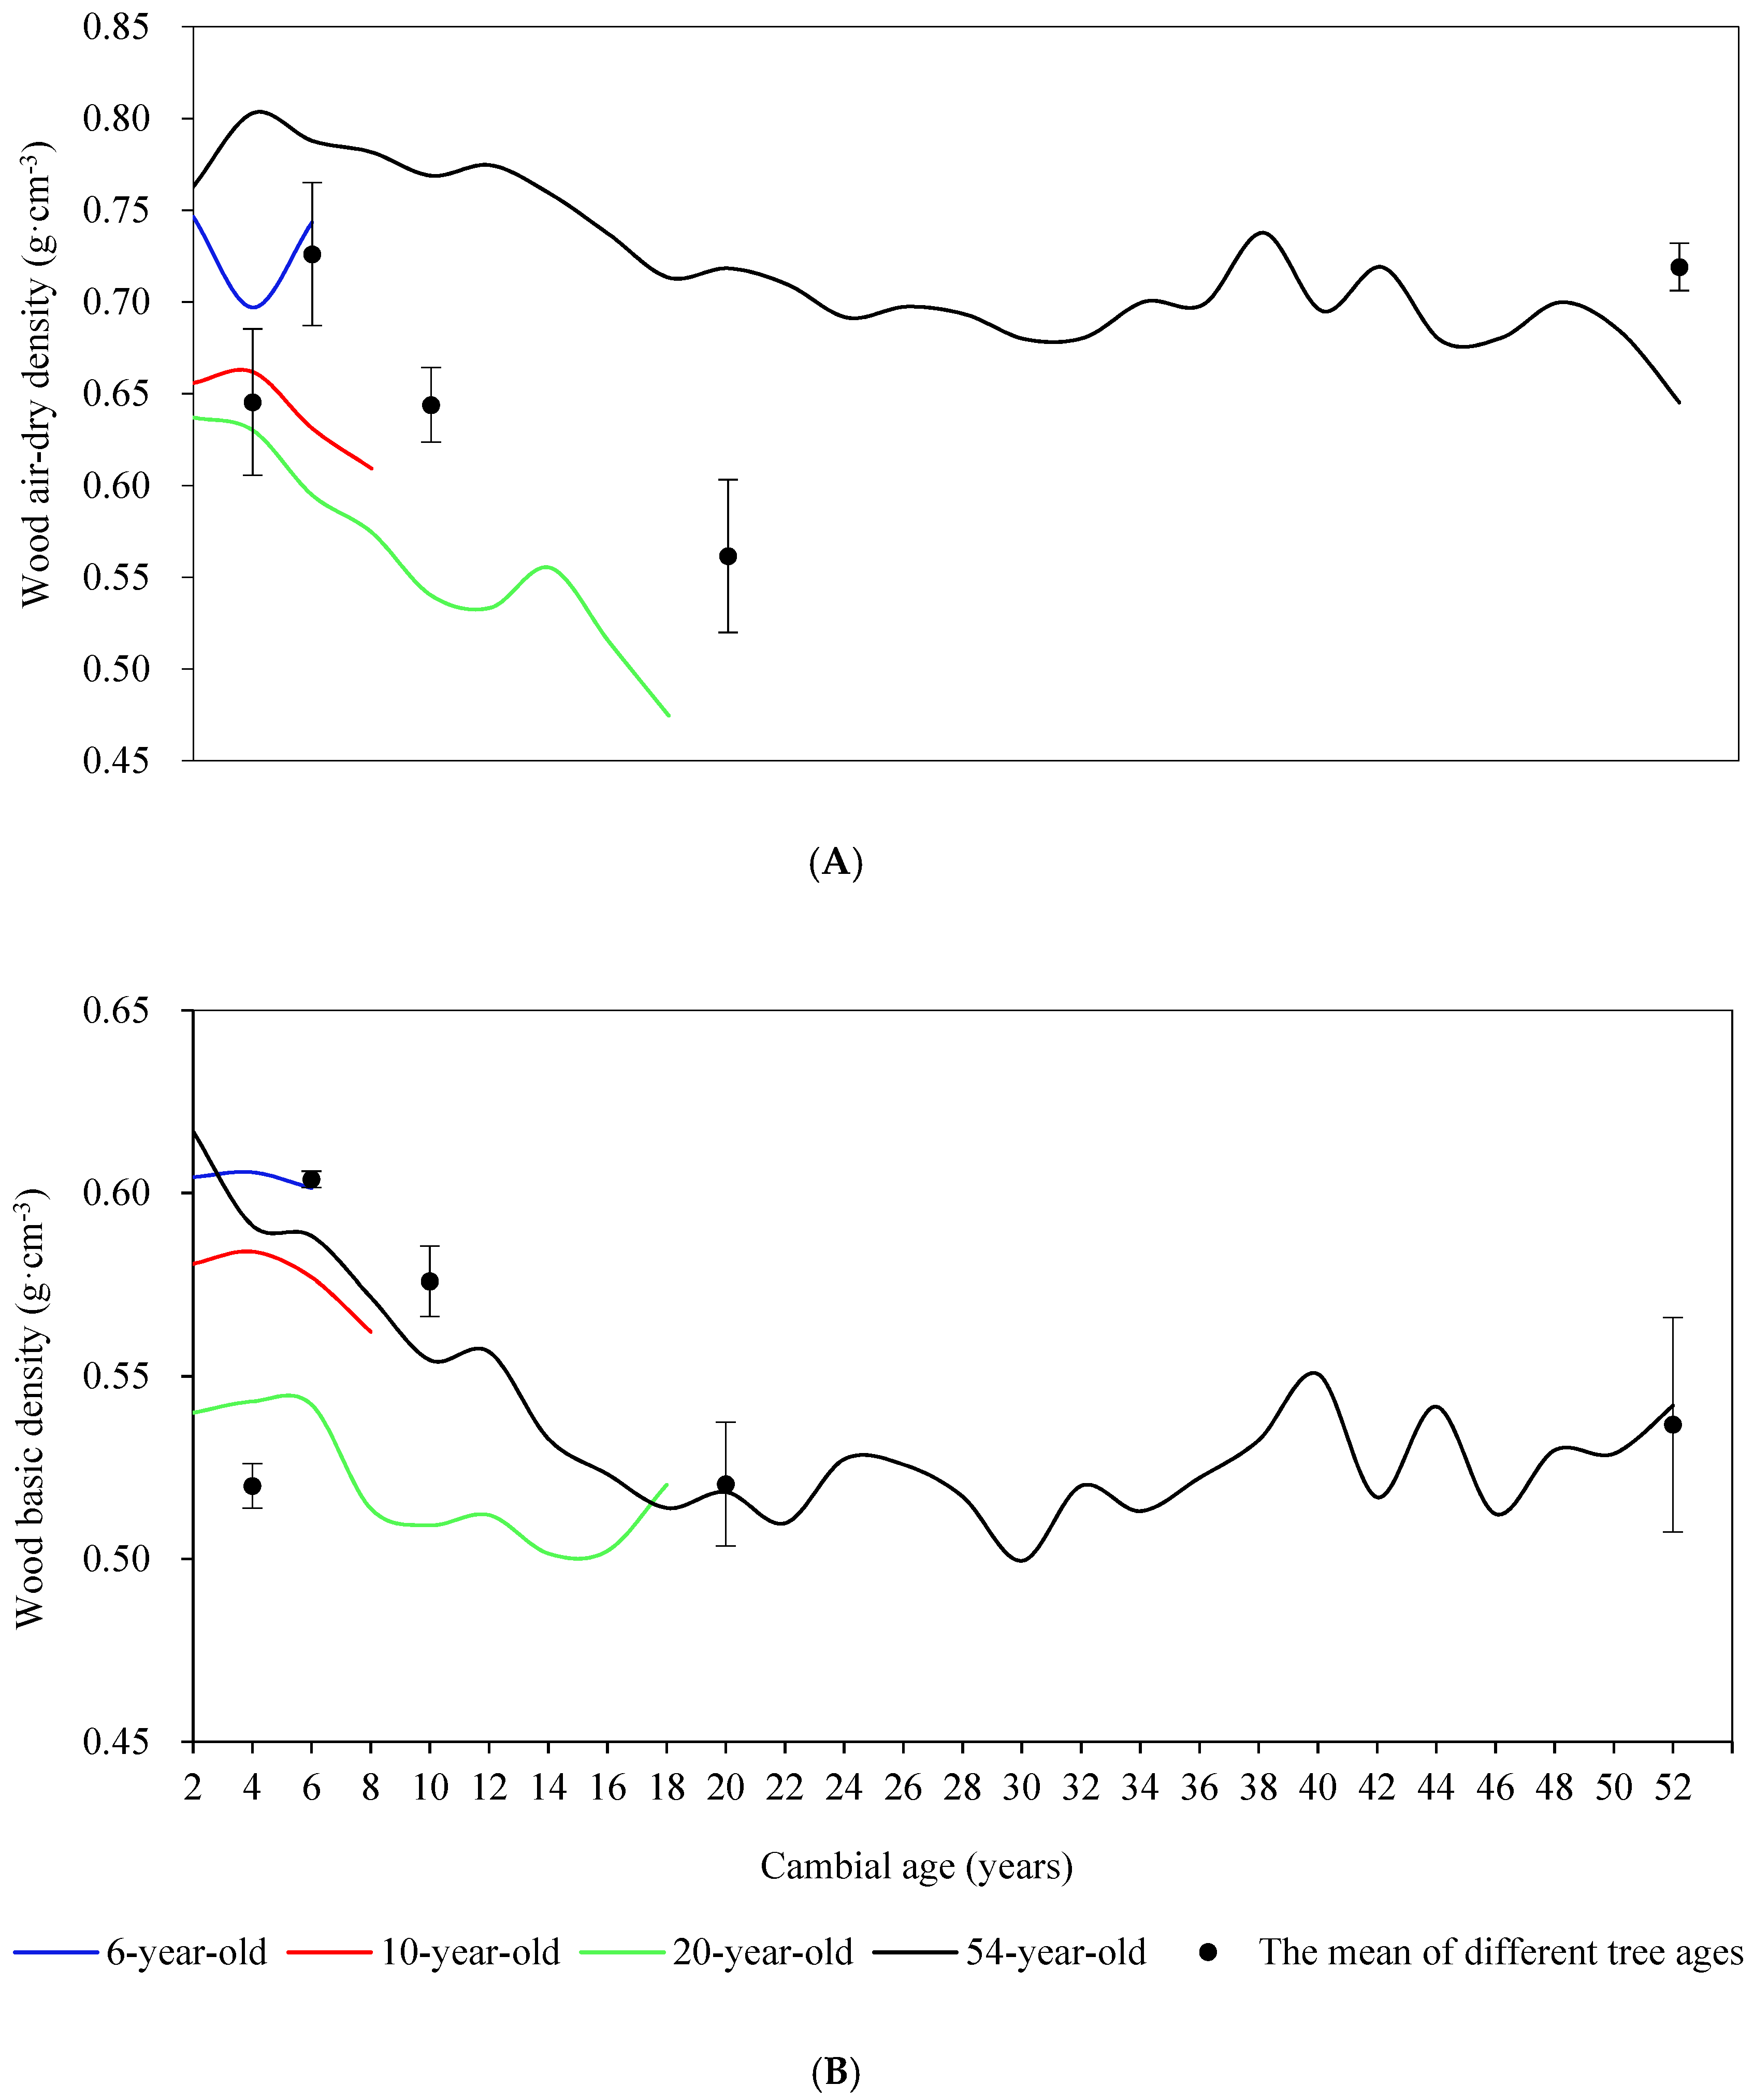
Figure 3.
The radial variation in both wood air-dry density (A) and wood basic density (B) versus cambial age and the mean of different tree ages in S. superba.
Figure 3.
The radial variation in both wood air-dry density (A) and wood basic density (B) versus cambial age and the mean of different tree ages in S. superba.
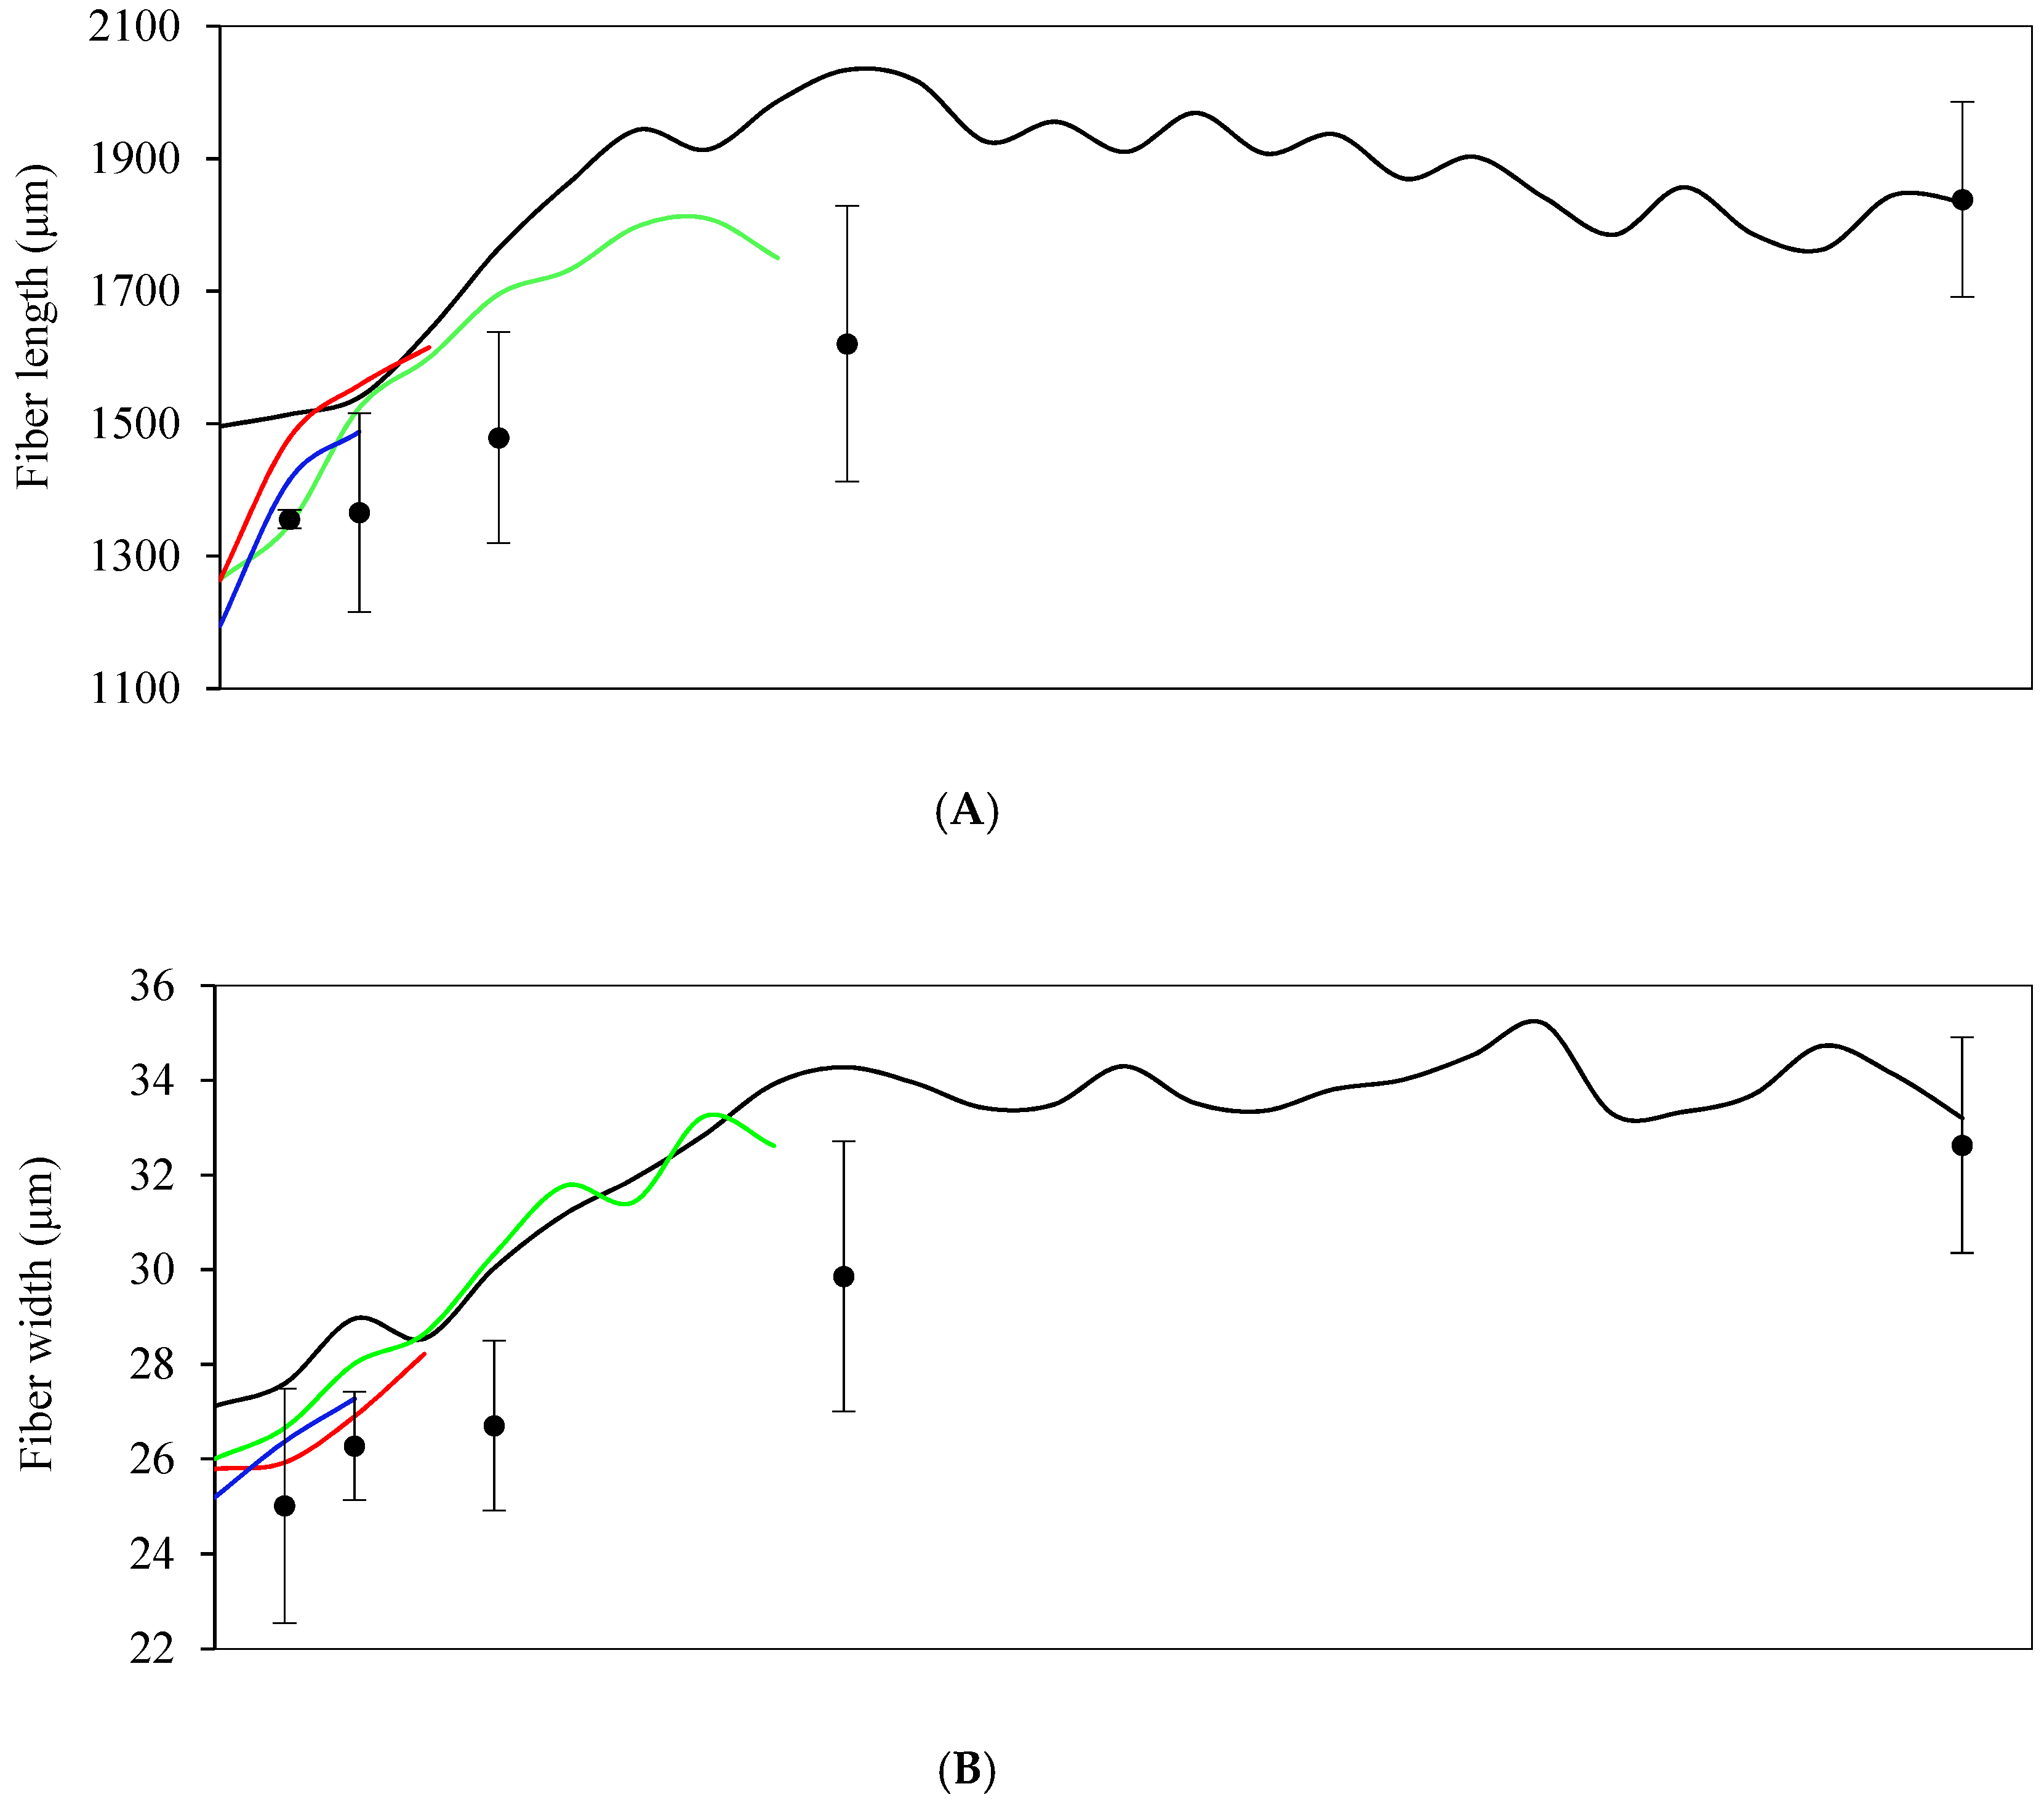
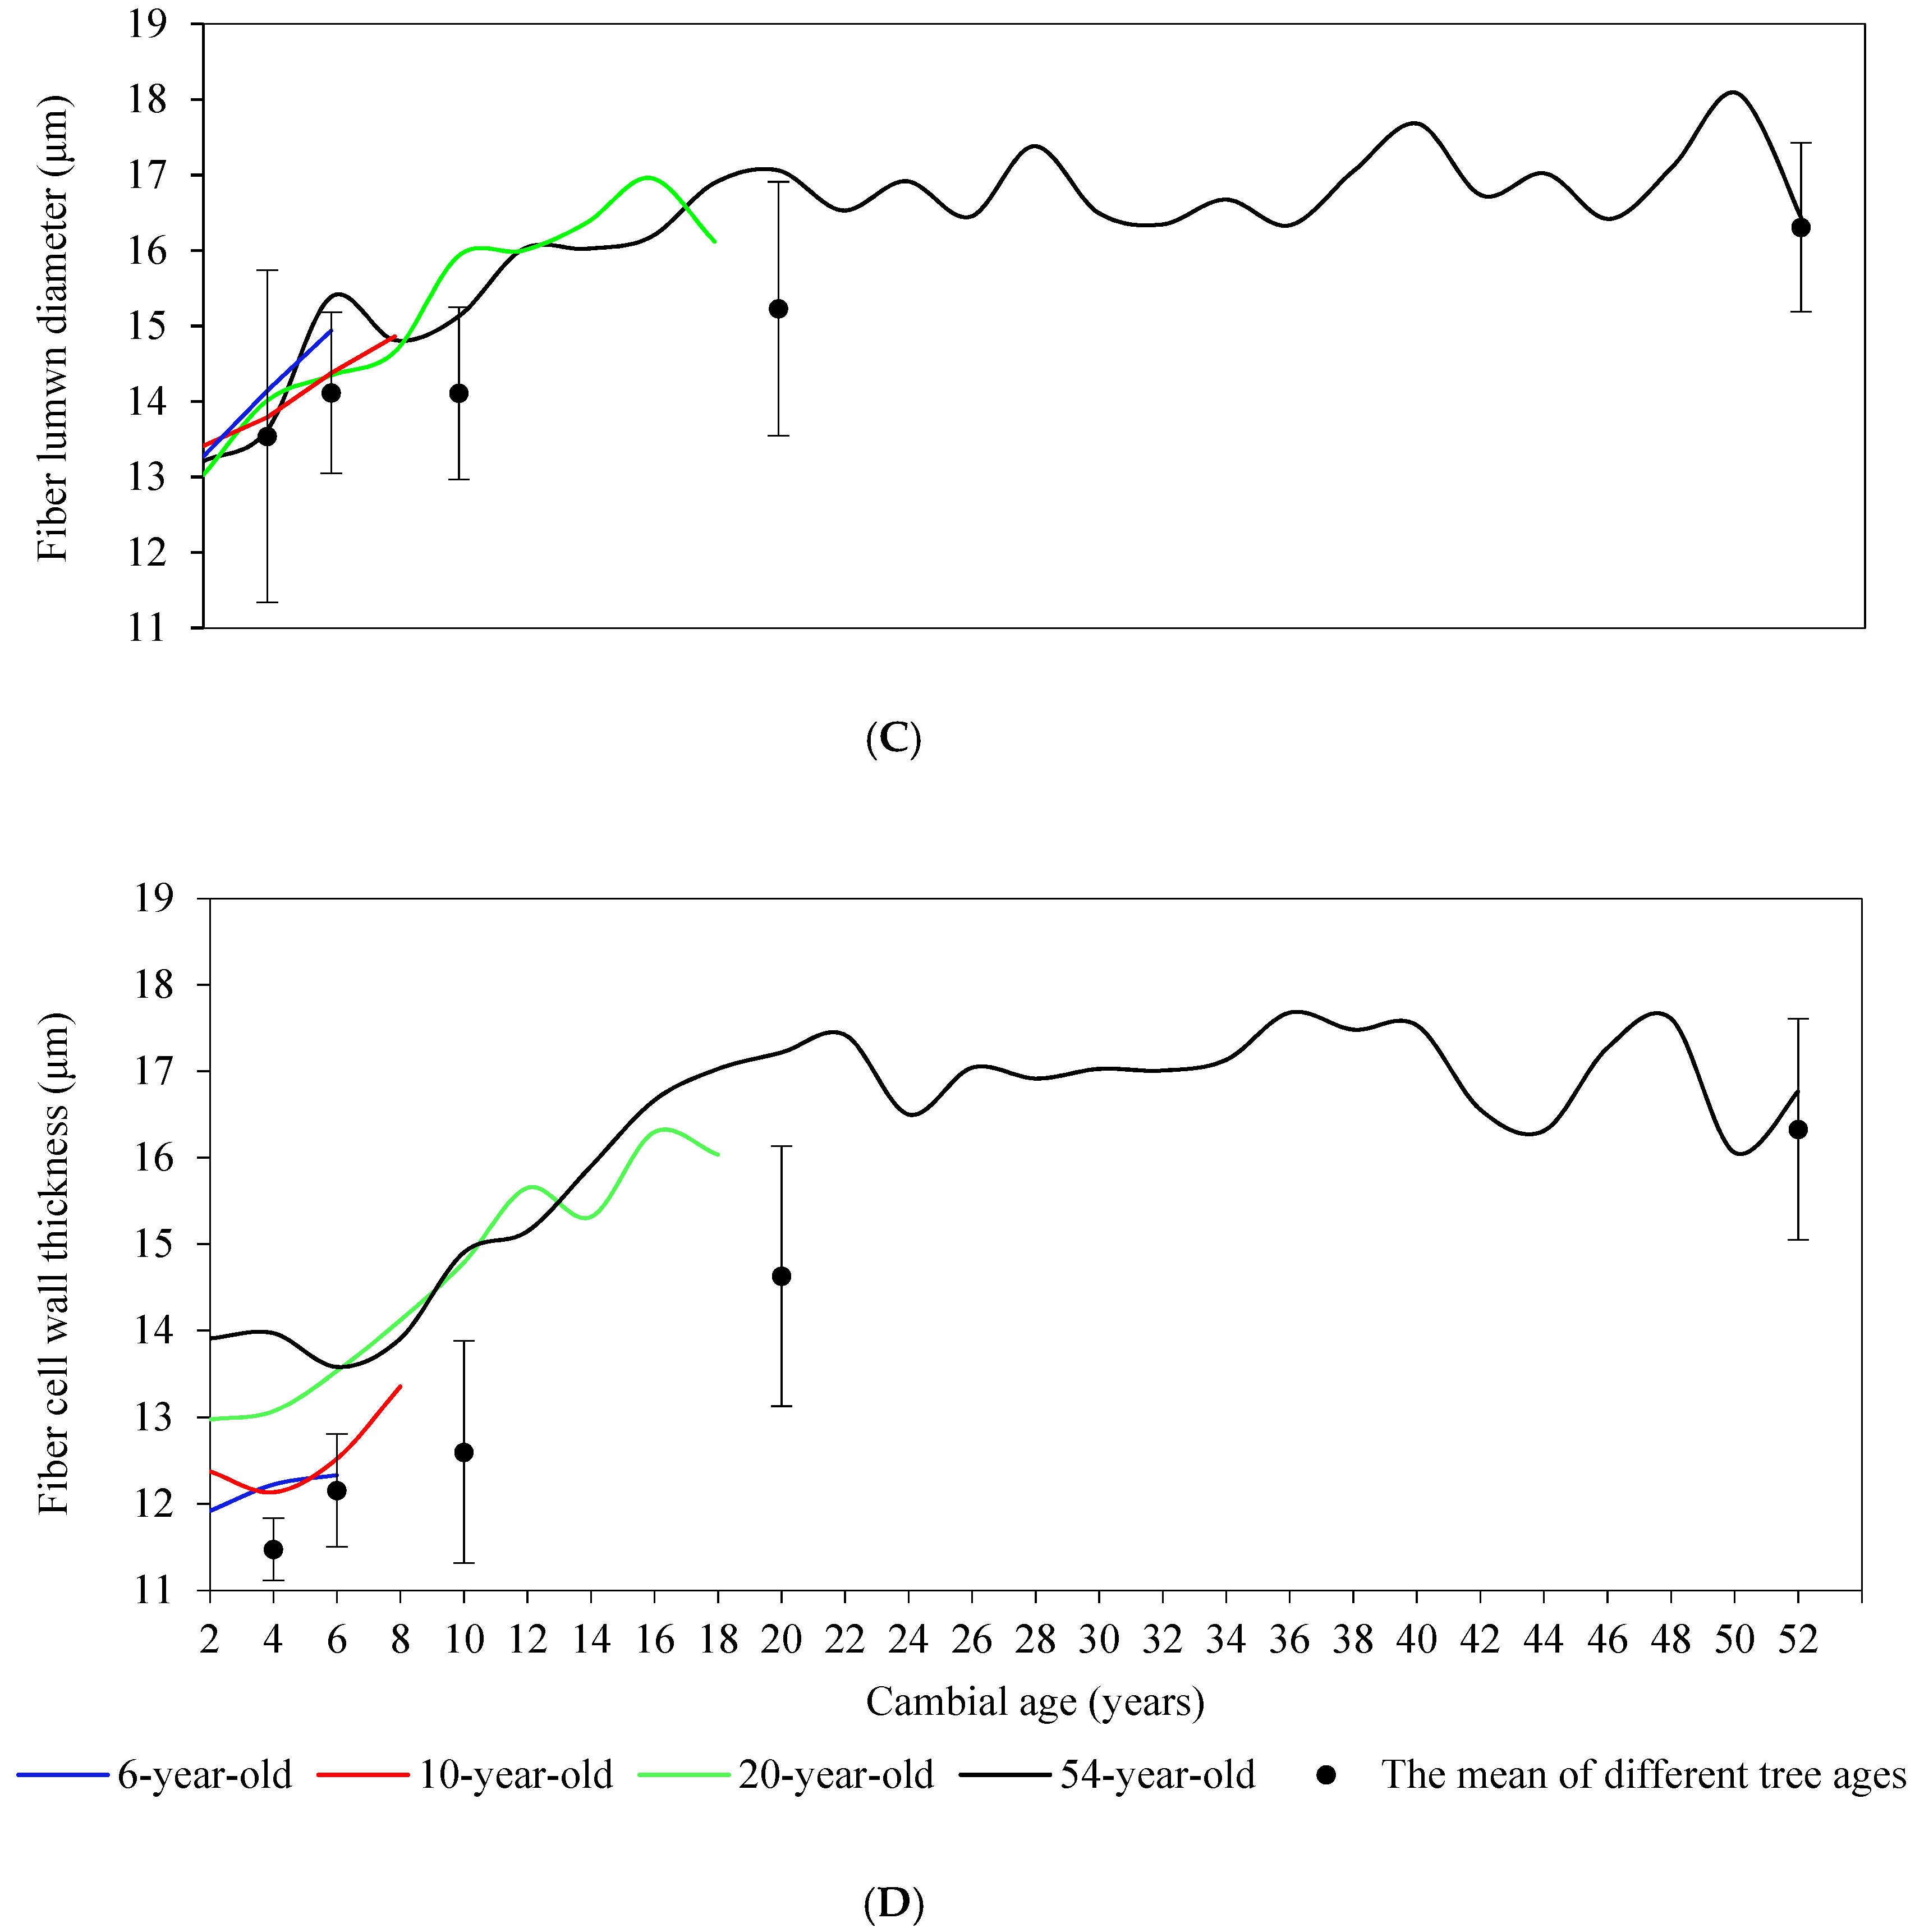
Figure 4.
The radial variation in fiber characters versus cambial age and the mean of different tree ages in S. superba, including fiber length (A), fiber width (B), fiber lumen diameter (C) and fiber cell wall thickness (D).
Figure 4.
The radial variation in fiber characters versus cambial age and the mean of different tree ages in S. superba, including fiber length (A), fiber width (B), fiber lumen diameter (C) and fiber cell wall thickness (D).
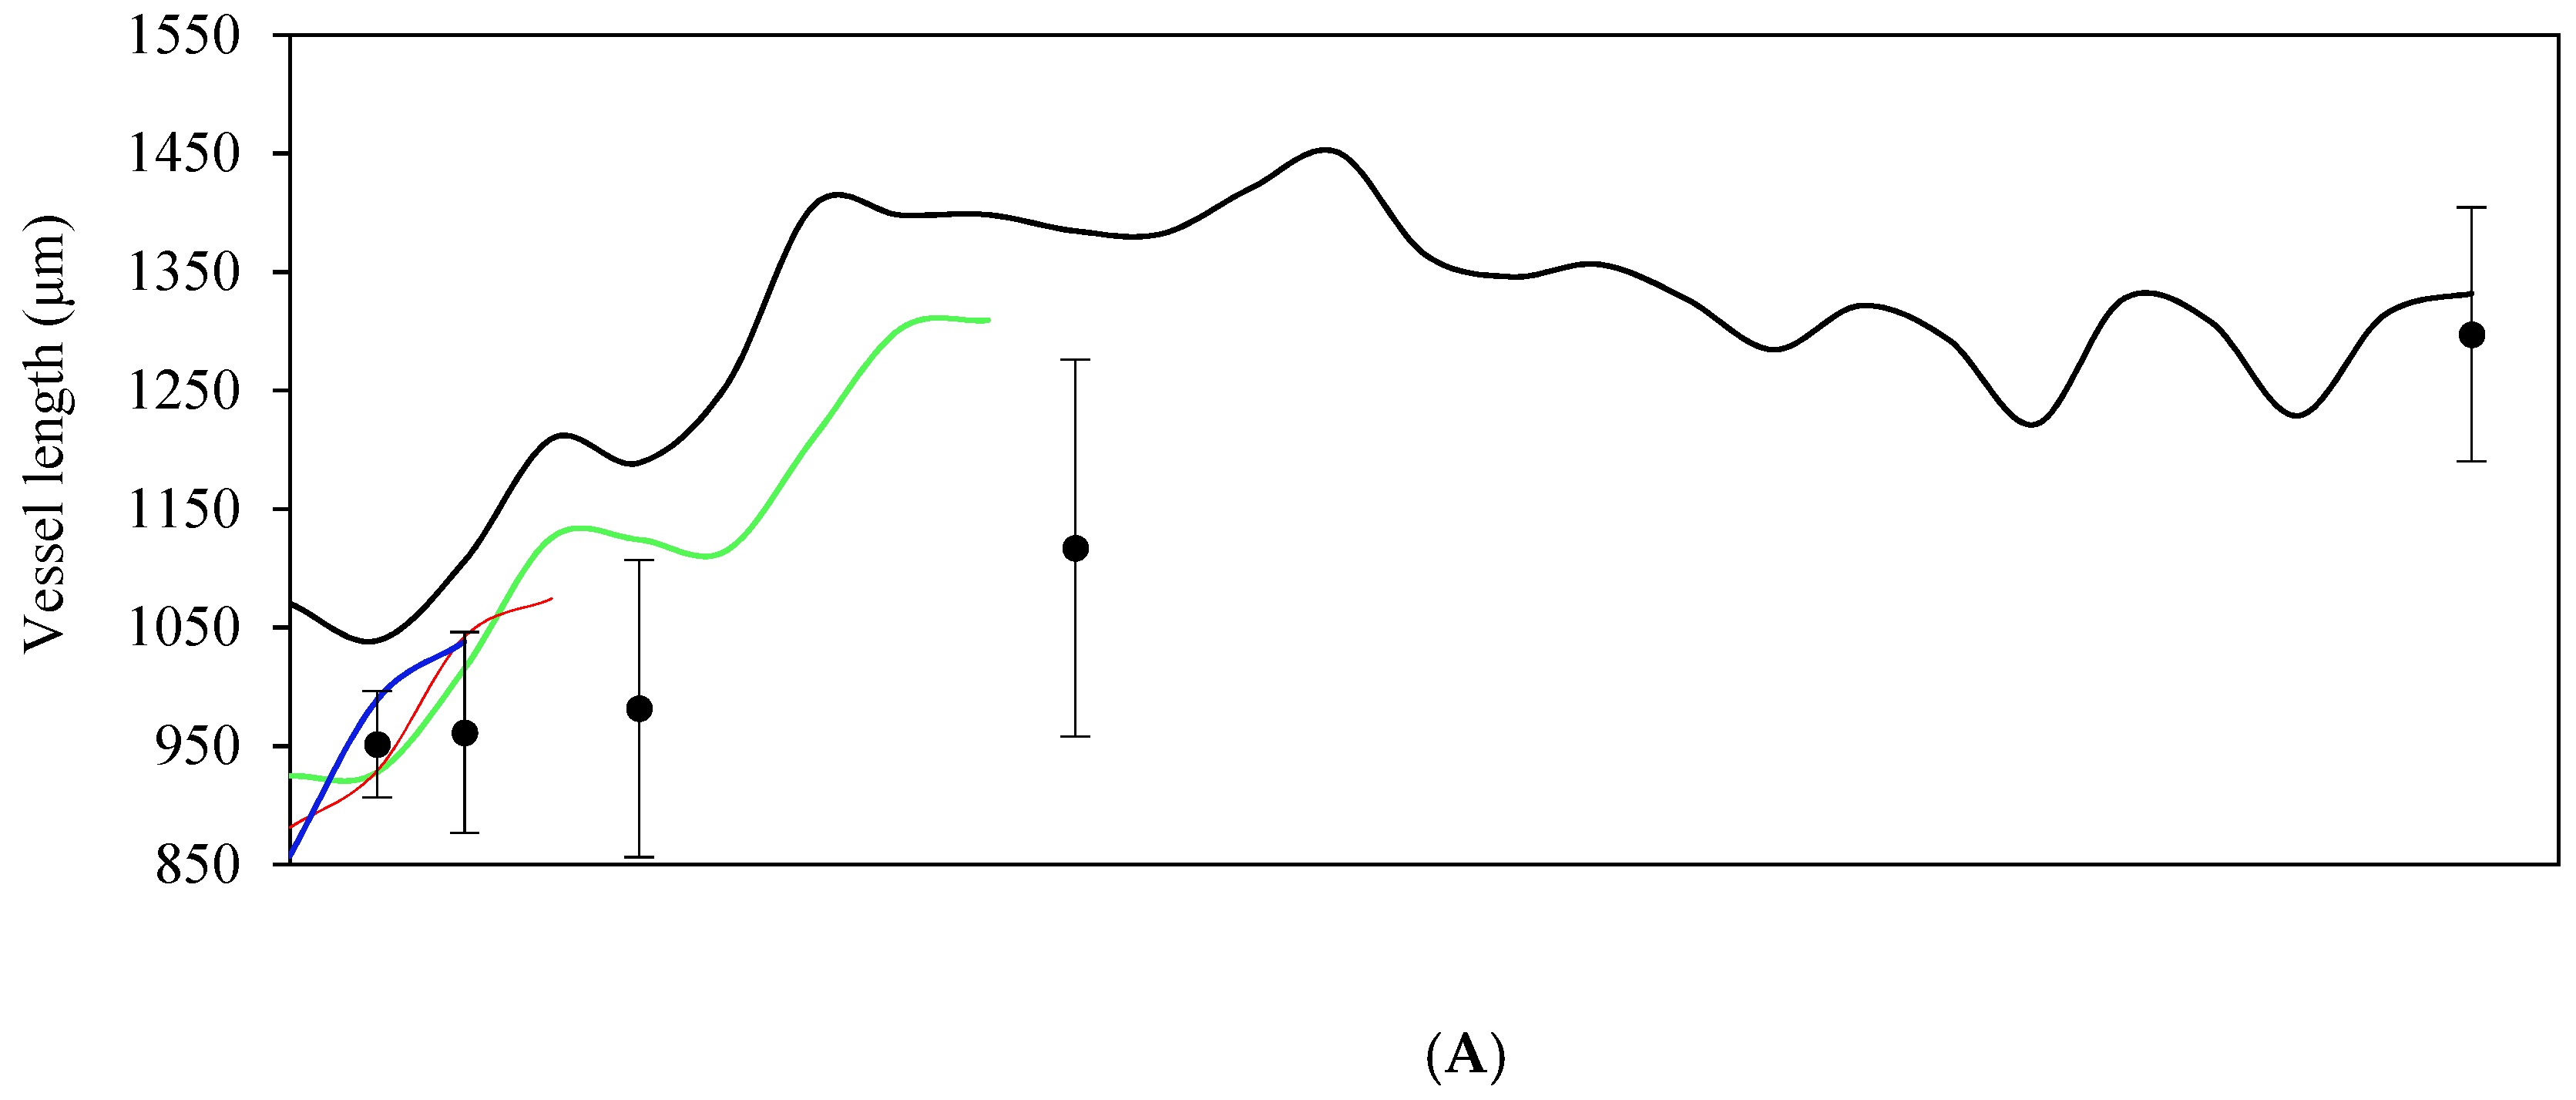
Figure 5.
The radial variation in vessel characters versus cambial age and the mean of differently aged S. superba, including vessel length (A), vessel width (B), vessel lumen diameter (C) and vessel cell wall thickness (D).
Figure 5.
The radial variation in vessel characters versus cambial age and the mean of differently aged S. superba, including vessel length (A), vessel width (B), vessel lumen diameter (C) and vessel cell wall thickness (D).
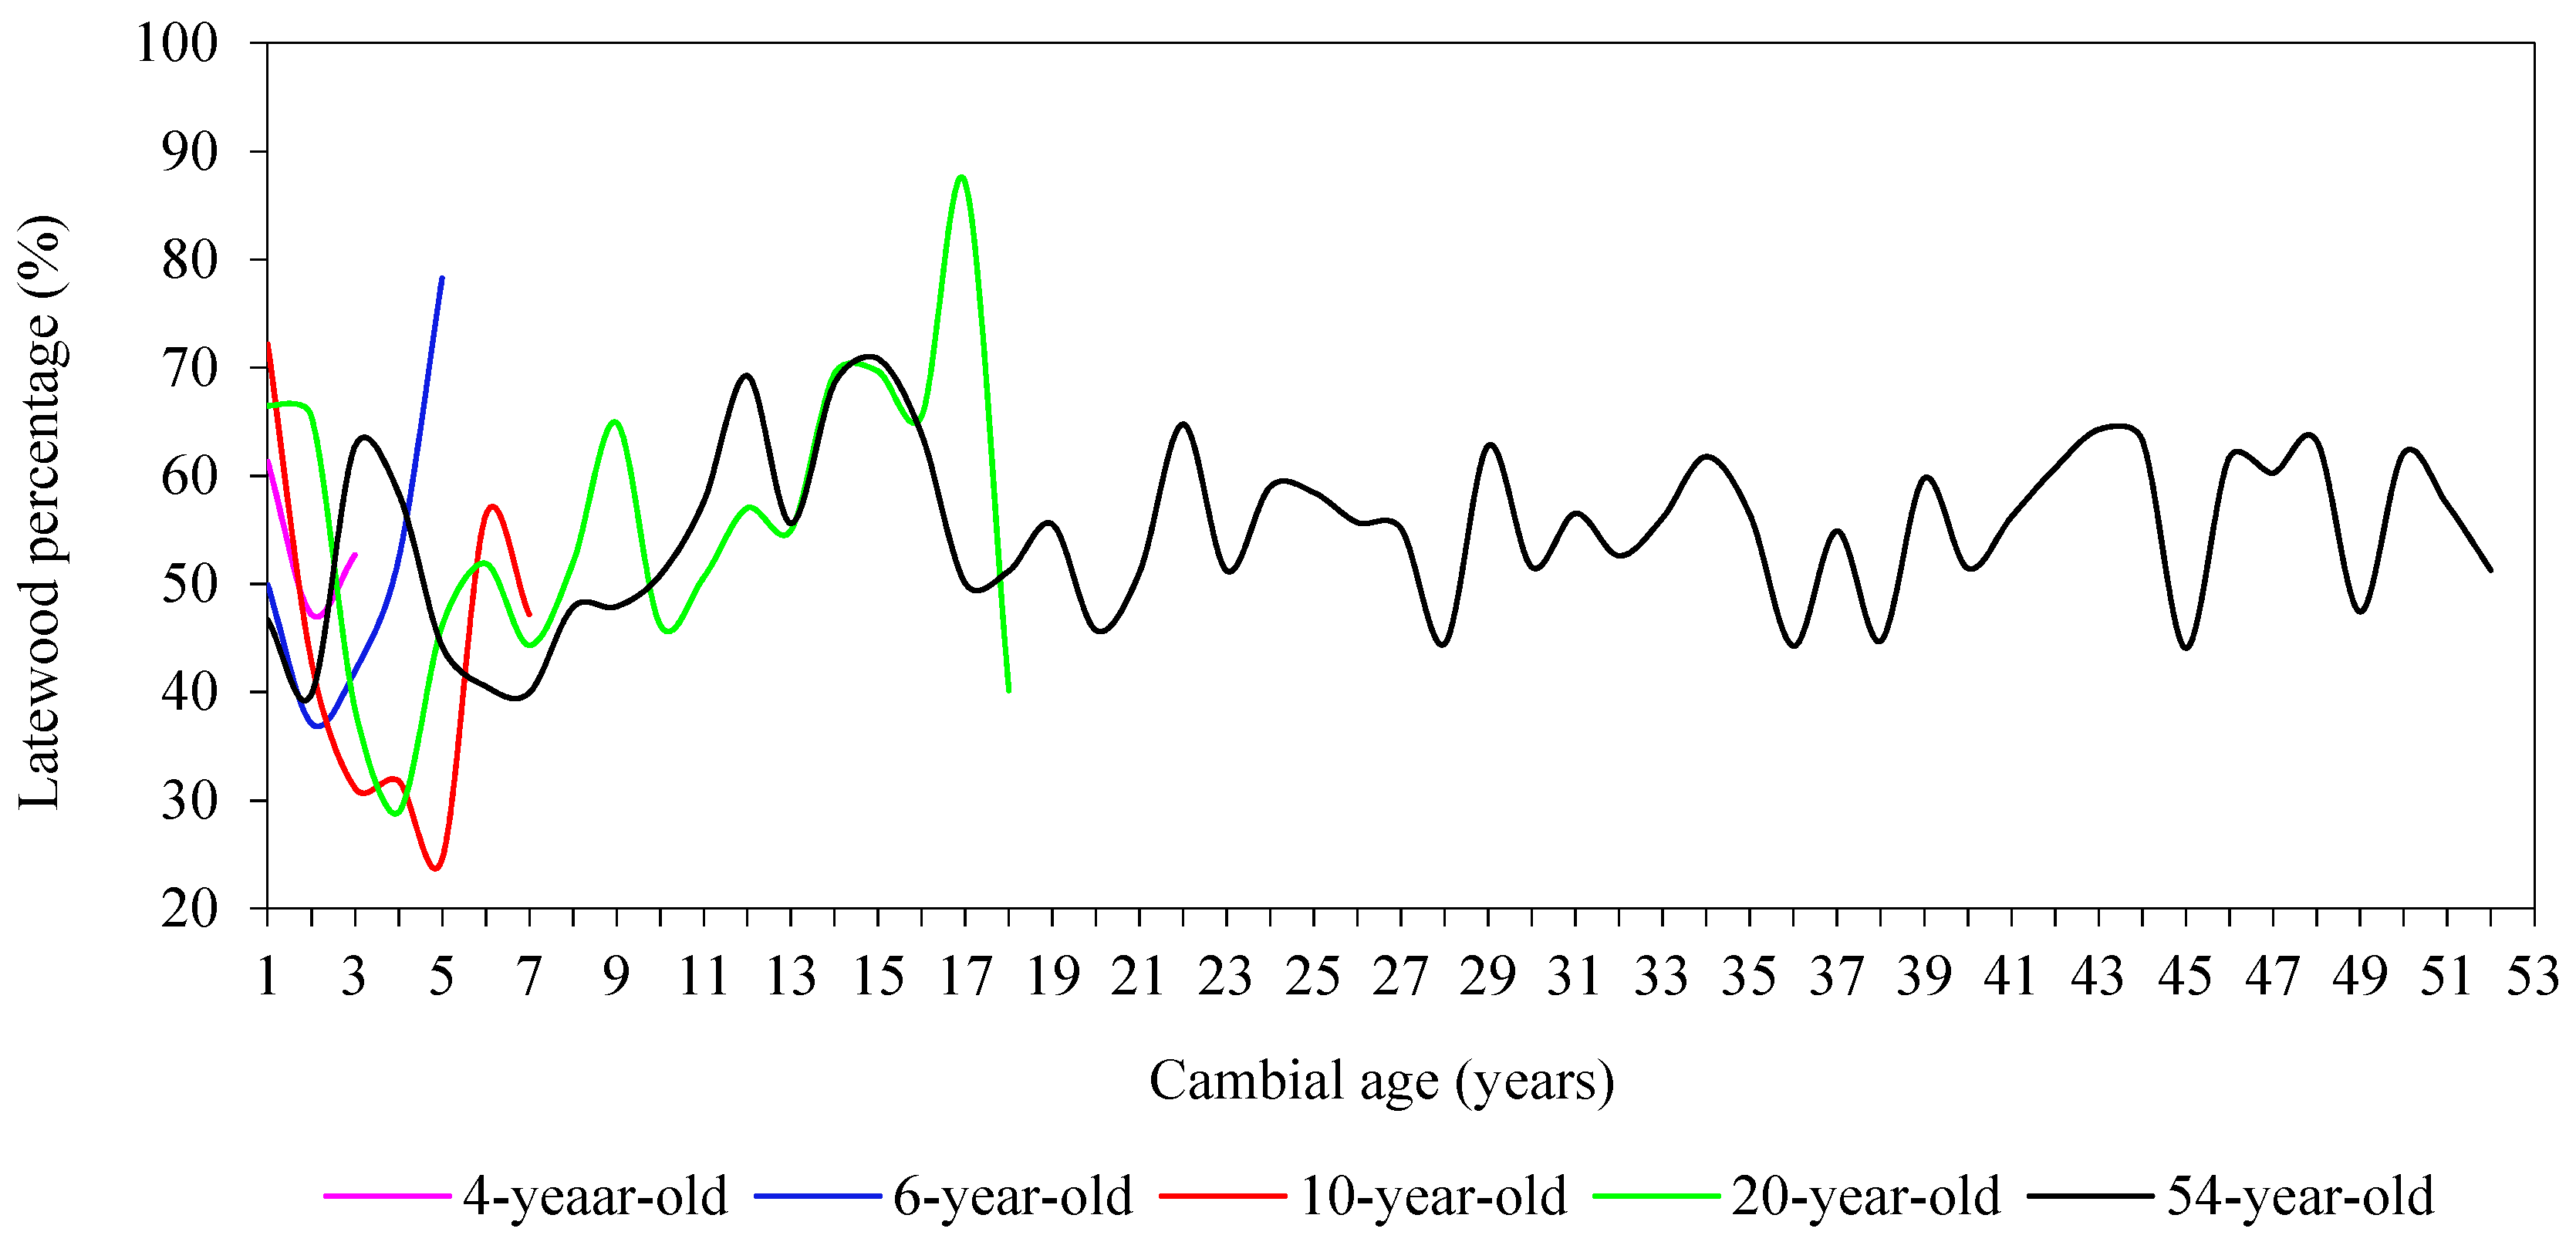
Figure 6.
The radial variation of annual latewood percentage versus cambial age in S. superba.
Figure 6.
The radial variation of annual latewood percentage versus cambial age in S. superba.
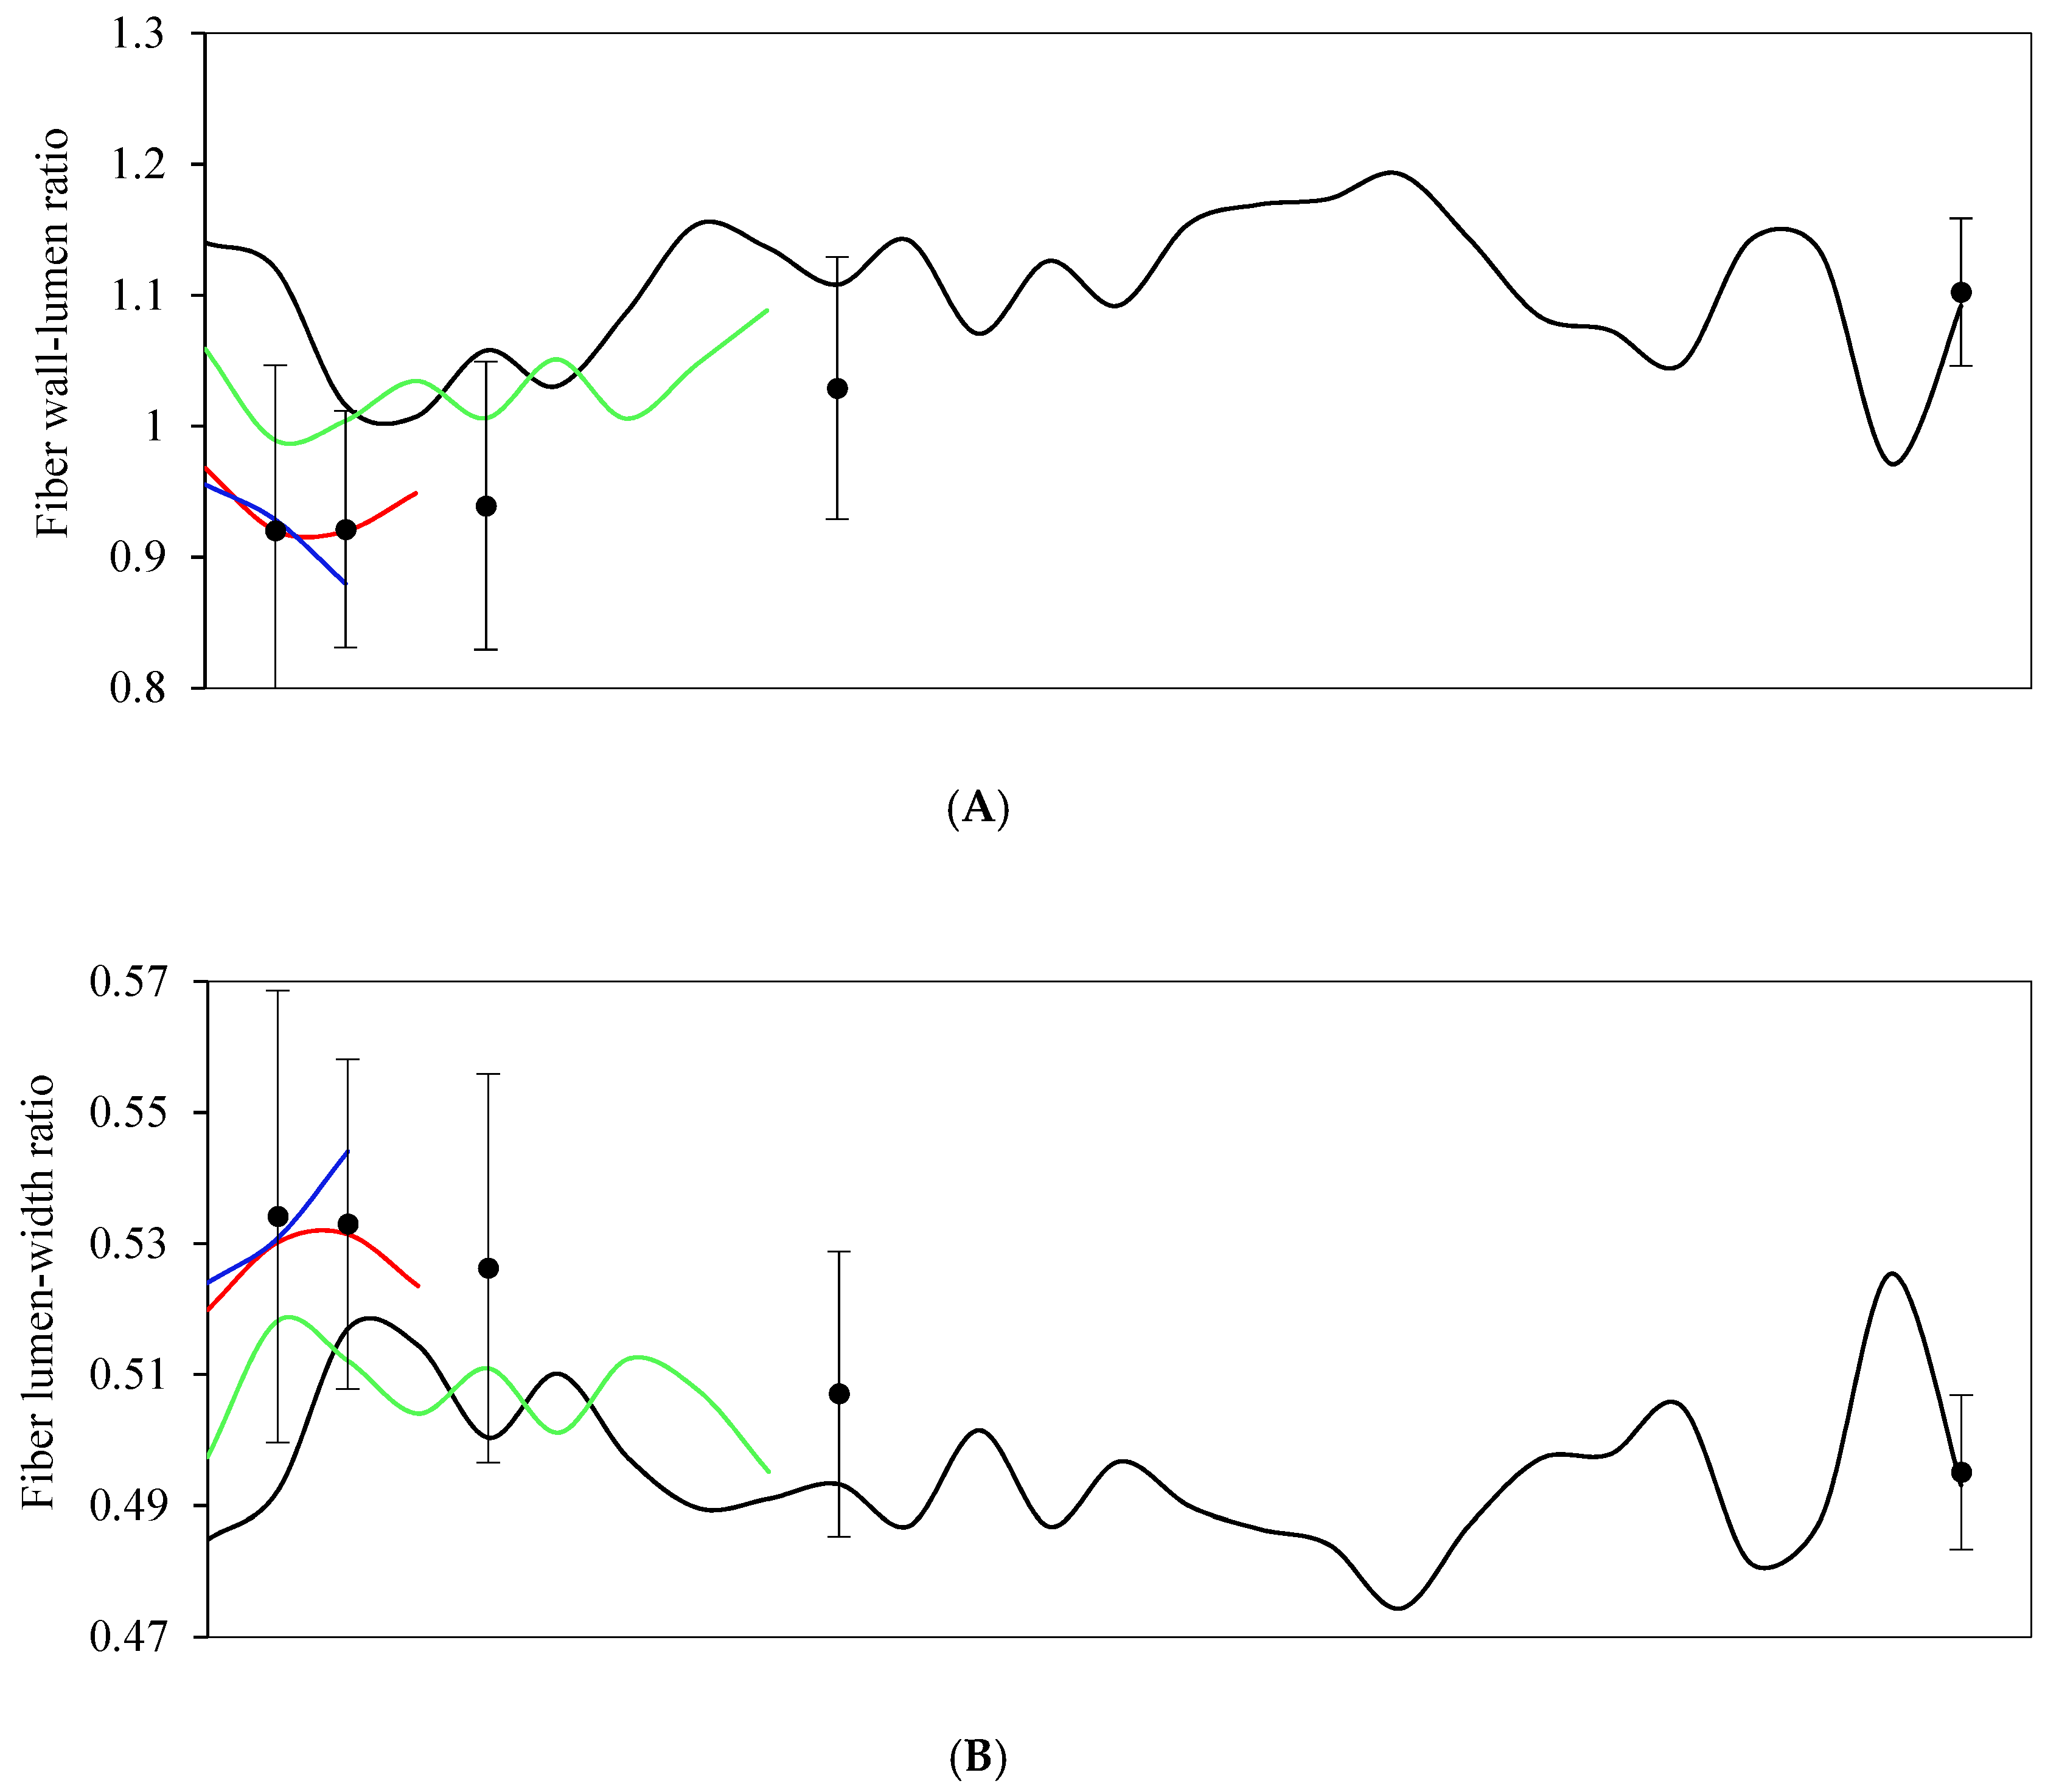
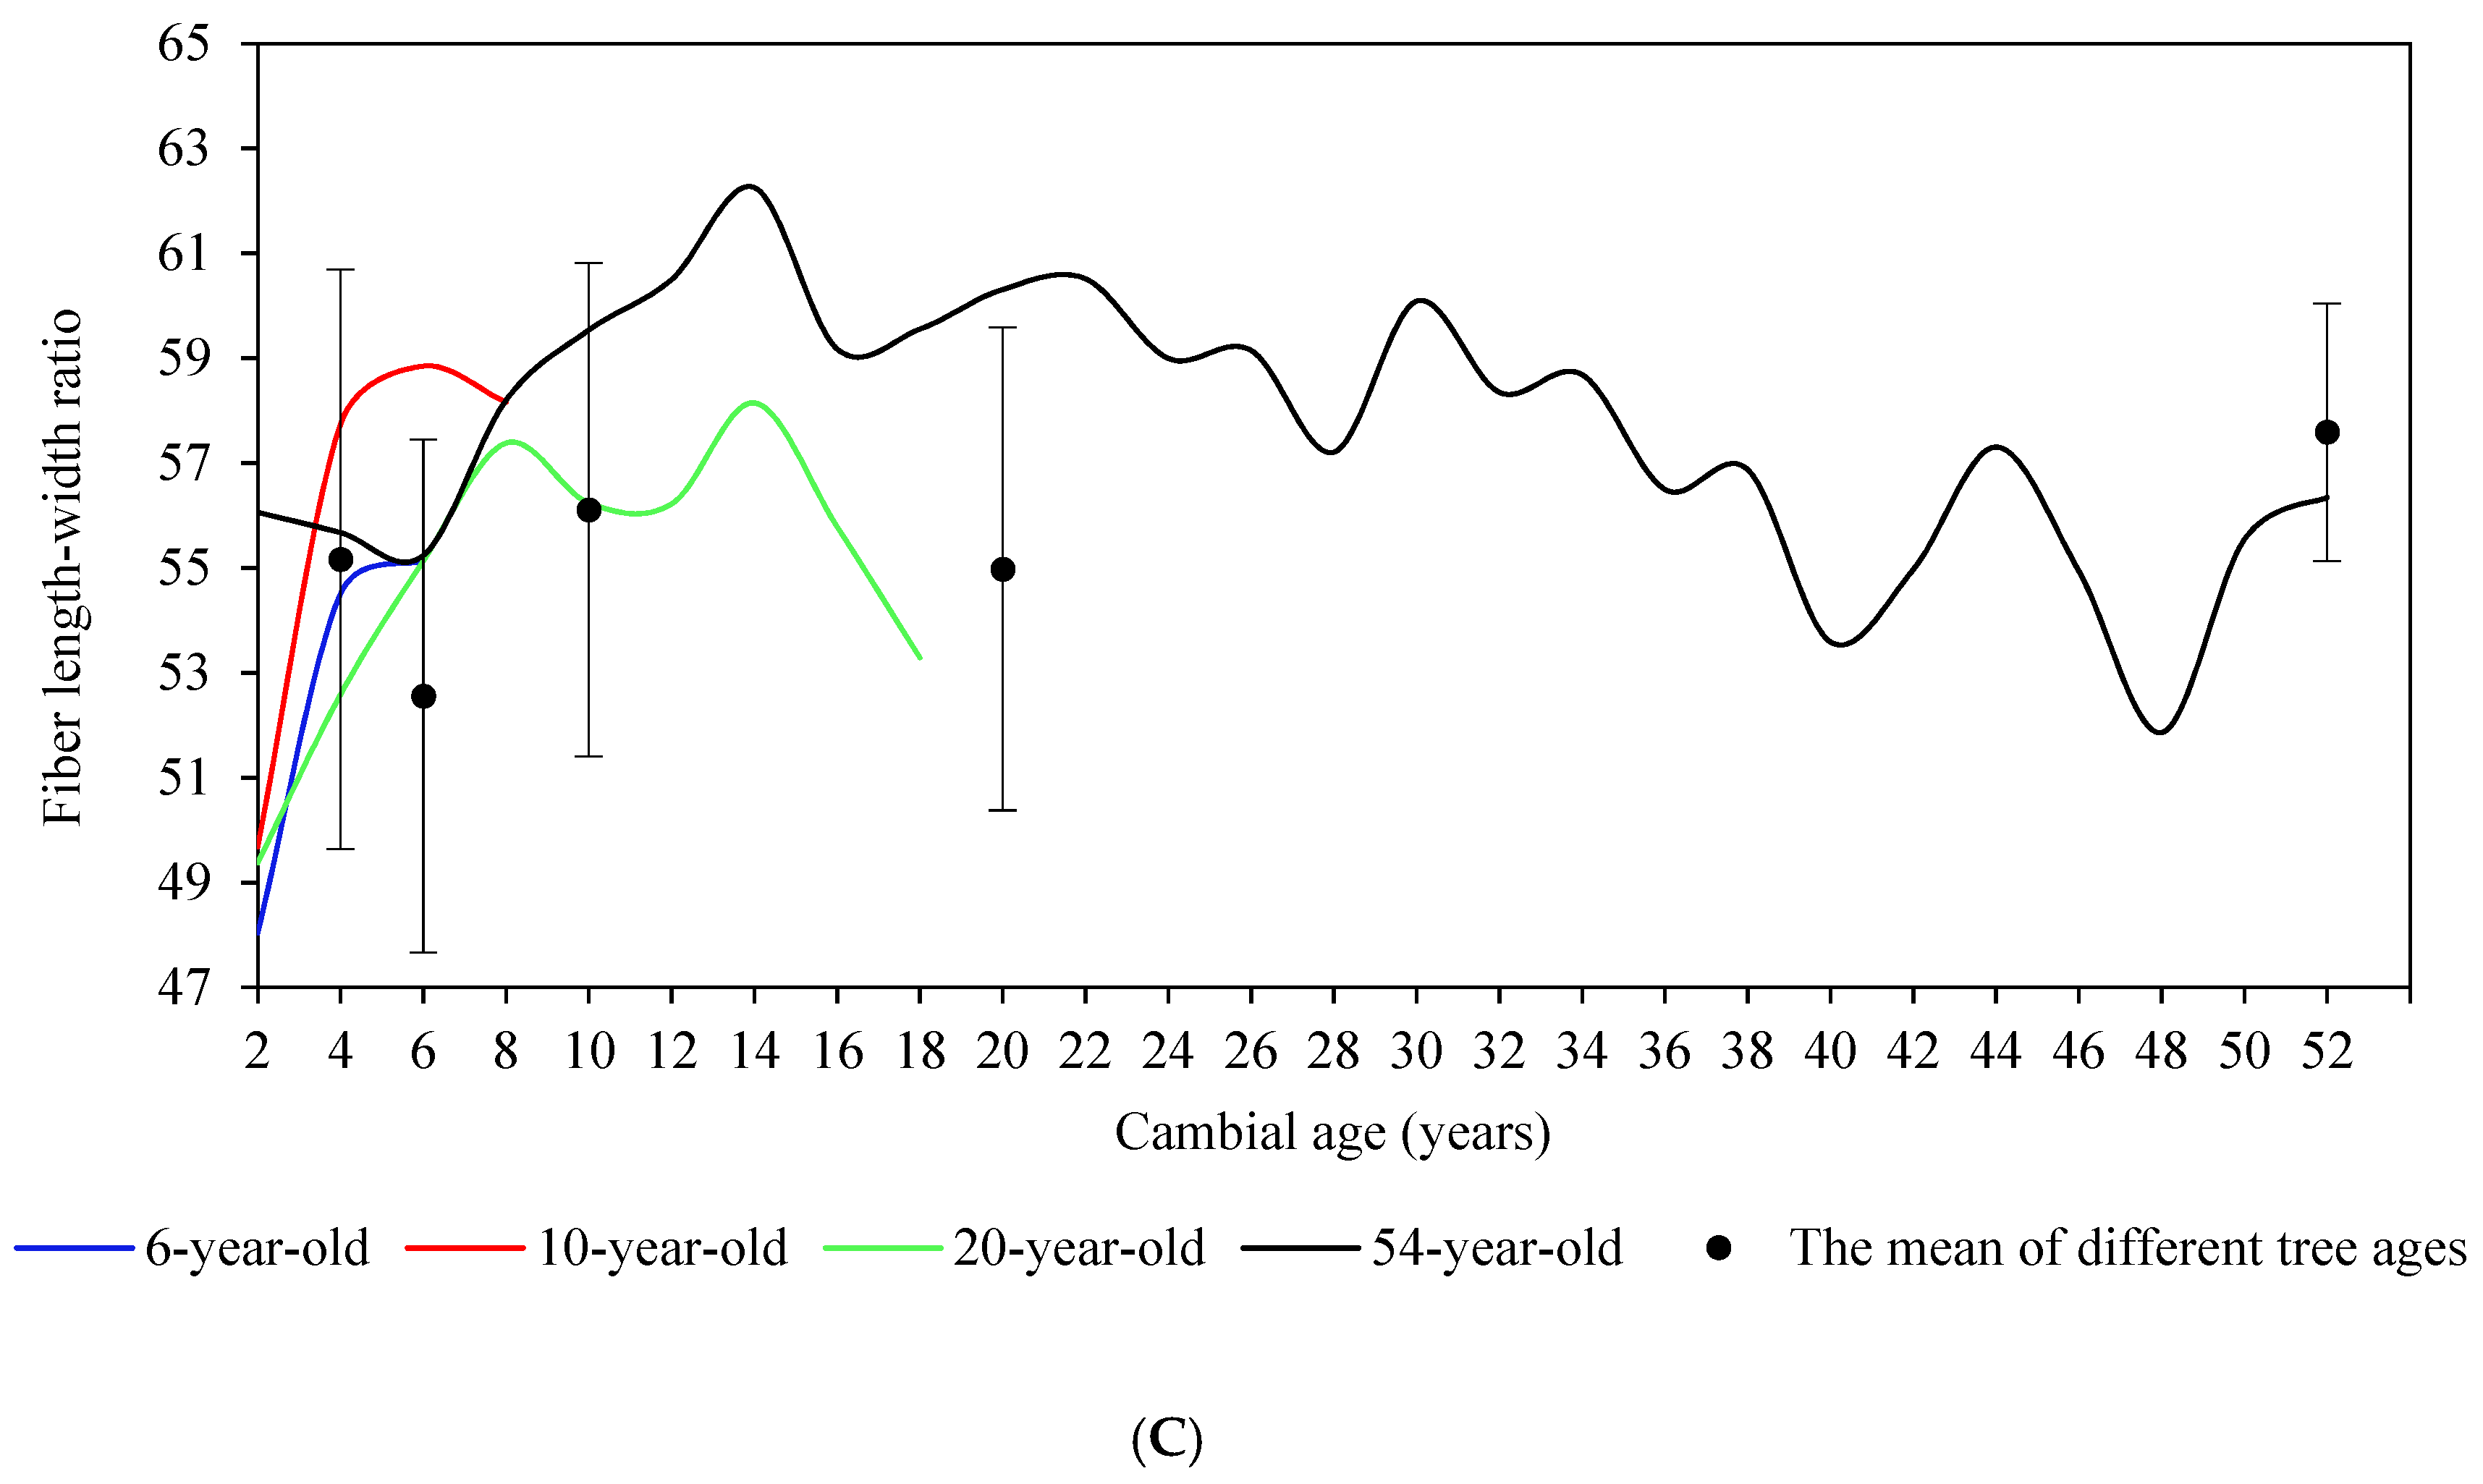
Figure 7.
The radial variation in fiber wall-lumen ratio (A), fiber lumen-width ratio (B) and fiber length-width ratio (C) versus cambial age and the mean of differently aged S. superba.
Figure 7.
The radial variation in fiber wall-lumen ratio (A), fiber lumen-width ratio (B) and fiber length-width ratio (C) versus cambial age and the mean of differently aged S. superba.
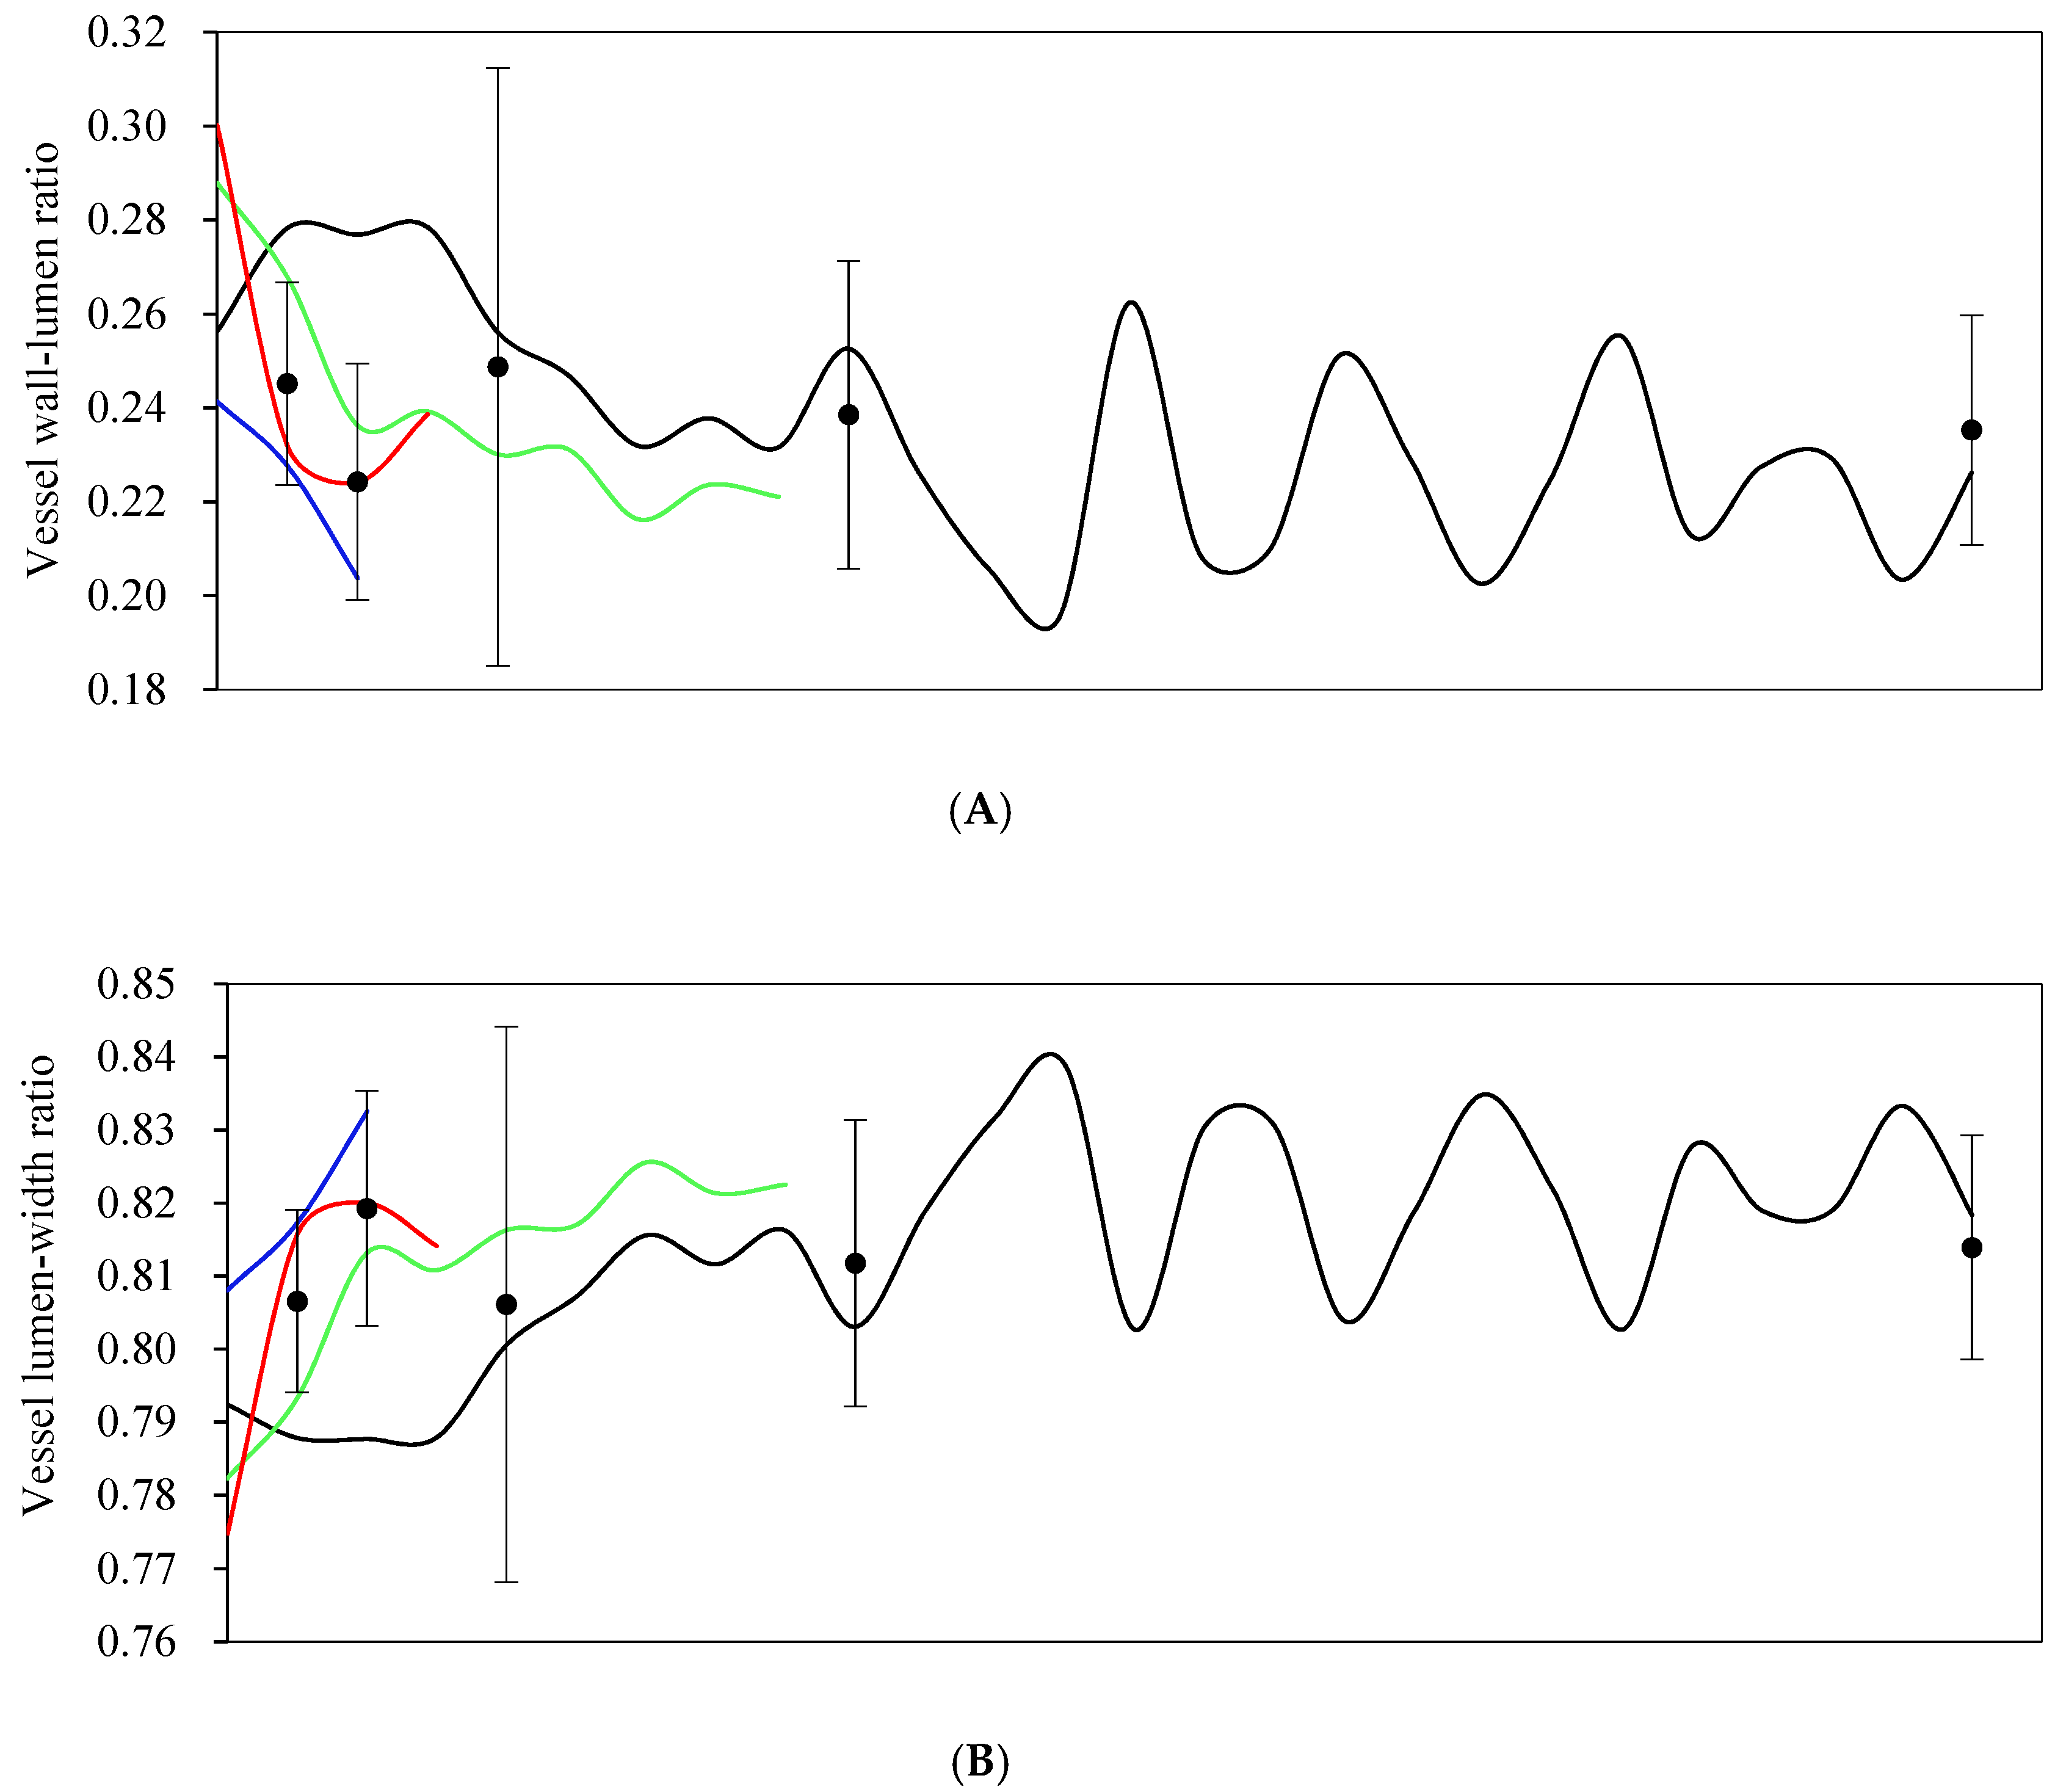
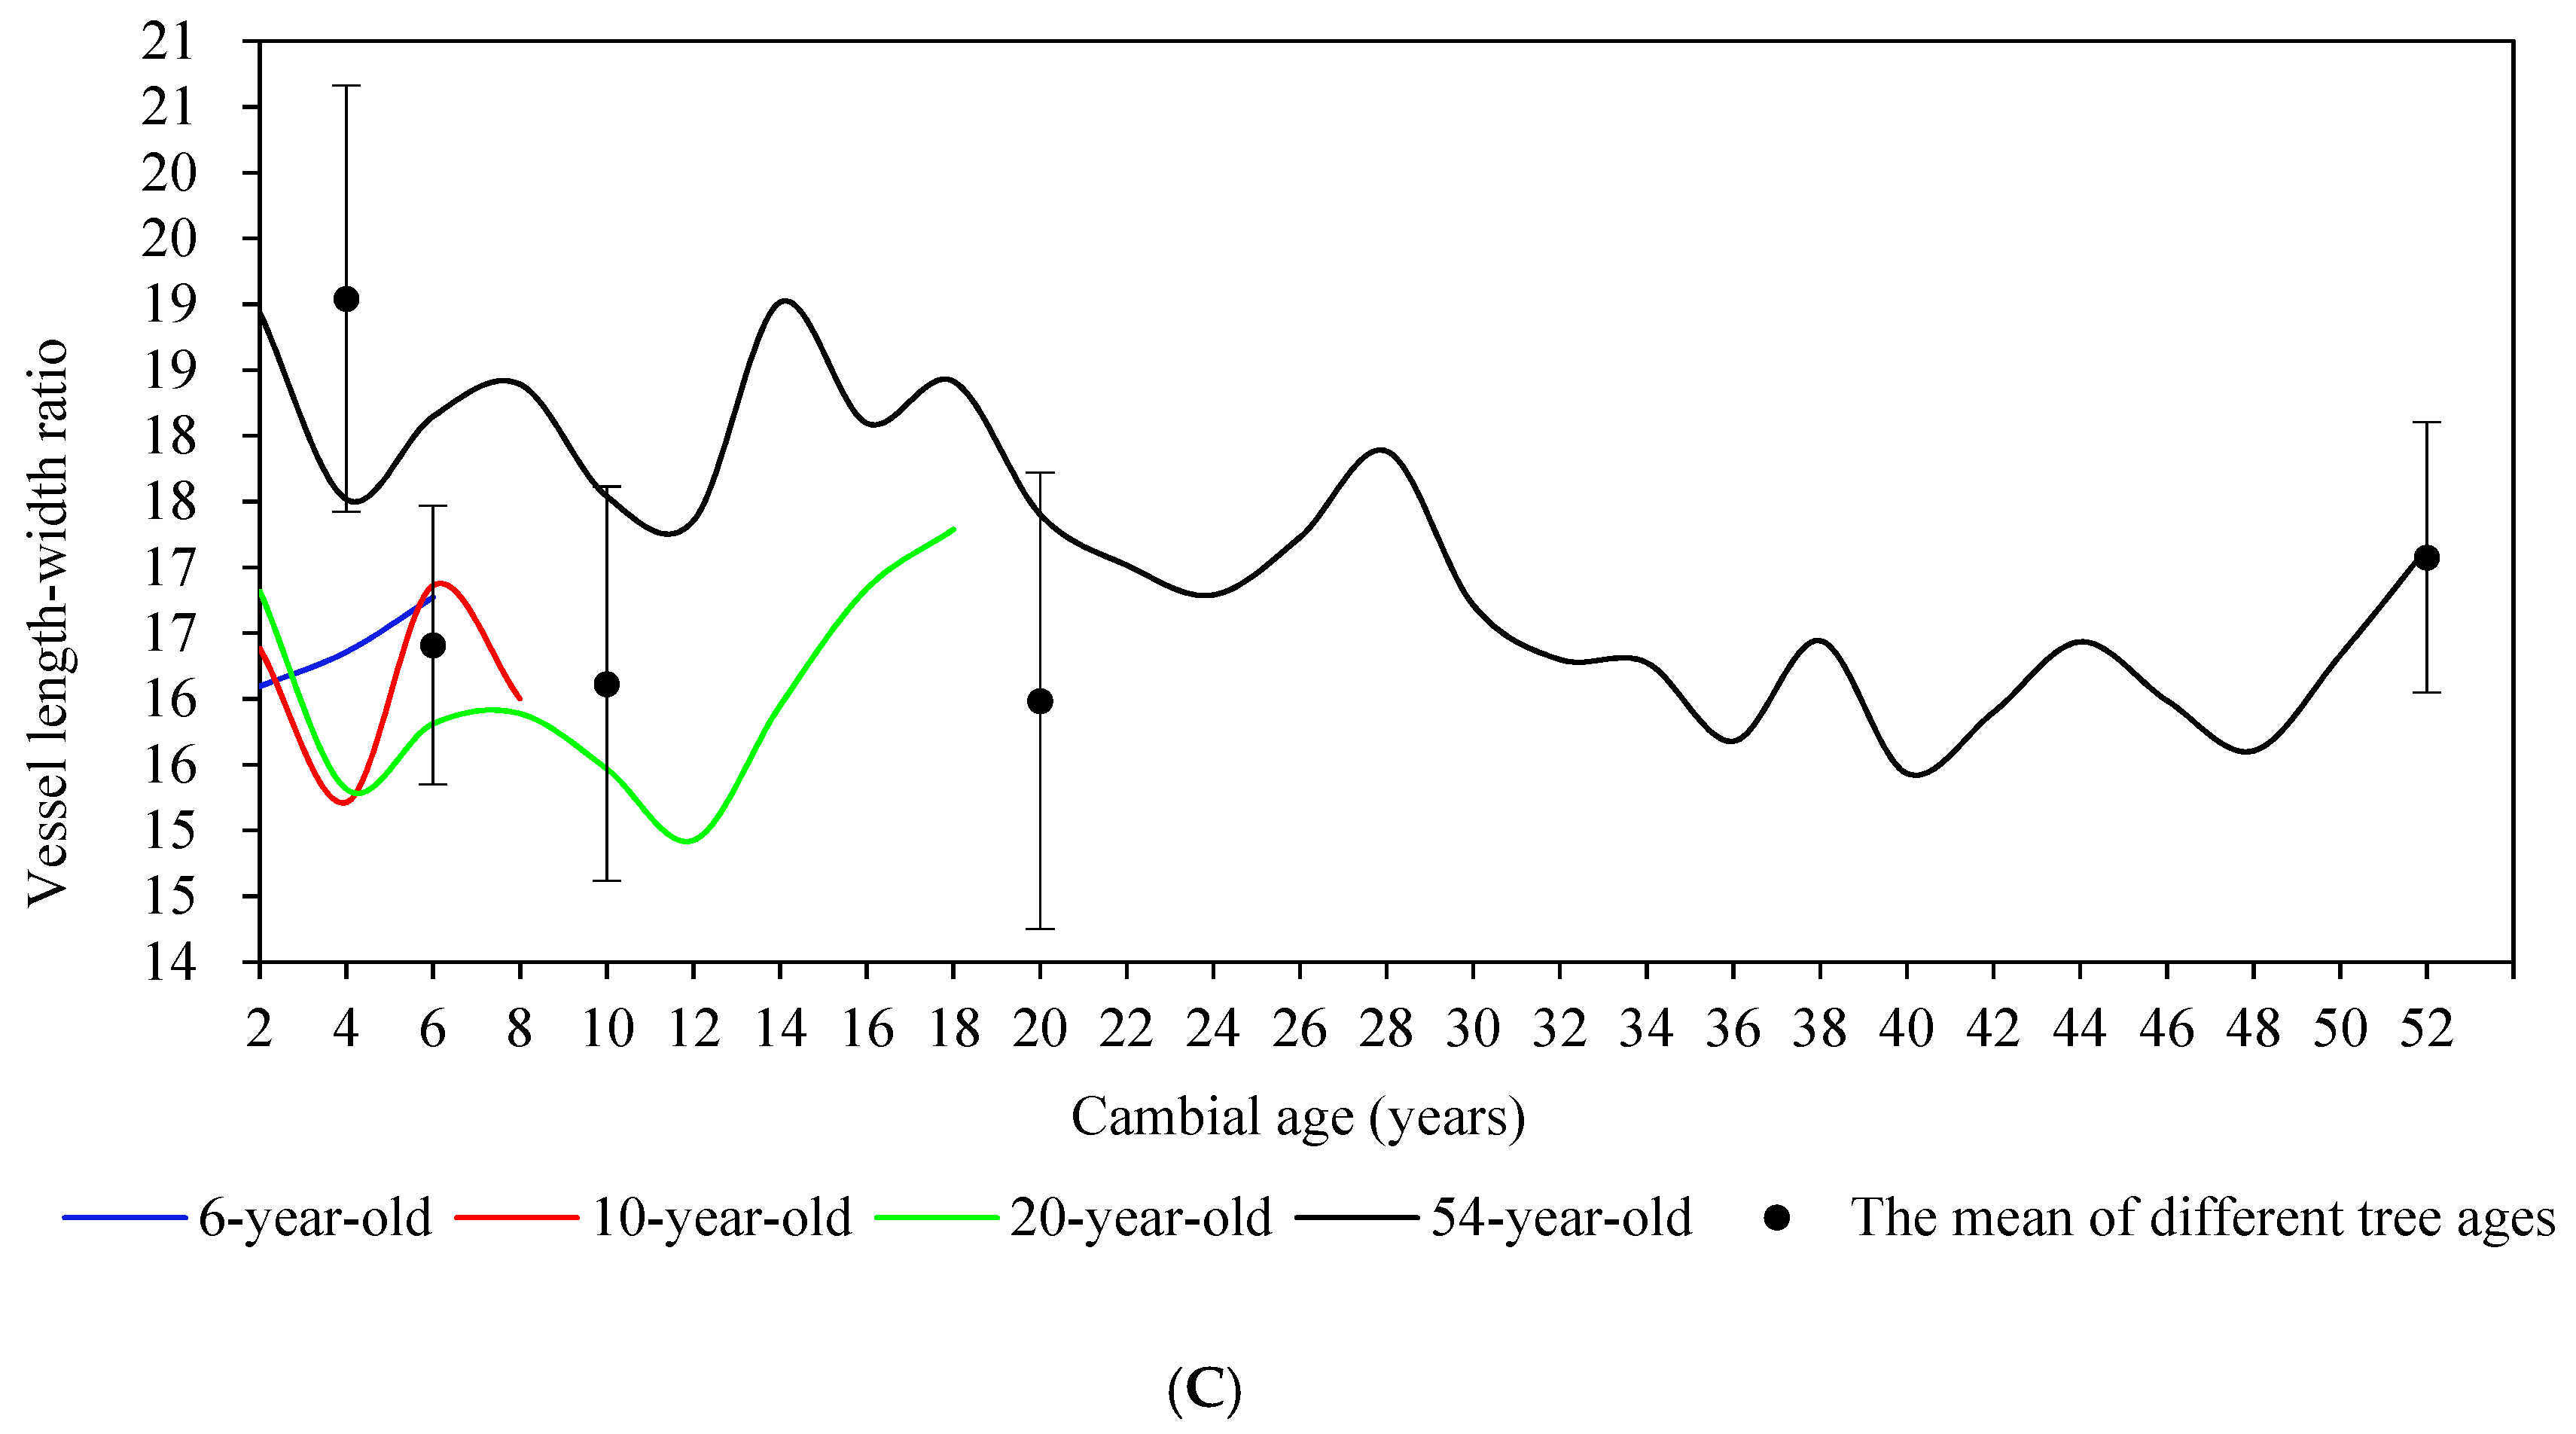
Figure 8.
The radial variation of vessel wall-lumen ratio (A), vessel lumen-width ratio (B) and vessel length-width ratio (C) versus cambial age and the mean of differently aged S. superba.
Figure 8.
The radial variation of vessel wall-lumen ratio (A), vessel lumen-width ratio (B) and vessel length-width ratio (C) versus cambial age and the mean of differently aged S. superba.
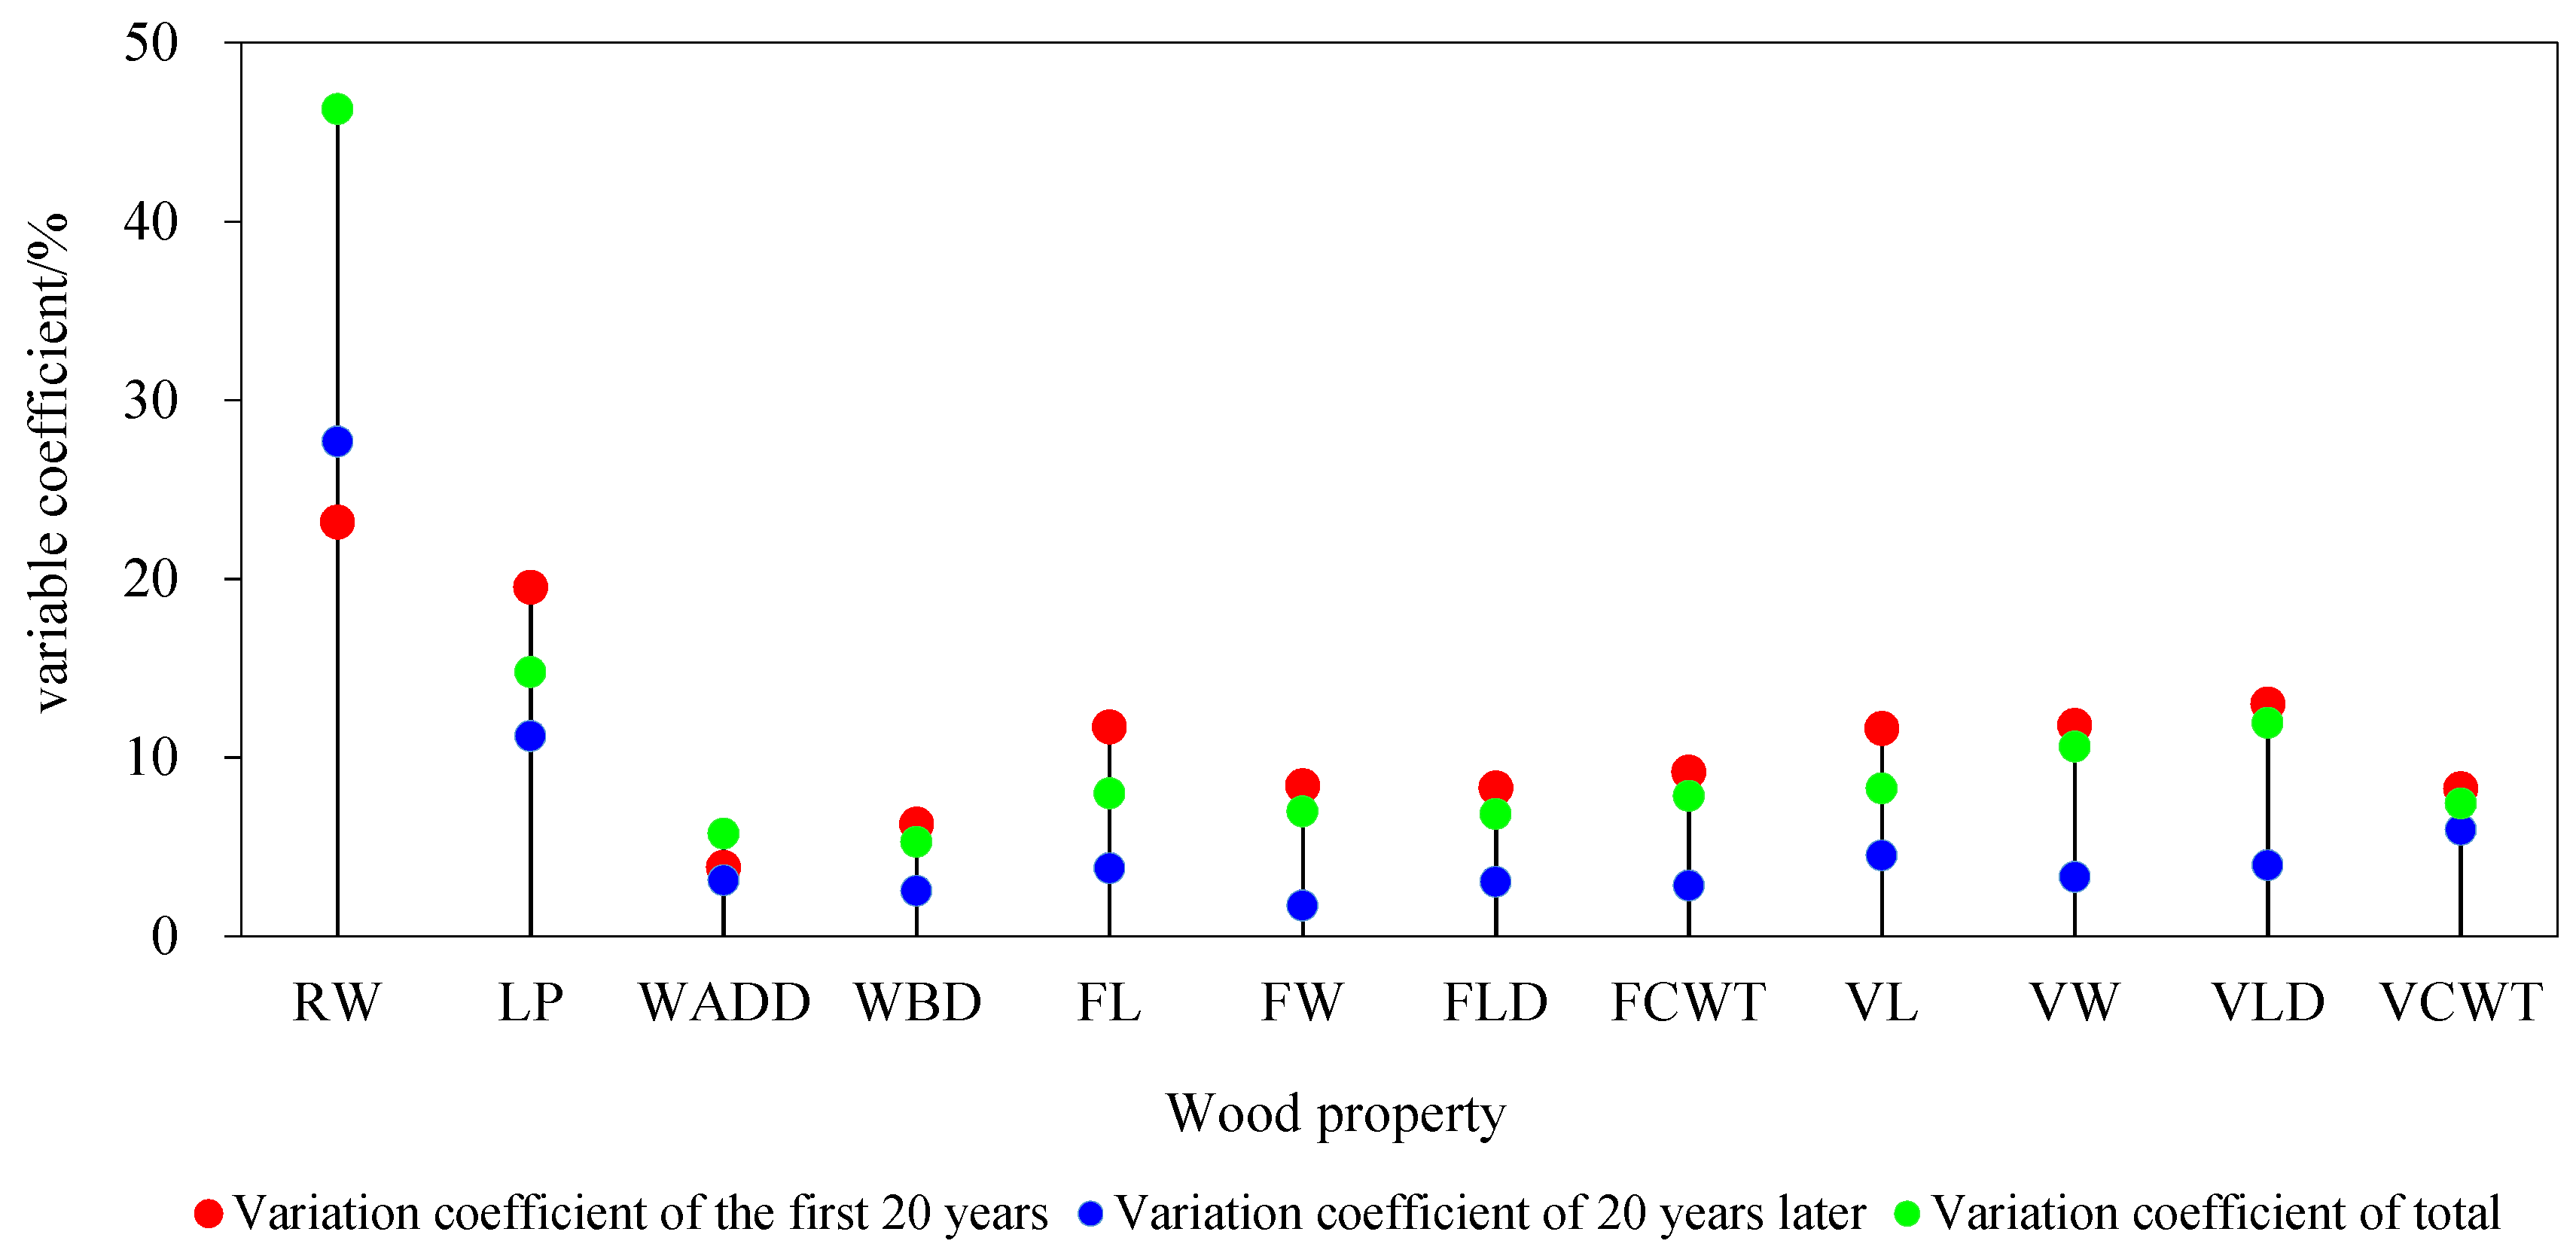
Figure 9.
The variation coefficient of wood properties of S. superba in the first 20 years, 20 years later and in all years. RW: ring width, LP: latewood percentage, WADD: wood air-dry density, WBD: wood basic density, FL: fiber length, FW: fiber width, FLD: fiber lumen diameter, FCWT: fiber cell wall thickness, VL: vessel length, VW: vessel width, VLD: vessel lumen diameter, VCWT: vessel cell wall thickness.
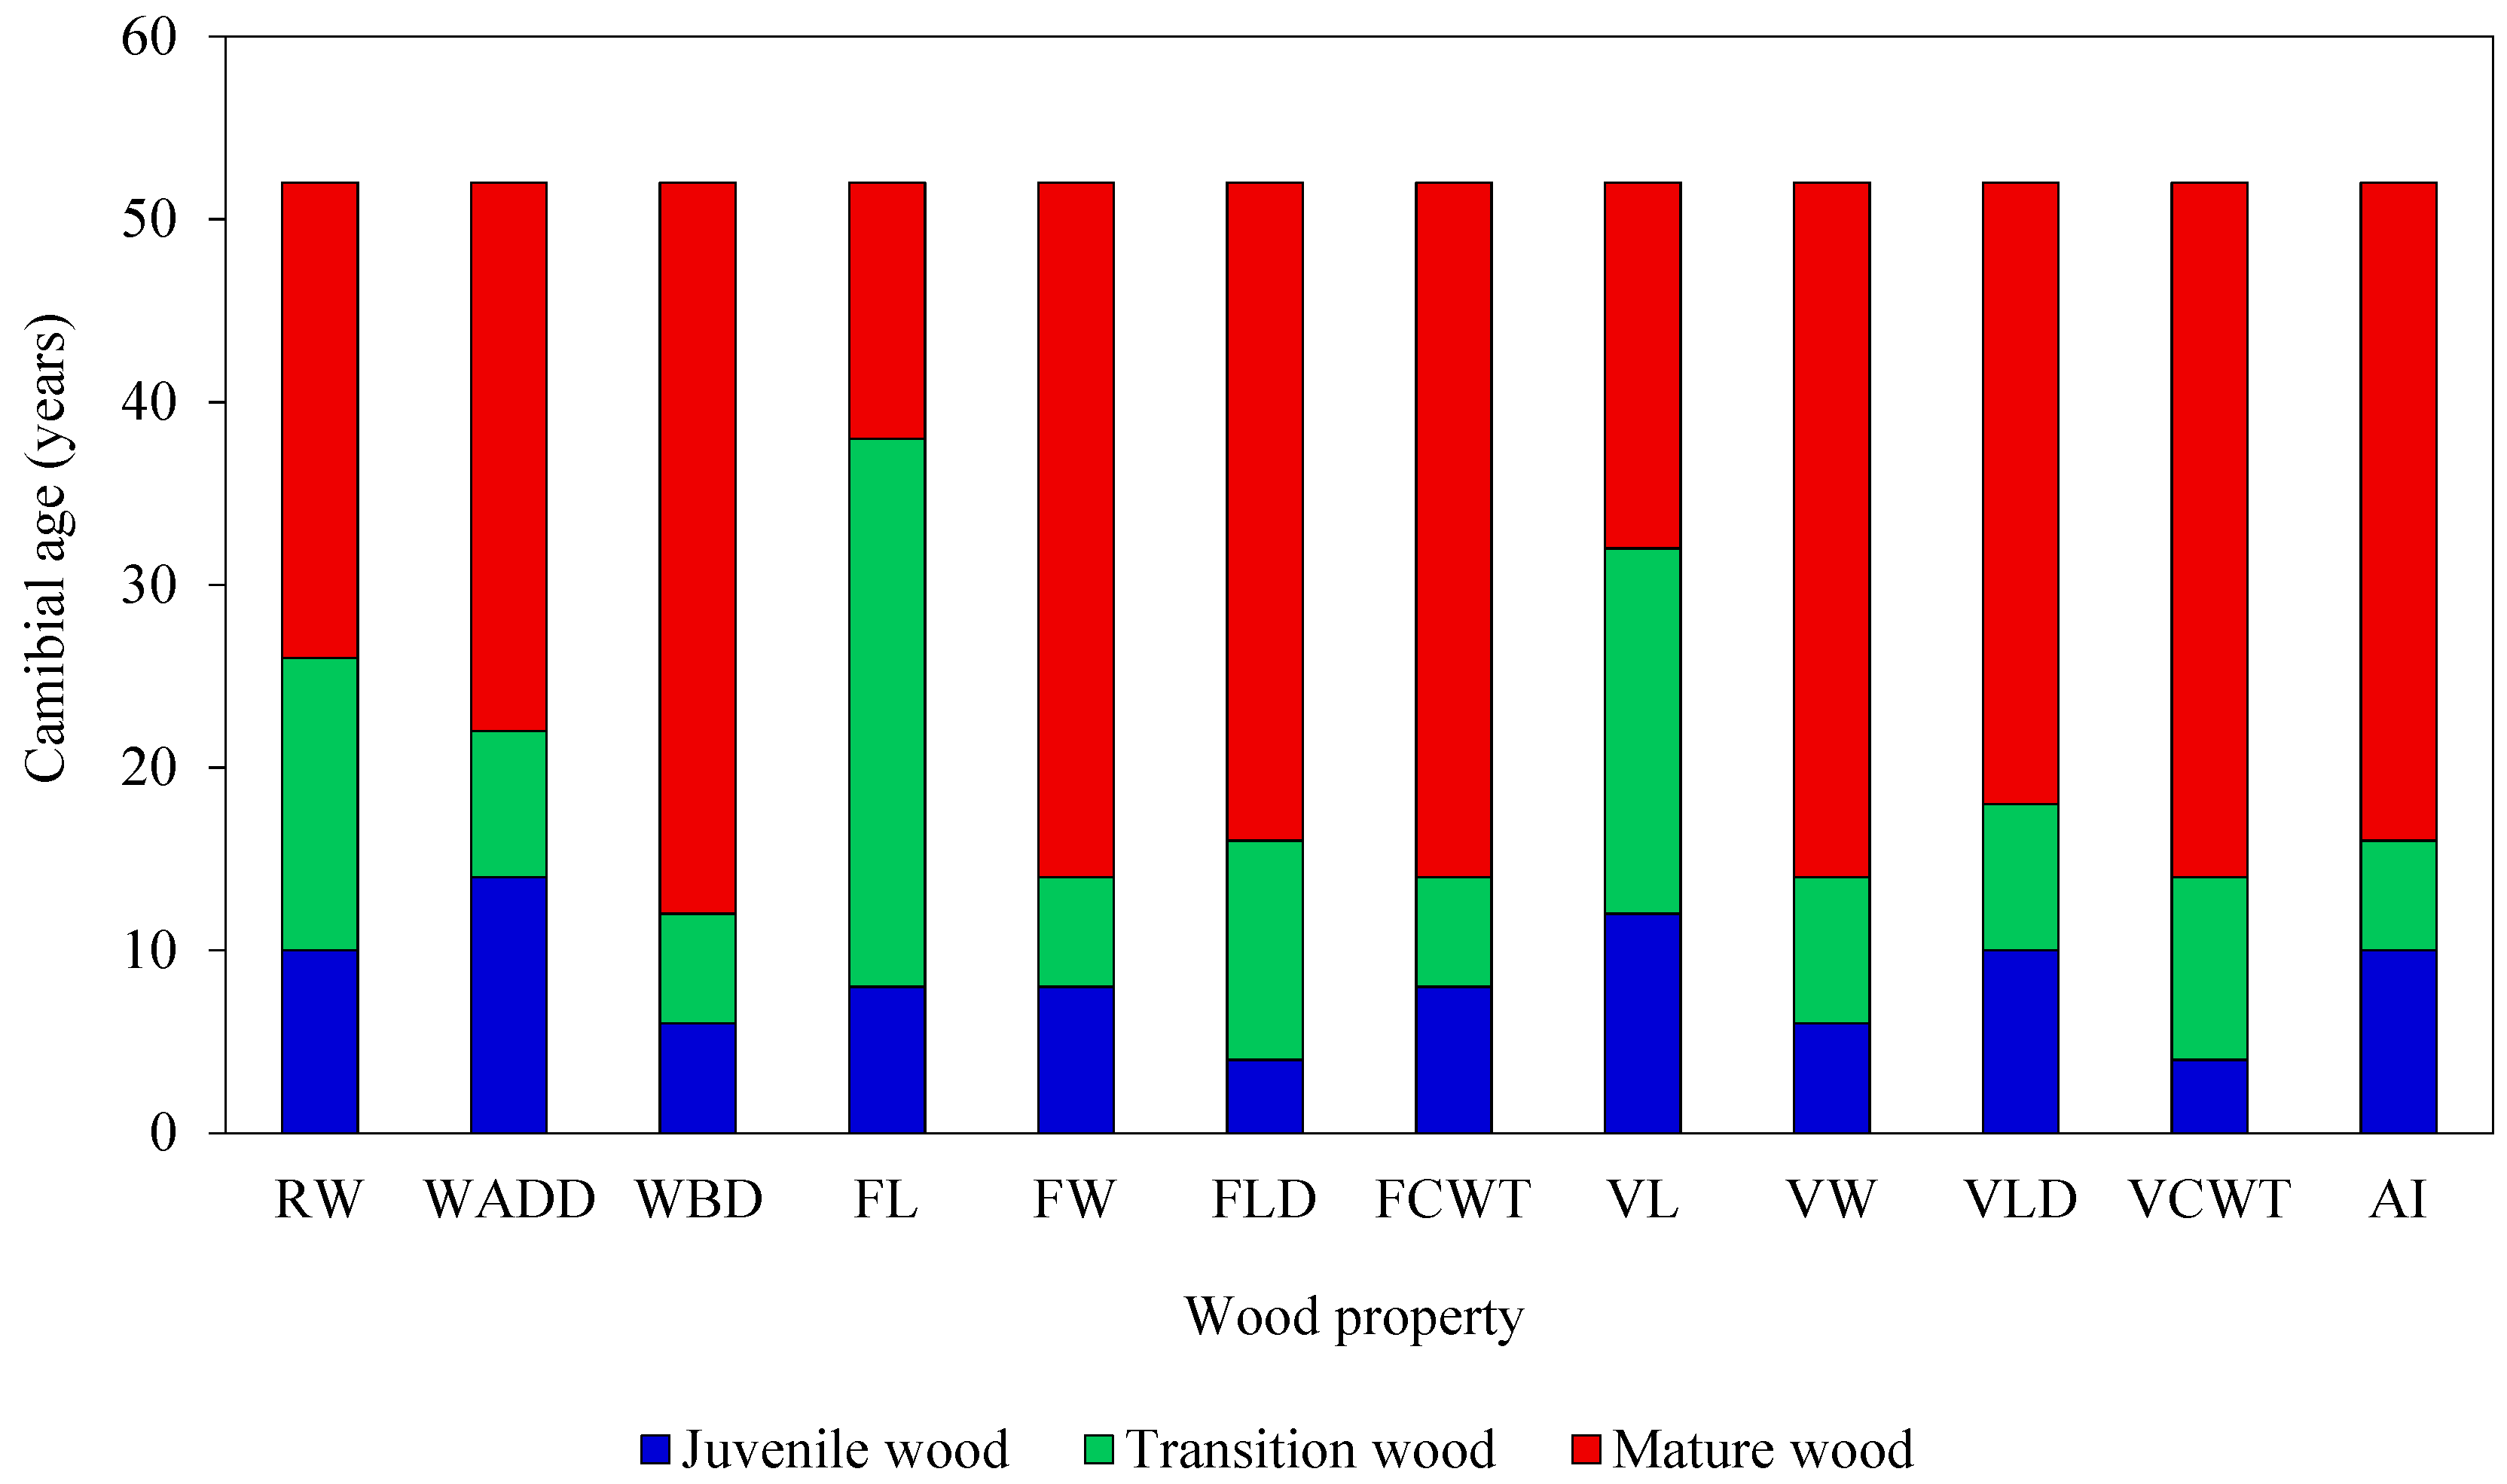
Figure 10.
Demarcation of juvenile wood, transition wood and mature wood in S. superba. RW: ring width, WADD: wood air-dry density, WBD: wood basic density, FL: fiber length, FW: fiber width, FLD: fiber lumen diameter, FCWT: fiber cell wall thickness, VL: vessel length, VW: vessel width, VLD: vessel lumen diameter, VCWT: vessel cell wall thickness, AI: aggregative indicator.
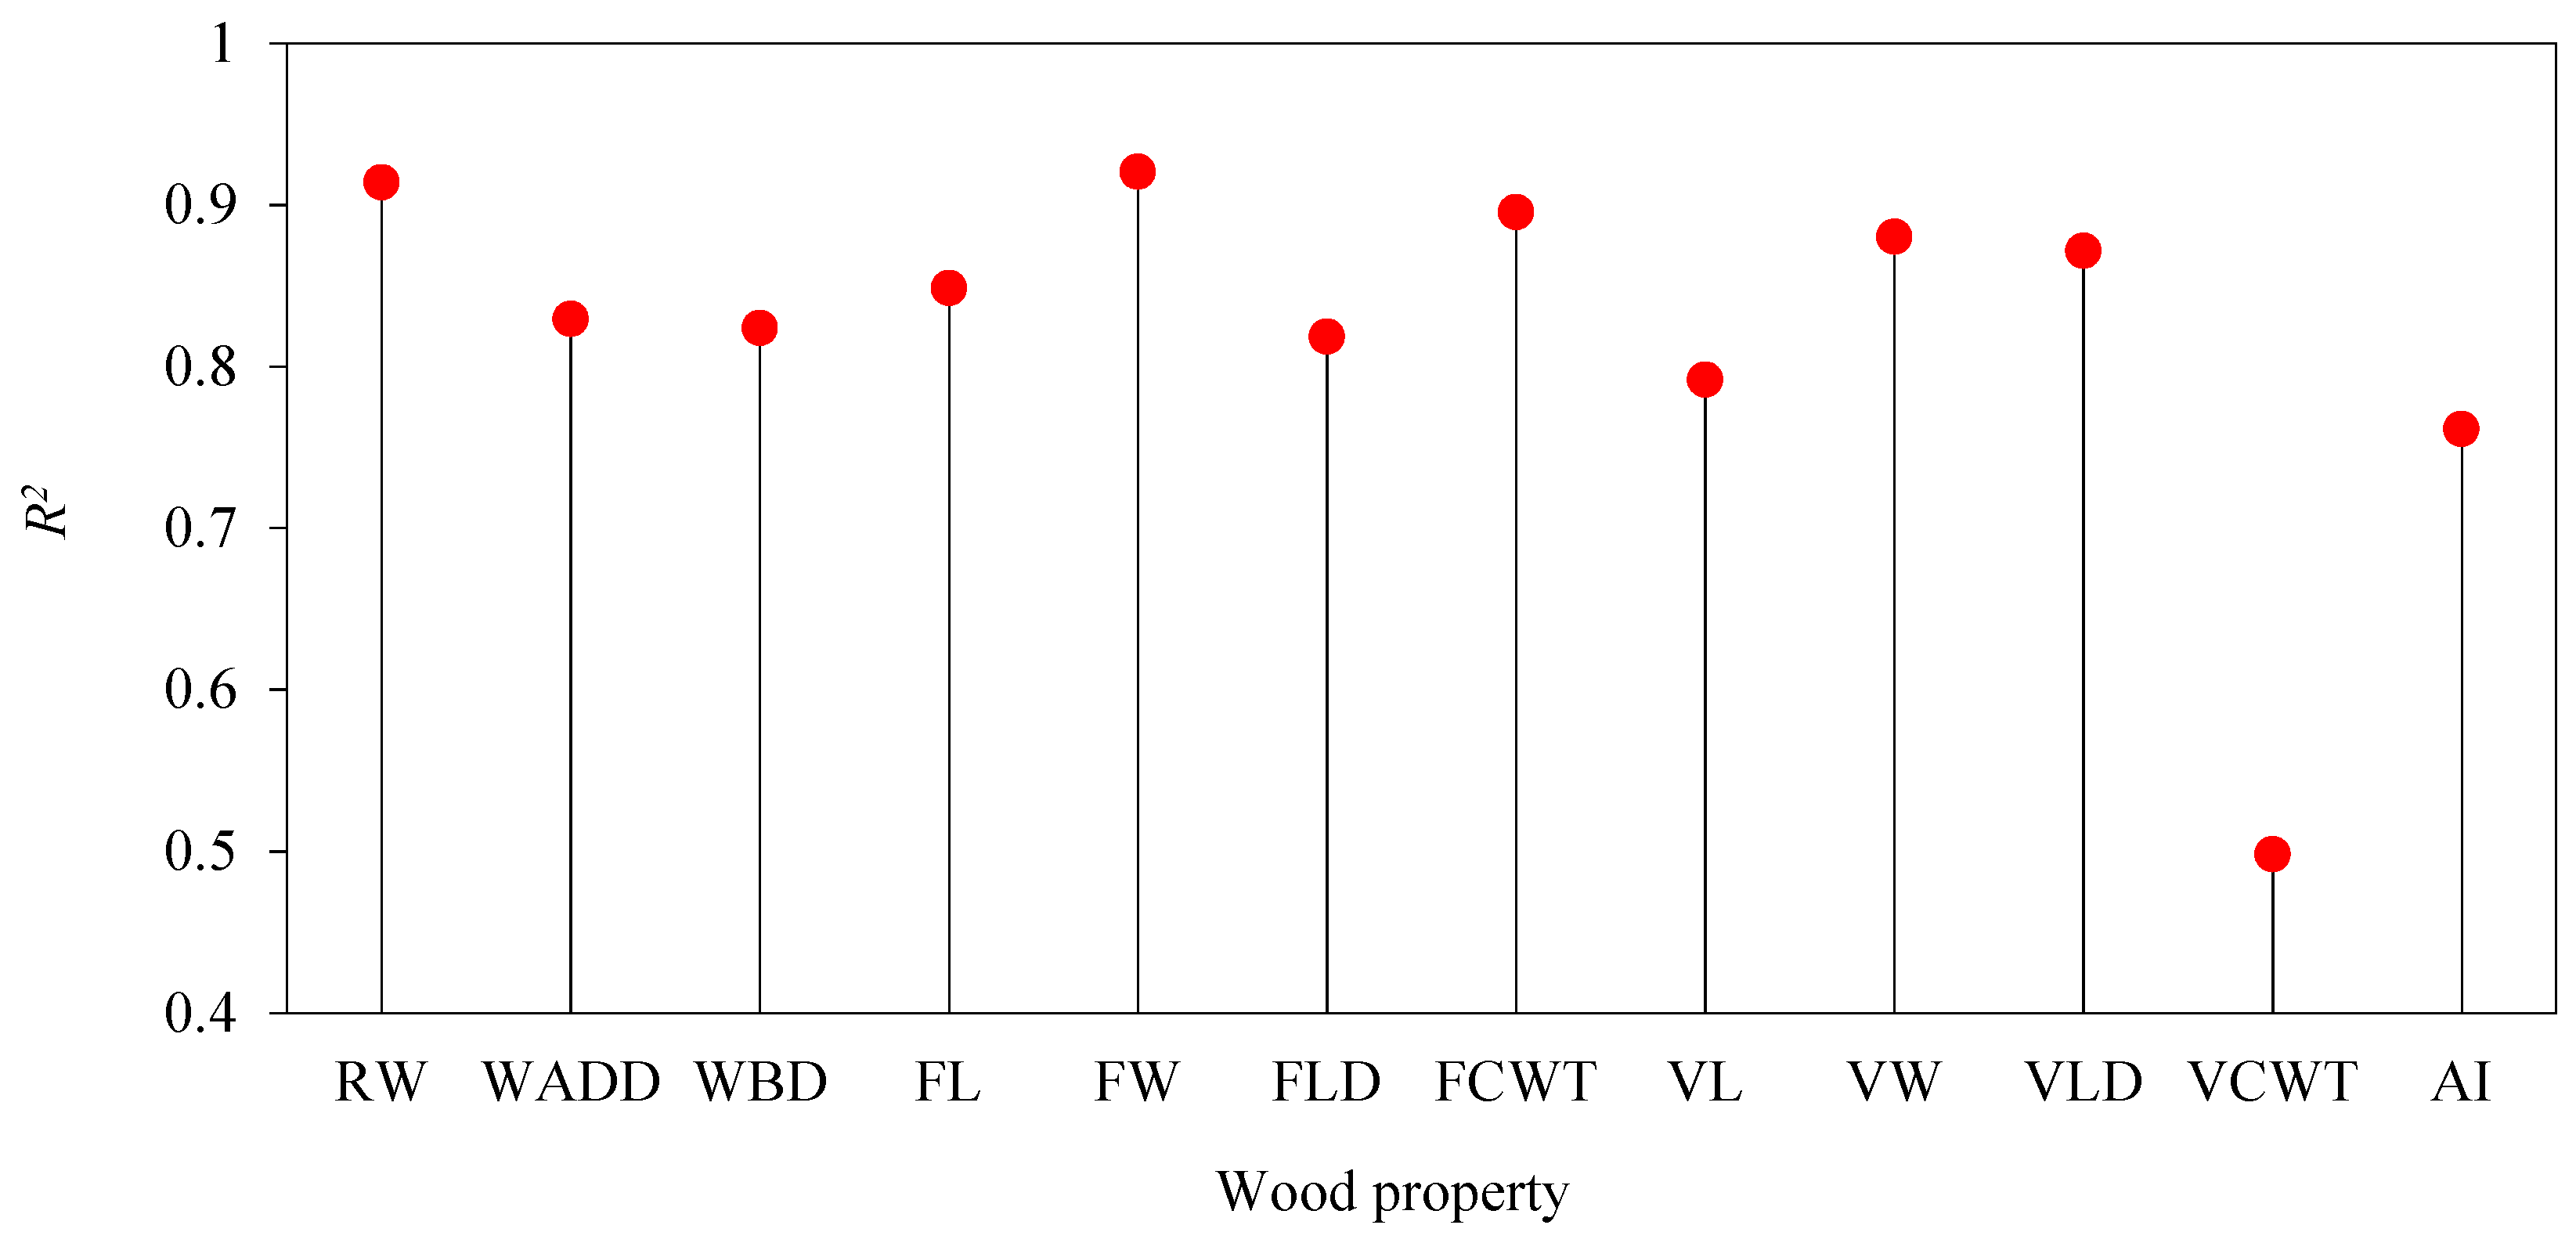
Figure 11.
The determination coefficient (R2) of demarcation of juvenile wood, transition wood and mature wood in S. superba according to the optimal segmentation model. RW: ring width, WADD: wood air-dry density, WBD: wood basic density, FL: fiber length, FW: fiber width, FLD: fiber lumen diameter, FCWT: fiber cell wall thickness, VL: vessel length, VW: vessel width, VLD: vessel lumen diameter, VCWT: vessel cell wall thickness, AI: aggregative indicator.
Table 1.
Basic information of differently aged samples of S. superba.
Table 1.
Basic information of differently aged samples of S. superba.
| Age | Height/m | DBH/cm | Longitude/° | Latitude/° | Altitude/m | Slope Direction | Slope Angle/° |
|---|
| 4 | 2.27 ± 0.45 | 1.81 ± 0.64 | 26.86 | 118.29 | 150 | east | 22 |
| 6 | 4.71 ± 0.72 | 4.95 ± 1.32 | 27.26 | 118.73 | 170 | northeast | 20 |
| 10 | 8.47 ± 0.64 | 8.89 ± 1.6 | 27.06 | 118.27 | 146 | northeast | 18 |
| 20 | 14.32 ± 0.59 | 14.73 ± 2.61 | 26.8 | 118.26 | 120 | east | 25 |
| 54 | 24.76 ± 2.13 | 27.96 ± 4.11 | 26.95 | 118.27 | 150 | east | 15 |
Table 2.
Soil physical and chemical properties of differently aged samples of S. superba.
Table 2.
Soil physical and chemical properties of differently aged samples of S. superba.
| Age | Soil Bulk Density/g·cm−3 | pH Value | Total Nitrogen (g/kg) | Total Potassium (g/kg) | Total Phosphorus (g/kg) | Hydrolysable Nitrogen (mg/kg) | Available Potassium (mg/kg) | Available Phosphorus (mg/kg) | Organic Matter (g/kg) |
|---|
| 4 | 0.90 | 4.16 | 1.59 | 15.20 | 0.41 | 117.50 | 48.40 | 1.05 | 31.90 |
| 6 | 1.07 | 4.22 | 1.03 | 12.36 | 0.18 | 106.70 | 31.80 | 0.72 | 23.20 |
| 10 | 1.10 | 4.48 | 1.15 | 10.77 | 0.19 | 96.75 | 41.40 | 0.91 | 20.75 |
| 20 | 1.05 | 4.03 | 1.31 | 11.93 | 0.41 | 102.00 | 27.70 | 1.05 | 26.80 |
| 54 | 1.17 | 4.00 | 1.34 | 13.25 | 0.30 | 122.10 | 25.15 | 1.15 | 25.80 |
Table 3.
Statistics analysis of wood properties in 54-year-old S. superba specimens.
Table 3.
Statistics analysis of wood properties in 54-year-old S. superba specimens.
| Wood Property | Mean | Standard Deviation | Range |
|---|
| RW/mm | 2.83 | 2.57 | 1.23–5.94 |
| LP/% | 54.71 | 6.71 | 33.57–70.82 |
| WADD/(g·cm−3) | 0.73 | 0.05 | 0.65–0.80 |
| WBD/(g·cm−3) | 0.54 | 0.03 | 0.50–0.62 |
| FL/μm | 1838.58 | 147.07 | 1495.97–2034.11 |
| FW/μm | 32.63 | 2.28 | 27.11–35.21 |
| FLD/μm | 16.31 | 1.12 | 13.21–18.08 |
| FCWT/μm | 16.33 | 1.28 | 13.58–17.68 |
| VL/μm | 1297.34 | 107.16 | 1038.81–1451.10 |
| VW/μm | 79.02 | 8.38 | 58.72–88.65 |
| VLD/μm | 64.70 | 7.72 | 46.70–73.36 |
| VCWT/μm | 14.29 | 1.06 | 11.63–16.75 |
Table 4.
Correlation analysis among different wood properties in the first 20 years and after 20 years.
Table 4.
Correlation analysis among different wood properties in the first 20 years and after 20 years.
| Wood Property | CA | RW | LP | WADD | WBD | FL | FW | FLD | FCWT | VL | VW | VLD | VCWT |
|---|
| CA | | −0.86 ** | 0.13 | −0.32 | 0.48 | −0.85 ** | 0.11 | 0.30 | −0.18 | −0.70 ** | −0.48 | −0.44 | −0.14 |
| RW | −0.88 ** | | −0.05 | 0.12 | −0.37 | 0.87 ** | −0.25 | −0.28 | 0.00 | 0.78 ** | 0.46 | 0.41 | 0.18 |
| LP | 0.41 | −0.61 | | −0.10 | 0.08 | −0.09 | −0.20 | 0.00 | −0.24 | −0.16 | −0.03 | −0.04 | 0.03 |
| WADD | −0.84 ** | 0.78 ** | −0.08 | | −0.16 | 0.14 | 0.42 | 0.13 | 0.36 | −0.17 | 0.11 | 0.09 | 0.07 |
| WBD | −0.98 ** | 0.89 ** | −0.49 | 0.78 ** | | −0.41 | 0.32 | 0.45 | −0.10 | −0.13 | 0.09 | 0.16 | −0.22 |
| FL | 0.98 ** | −0.91 ** | 0.48 | −0.80 ** | −0.96 ** | | −0.17 | −0.25 | 0.07 | 0.77 ** | 0.42 | 0.44 | −0.04 |
| FW | 0.99 ** | −0.90 ** | 0.42 | −0.86 ** | −0.96 ** | 0.97 ** | | 0.62 * | 0.55 * | −0.33 | 0.21 | 0.17 | 0.11 |
| FLD | 0.95 ** | −0.79 ** | 0.33 | −0.73 * | −0.92 ** | 0.91 ** | 0.95 ** | | −0.31 | −0.20 | 0.03 | 0.06 | −0.09 |
| FCWT | 0.96 ** | −0.93 ** | 0.45 | −0.91 ** | −0.93 ** | 0.95 ** | 0.96 ** | 0.84 ** | | −0.18 | 0.22 | 0.14 | 0.24 |
| VL | 0.94 ** | −0.90 ** | 0.46 | −0.81 ** | −0.95 ** | 0.96 ** | 0.93 ** | 0.88 ** | 0.91 ** | | 0.47 | 0.55 * | −0.22 |
| VW | 0.98 ** | −0.87 ** | 0.53 | −0.78 ** | −0.97 ** | 0.98 ** | 0.96 ** | 0.91 ** | 0.94** | 0.96 ** | | 0.95 ** | 0.20 |
| VLD | 0.98 ** | −0.90 ** | 0.55 | −0.79 ** | −0.97 ** | 0.99 ** | 0.97 ** | 0.91 ** | 0.95 ** | 0.96 ** | 0.99 ** | | −0.12 |
| VCWT | 0.90 ** | −0.64 * | 0.41 | −0.63 | −0.87 ** | 0.84 ** | 0.86 ** | 0.87 ** | 0.80 ** | 0.81 ** | 0.91 ** | 0.89 ** | |
Table 5.
Fitting parameters and evaluation of models of different wood properties.
Table 5.
Fitting parameters and evaluation of models of different wood properties.
| Wood Property | Model | Parameter | RMSE | MAD | R2 |
|---|
| β1 | β2 | β3 | β4 |
|---|
| Wood basic density | M1 | 0.0004 | 0.013 | 0.613 | - | 0.013 | 0.010 | 0.799 |
| M2 | 0.605 | 0.523 | 8.893 | 4.221 | 0.012 | 0.009 | 0.824 |
| M4 | 0.852 | −0.345 | −0.363 | −0.183 | 0.014 | 0.010 | 0.762 |
| Wood air-dry density | M1 | 0.803 | −0.005 | 0.00005 | - | 0.030 | 0.033 | 0.737 |
| M2 | 0.783 | 0.691 | 16.098 | 5.934 | 0.017 | 0.012 | 0.832 |
| M4 | 1.073 | −0.125 | −0.191 | −0.525 | 0.023 | 0.017 | 0.677 |
| Fiber width | M1 | −0.025 | 0.894 | 26.443 | - | 0.742 | 0.611 | 0.894 |
| M2 | 27.675 | 33.983 | 11.264 | 4.619 | 0.543 | 0.442 | 0.943 |
| M3 | 33.897 | 18.027 | 3066.388 | 43.742 | 0.497 | 0.380 | 0.952 |
| Fiber cell wall thickness | M1 | −0.015 | 0.513 | 12.881 | - | 0.502 | 0.431 | 0.846 |
| M2 | 13.837 | 17.052 | 12.231 | 6.637 | 0.400 | 0.309 | 0.902 |
| M3 | 17.031 | 18.195 | 939.968 | 14.072 | 0.440 | 0.349 | 0.882 |
| Vessel lumen diameter | M1 | −0.094 | 3.259 | 43.040 | - | 2.332 | 1.689 | 0.909 |
| M2 | 47.755 | 69.396 | 11.078 | 3.984 | 2.350 | 1.676 | 0.907 |
| M3 | 69.233 | 11.625 | 17.623 | 0.447 | 2.287 | 1.629 | 0.912 |
Table 6.
Descriptive statistics for the juvenile wood, transition wood and mature wood of S. superba.
Table 6.
Descriptive statistics for the juvenile wood, transition wood and mature wood of S. superba.
| Wood Property | Juvenile Wood | Transitional Wood | Mature Wood | p Value |
|---|
| RW/mm | 4.99 ± 0.48 a | 3.52 ± 0.83 b | 2.12 ± 1.27 c | <0.001 ** |
| LP/% | 47.26 ± 8.17 c | 64.27 ± 2.73 a | 55.19 ± 4.11 b | <0.001 ** |
| WADD/(g·cm−3) | 0.31 ± 0.01 a | 0.30 ± 0.01 b | 0.28 ± 0.01 c | <0.001 ** |
| WBD/(g·cm−3) | 0.58 ± 0.02 a | 0.54 ± 0.02 b | 0.52 ± 0.01 b | <0.001 ** |
| FL/μm | 1590.93 ± 111.84 b | 1906.76 ± 40.89 a | 1896.02 ± 79.48 a | <0.001 ** |
| FW/μm | 28.45 ± 1.15 c | 31.98 ± 0.84 b | 33.90 ± 0.56 a | <0.001 ** |
| FLD/μm | 14.43 ± 0.96 c | 16.07 ± 0.09 b | 16.87 ± 0.48 a | <0.001 ** |
| FCWT/μm | 14.05 ± 0.50 c | 15.91 ± 0.76 b | 17.03 ± 0.45 a | <0.001 ** |
| VL/μm | 1122.60 ± 74.05 b | 1352.59 ± 85.50 a | 1336.67 ± 59.85 a | <0.001 ** |
| VW/μm | 63.98 ± 4.51 c | 76.99 ± 2.91 b | 83.54 ± 2.94 a | <0.001 ** |
| VLD/μm | 50.87 ± 3.78 c | 62.76 ± 2.32 b | 68.87 ± 2.89 a | <0.001 ** |
| VCWT/μm | 12.96 ± 0.86 b | 14.23 ± 0.62 a | 14.67 ± 0.87 a | 0.002 ** |


