Article

Soil Physicochemical Properties and Fertility Evolution of Permanent Gully during Ecological Restoration in Granite Hilly Region of South China

1
Forestry College, Guangxi University, No. 100 Daxue Road, Nanning 530004, China
2
College of Agricultural, Guangxi University, No. 100 Daxue Road, Nanning 530004, China
3
College of Resources and Environment, Huazhong Agricultural University, No. 1 Shizishan Street, Wuhan 430070, China
*
Authors to whom correspondence should be addressed.
Forests 2021, 12(4), 510; https://doi.org/10.3390/f12040510
Submission received: 23 March 2021 / Revised: 11 April 2021 / Accepted: 14 April 2021 / Published: 20 April 2021
(This article belongs to the Section Forest Ecology and Management)

Abstract

:
Permanent gullies are a serious type of soil erosion. A special type of permanent gully, called “Benggang” severly affects agricultural production in hilly areas. To reveal the influence of Benggang erosion on granitic soil restoration and fertility, we selected three stages (active, semi-stable and stable) of Benggang recovery in the subtropical granite hilly region, and corresponding soil samples were collected to analyze the spatial variation in the soil physical and chemical qualities in the early stage of recovery. The soil physical properties and nutrients were significantly different in the runoff direction of each Benggang gully. There were significant differences in soil chemical properties and no obvious differences in physical properties among the different Benggang recovery stages. The results of principal component analysis showed that the level of soil fertility in the different Benggang recovery stages, ranked from high to low, was as follows: stable, semi-stable and active. Benggang vegetation restoration was an important factor for soil fertility restoration. Benggang ecological restoration can significantly improve the physicochemical properties and fertility of the soil. However, the soil fertility in gully erosion areas in this study still needs to be improved.

1. Introduction

Soil degradation is a major threat to agricultural sustainability and has seriously threatened food security, biodiversity, water resource safety, and the human living environment in China [1,2]. Consequently, improving the productive capacity of degraded soil is particularly important for sustainable agriculture. Soil erosion is one of the most common and important causes of soil degradation [3,4], and it affects all continents and has been accelerated by human use and abuse of land [5,6,7,8]. The red soil region, which has abundant water resources and high temperatures, has a high productivity potential and could be a key to resolving the growing gap between food supply and population growth [9]. Soil erosion is increasing, and soil productivity is declining with the continuous influence of human activities on soil. Gully erosion can be divided into permanent or classic, bank, and ephemeral gullies [10]. Permanent gullies are defined as deep channels that cannot be ameliorated by normal tillage operations. They are landform created through incision into alluvial or colluvial deposits caused by overland or subsurface flows; these features are generally formed by a combination of the effects of intense runoff and gravity [11,12]. Many studies have shown that gully has a strong influence on soil properties and productivity [13,14,15,16]. It has been reported that erosion and gully erosion affected 1220 km2 in the granitic red clay soil region from 1950 to 2005, which led to the loss of more than 60 Mt of soil. Zheng [17] proposed that increased erosion can accelerate soil nutrient loss. Xu et al. [18] showed that gully erosion poses a threat to soil physicochemical properties, and thus, the soil quality index was progressively reduced as gully erosion increased. The above studies mainly focused on the effects of soil erosion on soil properties and soil fertility. Consequently, improving soil fertility in eroded areas is particularly important for sustainable agricultural development, especially in permanent gully areas. It has been recognized that the fertility of soils in gully areas can be restored after a disturbance under a given set of favorable ecological and land use conditions. The recovery of soil fertility is affected by several factors [19], including soil properties and endogenous factors. However, changes in soil nutrients and soil restoration, especially the systematic improvement of soil fertility in permanent gullies, have not received sufficient study in the red soil region of South China.
The erosion of granitic red soil is a unique erosive phenomenon in South China. The granite fissure weathering layer has an expansive soil structure, which is prone to soil erosion, especially in Benggang erosion, which accelerates land degradation and environmental deterioration [20,21]. A Benggang gully, in which a steep collapsing wall forms in the original mountain slope surface under the influence of water and gravity, is a particular type of permanent gully that is widespread in South China [22,23,24]. A Benggang gully consists of five parts: the upper catchment, collapsing wall, colluvial deposit, scour channel and alluvial fan (Figure 1) [25,26,27]. Such landforms are mainly distributed in Hubei, Hunan, Jiangxi, Fujian, Guangdong, Guangxi, and Anhui provinces [20,28]. These gullies are characterized by fast development and strong burst, which makes it more threatening than common soil erosion. Moreover, Benggang erosion is a complex process controlled by many closely related factors, such as lithology, soil, and climate [29]. In 2005, more than 239,100 collapsing gullies, with an erosion area of 1220 km2 and a total prevention area of 2436 km2 (The statistical management area of each Benggang is greater than), were reported by the Monitoring Center of Soil and Water Conservation of China [30]. Benggang erosion is divided into three stages (active, semi-stable and stable) according to the degree of vegetation restoration. During the active stage of Benggang erosion, there is no vegetation cover and serious soil erosion and gravity erosion is taking place. In the semi-stable stage of Benggang erosion, there is more vegetation and less soil erosion, and in the stable stage of Benggang, the soil vegetation cover is the highest. Benggang erosion exerts an important effect on soil fertility restoration in China. In recent years, several studies have investigated the erosion patterns, causes and control measures of Benggang erosion [20,31]. However, few studies have addressed soil fertility change caused in the process of soil restoration in Benggang area of South China. Soil fertility is a comprehensive reflection of all aspects of soil properties and is commonly used to evaluate soil quality. Frequently used evaluation methods include factor analysis [32], cluster analysis [33], discriminant analysis [34], the Nemero index [35], and principal component analysis (PCA) [36,37]. PCA is widely used in soil fertility evaluations. Xie et al. [38] applied PCA to evaluate the soil fertility of specific soils and different soil types. Thus, PCA can be used to comprehensively evaluate the soil fertility of Benggang gullies in different recovery stages.
We selected three stages (active, semi-stable and stable) of Benggang restoration occurring in southeastern Guangxi as the focus of this study. The objectives were to study the evolution process of soil physicochemical properties at different stages of Benggang restoration and to evaluate and compare soil fertility in different stages of Benggang restoration. The purpose of this study was to clarify the effect of ecological restoration at different Benggang restoration levels on soil fertility in order to provide a theoretical and practical basis for the restoration of permanent gullies.

2. Materials and Methods
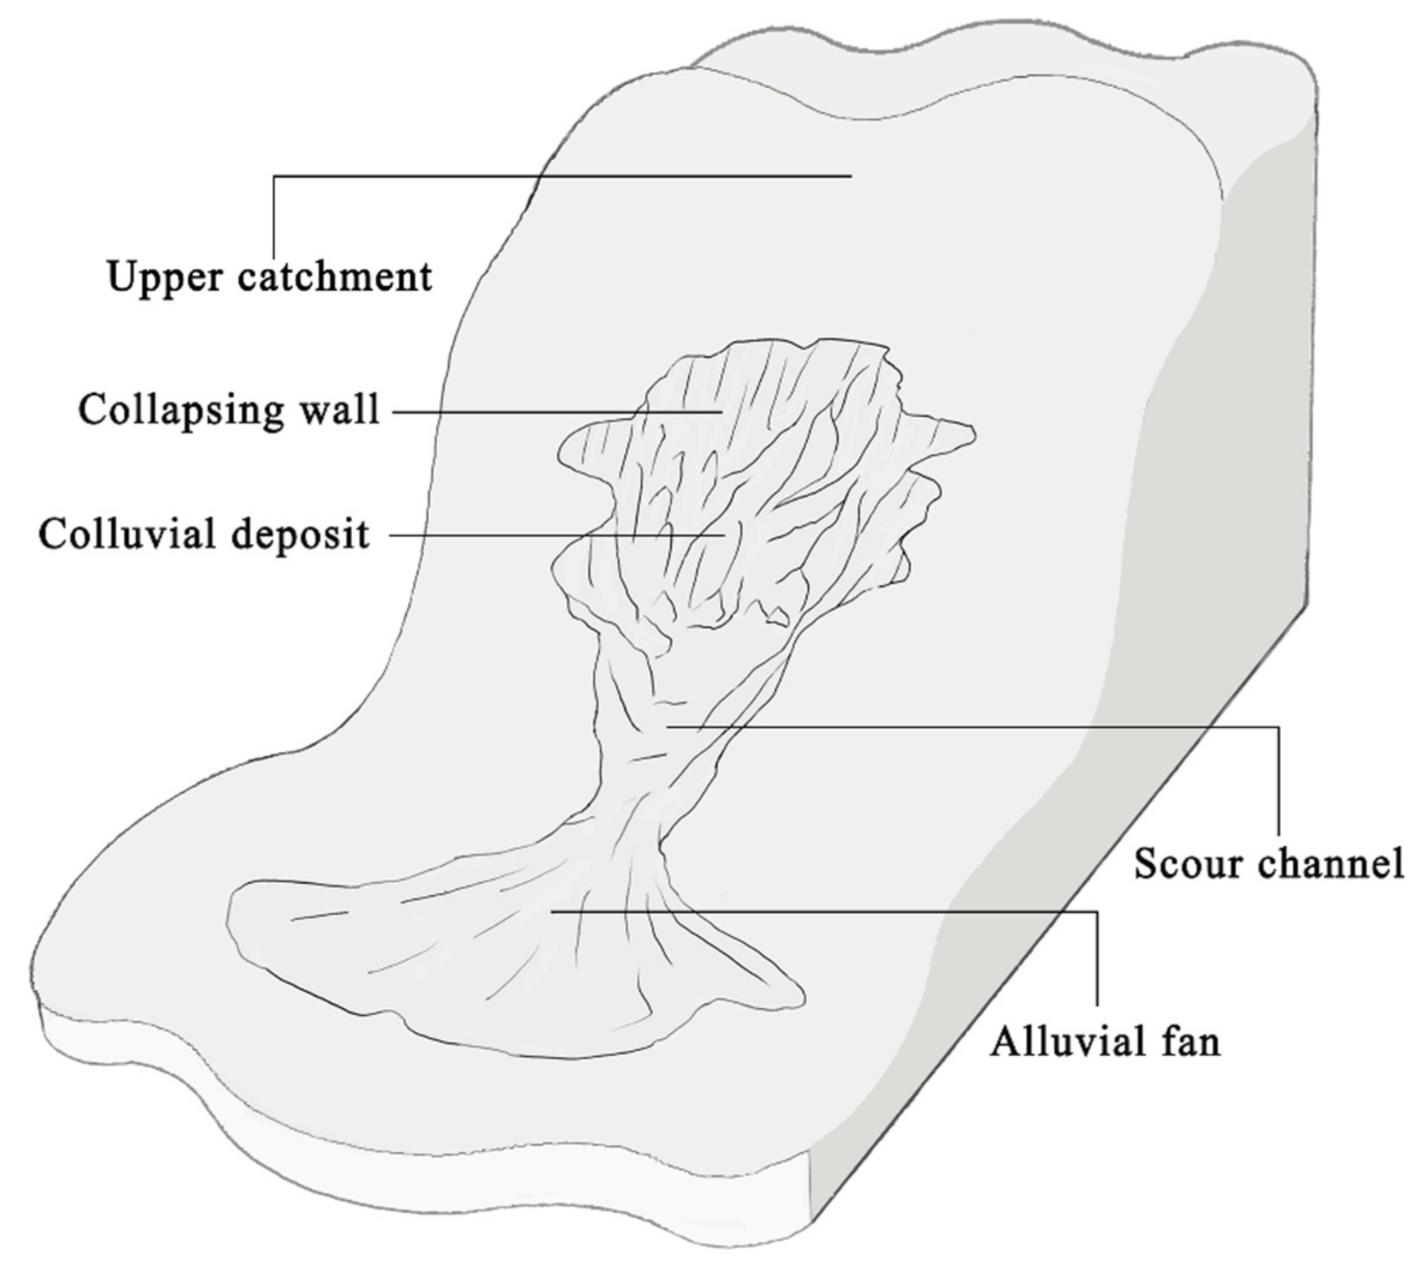
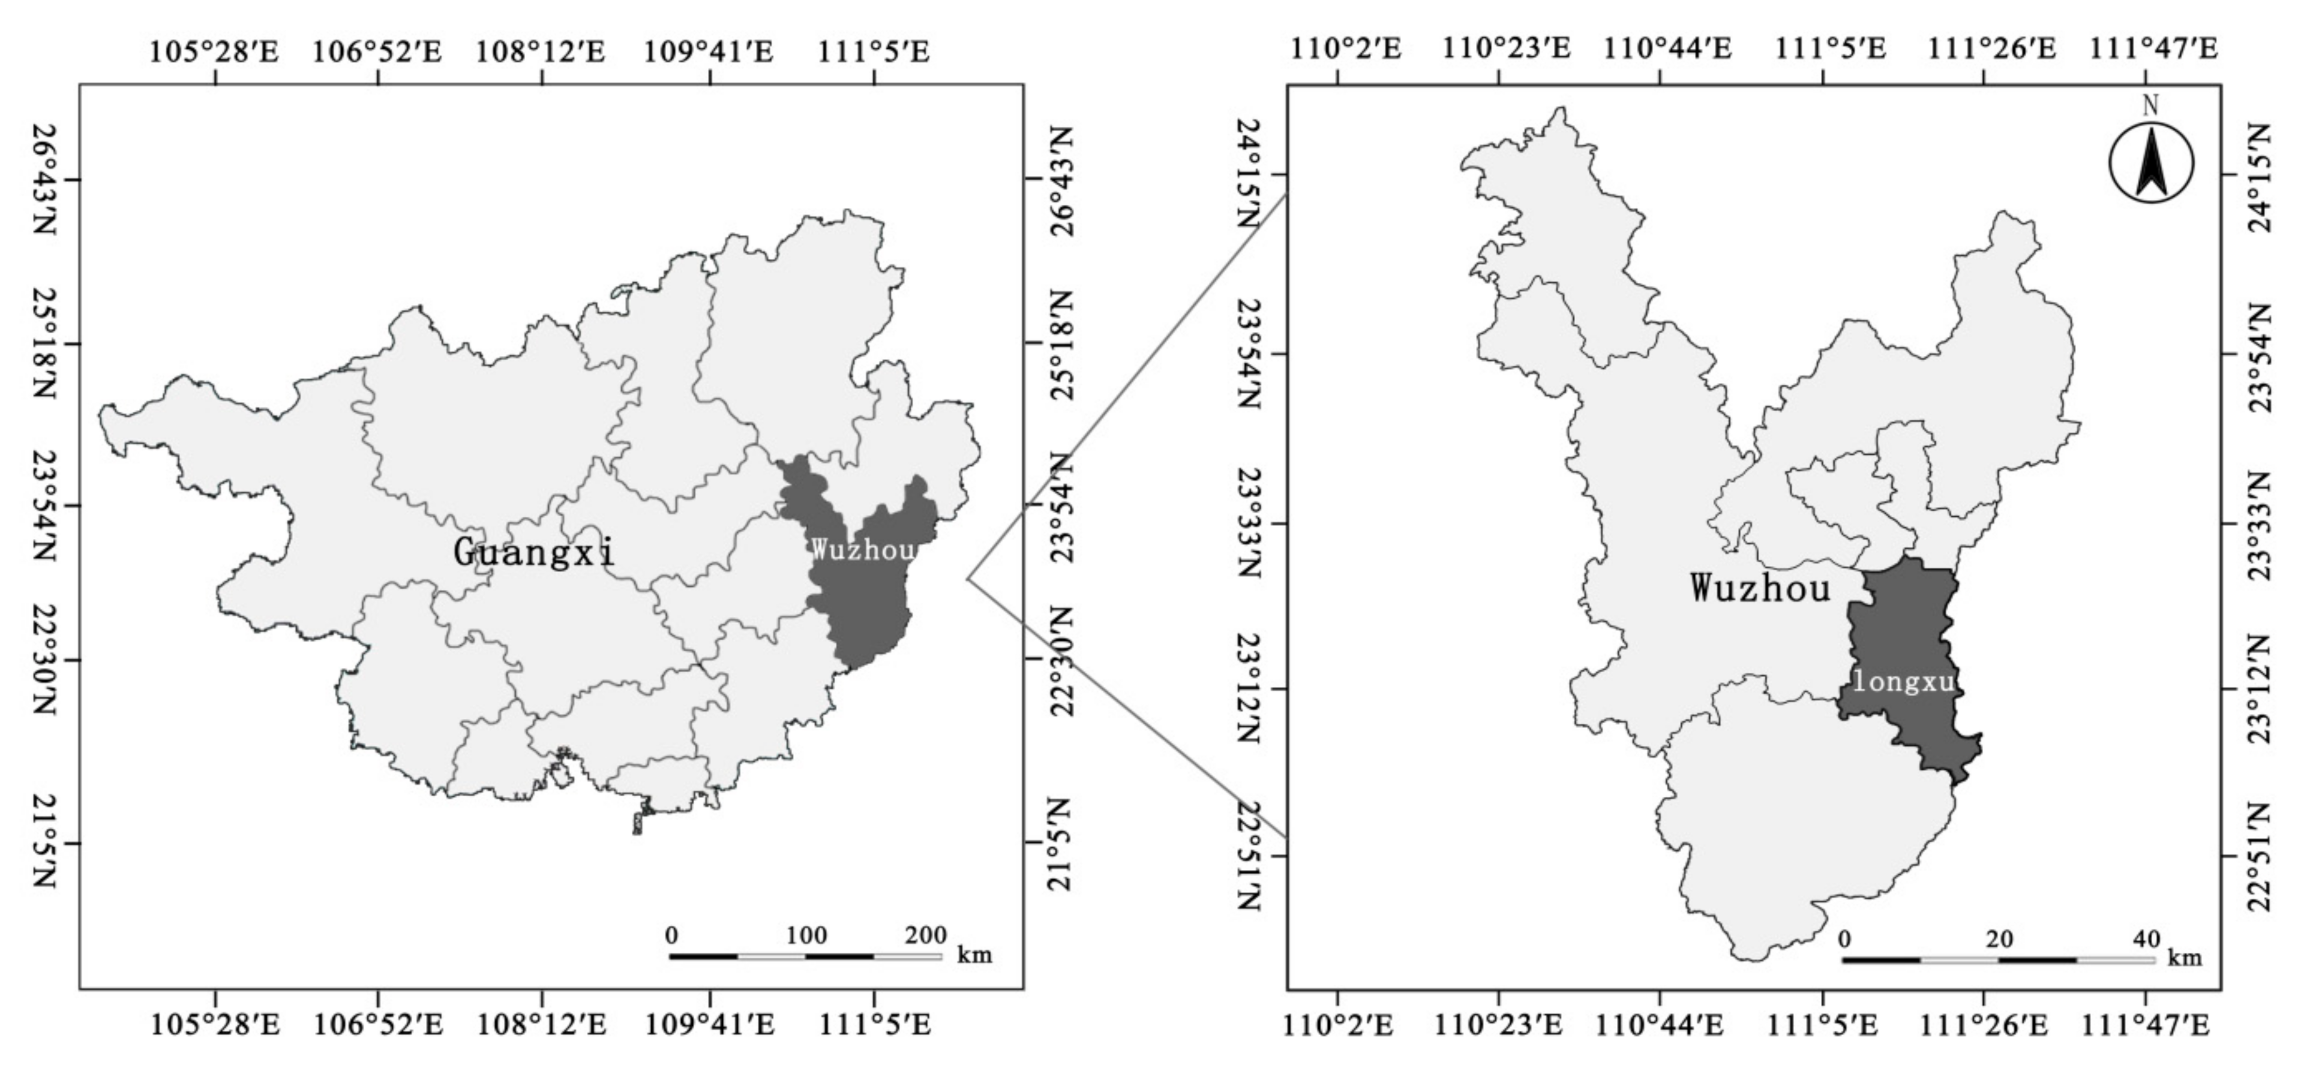
2.1. Study Sites

The investigation site is located in the northern Longxu district (110°51′ to 111°40′ E and 23°26′ to 24°10′ N), Wuzhou city, Guangxi Zhuang Autonomous Region, China (Figure 2). The area is characterized by a warm subtropical humid climate, with mean annual temperature of 21.12 °C and mean annual precipitation of 1520 mm. The soils are typical red soils that originate from granitic parent materials and are easily erodible. There are a variety of vegetation species, including shrubs, gramineous plants and ferns, such as Pinus massoniana, Rhodomyrtus tomentosa and Dicranopteris dichotoma.

2.2. Field Survey and Soil Sampling

According to a field investigation of permanent gullies in southeastern Guangxi, areas in the active, semi-stable and stable stages of Benggang restoration were selected depending on the degree of vegetation cover. The active Benggang areas (AG), which have bare soils and sparse vegetation, were mainly dominated by ferns such as Dicranopteris dichotoma. In the semi-stable Benggang areas (MG), vegetation was dominated by Pinus massoniana and a small amount of undergrowth vegetation, such as Dicranopteris dichotoma and Miscanthus floridulus, and in the stable Benggang areas (SG), the vegetation coverage increased significantly. Combining the morphological distribution and spatial sampling points of the Benggang areas, soil samples were collected along the upper catchment, collapsing wall, colluvial deposit, scour channel and alluvial fan in the sample plots representing different stages of Benggang restoration. Each collapsing wall was divided into top, middle and lower sections for sampling, each colluvial deposit was divided into top and lower sections for sampling and each alluvial fan was divided into top, middle and edge sections for sampling. At each site the litter was removed, and sampling points were selected along an S shaped line. The soils from multiple soil profiles at the same sampling point and the same depth layer were mixed into one soil sample, with a total of 30 soil samples. Approximately 1–2 kg of soil samples was transferred to the laboratory and was air dried for determination of soil particle composition, pH, organic matter, cation exchange capacity, and nutrients. In addition, the soil bulk density, soil total porosity, capillary porosity and aeration porosity were measured in samples collected with a volume of 100 cm3 (5.02 cm diameter and 5.05 cm height).

2.3. Determination Methods

Soil particle sizes were described in terms of the percentages of sand (0.05~2 mm), silt (0.002~0.05 mm) and clay (<0.002 mm) according to the United States Department of Agriculture classification of soil particle size and determined by the pipette and sieve method. The ring cutting method was used for soil bulk density, total porosity, capillary porosity, aeration porosity, and saturated water content determination. A pH meter was used to measure the pH of a 1:2.5 soil: water suspension. Soil organic matter (OM) was obtained by the K2Cr2O7-H2SO4 oxidation method. The semi-micro Kjeldahl method was used for determining the content of total nitrogen (TN). Total phosphorous (TP) was determined colorimetrically after wet digestion with H2SO4-HClO4 [39]. Flame photometry was used to measure the content of total potassium (TK). The alkaline permanganate oxidation method was determined available nitrogen (AN) [40]. The Olsen’s method was used for colorimetric determination of the content of available phosphorus (AP) in 0.5 mol NaHCO3 (pH 8.5) [41]. The content of available potassium (AK) was assayed using flame atomic absorption spectrophotometry [42]. Cation exchange capacity (CEC) was determined by ammonium acetate extraction buffered at pH 7 [43].

2.4. Data Processing

Microsoft Excel 2016 was used for data calculation. IBM SPSS Statistics 19.0 and Origin 2021 was used for correlation analysis and principal component analysis. One-way analysis of variance (ANOVA) was used to test the differences in soil properties in different stages of Benggang restoration, and the significance level was set to α = 0.05. In this study, the 20 parameters were measured including 11 physical parameters and nine chemical parameters. The values of the different physical and chemical parameters varied to different degrees. Therefore, the original data must be standardized to eliminate the influence of different dimensions and orders of magnitude to ensure the reliability of the PCA results. The normalized parameters of the original variables were recorded as ZSHC, ZBD, ZSTP, ZCP, ZNCP, ZSWC, ZGravel, ZSand, ZClay, ZSilt, ZFWC, ZpH, ZOM, ZCEC, ZTN, ZTP, ZTK, ZAN, ZAP, and ZAK.

3. Results

3.1. Descriptive Statistical Analysis of Soil Properties

Table 1 shows the overall statistical data for the 11 soil physical properties and eight soil chemical properties. The average contents of gravel, sand, silt and clay were 23.78%, 47.94%, 31.36%, and 20.70%, respectively. Soil texture analysis showed that soils in this region were predominantly composed of sand, with lower clay and silt contents. The percentages of saturated hydraulic conductivity (0.69%) and aeration porosity (11.15%) were much lower than the soil field water capacity, saturated water content, total porosity, and capillary porosity (29.63%, 37.31%, 49.85%, and 38.70%, respectively), which led to decreased soil water, smaller soil pores, soil erosion and land degradation. The soils in this region were moderately acidic, and the coefficients of variation in the soil index were between 0 and 1. The study showed that the coefficient of variation was classified into three categories: weak variation (CV < 10%), moderate variation (10% < CV < 100%) and strong variation (CV > 100%). The coefficients of variation of saturated water content, bulk density, total porosity, capillary porosity, and pH were all weakly variable, and the other indexes were moderately variable. Soil organic matter had the greatest coefficient of variation (75.55%). The coefficients of variation of saturated hydraulic conductivity, cation exchange capacity and available potassium were greater than 50%, and their coefficients of variation varied and fluctuated greatly in space. The coefficients of variation for sand, silt and field water capacity were less than 20% and relatively stable.

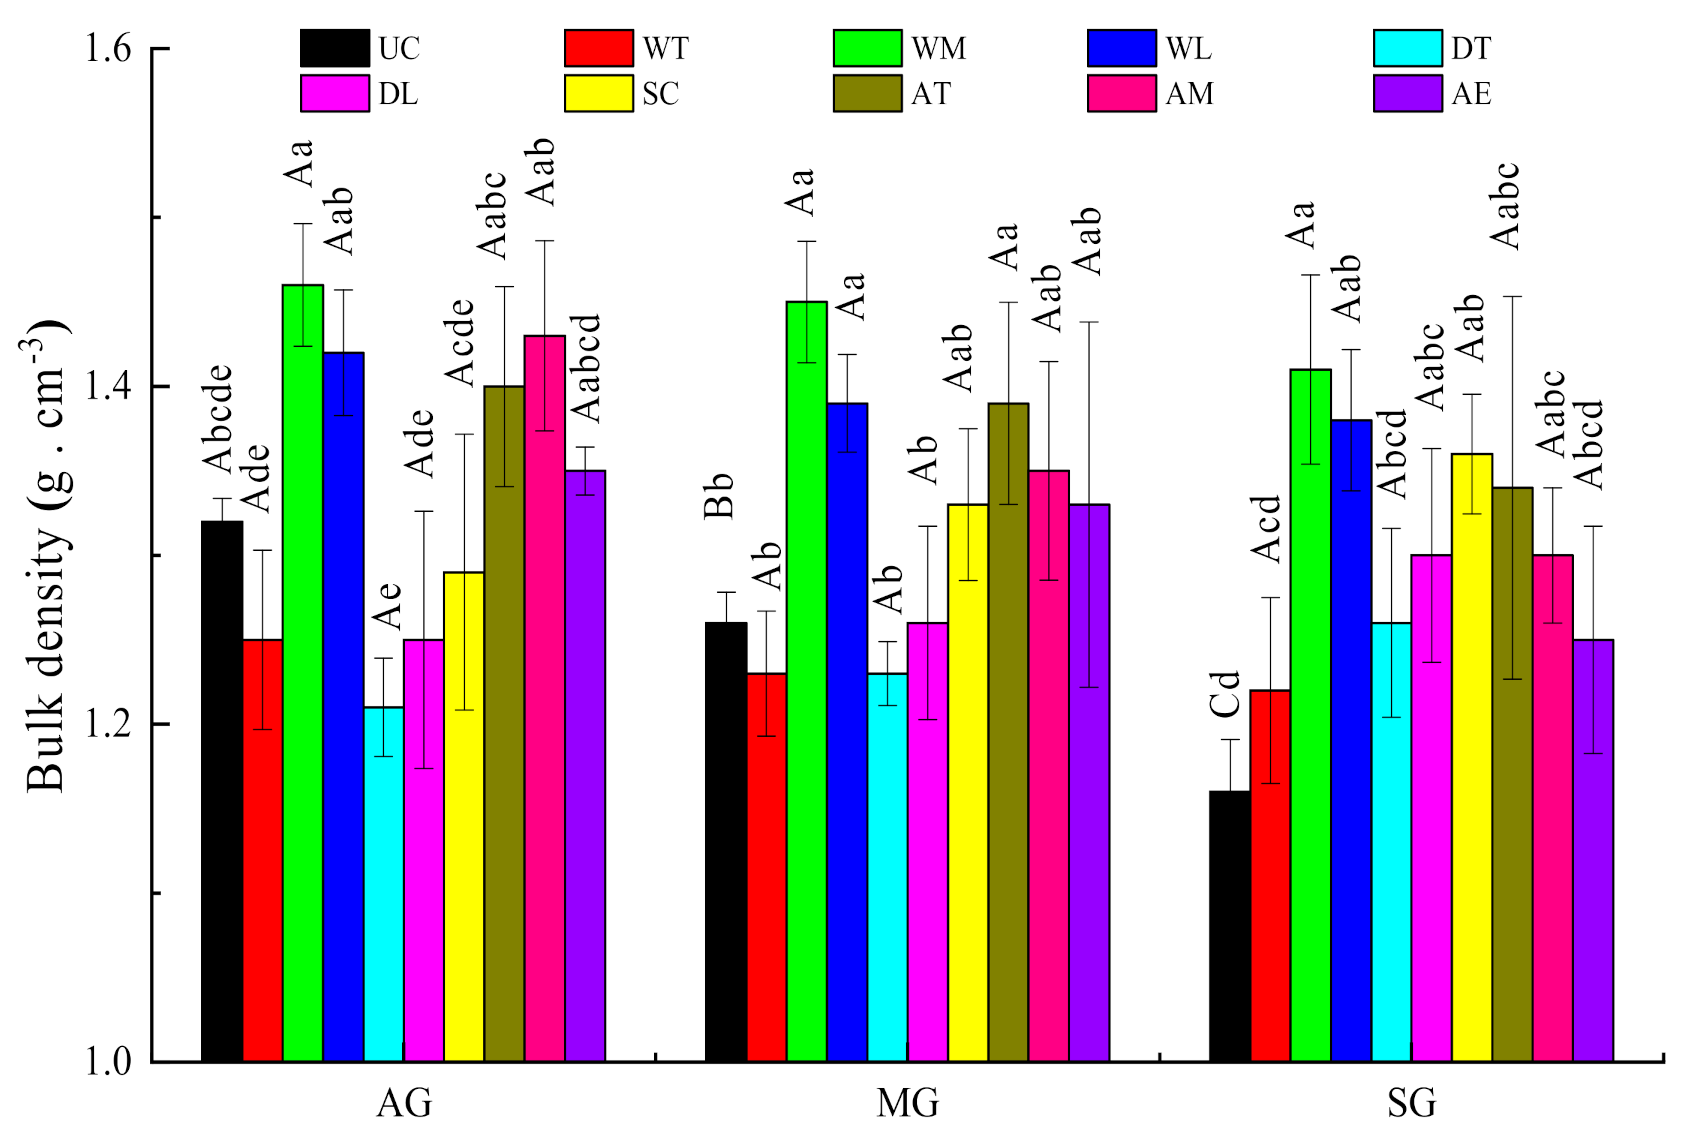
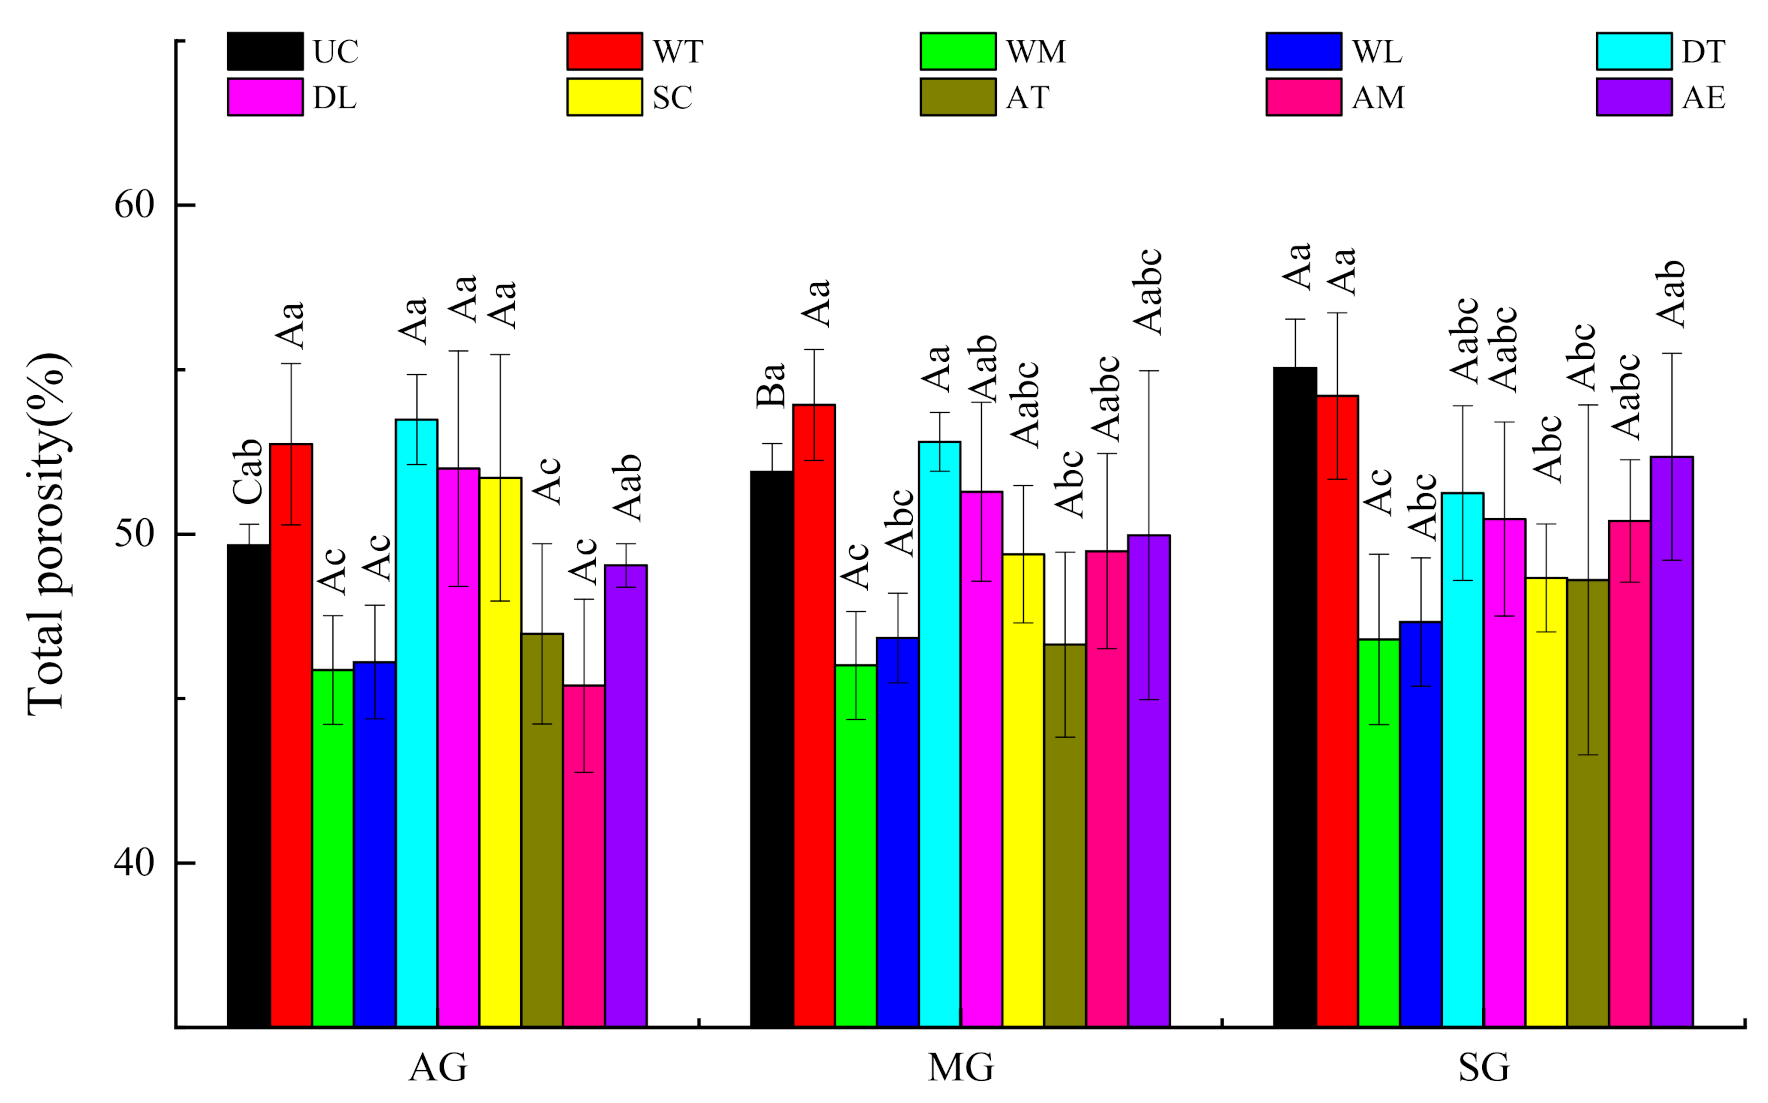
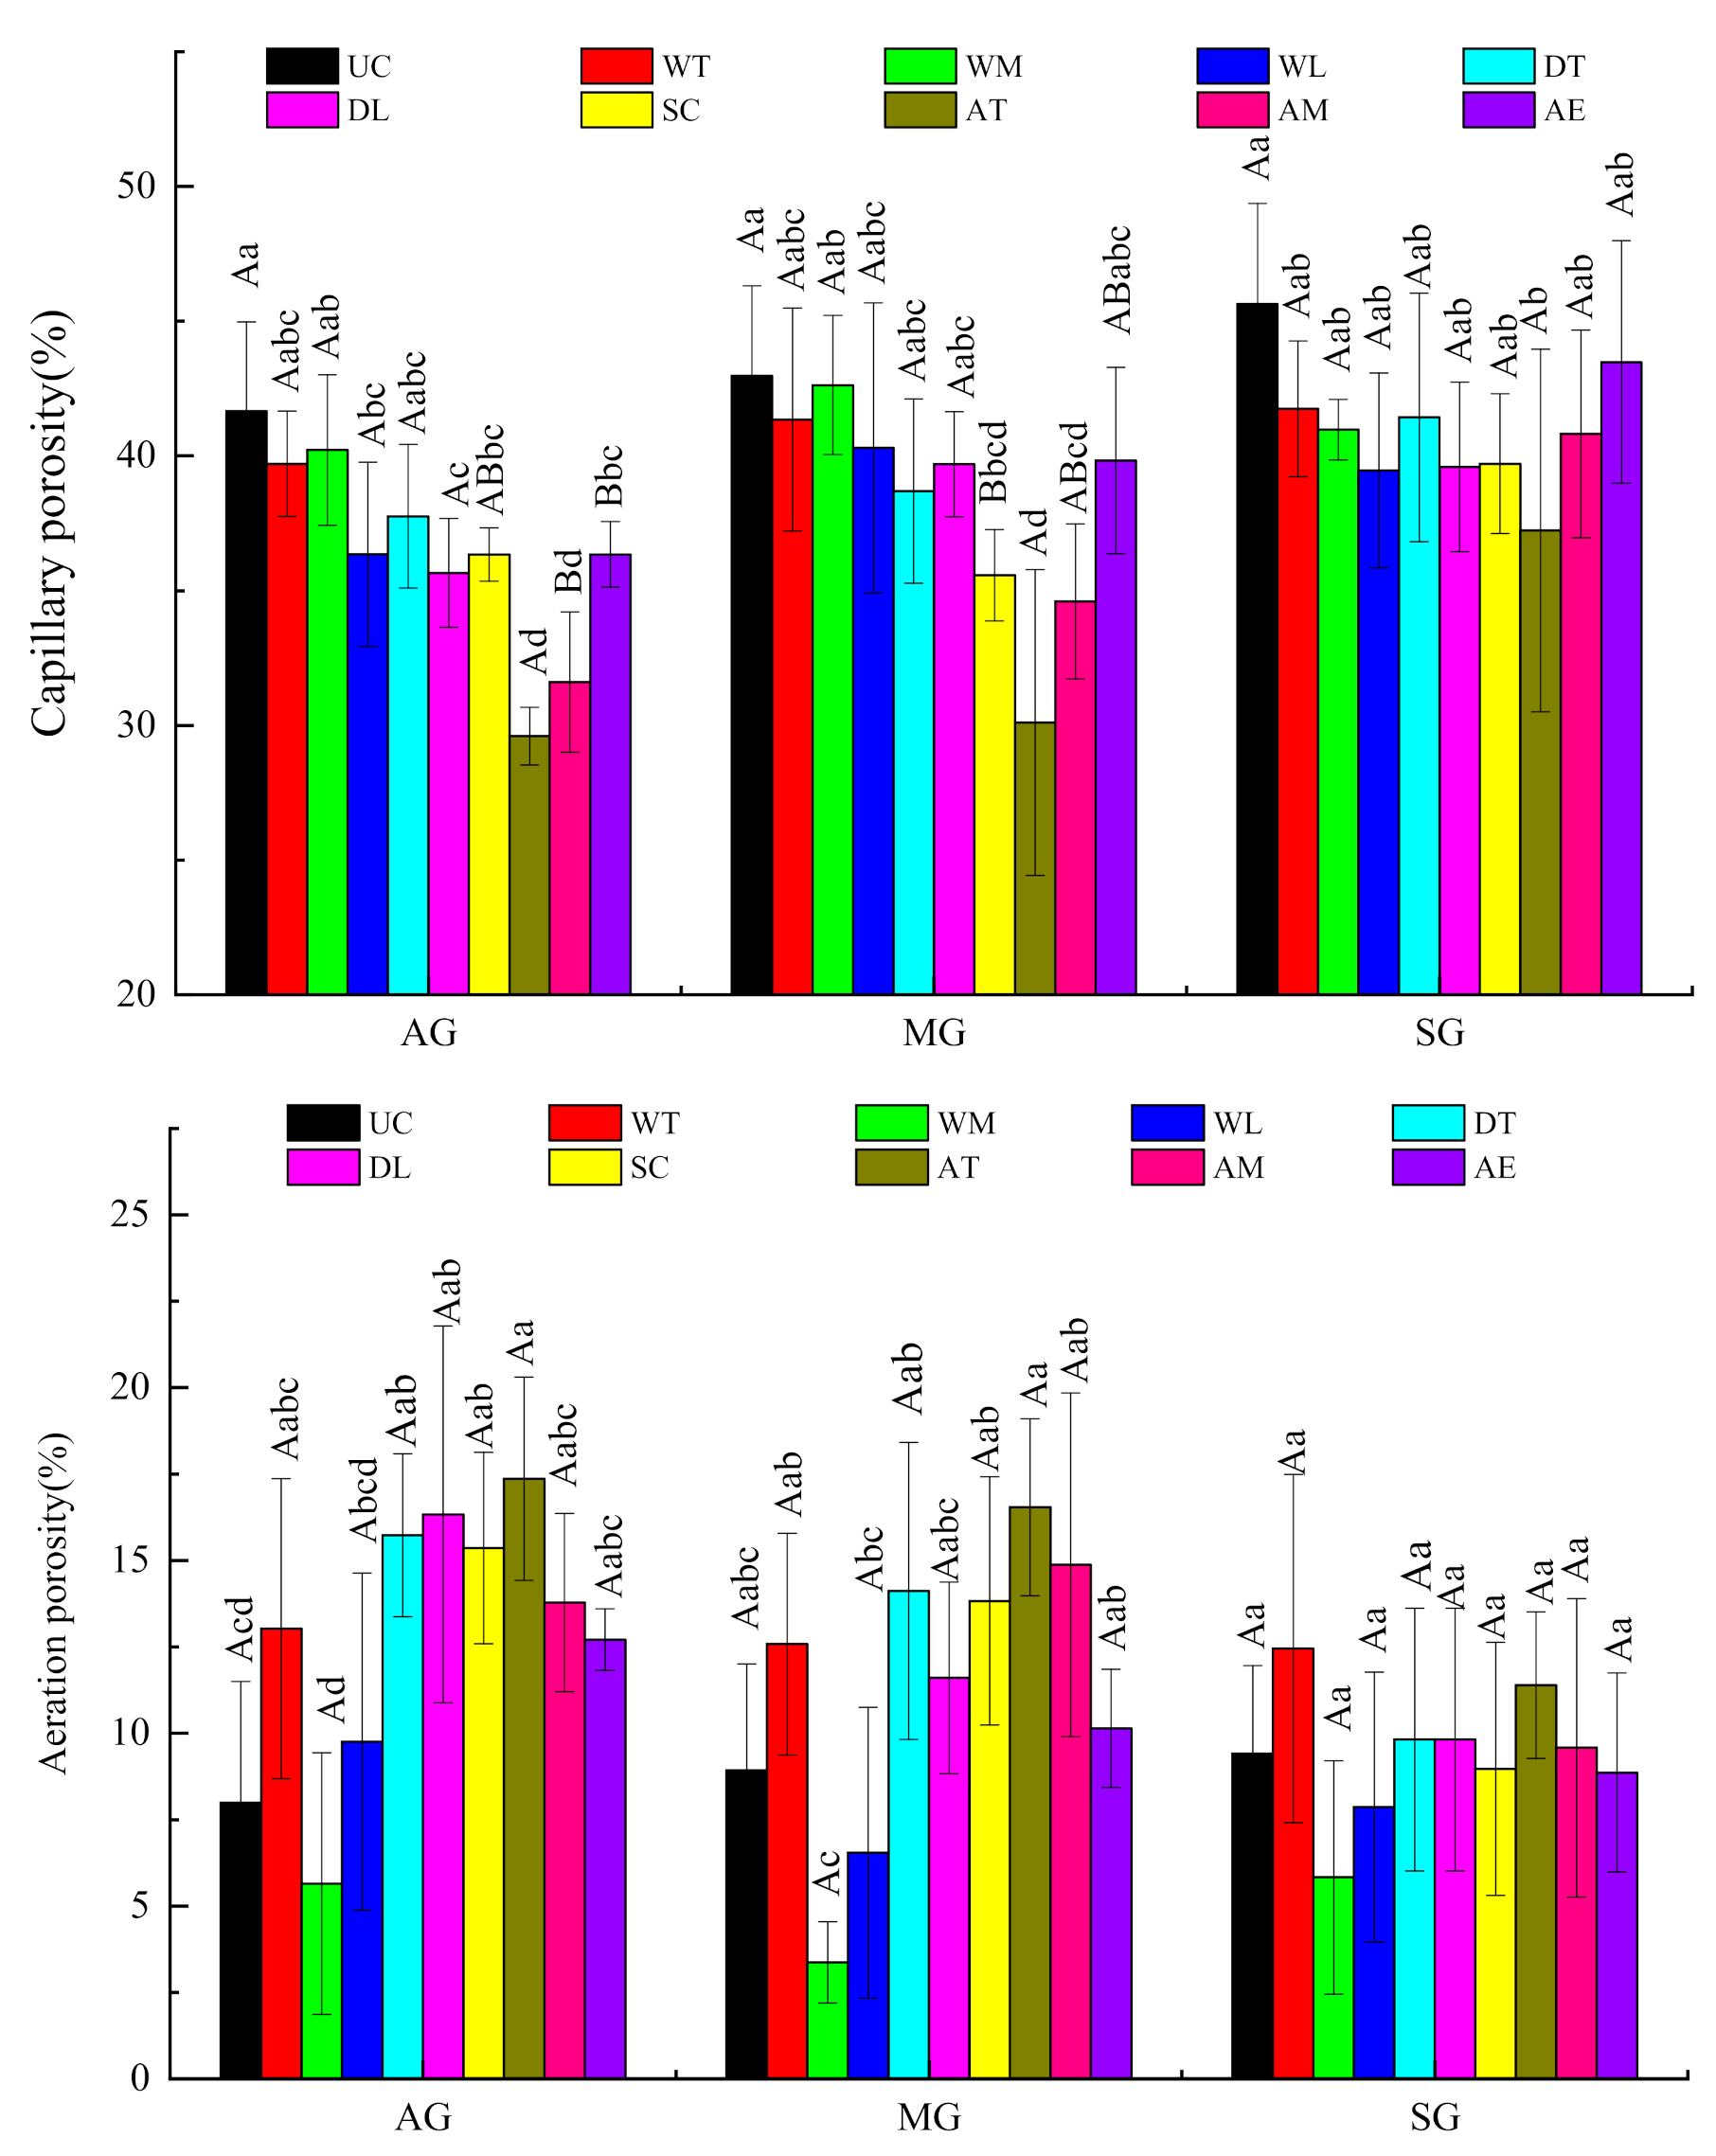
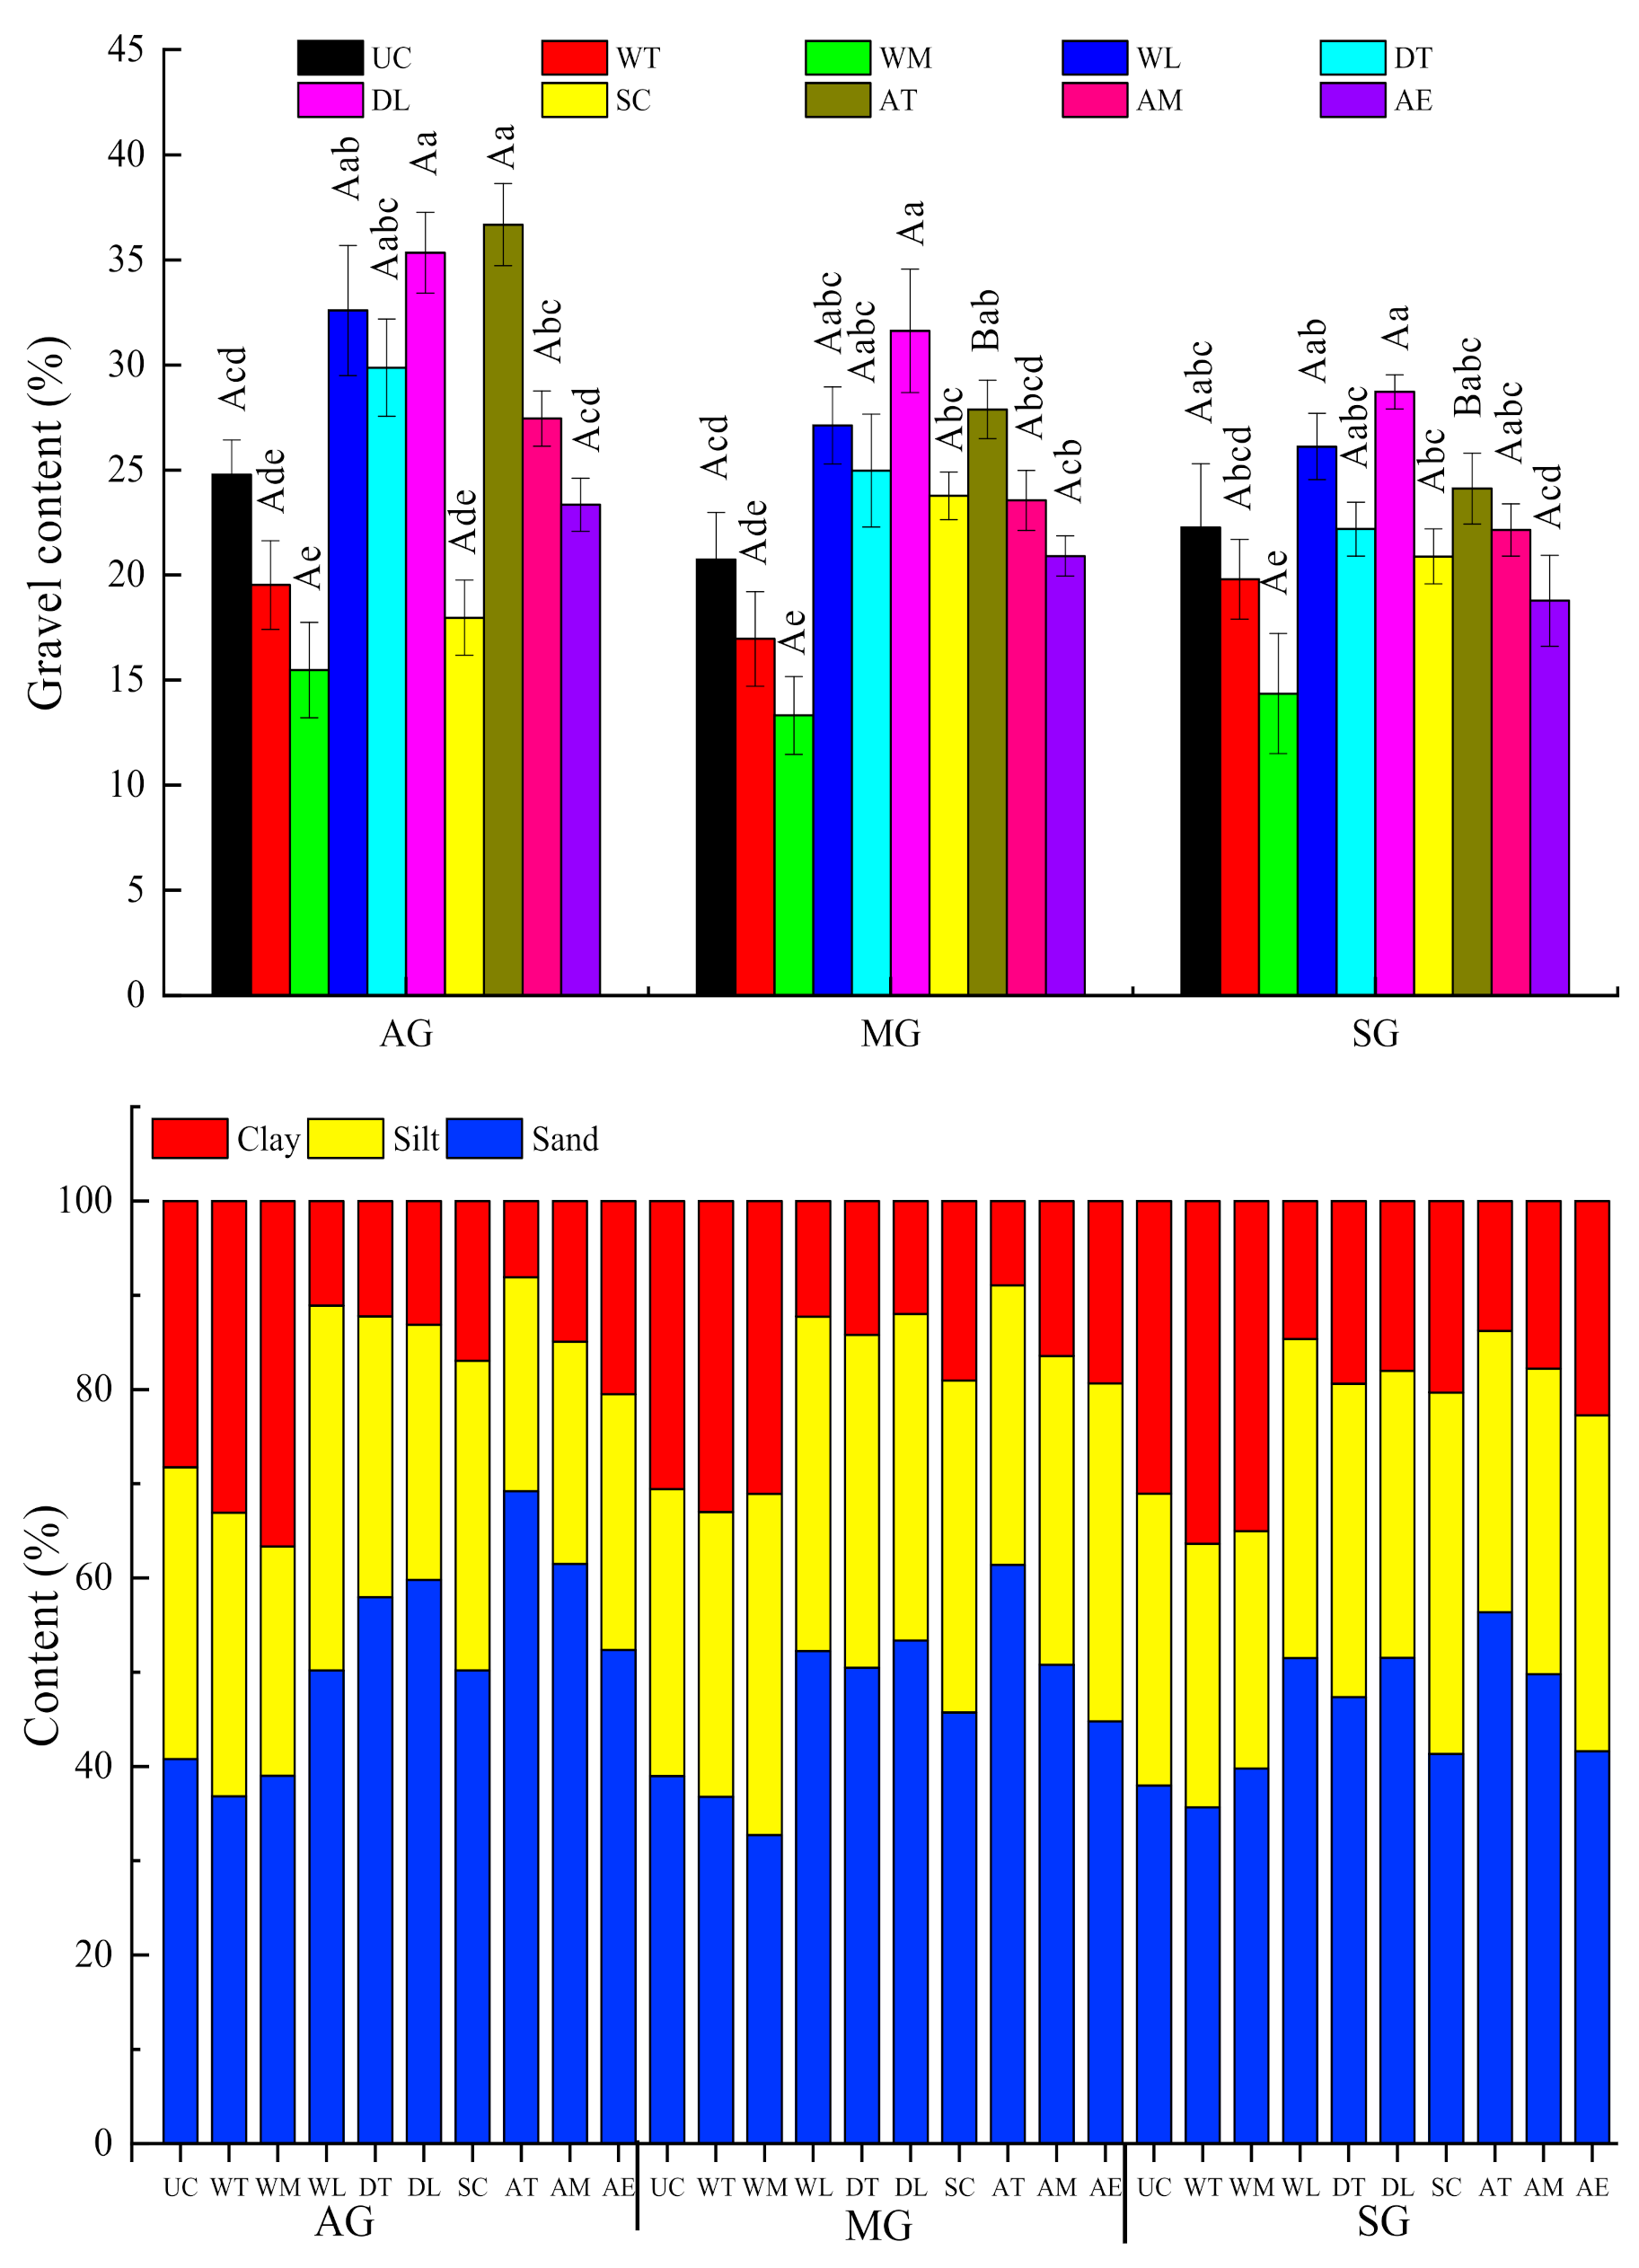
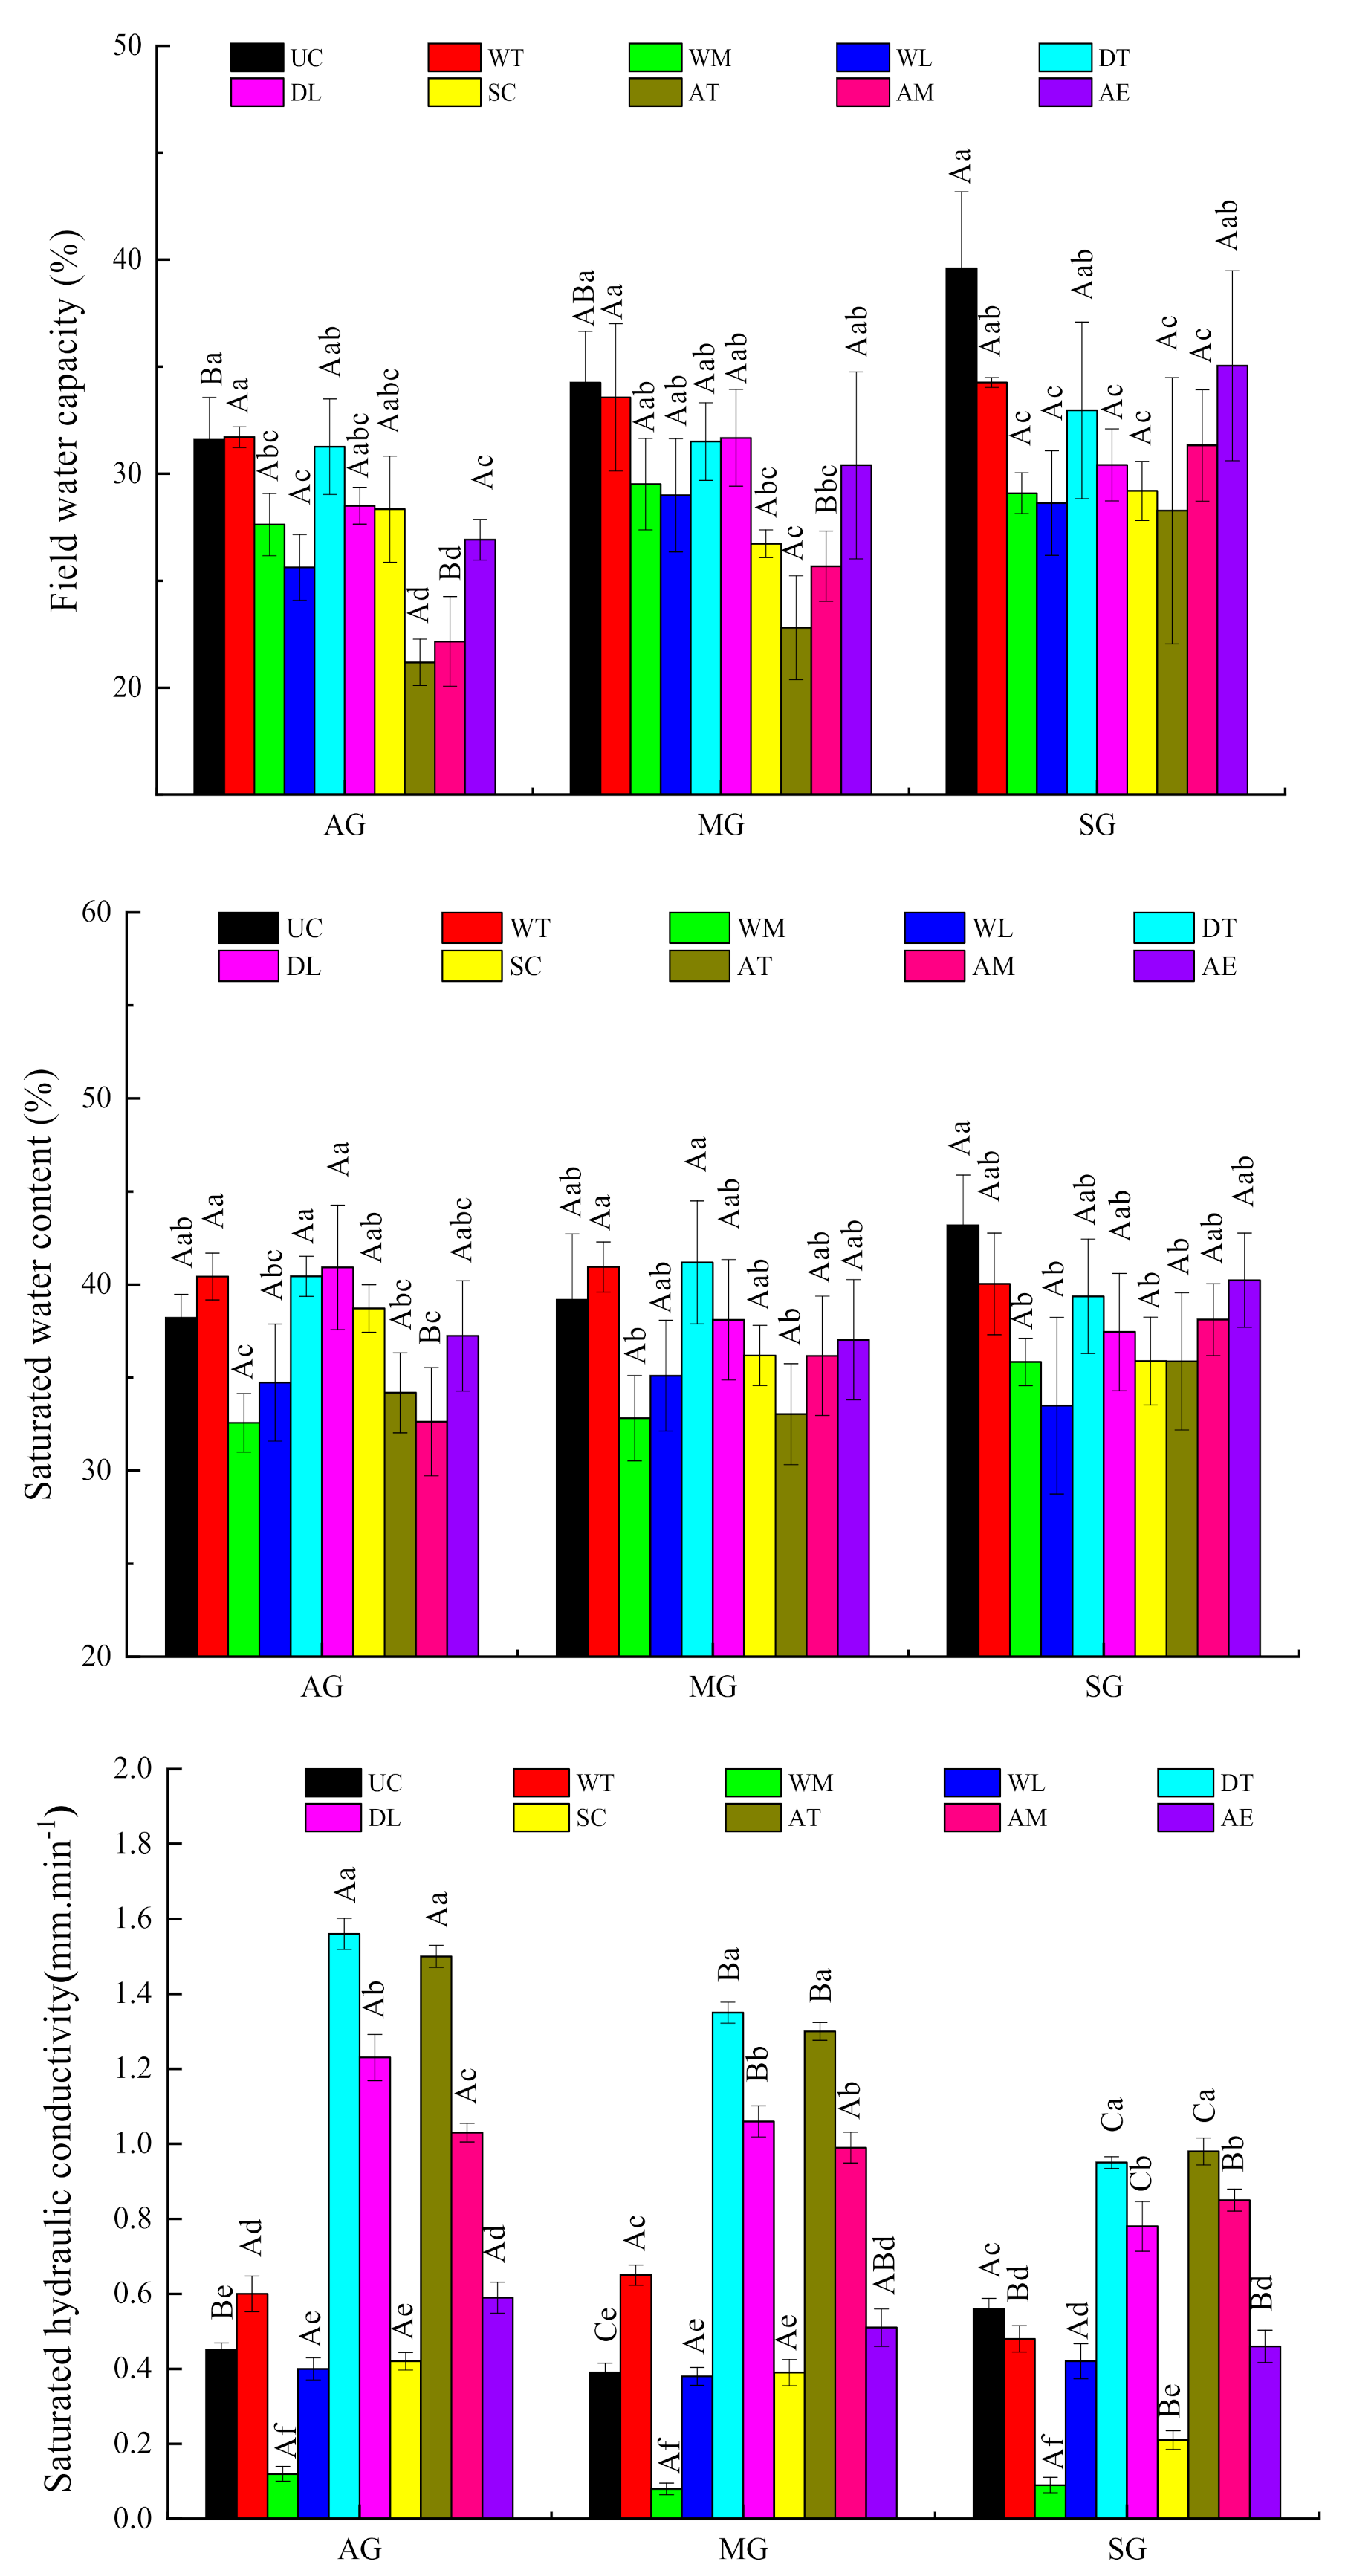
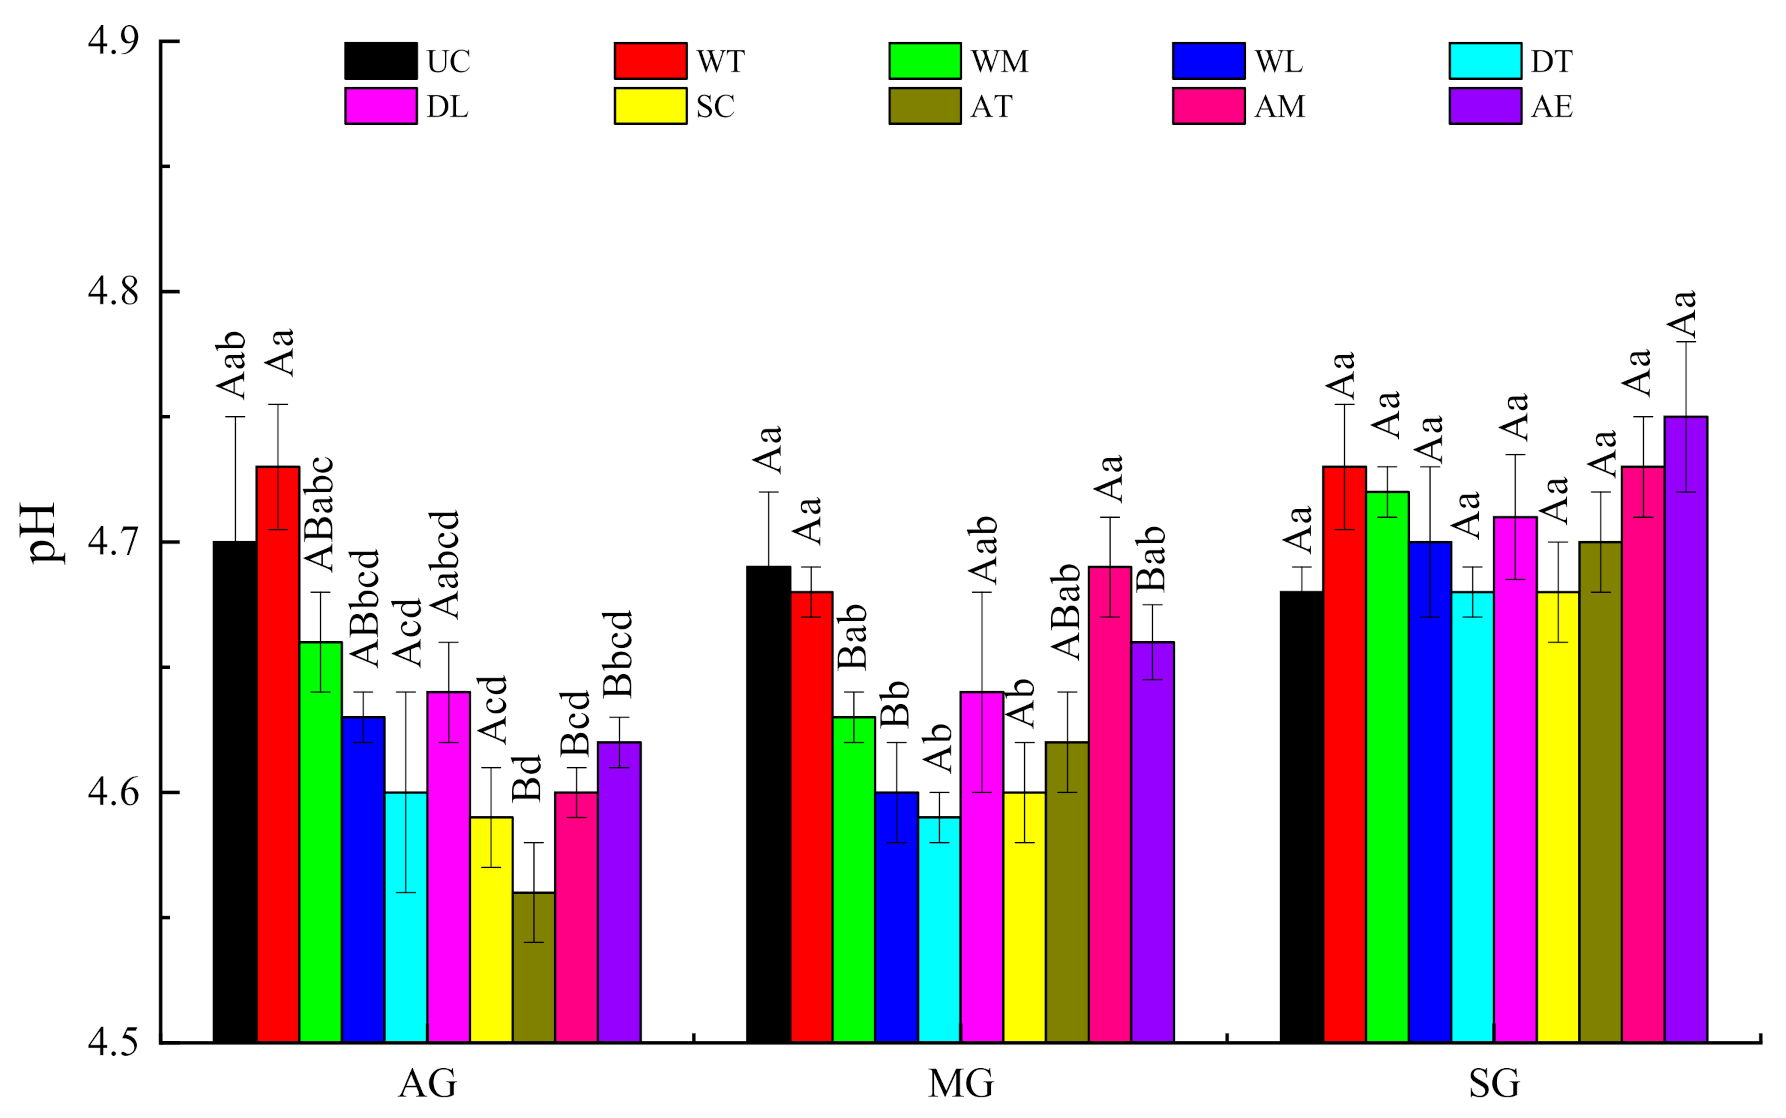
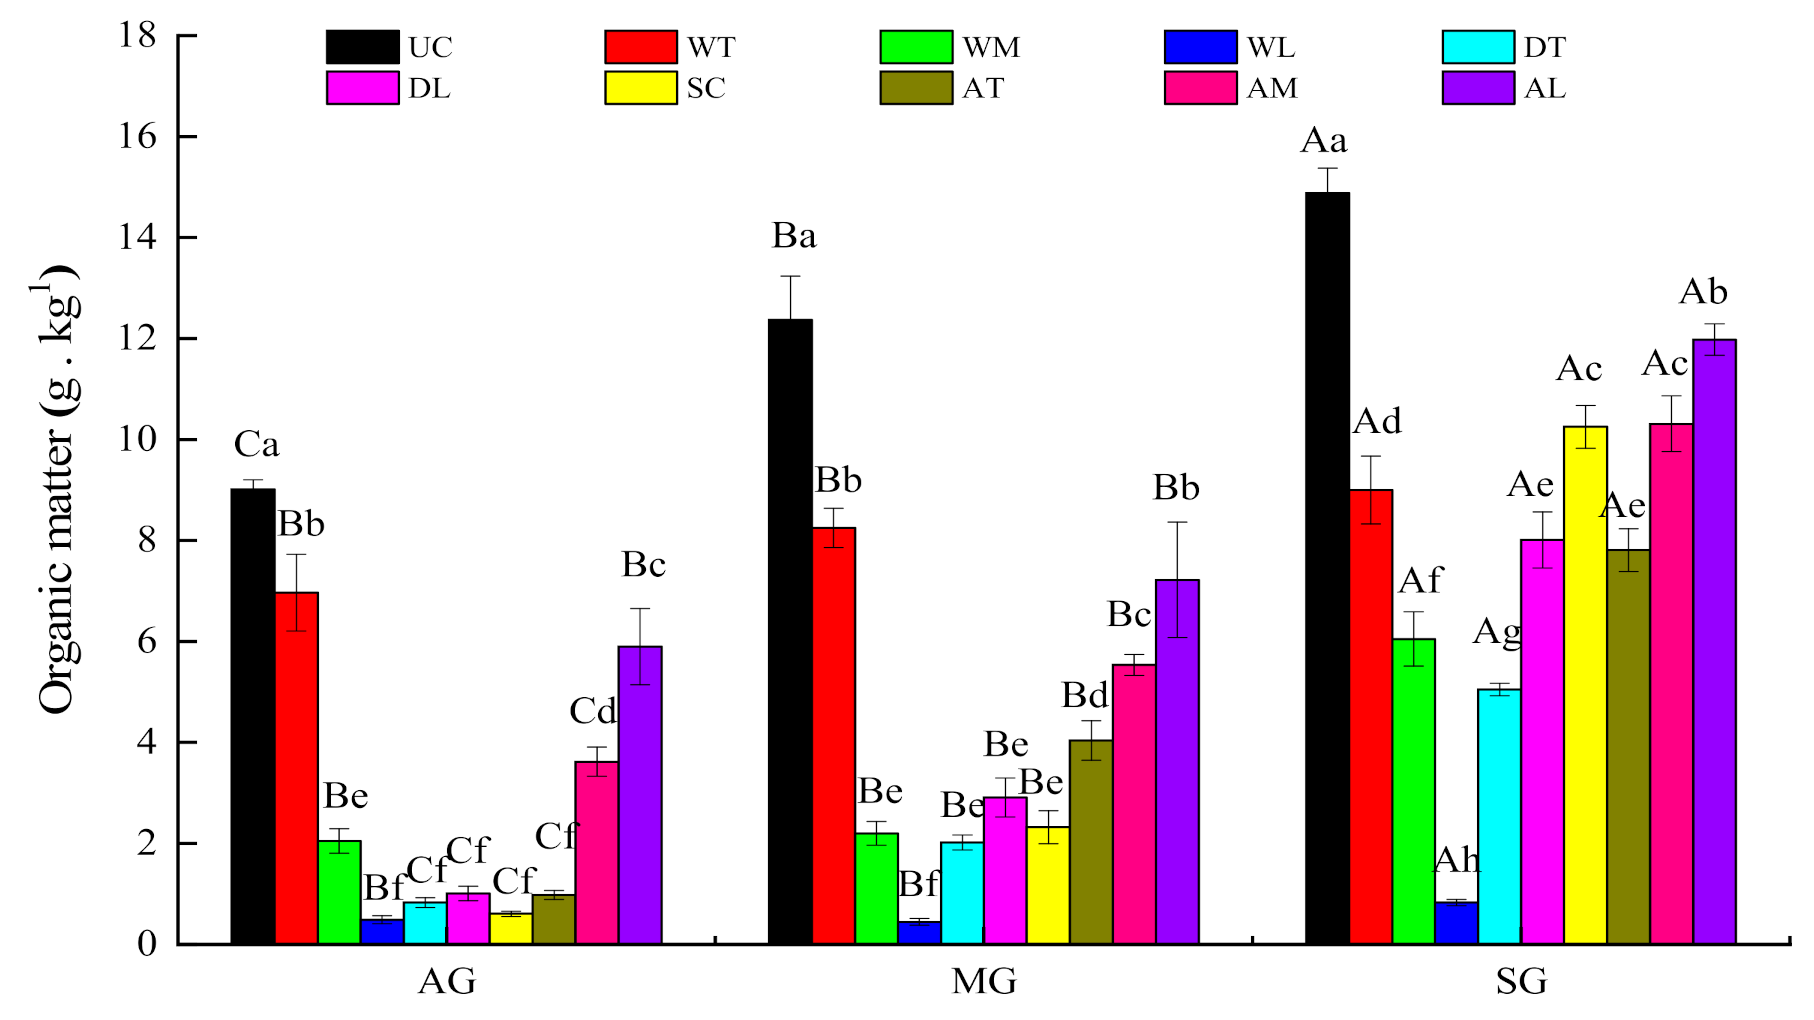
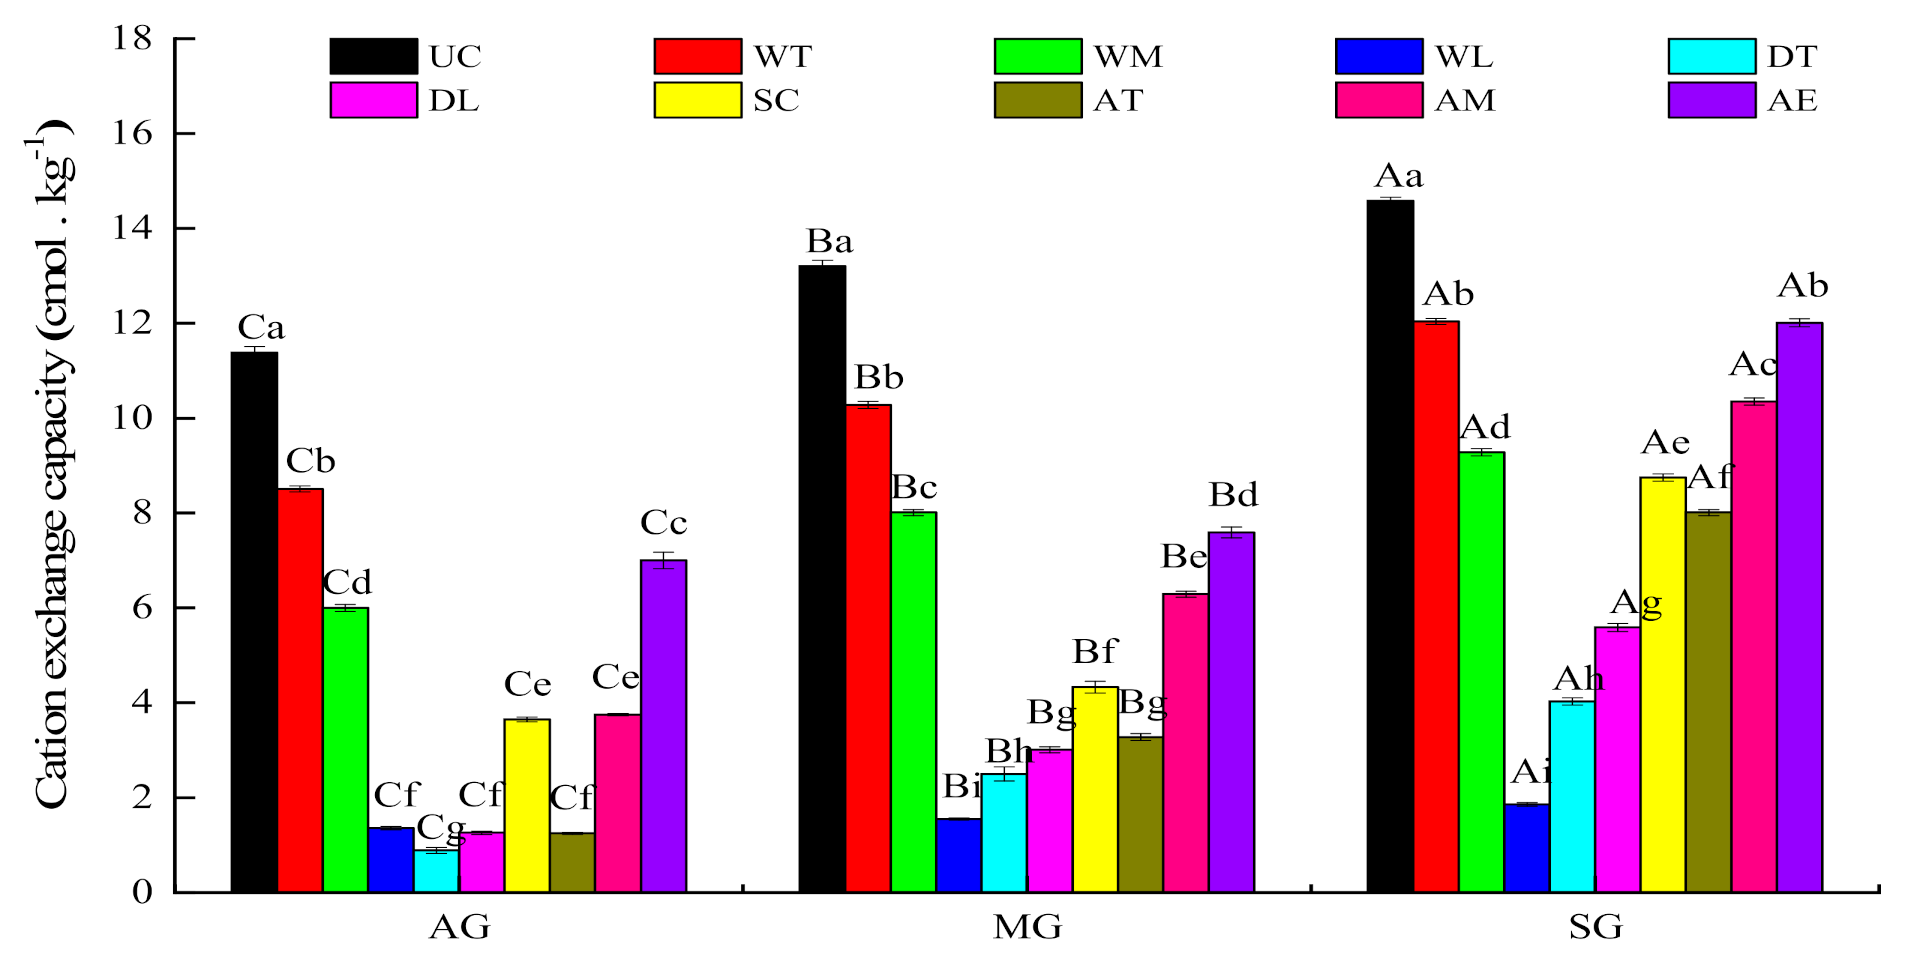
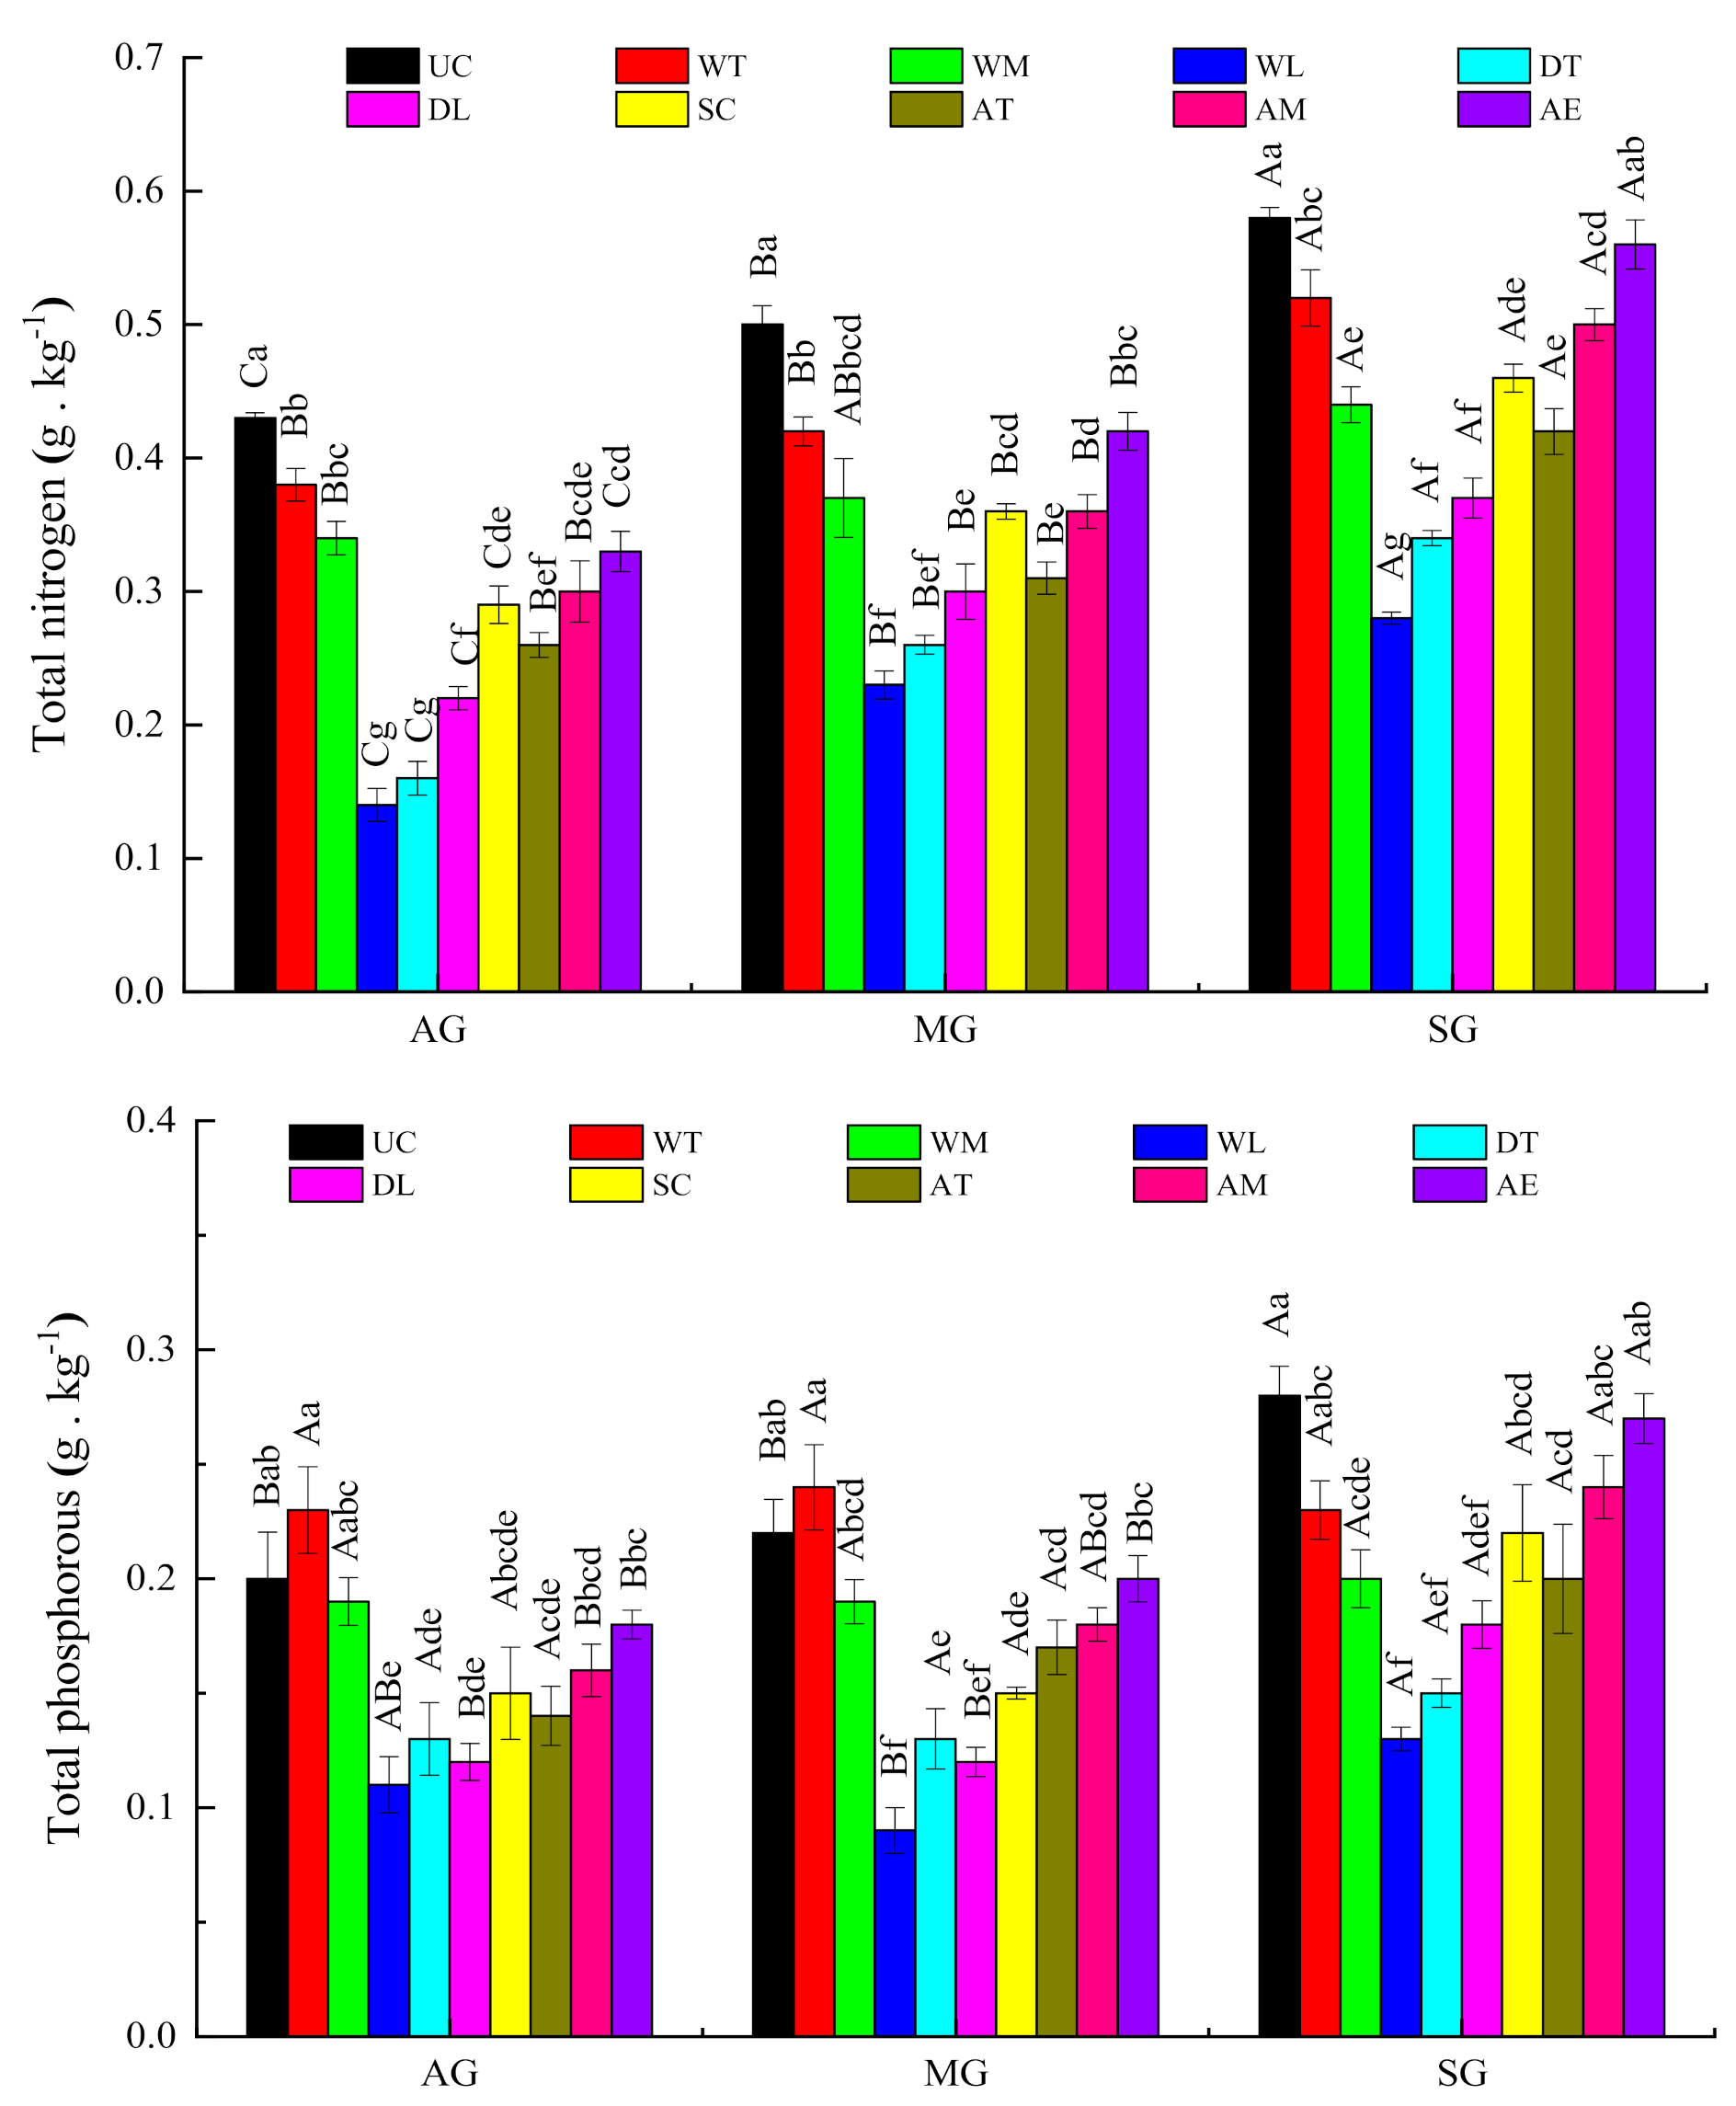
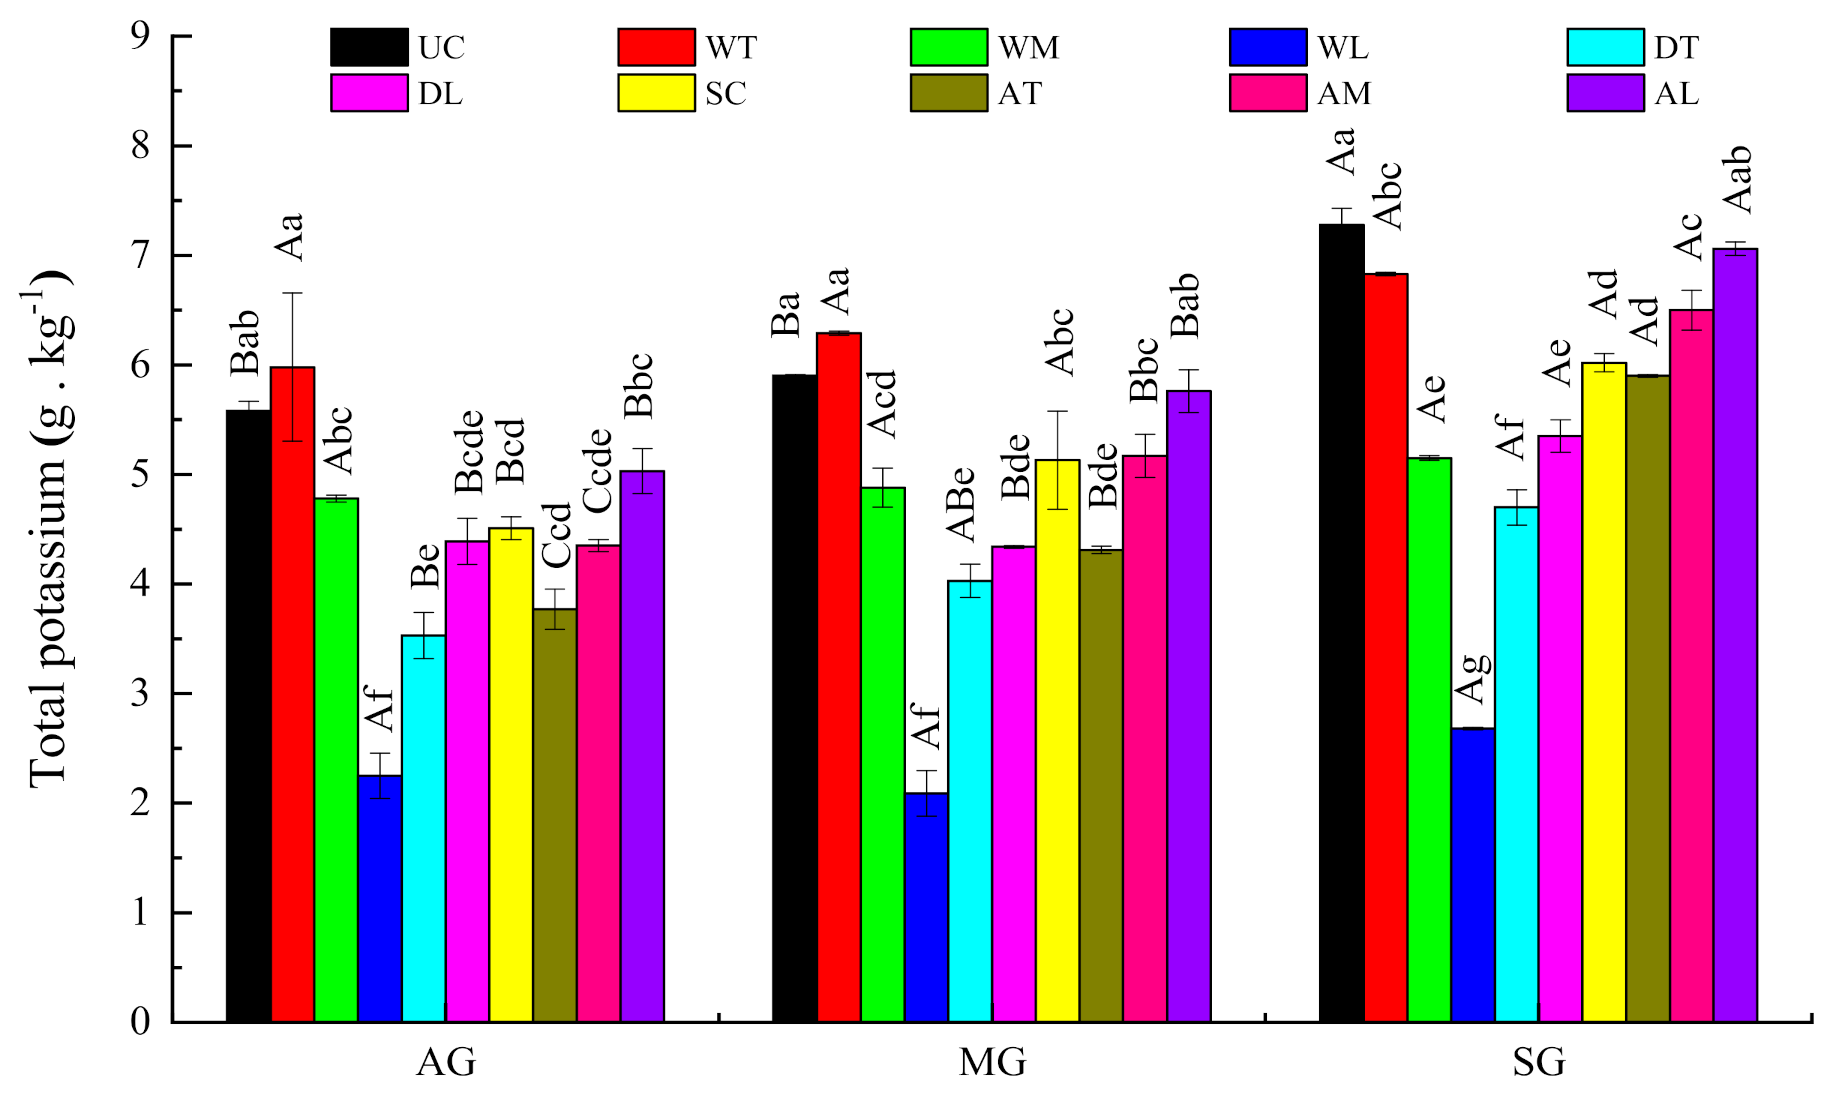
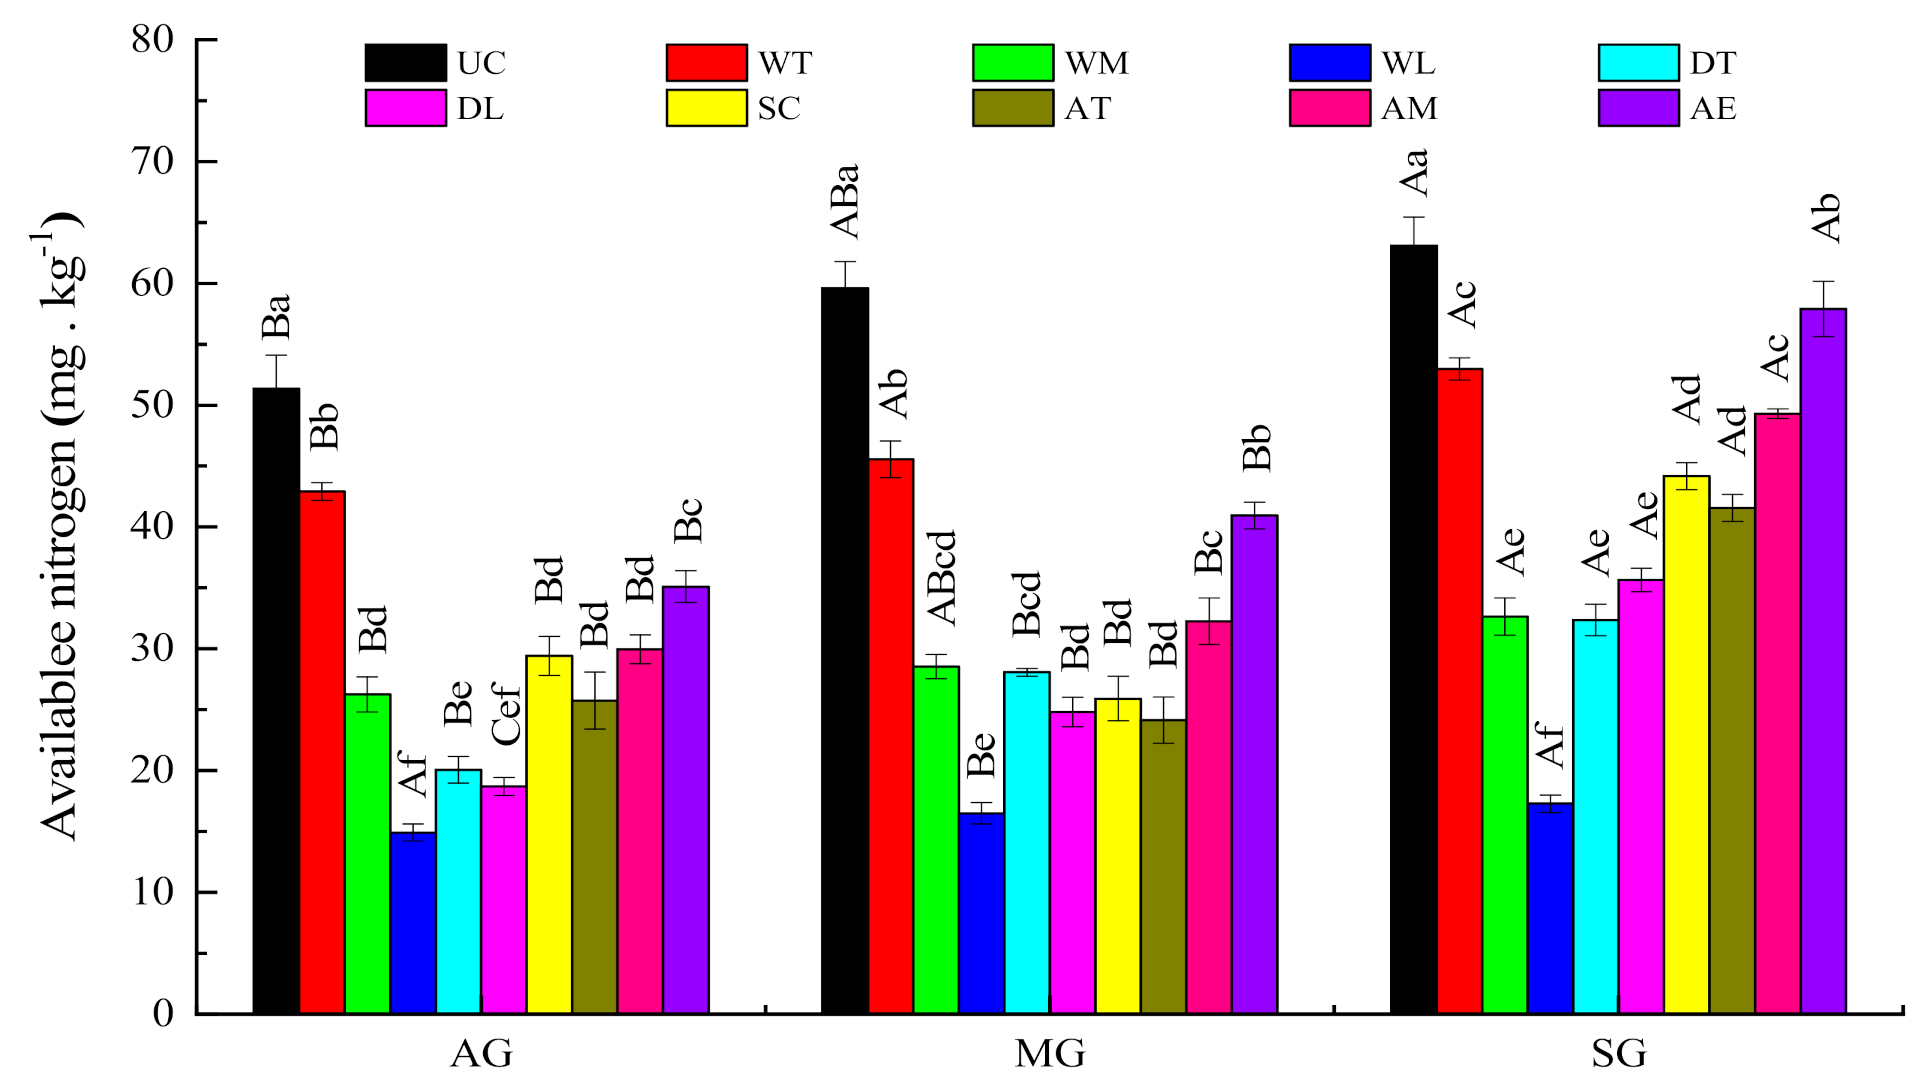
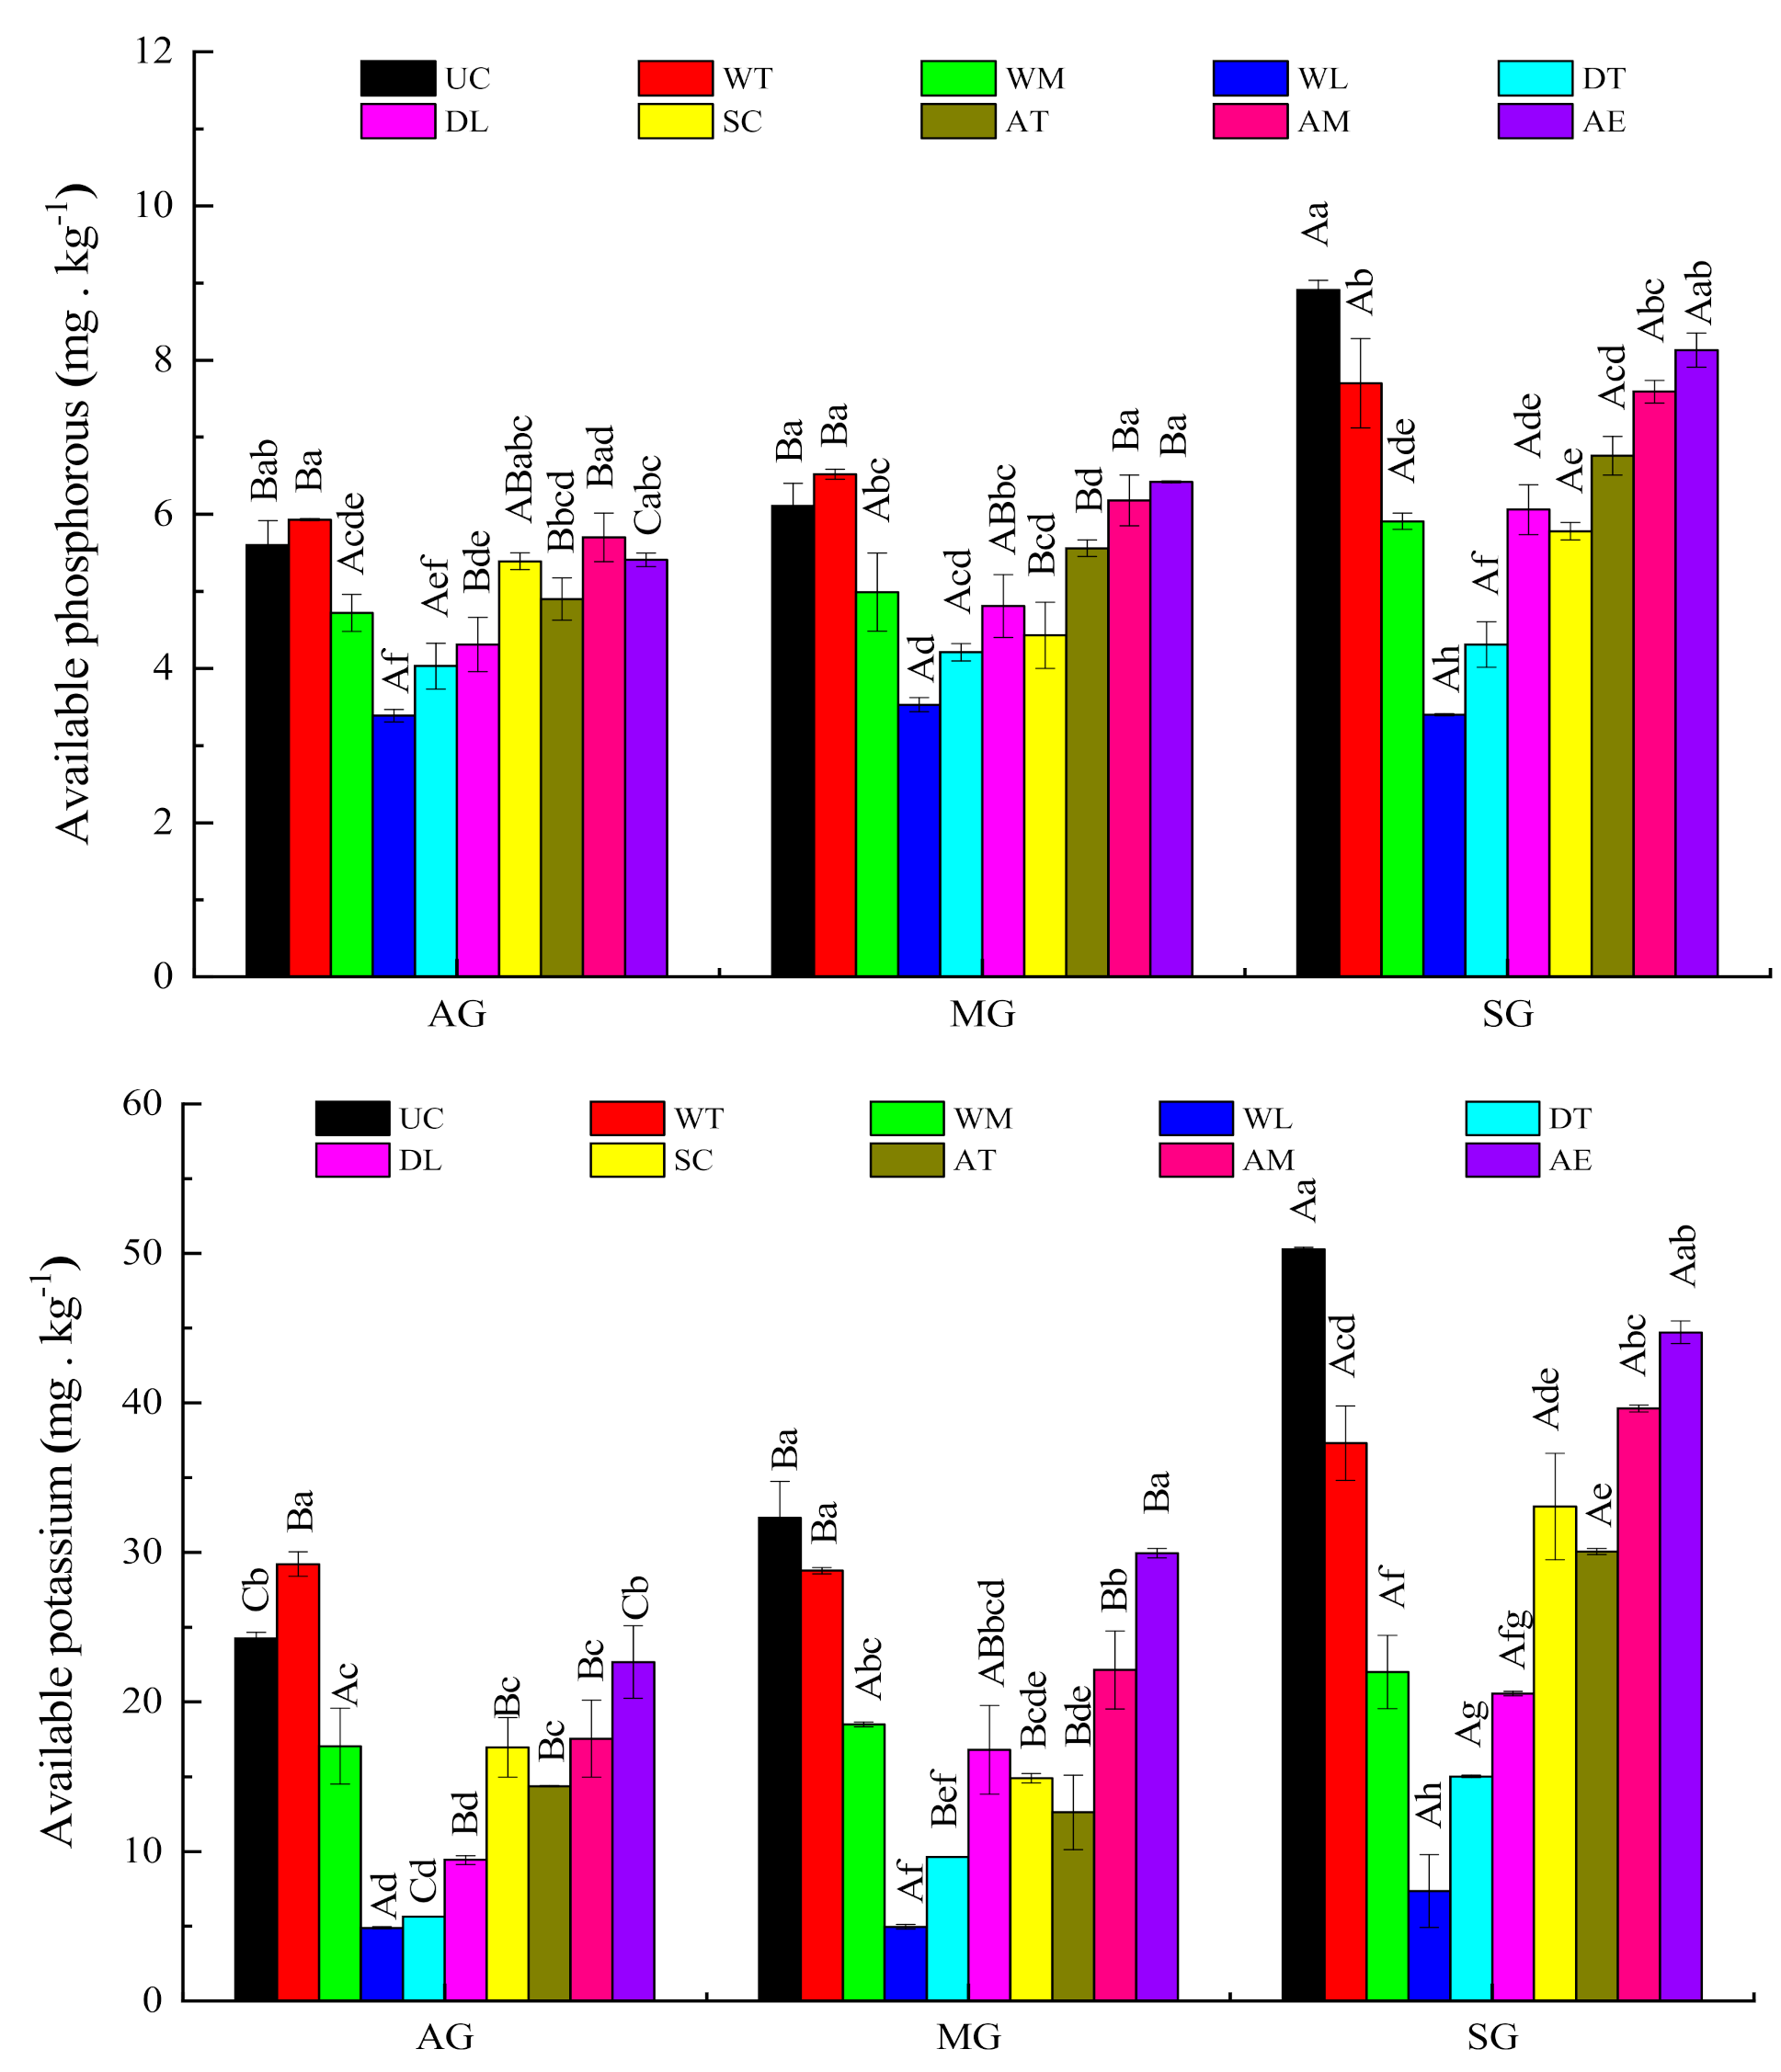
3.2. Analysis of the Physical and Chemical Soil Characteristics during Different Stages of Benggang Restoration

Soil bulk density is the most basic soil physical property. It is related to soil porosity and affects soil water retention and permeability. As shown in Figure 3, the bulk densities (BD) of different stages of Benggang restoration were 1.34, 1.32, and 1.30 g cm−3, respectively. It can be seen that there was no significant difference in soil bulk density at different recovery stages of Benggang.
Soil porosity affects soil aeration, water permeability and tree root growth and is an important index of soil fertility. Soil porosity and bulk density showed an opposite trend of change, that is, the bulk density decreased and the porosity increased. The soil total porosity and capillary porosity increased with enhancing Benggang restoration, whereas the aeration porosity content decreased. Overall, the spatial distribution of soil pores (total porosity, capillary porosity and aeration porosity) was not significantly different among the different stages of Benggang restoration (Figure 4).
The variation in soil particle composition in the runoff direction in the different Benggang recovery stages is shown in Figure 5. The gravel content decreased by 12.24% and 16.58% when the Benggang restoration was from active stage to semi-stable stage to stable stage. Soil texture analysis indicated that the study area had the greater sand contents (38.00~61.03%) and lower clay contents (12.69~31.06%). The sand content decreased with increasing Benggang restoration, whereas the clay content showed the opposite trend. The sand contents in the active, semi-stable, and stable stages of Benggang restoration were 51.79%, 46.74%, and 45.31%, respectively. While, the clay contents were only 19.49%, 19.69% and 22.90%, respectively. In addition, there was no apparent variation in the silt content among different Benggang restoration stages.
The saturated hydraulic conductivity content gradually decreased with Benggang restoration, whereas the field water capacity content showed the opposite trend. The saturated hydraulic conductivity, field water capacity and saturated water content had the same trend in the of runoff direction in the different stages of Benggang restoration (Figure 6).
All soils were acidic, and the pH values did not vary in an obvious pattern and there was no significant difference in different stages of Benggang restoration (Figure 7). Soil organic matter is widely recognized as a major indicator of soil quality, especially in agricultural soils [44,45]. A reduction in soil organic matter leads to increased bulk density and decreased soil total porosity, thereby decreasing soil infiltration [46,47]. The variation ranges of the soil organic matter content in the active, semi-stable and stable stages of Benggang restoration soils were 0.61~9.01, 2.32~12.37 and 5.29~14.88 g kg−1, respectively. The cation exchange capacity of soil in the semi-stable stage (33.40%) and the stable stage (62.23%) of Benggang restoration was higher than that in the active stage of Benggang restoration (Figure 8). Compared to those in the active stage of Benggang restoration, the total nitrogen (TN), total phosphorous (TP) and total potassium (TK) in the semi-stable stage of Benggang restoration increased by 25.00%, 6.25% and 8.37%, and those in the stable stage of Benggang restoration increased by 60.71%, 31.25% and 30.09% (Figure 9). Similarly, the available nitrogen (AN), available phosphorus (AP) and available potassium (AK) increased by 10.84%, 6.88% and 17.65% in the semi-stable stage of Benggang restoration and 45.01%, 30.57% and 85.19% in the stable stage of Benggang restoration compared to the active stage of Benggang restoration (Figure 10).
The difference analysis results showed that the TN contents in the different stages of Benggang restoration were apparently different. Total phosphorous (TP) and TK content in the stable stages of Benggang restoration were significantly different. Meanwhile, the TN, TP and TK among different locations in the different stages of Benggang restoration had significant differences and presented the following order: upper catchment > alluvial fan > scour channel > colluvial deposit > collapsing wall, indicating that the soil fertility was the highest in the upper catchment and poor on the colluvial deposit. The AN, AP and AK during different stages of Benggang restoration were obviously different and showed stable stage > semi-stable stage > active stage. The changes of the AN, AP and AK were similar to that of the TN, TP and TK at different stages of Benggang restoration. This reason is that the surface of the upper catchment had more organic matter, complete soil structure and less soil erosion, while the colluvial deposit had loose soil, more easily lost soil and nutrients.

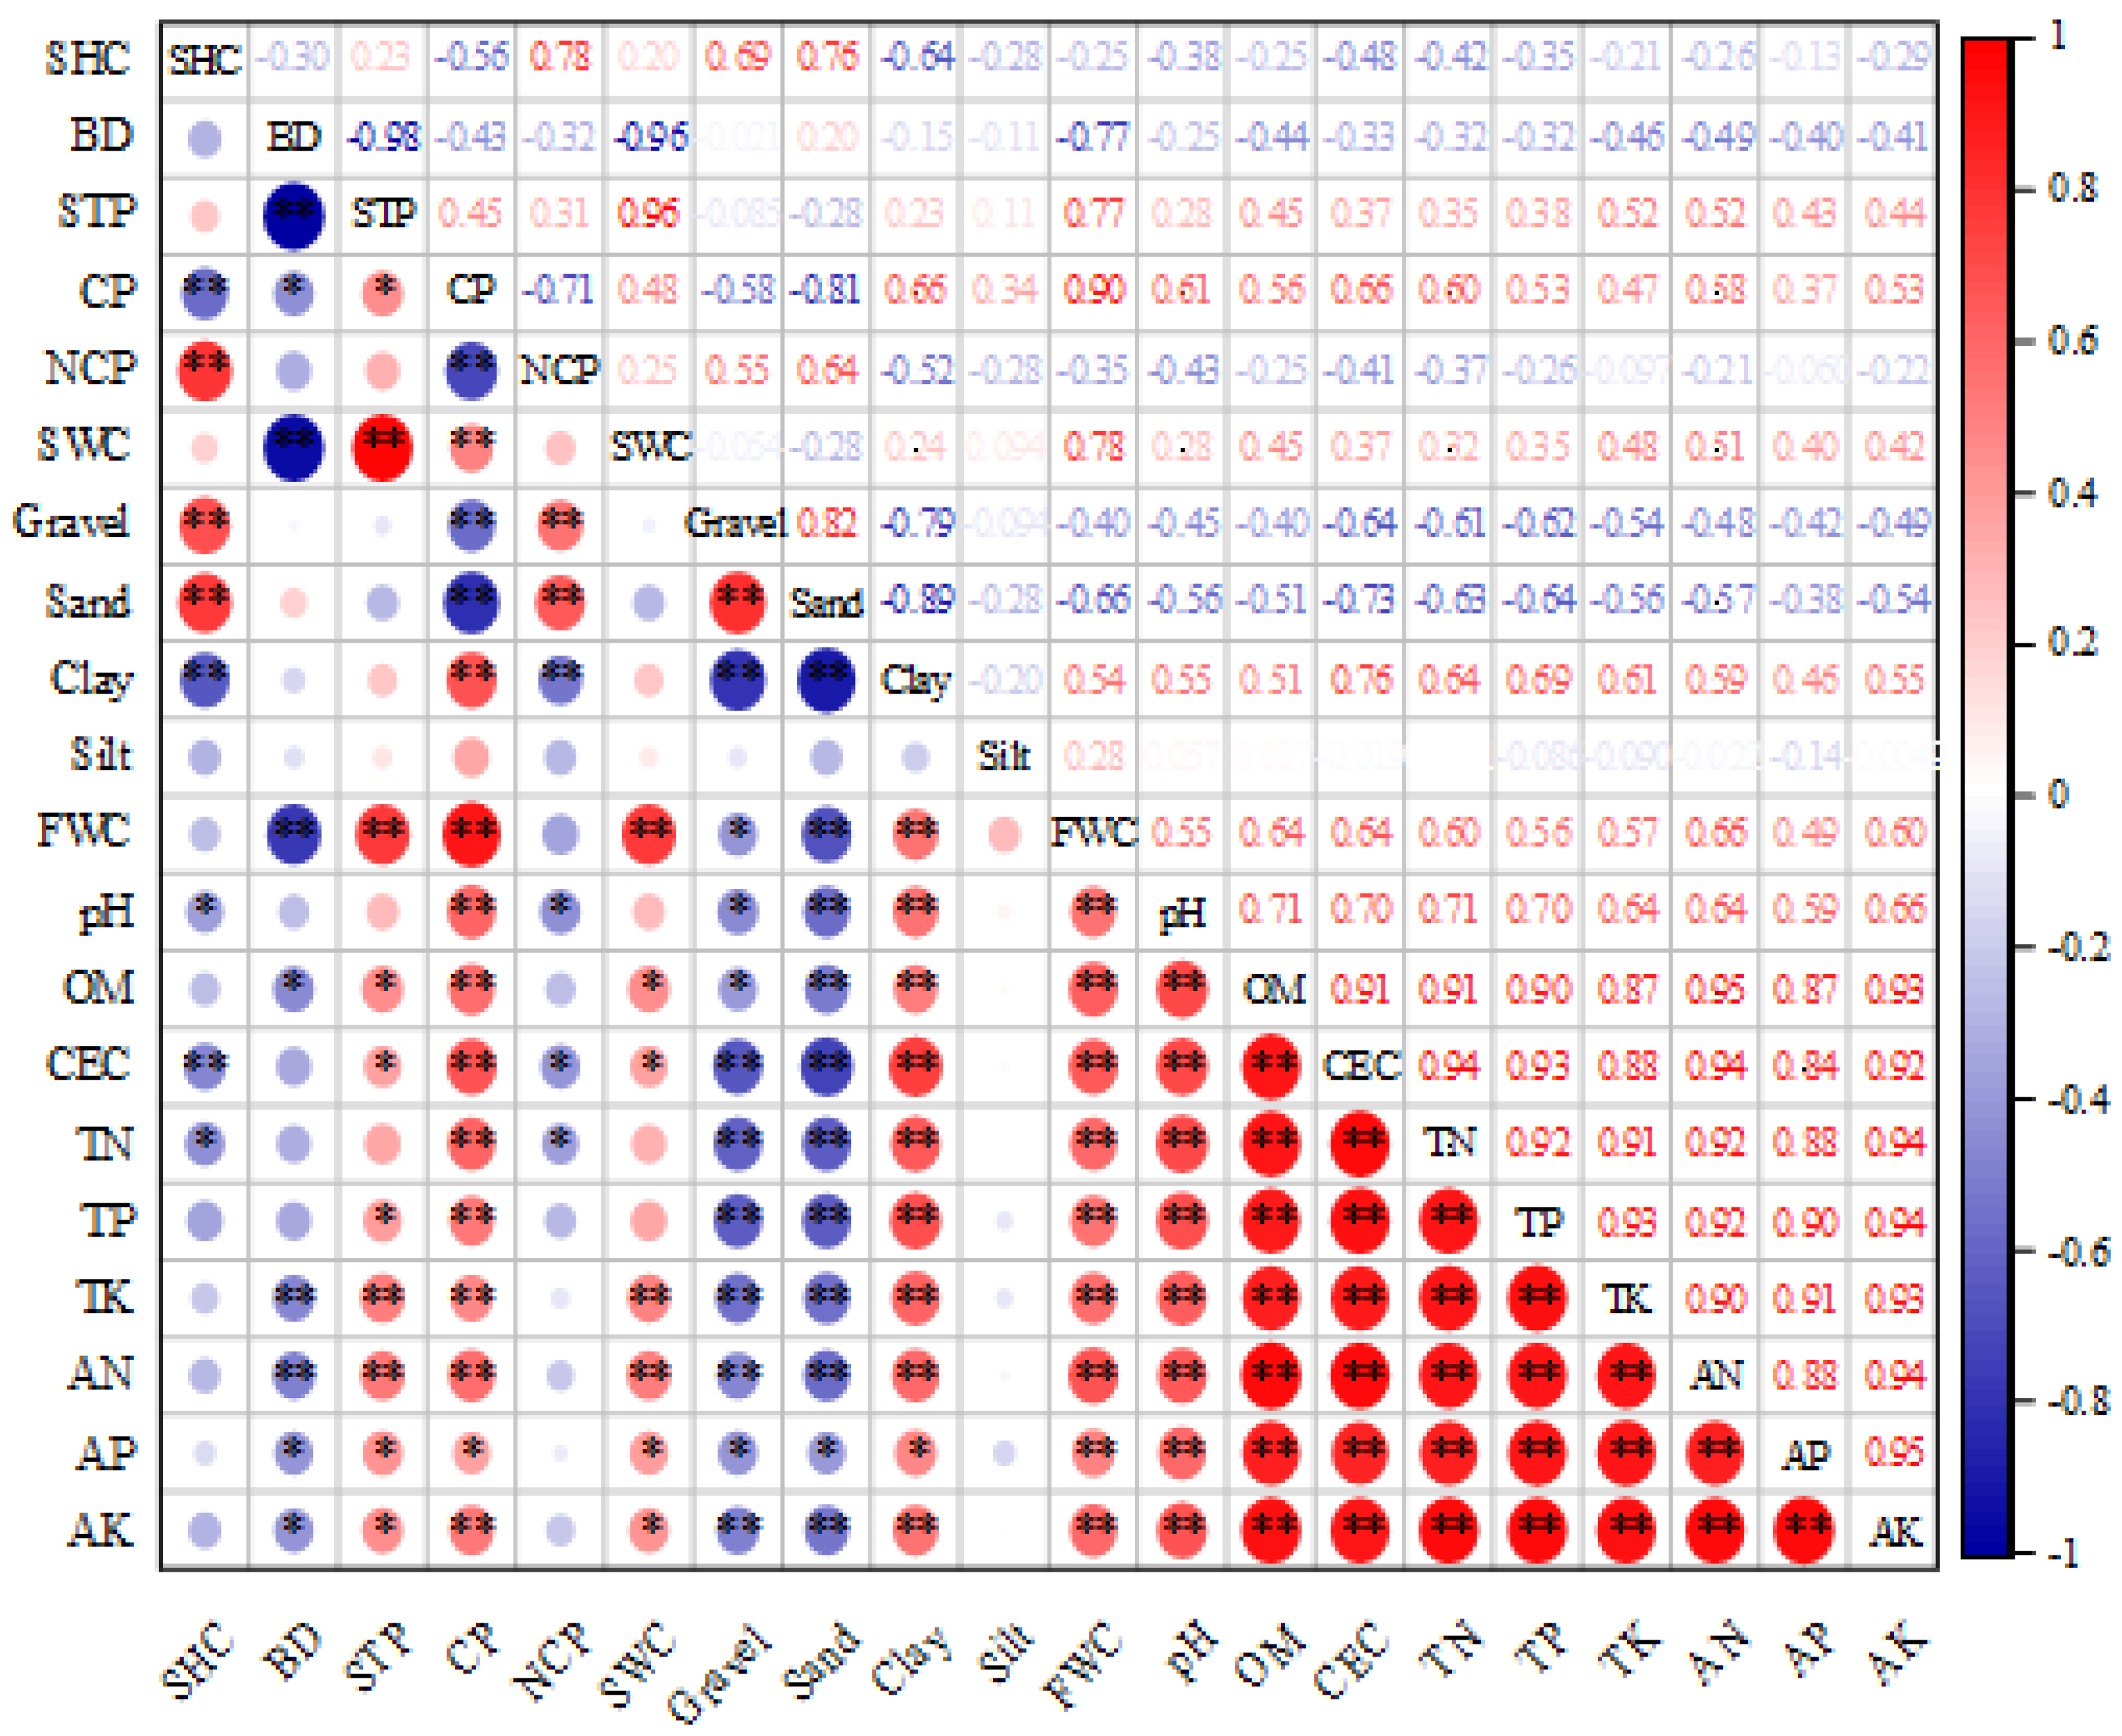
3.3. Correlation Analysis of Physical and Chemical Soil Properties

Pearson’s correlation analysis results showed that capillary porosity (CP), aeration porosity (NCP), soil particle composition, pH, cation exchange capacity (CEC), and total nitrogen (TN) were significantly or very significantly correlated (positively or negatively) with saturated hydraulic conductivity (SHC) (Figure 11). The soil bulk density (BD) had extremely significantly negative correlations with soil total porosity (STP), saturated water content (SHC), field water capacity (FWC), total potassium (TK), and available nitrogen (AN) (p < 0.01) and significantly negative correlations with CP, soil organic matter (OM), available phosphorus (AP), and AK (p < 0.05). The soil porosity was significantly or highly significantly correlated with the soil particle content, OM, CEC, and soil nutrient content. There were extremely significantly positive correlations between the clay content and field water capacity, pH, CEC, TN, TP, TK, AN, AP, and AK (p < 0.01). The sand content had extremely significantly negative correlations with it (p < 0.01). The results showed that the soil porosity and field water capacity affected the soil mechanical properties. In addition, the physical characteristics were closely related to the soil OM, CEC, and soil nutrient content. The soil field water capacity, pH, OM, and CEC were significantly positively correlated with the soil nutrient content (p < 0.01).

3.4. Principal Component Analysis of Soil Fertility Characteristics

PCA was used to extract major principal components (PCs) according to the cumulative contribution rate reaching or exceeding 85% [48,49]. Therefore, three PCs with eigenvalues N > 1 were selected for interpretation, as PCs receiving high values best describe the variability in the factors [50]. Among well-correlated variables within PC, the variable with the highest correlation coefficient (absolute value) was chosen to remain in the component factors.
Table 2 shows that the eigenvalues of the first three principal components were 11.252, 3.689 and 2.281. The variance contribution rates of the first three principal components were 56.26%, 18.45% and 11.40%, with a cumulative contribution rate of 86.11% (86.11% > 85%); thus, the first three principal components, labeled PC1, PC2 and PC3, basically accounted for 86.11% of the total information provided by all 20 evaluation indicators and can be used as comprehensive variables to evaluate soil fertility.
The correlation coefficients between the original variables and the three principal components can be expressed by the factor load, and it is generally believed that the variables with larger factor loads are the main factors influencing the principal components. As shown in Table 3, the main influencing factors were field water capacity, capillary porosity (CP), sand, clay, pH, organic matter (OM), cation exchange capacity (CEC), total nitrogen (TN), total phosphorous (TP), total potassium (TK), available nitrogen (AN), available phosphorus (AP), and available potassium (AK) for the first principal component (PC1), of which pH and organic matter reflect the soil environmental condition and soil fertility. For the second component (PC2), saturated hydraulic conductivity, bulk density (BD), soil total porosity, aeration porosity, saturated water content, and gravel were the main influencing factors. Saturated hydraulic conductivity and saturated water content reflect the soil water status, soil total porosity and aeration porosity represent soil structure factors, and gravel and bulk density represent soil textural factors. PC3 included only silt.
Using the factor load values of the 20 indicators in the PCA and the three eigenvalues, the characteristic vectors can be obtained (Table 3). The sizes of the eigenvectors represent the correlations between the original indicators and the principal components. Therefore, according to the formulas for calculating the principal components, the functional expressions of the first three principal components can be obtained:
Y 1 = 0.135 × Z S H C 0.146 × Z B D + 0.161 × Z S T P + 0.23 × Z C P 0.118 × Z N C P + 0.159 × Z S W C 0.197 × Z G r a v e l 0.22 × Z S a n d + 0.226 × Z C l a y + 0.022 × Z S i l t + 0.236 × Z F W C + 0.225 × Z p H + 0.269 × Z O M + 0.286 × Z C E C + 0.278 × Z T N + 0.275 × Z T P + 0.269 × Z T K + 0.277 × Z A N + 0.247 × Z A P + 0.273 × Z A K
Y 2 = 0.407 × Z S H C 0.406 × Z B D + 0.38 × Z S T P 0.101 × Z C P + 0.407 × Z N C P + 0.366 × Z S W C + 0.263 × Z G r a v e l + 0.22 × Z S a n d 0.191 × Z C l a y 0.068 × Z S i l t + 0.119 × Z F W C 0.061 × Z p H + 0.07 × Z O M 0.052 × Z C E C 0.033 × Z T N 0.008 × Z T P + 0.089 × Z T K + 0.081 × Z A N + 0.108 × Z A P + 0.054 × Z A K
Y 3 = 0.136 × Z S H C + 0.244 × Z B D 0.244 × Z S T P 0.358 × Z C P + 0.189 × Z N C P   0.266 × Z S W C + 0.043 × Z G r a v e l + 0.228 × Z S a n d 0.037 × Z C l a y 0.407 × Z S i l t   0.344 × Z F W C + 0.026 × Z p H + 0.153 × Z O M + 0.118 × Z C E C + 0.17 × Z T N + 0.211 × Z T P + 0.196 × Z T K + 0.138 × Z A N + 0.285 × Z A P + 0.195 × Z A K
The expression of the comprehensive principal component score was also achieved.
Y = 0.563 × Y 1 + 0.184 × Y 2 + 0.114 × Y 3
The principal component scores were calculated according to the principal component comprehensive score model. In addition, the various components of the three types of Benggang restoration in different recovery stages were ranked, and the cumulative effect of soil fertility in different Benggang restoration stages was evaluated comprehensively (Table 4). The results showed that the comprehensive score of the active stage of Benggang restoration was the lowest (−0.95), and the score of semi-stable stage (−0.33) and stable stage (1.28) of Benggang restoration gradually increased, indicating that soil restoration could better balance soil fertility, increase soil nutrient storage capacity, and improve soil structure. The soil fertility levels showed a larger difference among different stages of Benggang restoration, and the comprehensive score featured the order of active stage < semi-stable stage < semi-stable stage, which indicated that soil restoration was conducive to the increase in soil biomass, improving the soil aggregate structure and forming soil macropores. Meanwhile, the results also showed that the comprehensive score of each part in each stage of Benggang restoration increased with the development of Benggang restoration, especially in the upper catchment, and the values of the scour channel and alluvial fan increased significantly, which indicated that the Benggang restoration was helpful to the improvement of soil fertility and the productivity of land.

4. Discussion

4.1. Analysis of Physical Soil Properties for Different Stages of Benggang Restoration

The coefficient of variation for soil pH was small, whereas that soil organic matter was large in the Benggang restoration areas. The reason for the small coefficient of variation of soil pH may be related to vegetation and soil type. The soils in the study area were red soil, and the main vegetation was Pinus massoniana. Red soil and Pinus massoniana were indicators of acidic soil. In addition, the spatial variability in soil properties may be related to the natural environment, human activities and soil characteristics, thus leading to differences in variability among different regions [51,52]. According to Pearson’s correlation coefficient method, the analysis of soil physical properties and soil nutrients in the Benggang restoration area were analyzed (Figure 11). The correlations reflect the changes in soil structure in different stages of Benggang restoration, which included high gravel and sand contents, low clay and silt contents, and low soil nutrients. The reason for these results is that under Benggang erosion, many quartz particles in granite are brought to the soil surface, and clay and silt are continuously lost under the action of water erosion and wind erosion, resulting in a large amount of soil loss and deterioration of the soil texture [53]. Many sand grains, such as quartz and feldspar, were not conducive to water and soil conservation, limiting the ecological restoration of gullies. There were significantly negative correlations between sand and clay and organic matter, cation exchange capacity and soil nutrients, which restricts the recovery of soil nutrients [54].
The Benggang restoration areas have different levels of soil development, leading to spatial variations in the soil physical properties along the runoff direction; for example, the soil bulk density from the upper catchment to the alluvial fan first increased, then decreased and finally increased. The soil bulk density of the collapsing wall was higher than that in the other parts of the Benggang system. The upper catchment, which is mainly dominated by surface erosion, had a low erosion intensity and soil bulk density. When the upper catchment encounters heavy rainfall, the shear strength and shear force of the collapsing wall may change due to uneven water distribution, causing soil erosion. The colluvial deposit was located at the lower edge of the collapsing wall and formed mainly by the collapsing wall. The colluvial deposit, with bare soil and serious soil erosion, was the main source of sand production in the Benggang area. The soil bulk density, saturated hydraulic conductivity, gravel content, sand content, and aeration porosity underwent the same changes from active Benggang to stable Benggang restoration, showing gradually decreasing trends, whereas the soil field water capacity, total porosity, capillary porosity, and clay content each exhibited the opposite trend. In this study, the bulk density and porosity of Benggang soil in the stable and semi-stable stages were better than those in the active stage. On the one hand, the soil disturbance in the stable stage and semi-stable stage was reduced, and the pores formed by vegetation litter and root rot were not destroyed. On the other hand, less soil disturbance was beneficial to the formation of soil aggregates, increasing the number of pores and improving the soil environment, thus achieving the goal of reducing the bulk density and increasing the porosity [30]. Meanwhile, the increase in vegetation coverage was beneficial to the interception of soil moisture and the improvement of the soil physical structure. However, although the physical properties of the soil improved, the soil physical properties in the whole study area were still lower than the soil background value. It was possible that this area was more susceptible to Benggang erosion because of coarser soil properties initially.

4.2. Analysis of Soil Chemical Properties in Different Stages of Benggang Restoration

The soil organic matter, available nutrients and total nutrients increased from the active stage to the semi-stable stage to the stable stage of Benggang restoration. Benggang erosion involves the denudation, transport and accumulation of soil nutrients. Therefore, soil nutrients obviously vary along the direction of runoff. The vegetation coverage and litter on the soil surface increased with the development of Benggang restoration, which promoted soil biological activity and the transport and transformation of water, nutrients, gases, and heat, resulting in an increase in nutrients, particularly soil organic matter [55,56]. The soil organic matter content was the highest in the upper catchment in the different recovery stages of Benggang and the lowest in the scour channel and the collapsing wall. The reasons were that a large amount of sand accumulates in the scour channel during Benggang erosion, making vegetation survival difficult, and the collapsing wall was the main factor affecting Benggang erosion, making it difficult for plants to exist and resulting in a low organic matter content. The variations in the cation exchange capacity and total nutrients are the same during the different Benggang recovery stages, with the lowest values appearing in colluvial deposits. The soil total nutrients increase gradually from colluvial deposits to alluvial fans, which may be related to the vegetation coverage in each part of the Benggang landform [28].
Soil available nutrients which are the direct sources of the three elements necessary for biological growth and are influenced by natural factors, such as terrain and climate and by human factors during the formation process and have characteristically high spatial heterogeneity [57,58]. The available nutrient contents in the active stage of Benggang restoration were generally lower than those in the semi-stable and stable stages of Benggang restoration, in which the contents of available nitrogen and available phosphorus varied significantly. These differences were mainly caused by the decomposition of natural minerals and soil organic matter during the ecological restoration process [59]. The high spatial differentiation was that the nutrients in the gully region were carried away by rainwater runoff under the action of hydraulic erosion and gravity and where soil nutrients had not accumulated. Meanwhile, soil leaching accelerates the decomposition rate of available nutrients. The content of available nitrogen in the Benggang areas was significantly correlated with the total porosity, capillary porosity, clay, soil organic matter, and total nutrients, which may be related to the source of the total nutrients. The available potassium content has significantly positive or negative correlations with capillary porosity, soil particle characteristics, soil organic matter, and total nutrients, which may be related to the effects of granite weathering on the soil.

4.3. Evaluation of Soil Fertility for Different Stages among Benggang Restoration

Benggang erosion is a form of erosion that occurs after the decomposition and collapse of a granite weathering crust. The survey statistics showed that active Benggang areas account for 88.90% of all Benggang areas, while semi-stable Benggang and stable Benggang areas together account for only 11.10%. Among the different Benggang recovery stages, active Benggang areas are prone to soil erosion and soil degradation under high-intensity rainfall [20]. Therefore, the evaluation of soil fertility can provide a more intuitive reference for the restoration and control of Benggang gullies. The results of the comprehensive evaluation of soil fertility revealed the following order: the stable stage of Benggang restoration (1.28) > the semi-stable stage of Benggang restoration (−0.33) > the active stage of Benggang restoration (−0.95). The results showed that soil nutrients and productivity increased, and soil physical structure and fertility improved with the progression of Benggang recovery. The soil fertility at these locations in different stages of Benggang recovery remains at a fairly low level. The reasons were that the soil structure was loose, the soil loss was severe in this region, the background value of soil nutrients was fairly low, and it was difficult to increase to a higher level in a short time. Therefore, ecological restoration and soil productivity improvement are the primary problems to be solved in permanent gully areas.

5. Conclusions

This research on different stages of Benggang recovery (active, semi-stable and stable) showed that the gravel and sand contents and the bulk density decreased with increasing Benggang restoration, while the soil porosity, organic matter content, cation exchange capacity, and soil nutrients increased. In the Benggang erosion areas, the soil bulk density and coarse particulate matter content first increased, then decreased and finally increased in the runoff direction, while the clay content decreased. The soil total nutrients and cation exchange capacity were the highest in the upper catchment and the lowest in the colluvial deposit. In general, the permanent gully regions had a poor soil structure and low nutrient content. To a certain extent, this analysis of physical and chemical properties in different stages of Benggang recovery could reflect the Benggang restoration degree, but this analysis was not comprehensive. The PCA method was applied to evaluate the soil fertility of active, semi-stable and stable Benggang areas to obtain comprehensive scores for soil fertility at different Benggang sample points. The comparison of soil fertility in different Benggang restoration stages showed that the soil fertility was the highest in the stable stage, intermediate in semi-stable stage and lowest in active stage, indicating that the fertility of granite Benggang soil changes obviously in the process of natural ecological restoration, and natural ecology plays an important role in soil fertility improvement during Benggang restoration.

Author Contributions

D.J., Y.D., S.D., C.C., Z.H. and J.H. conceived the project; J.H. wrote the original draft; D.J. and Y.D. writing, review and editing of the manuscript; S.D., C.C., Z.H. were responsible for supervision. All authors have read and agreed to the published version of the manuscript.

Funding

This research was provided by the Guangxi Science and Technology Base and talent Special project (No. AD20159031), the Guangxi Natural Science Foundation of China (2020JJB150043), the National Natural Science Foundation of China (No. 41630858) and the National Key Research and Development Program of China (No. 2017YFC0505402).

Data Availability Statement

Datasets can be obtained from the corresponding author.

Acknowledgments

We thank Zhanlong Ma, Liwen Lin, Wanxia Huang, Jinyue Wang, and Zhe Lin for their help.

Conflicts of Interest

The authors declare no conflict of interest.

References

  1. Lal, R.; Singh, B.R. Effects of soil degradation on crop productivity in east Africa. J Sustain. Agric. 1998, 13, 15–36. [Google Scholar] [CrossRef]
  2. Li, Z.Y.; Fang, H.Y. Impacts of climate change on water erosion: A review. Earth Sci. Rev. 2016, 163, 94–117. [Google Scholar] [CrossRef]
  3. Morgan, R.P.C. Soil Erosion and Conservation. Soil Sci. 1988, 145, 461. [Google Scholar] [CrossRef]
  4. Lal, R. Soil erosion and the global carbon budget. Environ. Int. 2003, 29, 437–450. [Google Scholar] [CrossRef]
  5. Mandal, D.; Sharda, V.N. Appraisal of soil erosion risk in the Eastern Himalayan region of India for soil conservation planning. Land Degrad. Dev. 2013, 24, 430–437. [Google Scholar] [CrossRef]
  6. Zhao, G.; Mu, X.; Wen, Z.; Wang, F.; Gao, P. Soil erosion, conservation, and eco-environment changes in the Loess Plateau of China. Land Degrad. Dev. 2013, 24, 499–510. [Google Scholar] [CrossRef]
  7. Lieskovský, J.; Kenderessy, P. Modelling the effect of vegetation cover and different tillage practices on soil erosion in vineyards: A case study in vráble (Slovakia) using watem/sedem. Land Degrad. Dev. 2014, 25, 288–296. [Google Scholar] [CrossRef]
  8. Ligonja, P.J.; Shrestha, R.P. Soil erosion assessment in kondoa eroded area in Tanzania using universal soil loss equation, geographic information systems and socioeconomic approach. Land Degrad. Dev. 2015, 26, 367–379. [Google Scholar] [CrossRef]
  9. Zhang, M.K.; Xu, J.M. Restoration of surface soil fertility of an eroded red soil in southern China. Soil Till. Res. 2005, 80, 13–21. [Google Scholar] [CrossRef]
  10. Poesen, J.; Nachtergaele, J.; Verstraeten, G.; Valentin, C. Gully erosion and environmental change: Importance and research needs. Catena 2003, 50, 91–133. [Google Scholar] [CrossRef]
  11. Avni, Y. Gully incision as a key factor in desertification in an arid environment, the negev highlands, Israel. Catena 2005, 63, 185–220. [Google Scholar] [CrossRef]
  12. Rustomji, P. Analysis of gully dimensions and sediment texture from southeast australia for catchment sediment budgeting. Catena 2006, 67, 119–127. [Google Scholar] [CrossRef]
  13. Liu, H.L.; Zhang, T.Y.; Liu, B.Y.; Liu, G.; Wilson, G.V. Effects of gully erosion and gully filling on soil depth and crop production in the black soil region, northeast China. Environ. Earth Sci. 2013, 68, 1723–1732. [Google Scholar] [CrossRef]
  14. Mbaya, L.A.; Ayuba, H.K.; Abdullahi, J. An assessment of gully erosion in gombe town, gombe state, nigeria. J. Geogr. Geol. 2012, 4, 110–121. [Google Scholar] [CrossRef]
  15. Su, Z.A.; Zhang, J.H.; Nie, X.J. Effect of soil erosion on soil properties and crop yields on slopes in the sichuan basin, China. Pedosphere 2010, 20, 736–746. [Google Scholar] [CrossRef]
  16. Yan, Y.; Zhang, S.; Yue, S. Dynamic change of hill slope and gully erosion in typical area of black soil region during the past 40 years. Trans. Chin. Soc. Agric. Eng. 2010, 26, 109–115. [Google Scholar] [CrossRef]
  17. Zheng, F.L. Effects of accelerated soil erosion on soil nutrient loss after deforestation on the Loess Plateau. Pedosphere 2005, 15, 707–715. [Google Scholar] [CrossRef]
  18. Xu, M.X.; Li, Q.; Wilson, G. Degradation of soil physicochemical quality by ephemeral gully erosion on sloping cropland of the hilly loess plateau, China. Soil Till. Res. 2016, 155, 9–18. [Google Scholar] [CrossRef]
  19. Seybold, C.A.; Herrick, J.E.; Brejda, J.J. Soil Resilience: A Fundamental Component of Soil Quality. Soil Sci. 1999, 164, 224–234. [Google Scholar] [CrossRef]
  20. Zhong, B.L.; Peng, S.Y.; Zhang, Q.; Mac, H.; Cao, S.X. Using an ecological economics approach to support the restoration of collapsing gullies in southern China. Land Use Policy 2013, 32, 119–124. [Google Scholar] [CrossRef]
  21. Xia, J.W.; Cai, C.F.; Wei, Y.J.; Wu, X.L. Granite residual soil properties in collapsing gullies of south China: Spatial variations and effects on collapsing gully erosion. Catena 2019, 174, 469–477. [Google Scholar] [CrossRef]
  22. Xu, J.X. Benggang erosion: The influencing factors. Catena 1996, 27, 249–263. [Google Scholar] [CrossRef]
  23. Jiang, F.S.; Huang, Y.H.; Wang, M.K.; Lin, J.S.; Zhao, G.; Ge, H.L. Effects of Rainfall Intensity and Slope Gradient on Steep Colluvial Deposit Erosion in Southeast China. Soil Sci. Soc. Am. J. 2014, 78, 1741–1752. [Google Scholar] [CrossRef]
  24. Chen, J.L.; Zhou, M.; Lin, J.S.; Jiang, F.S.; Huang, B.F.; Xu, T.T.; Wang, M.K.; Ge, H.L.; Huang, Y.H. Comparison of soil physicochemical properties and mineralogical compositions between noncollapsible soils and collapsed gullies. Geofis. Int. 2018, 317, 56–66. [Google Scholar] [CrossRef]
  25. Sheng, J.A.; Liao, A.Z. Erosion control in south China. Catena 1997, 29, 211–221. [Google Scholar] [CrossRef]
  26. Xia, D.; Deng, Y.S.; Wang, S.L.; Ding, S.W.; Cai, C.F. Fractal features of soil particle-size distribution of different weathering profifiles of the collapsing gullies in the hilly granitic region, South China. Nat. Hazards 2015, 79, 455–478. [Google Scholar] [CrossRef]
  27. Deng, Y.S.; Cai, C.F.; Xia, D.; Ding, S.W.; Chen, J.Z.; Wang, T.W. Soil atterberg limits of different weathering profiles of the collapsing gullies in the hilly granitic region of southern China. Solid Earth 2017, 8, 499–513. [Google Scholar] [CrossRef] [Green Version]
  28. Deng, Y.S.; Shen, X.; Xia, D.; Cai, C.F.; Ding, S.W.; Wang, T.W. Soil Erodibility and Physicochemical Properties of Collapsing Gully Alluvial Fans in Southern China. Pedosphere 2019, 29, 104–115. [Google Scholar] [CrossRef]
  29. Álvaro, G.G.; Schnabel, S.; Contador, F.L. Gully erosion, land use and topographical thresholds during the last 60 years in a small rangeland catchment in SW Spain. Land Degrad. Dev. 2009, 20, 535–550. [Google Scholar] [CrossRef]
  30. Feng, S.Y.; Wen, H.; Ni, S.M.; Wang, J.G.; Cai, C.F. Degradation Characteristics of Soil-Quality-Related Physical and Chemical Properties Affected by Collapsing Gully: The Case of Subtropical Hilly Region, China. Sustainability 2019, 11, 3369. [Google Scholar] [CrossRef] [Green Version]
  31. Zhang, X.; Li, Z.W.; Zeng, G.M.; Xia, X.L.; Yang, L.; Wu, J.J. Erosion effects on soil properties of the unique red soil hilly region of the economic development zone in southern China. Environ. Earth Sci. 2012, 67, 1725–1734. [Google Scholar] [CrossRef]
  32. Shukla, M.K.; Lal, R.; Ebinger, M. Determining soil quality indicators by factor analysis. Soil Till. Res. 2006, 87, 194–204. [Google Scholar] [CrossRef]
  33. Lidia, G.; Romaniuk, R.; Conti, M.E.; Bartoloni, N. Multivariate evaluation by quality indicators of no-tillage system in argiudolls of rolling pampa (argentina). Biol. Fertil. Soils 2006, 42, 556–560. [Google Scholar] [CrossRef]
  34. Wall, A.; Westman, C.J. Site classification of afforested arable land based on soil properties for forest production. Can. J. For. Res. 2006, 36, 1451–1460. [Google Scholar] [CrossRef]
  35. Qi, Y.; Darilek, J.L.; Huang, B.; Zhao, Y.C.; Sun, W.X.; Gu, Z.Q. Evaluating soil quality indices in an agricultural region of Jiangsu Province, China. Geoderma 2009, 149, 325–334. [Google Scholar] [CrossRef]
  36. Waswa, B.S.; Vlek, P.L.G.; Tamene, L.D.; Okoth, P.; Mbakaya, D.; Zingore, S. Evaluating indicators of land degradation in smallholder farming systems of western Kenya. Geoderma 2013, 195–196, 192–200. [Google Scholar] [CrossRef]
  37. Nosrati, K.; Collins, A.L. A soil quality index for evaluation of degradation under land use and soil erosion categories in a small mountainous catchment, Iran. J. Mt. Sci. 2019, 16, 2577–2590. [Google Scholar] [CrossRef]
  38. Xie, L.W.; Zhong, J.; Chen, F.F.; Cao, F.X.; Li, J.J.; Wu, L.C. Evaluation of soil fertility in the succession of karst rocky desertification using principal component analysis. Solid Earth 2015, 6, 515–524. [Google Scholar] [CrossRef] [Green Version]
  39. Comings, K.J.; Booth, D.B.; Horner, R.R. Storm Water Pollutant Removal by Two Wet Ponds in Bellevue, Washington. J. Environ. Eng. 2000, 126, 321–330. [Google Scholar] [CrossRef] [Green Version]
  40. Subbiah, B.V.; Asija, G.L. A rapid procedure for the determination of availablenitrogen in soils. Curr. Sci. 1956, 25, 259–260. [Google Scholar]
  41. Horta, M.D.C.; Torrent, J. The Olsen Pmethod as an agronomic and environmental test for predicting phosphate release from acid soils. Nutr. Cycl. Agroecosys. 2007, 77, 283–292. [Google Scholar] [CrossRef]
  42. Sims, J.T. Comparison of mehlich 1 and mehlich 3 extractants for P, K, Ca, Mg, Mn, Cu and Zn in Atlantic coastal plain soils. Commun. Soil Sci. Plan. Anal. 1989, 20, 1707–1726. [Google Scholar] [CrossRef]
  43. Rhoades, J.D. Cation exchange capacity. In Methods of Soil Analysis, Part 2; Page, A.L., Miller, R.H., Keeney, D.R., Eds.; America Society of Agronomy: Madison, WI, USA, 1982; pp. 149–157. [Google Scholar]
  44. Nortcliff, S. Standardisation of soil quality attributes. Agric. Ecosyst. Environ. 2002, 88, 161–168. [Google Scholar] [CrossRef]
  45. Zhang, X.; Li, Z.W.; Tang, Z.H.; Zeng, G.M.; Huang, J.Q.; Guo, W.; Chen, X.L.; Hirsh, A. Effects of water erosion on the redistribution of soil organic carbon in the hilly red soil region of southern China. Geomorphology 2013, 197, 137–144. [Google Scholar] [CrossRef]
  46. Wall, A.; Heiskanen, J. Water-retention characteristics and related physical properties of soil on afforested agricultural land in Finland. For. Ecol. Manag. 2003, 186, 21–32. [Google Scholar] [CrossRef]
  47. Celik, I. Land use effects on organic matter and physical properties of soil in a southern Mediterranean highland of Turkey. Soil Till. Res. 2005, 82, 270–277. [Google Scholar] [CrossRef]
  48. Ghaemi, M.; Astaraei, A.R.; Emami, H.; Nassiri, M.M.; Sanaeinejad, S.H. Determining soil indicators for soil sustainability assessment using principal component analysis of astan quds-east of mashhad-iran. J. Soil Sci. Plant Nutr. 2014, 14, 987–1004. [Google Scholar] [CrossRef] [Green Version]
  49. Guo, X.M.; Zhao, T.Q.; Chang, W.K.; Xiao, C.Y.; He, Y.X. Evaluating the effect of coal mining subsidence on the agricultural soil quality using principal component analysis. Chil. J. Agric. Res. 2018, 78, 173–182. [Google Scholar] [CrossRef]
  50. Brejda, J.J.; Moorman, T.B.; Karlen, D.L.; Dao, T.H. Identification of regional soil quality factors and indicators: II. Northern Mississippi Loess Hills and Palouse Prairie. Soil Sci. Soc. Am. J. 2000, 64, 2125–2135. [Google Scholar] [CrossRef] [Green Version]
  51. Glendell, M.; Grange, S.J.; Bol, R.; Brazier, R.E. Quantifying the spatial variability of soil physical and chemical properties in relation to mitigation of diffuse water pollution. Geoderma 2014, 214–215, 25–41. [Google Scholar] [CrossRef] [Green Version]
  52. Delbari, M.; Afrasiab, P.; Gharabaghi, B.; Amiri, M.; Salehian, A. Spatial variability analysis and mapping of soil physical and chemical attributes in a salt-affected soil. Arab. J. Geosci. 2019, 12, 1–18. [Google Scholar] [CrossRef]
  53. Moges, A.; Holden, N.M. Farmers’ perceptions of soil erosion and soil fertility loss in southern ethiopia. Land Degrad. Dev. 2010, 18, 543–554. [Google Scholar] [CrossRef]
  54. Yan, Y.C.; Xin, X.P.; Xu, X.L.; Wang, X.; Yang, G.X.; Yan, R.R.; Chen, B.R. Quantitative effects of wind erosion on the soil texture and soil nutrients under different vegetation coverage in a semiarid steppe of northern China. Plant Soil 2013, 369, 585–598. [Google Scholar] [CrossRef]
  55. Li, Z.; Liu, C.; Dong, Y.; Chang, X.; Nie, X.; Liu, L.; Xia, H.B.; Lu, Y.M.; Zeng, G.M. Response of soil organic carbon and nitrogen stocks to soil erosion and land use types in the loess hilly–gully region of China. Soil Till. Res. 2017, 166, 1–9. [Google Scholar] [CrossRef]
  56. Wang, Z.; Wang, G.; Zhang, Y.; Wang, R. Quantification of the effect of soil erosion factors on soil nutrients at a small watershed in the loess plateau, northwest China. J. Soil Sediments 2020, 20, 745–755. [Google Scholar] [CrossRef]
  57. Stenger, R.; Priesack, E.; Beese, F. Spatial variation of nitrate-n and related soil properties at the plot-scale. Geoderma 2002, 105, 259–275. [Google Scholar] [CrossRef]
  58. Cerri, C.E.P.; Bernoux, M.; Chaplot, V.; Volkoff, B.; Victoria, R.L.; Melillo, J.M.; Paustian, K.; Cerri, C.C. Assessment of soil property spatial variation in an amazon pasture: Basis for selecting an agronomic experimental area. Geoderma 2004, 123, 51–68. [Google Scholar] [CrossRef]
  59. Mekuria, W.; Aynekulu, E. Exclosure land management for restoration of the soils in degraded communal grazing lands in northern ethiopia. Land Degrad. Dev. 2013, 24, 1–11. [Google Scholar] [CrossRef]
Figure 1. Sketch of Benggang erosion in the granite hills of South China.
Forests 12 00510 g001
Figure 2. The location of the sampling sites.
Forests 12 00510 g002
Figure 3. Bulk density in the different spatial position in different stages of Benggang restoration. AG: active stage of Benggang; MG: semi-stable stage of Benggang; SG: stable stage of Benggang. UC: upper catchment; WT, WM, WL: the top, middle and lower of collapsing wall; DT, DL: the top and lower of colluvial deposit; SC: scour channel; AT, AM, AE: the top, middle and edge of alluvial fan. Different capital letters mean significant differences between different development stages of Benggang in the same position, different small letters mean significant differences between different positions of Benggang at the same development stage at 0.05 level. The same as below.
Forests 12 00510 g003
Figure 4. The content of total porosity, capillary porosity and aeration porosity in the different spatial positions in different stages of Benggang restoration.
Forests 12 00510 g004aForests 12 00510 g004b
Figure 5. The content of gravel, sand, clay and silt in the different spatial positions in different stages of Benggang restoration.
Forests 12 00510 g005
Figure 6. The field water capacity, soil water content, saturated hydraulic conductivity and pH in the different spatial positions in different stages of Benggang restoration.
Forests 12 00510 g006
Figure 7. The pH in the different spatial positions in different stages of Benggang restoration.
Forests 12 00510 g007
Figure 8. The soil organic matter and cation exchange capacity in the different spatial positions in different stages of Benggang restoration.
Forests 12 00510 g008aForests 12 00510 g008b
Figure 9. The content of total nitrogen, total phosphorus and total potassium in the different spatial positions in different stages of Benggang restoration.
Forests 12 00510 g009aForests 12 00510 g009b
Figure 10. The available nitrogen, available phosphorus and available potassium in the different spatial positions in different stages of Benggang restoration.
Forests 12 00510 g010aForests 12 00510 g010b
Figure 11. Pearson correlation analysis. * p < 0.05; ** p < 0.01; SHC: saturated hydraulic conductivity; BD: bulk density; STP: soil total porosity; CP: capillary porosity; NCP: aeration porosity; SWC: saturated water content; FWC: field water capacity; OM: organic matter; CEC: cation exchange capacity; TN: total nitrogen; TP: total phosphorus; TK: total potassium; AN: available nitrogen; AP: available phosphorus; AK: available potassium. Circle: the larger the correlation coefficient, the larger the circle. The smaller the correlation coefficient, the smaller the circle. Red: the correlation coefficient is positive, the redder the color, the closer to 1.0. Blue: the correlation coefficient is negative, the bluer the color, the closer to negative 1.0.
Forests 12 00510 g011
Table 1. Statistical characteristic values of soil physical and chemical properties in the study area.
Soil PropertyMinimumMaximumMeanStdCV%SkewnessKurtosis
GR (%)13.32 36.68 23.78 5.84 24.570.365−0.158
SA (%)32.72 69.20 47.94 9.01 18.790.317−0.456
CL (%)8.10 36.64 20.70 8.83 42.660.549−1.047
SI (%)22.70 38.72 31.36 4.24 13.52−0.31−0.513
FWC (%)21.18 39.60 29.63 3.9513.34−0.0190.691
SWC (%)32.57 43.19 37.31 2.94 7.88−0.031−0.933
SHC (mm/min)0.08 1.56 0.69 0.42 60.280.535−0.635
BD (g/cm3)1.16 1.46 1.32 0.08 6.000.022−0.921
STP (%)45.41 54.99 49.85 2.81 5.65−0.005−1.16
CP (%)29.60 45.64 38.70 3.81 9.83−0.8110.539
NCP (%)3.17 17.27 11.15 3.58 32.11−0.183−0.549
pH4.56 4.75 4.66 0.05 1.11−0.121−1.091
SOM (g/kg)0.45 14.88 5.43 4.10 75.550.506−0.696
CEC (cmol/kg)0.89 14.58 6.39 4.03 63.150.322−1.024
TN (g/kg)0.14 0.58 0.36 0.11 30.520.053−0.349
TP (g/kg)0.09 0.28 0.18 0.05 26.860.176−0.627
TK (g/kg)2.09 7.28 4.98 1.31 26.22−0.4380.043
AN (mg/kg)14.91 63.09 34.92 13.43 38.460.505−0.642
AP (mg/kg)3.39 8.91 5.56 1.38 24.790.5040.069
AK (mg/kg)4.89 50.27 21.75 11.82 54.350.597−0.132
Notes: Std: standard deviation.; GR: gravel content; SA: sand content; CL: clay content; SI: silt content; FWC: field water capacity; SWC: saturated water content; SHC: saturated hydraulic conductivity; BD: bulk density; STP: soil total porosity; CP: capillary porosity; NCP: aeration porosity; SOM: soil organic matter; CEC: cation exchange capacity; TN: total nitrogen; TP: total phosphorus; TK: total potassium; AN: available nitrogen; AP: available phosphorus; AK: available potassium. The same as below.
Table 2. Interpretation of total variance.
Component Eigenvalue
Characteristic RootVariance %Cumulative Contribution Rate %
111.25256.2656.26
23.68918.44774.707
32.28111.40486.111
Table 3. Initial factor loading matrix and eigenvectors.
IndicatorsPrincipal ComponentFeature Vector
123Z1Z2Z3
SHC−0.4520.7820.205−0.1350.4070.136
BD−0.491−0.7810.368−0.146−0.4060.244
STP0.5410.731−0.3690.1610.380−0.244
CP0.772−0.195−0.5410.230−0.101−0.358
NCP−0.3960.7820.285−0.1180.4070.189
SWC0.5320.704−0.4020.1590.366−0.266
GR−0.6620.5050.066−0.1970.2630.043
SA−0.7790.4220.344−0.2320.2200.228
CL0.759−0.368−0.0560.226−0.191−0.037
SI0.074−0.131−0.6150.022−0.068−0.407
FWC0.7930.228−0.5200.2360.119−0.344
pH0.755−0.1170.0390.225−0.0610.026
OM0.9010.1350.2310.2690.0700.153
CEC0.959−0.1000.1790.286−0.0520.118
TN0.931−0.0630.2570.278−0.0330.170
TP0.922−0.0140.3190.275−0.0080.211
TK0.9010.1710.2960.2690.0890.196
AN0.9300.1560.2080.2770.0810.138
AP0.8300.2070.4310.2470.1080.285
AK0.9160.1040.2940.2730.0540.195
Table 4. Comprehensive scores of various parts of Benggang of different activity types.
Treatment CodeAGMGSG
Comprehensive ScoreRanking in Composite ScoresComprehensive ScoreRanking in Composite ScoresComprehensive ScoreRanking in Composite Scores
UC1.2222.3914.491
WT1.6912.1723.013
WM−0.855−0.6950.497
WL−3.2510−2.9010−2.2910
DT−1.567−0.987−0.189
DL−1.466−0.9760.348
SC−0.824−1.1080.925
AT−2.509−1.7690.636
AM−1.718−0.1942.094
AE−0.2830.7333.342
Mean−0.953−0.3321.281
Notes: AG: the active stage of Benggang restoration; MG: the semi-stable stage of Benggang restoration; SG: the stable stage of Benggang restoration. UC: upper catchment; WT, WM, WL: the top, middle and lower of collapsing wall; DT, DL: the top and lower of colluvial deposit; SC: scour channel; AT, AM, AE: the top, middle and edge of alluvial fan.
Publisher’s Note: MDPI stays neutral with regard to jurisdictional claims in published maps and institutional affiliations.

