Article

Comparing Strengths and Weaknesses of Three Approaches in Estimating Social Demands for Local Forest Ecosystem Services in South Korea

1
Department of Forest Sciences and Landscape Architecture, Wonkwang University, 460 Iksan-daero, Iksan 54538, Korea
2
Institute of Environmental Science, Wonkwang University, 460 Iksan-daero, Iksan 54538, Korea
3
Department of Geography, The University of Utah, Salt Lake City, UT 84112, USA
4
Department of Forestry, Environment, and Systems, College of Science and Technology, Kookmin University, 77 Jeongneung-ro, Seongbuk-gu, Seoul 02707, Korea
5
Department of Geography, Graduate School of Korea University, 145 Anam-ro, Seongbuk-gu, Seoul 02841, Korea
6
Department of Geography Education, College of Education, Korea University, 145 Anam-ro, Seongbuk-gu, Seoul 02841, Korea
7
Institute of Future Land, Korea University, 145 Anam-ro, Seongbuk-gu, Seoul 02841, Korea
*
Author to whom correspondence should be addressed.
Forests 2021, 12(4), 497; https://doi.org/10.3390/f12040497
Submission received: 8 February 2021 / Revised: 13 April 2021 / Accepted: 13 April 2021 / Published: 16 April 2021
(This article belongs to the Section Forest Economics, Policy, and Social Science)

Abstract

:
This study is aimed to compare the strengths and weaknesses of three approaches—analytic hierarchy process analysis, sentiment analysis, and floating population analysis—in estimating the social demands for local forest ecosystem services (ES) in South Korea: Gariwangsan and Yeoninsan. The results were as follows: First, the survey respondents of Gariwangsan and Yeoninsan believed that the cultural ES category was the most fundamental one that should be maintained, whereas they thought the supporting ES category needed the least maintenance. Second, both forests had a high frequency of sentiment words related to the cultural ES category, followed by the regulating ES category, such as air and water quality improvement. Third, the spatiotemporal distribution of the floating populations in both forests was concentrated in their valleys and mountainous areas, indicating the finer-scale demands for the cultural and regulating ES category. Fourth, the research shows the areas that are high in demand and those that are not; this result helps forest management. In conclusion, none of the three methodologies was superior to the other two, as they each captured distinct ES demands. To investigate ES demands in a multifaceted way, we suggest applying the three approaches in tandem.

1. Introduction

Ecosystem services (ES) of local forests have not been much appreciated in South Korea, even though the ES evaluation has been a topic of active discussion ever since Costanza et al. [1], de Groot et al. [2], and MEA [3] were published. An elaborate operation is consistently underway in the evaluation of ES in order to maximize their supply and use them as an instrument to reduce the deterioration of natural ecosystems [4]. Land-use changes are mainly driven by humans’ economic interests, such as agricultural production or housing [5], and accordingly, they often affect the ES. The recent interest in ES has been paving the way for the revaluation of such a traditional understanding of land use [6].
Forests, which were, in the past, seen merely as a source for timber, are now increasingly being recognized for their function as global carbon sinks and regulators of water resources, as well as a fundamental means for biodiversity improvement [7,8,9]. However, despite the increase in efforts evaluating and mapping the ES supply and demand [4,10,11], the concept of ES demand varies among researchers.
The aim of this study was to compare the strengths and weaknesses of three approaches—analytic hierarchy process analysis, sentiment analysis, and floating population analysis—in estimating the social demands for local forest ES in South Korea. This is done through quantifying, mapping, and comparing the social demand for two South Korean local forests, namely Gariwangsan and Yeoninsan. Two study areas were chosen, instead of one, to understand the sensitivity in terms of the results, since a methodology may show different outcomes when applied to different areas. As Korean natives, we preferred to research South Korean sites rather than elsewhere, because we must know the study areas well to best assess the results and compare how the three methodologies perform in quantifying diverse ES demands.
Quantifying the ES demands is elementary in terms of competing with economic activities that often sacrifice benefits from ecosystems [10,12,13]. Research regarding ES demand has been conducted in diverse ways and used as a foundation for policies related to the ES. According to Wolff et al. [14], ES demands can be defined based on the following three perspectives. The first perspective tallies the goods and services that are used—the total amount of goods actually consumed in a specific time and space [10]. The second perspective predicts the amount of demands by collating varied data regarding the preferences of individuals for each topic of the ES [15]. Lastly, the third perspective measures the level of desire or requirement related to individuals’ preferences for certain characteristics of the ES or human society [16]. Examining detailed studies of ES demands reveals that research has been conducted in regard to four major ES categories—namely, (1) provisioning, (2) regulating, (3) cultural, and (4) supporting—to assess the balance of supply and demand, producing a matrix that corresponds to each of the four ES categories [10]. In addition, related studies have also been actively conducted, including the use of interviews and surveys [17,18], proposals for ES demand models [14], studies about indicators that can evaluate the ES supply and demand [19], and studies comparing the methods of ES evaluation applicable to individual countries and regions. The literature regarding the three methodologies (namely, AHP analysis, sentiment analysis, and floating population analysis) are reviewed and summarized in order in the following paragraphs.
Demand appraisal based on interviews and survey data consists of two themes: (1) analyzing the ES demands in a spatially explicit manner and (2) surveying the social awareness regarding the classification of the ES demands. Reed and Brown [20] carried out surveys in the Chugach National Forest in Alaska, USA and quantified the locally dominant ES, including the aesthetic value, economy, and biological diversity. Similarly, Plieninger et al. [17] surveyed local residents about 17 dominant ES categories (including a sense of location, cultural heritage, aesthetic value, walking, fishing, and swimming) and their extent in various zones. The survey respondents were asked which of these 17 services they could find and use for each area of landcover services. Casado-Arzuaga et al. [18] conducted a social awareness survey on the classification of the ES demands by asking respondents to assign scores from 1 to 5 based on the importance of each ES.
Social media enabled sharing the data easily and provided a space where users could express their interests, activities, photos, and video footage to others [21]. Social media data uploaded by the users allowed researchers to quantify people’s preferences and experiences, and such data contribute to an improvement in empirical research methodologies [22]. A sentiment analysis is one of the techniques of text mining, designed to understand the emotions of an individual [23]. This is an independent language technique used in various fields [24]. A sentiment analysis is currently being used internationally in areas such as policy, tourism, housing, service assessment of civil appeals, factor analysis, etc. [25,26,27,28,29]. Lee et al. [30] monitored the differences between supply and demand of ES through text mining complaints made by citizens with respect to environmental issues in Sihueng, South Korea. The authors interpreted the data as ES demands, while interpreting urban planning as its supply and matching those two. Yoshimura and Hiura [22] analyzed the georeferenced photographs taken in forests of Hokkaido, Japan. After mapping them in point features, the authors demonstrated the differences in the demand and supply of ES, basing them on the context of the people’s preferences.
Using the floating population grid data of tourist attractions, Baró et al. [31] calculated and mapped a demand index and evaluated the relationship between the ES capacity and demand. Additionally, Ala-Hulkko et al. [32] used populated areas as a yardstick to form a population grid measuring forest product demand in Europe.

2. Materials and Methods
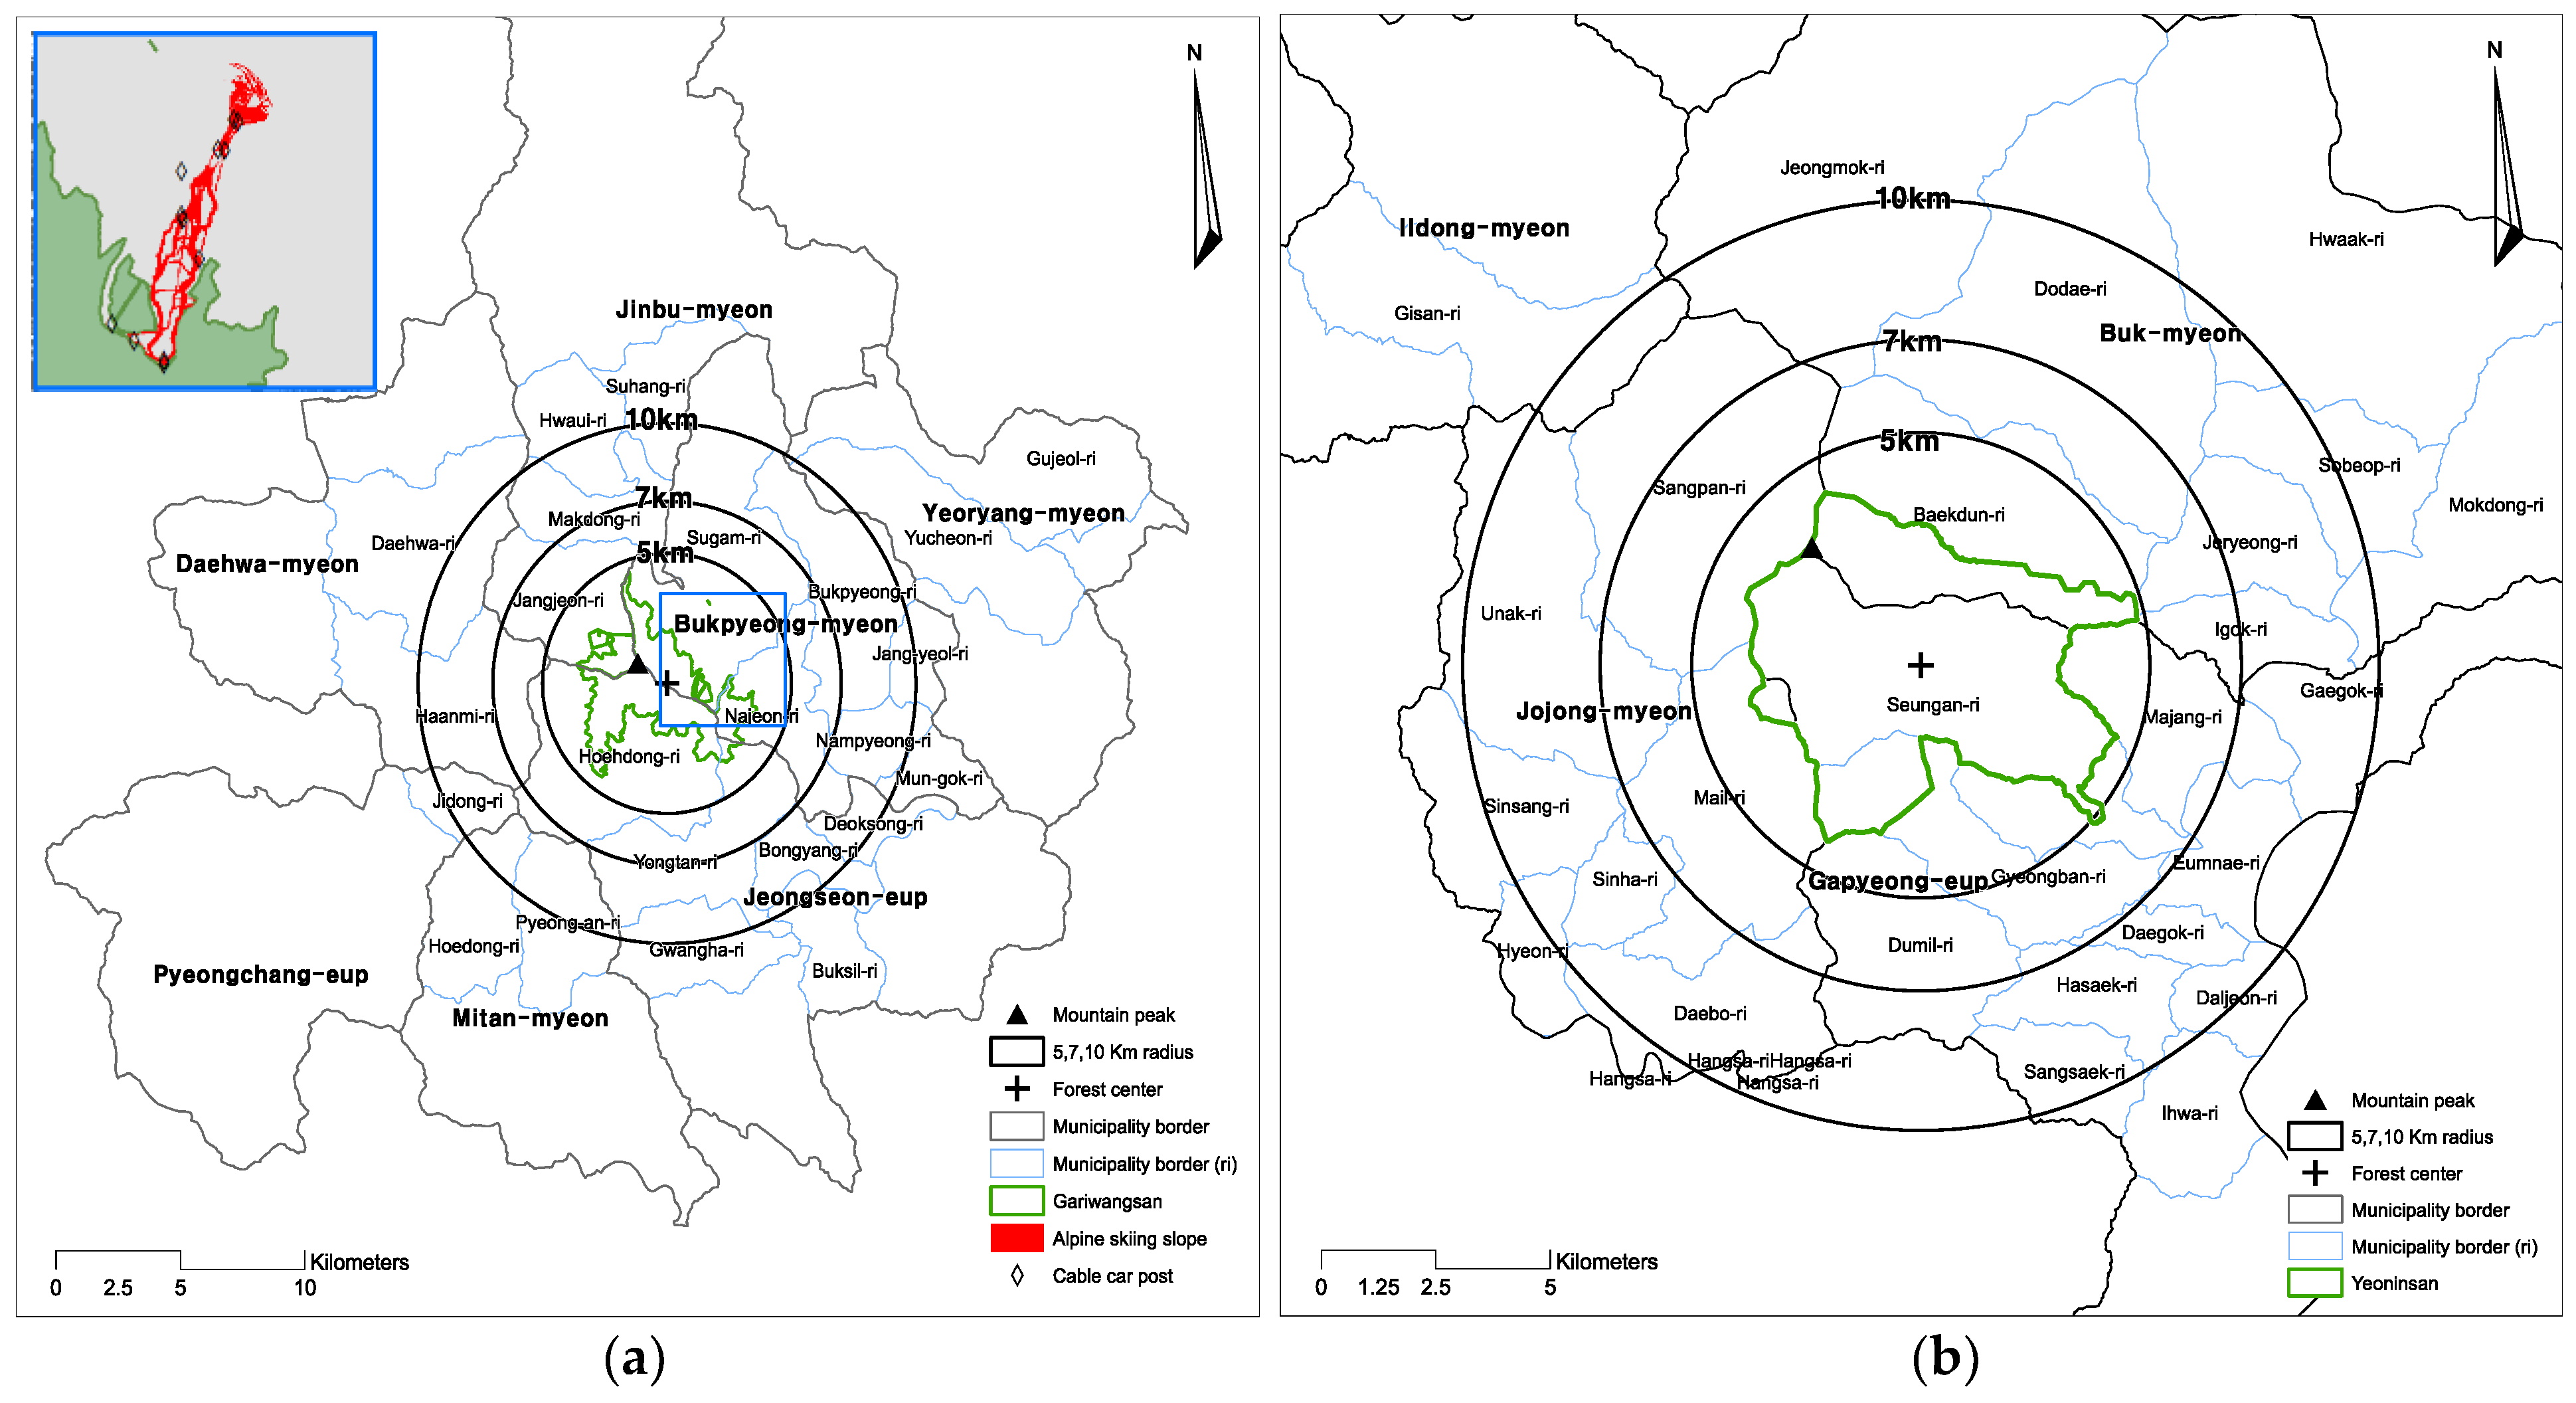
Three methodologies were applied to evaluate the ES demands: (1) analytic hierarchy process (AHP) analysis based on interviews and survey data of the local residents, (2) sentiment analysis based on web crawling of social media sites and blogs, and (3) spatial analysis based on the floating population. Each methodology is geared towards characterizing a particular ES demand: (1) the AHP analysis focuses on the demand of local residents, (2) the sentiment analysis focuses on the demand of potential tourists, and (3) the floating population analysis focuses on the demand of actual visitors. Revealing the differences in each methodology’s effectiveness for estimating each consumer type’s ES demand should provide useful information to policymakers and stakeholders who manage the associated ES. After the ES demands are calculated using the above three methodologies, they are compared by using indicators of the demand–quantity assessment. The demand for each of ten detailed ES will be analyzed to add depth to the existing research.
Ten ES were selected based on the results of the prior study on Gariwangsan and Yeoninsan [11]. Jo et al. [11] conducted the three-round Delphi analysis with twenty ES experts. They were asked to select appropriately detailed ES to estimate the ES supply of the two local forests. Nineteen preliminary ES and ten ES were selected in the first and the second rounds, respectively. In the third round, the experts agreed that the ten ES (i.e., non-timber forest product, timber, water resource, erosion prevention, water quality control, carbon absorption, air quality, recreation and sightseeing, education about nature, and biodiversity improvement) best represented the ES of both forests.
Following the terms specified by Dunford et al. [33], the ten ES were grouped into four categories: provisioning, regulating, cultural, and supporting. The provisioning category includes ES such as timber, non-timber forest products, and water resources. The regulating category has to do with minimizing the erosion and air quality and maximizing the water quality and carbon absorption. The cultural category includes recreation, sightseeing, and education about nature. Lastly, the supporting ES indicates biodiversity improvement.

2.1. Study Areas

Gariwangsan was designated as a protection zone by the Korea Forest Service (KFS) due to its abundant biodiversity so as to secure the region’s forest genetic resources. In preparation for the 2018 Pyeongchang Winter Olympics, however, forest covers on the steep slope of Gariwangsan had to be cleared—on the condition of its restoration after the international games—because there were few candidate sites in the region to host alpine ski racing (Figure 1a). While KFS has attempted to restore the cleared forest cover since the Olympics, most local residents have argued that the cleared slopes must be kept as they are, wanting them to be used for tourism to promote the regional economy. Yeoninsan, on the other hand, represents a famous provincial park located on the northeastern outskirts of Seoul, the capital of South Korea (Figure 1b). This forest is one of the most populous forest areas in the nation, and the local government (Gyeonggi Province) operates various ecological and education programs with the support of the local residents. The collaboration of local governments and residents enables Yeoninsan to sustain many visitors from Seoul and other regions. The two forests demonstrate different socioeconomic characteristics, including governance; that is, they show different land uses and emerging issues. We thought it meaningful to compare these two study areas to comprehend their ES demands and distribution patterns to ultimately unveil the relationship between ES demand and supply.

2.2. AHP Analysis Based on Interviews and Survey Data of Local Residents

Face-to-face interviews with 47 people were conducted, with all interviewees representing their municipalities as official leaders elected by the local residents. In municipalities with more than one leader, all were asked to participate. Municipality leaders were deemed the best interviewees for assessing the ES of the local forests because of their responsibility to converse with the local residents on a regular basis. We identified the municipalities by referring to the Euclidean distance from the forests’ centers and did not include those municipalities more than a 10-km radius distant. Per municipality, up to two leaders were interviewed; in all, 25 and 22 municipality leaders were interviewed in Gariwangsan and Yeoninsan, respectively. All were interviewed only once, and each interview took approximately 1 h on average.
Each interviewee received an explanation about the four ES categories and the ten ES in detail, and each was asked to check whether or not he/she understood the concepts accurately. The interview was open-ended by design. The ten ES were chosen based on a prior study on the two local forests [11]. Following the AHP analysis procedure, we presented pairs of the ES categories and of the specific ES and asked each interviewee to compare each pair (e.g., “A is more important than B”) and assign a score, ranging from 1 to 9 (Table S1).
We compared the AHP outcomes over space, because the municipality borders are provided in a geographic information system (GIS) format. By spatially joining the municipality borders (Figure 1) with the AHP outcomes, it was possible to map the AHP outcomes. After mapping, the scores of the ES categories and ES were compared over the study areas.
The AHP method stratifies the factors in solving the problem of decision-making to select one or a few of the multiple alternatives and then scores according to how faithfully the alternatives placed in the lower layer satisfies the evaluation criteria belonging to the upper layer. It is a multicriteria decision-making approach that selects the best policy alternative with the highest score as the final draft. It is a method of collecting opinions from various experts to support rational decision-making [34] and has been widely used in the field of forestry [35], agriculture [36], energy [37], transportation [38], and management [39] to determine group priorities for specific unknown options. Jo et al. [40] conducted a study applying the AHP analysis to analyze the priority of the management of suppliers for ES in urban forests. In this study, the interviewees were presented with the pairwise comparison of ES and asked to rate their preferences for each set. Such comparison and selection allowed the researchers to find out how much a specific ES is preferred compared to any ES in the comparison criteria.
As part of the AHP method [41], the weight of a decision-making factor is numerically expressed as follows:
A · W = λ m a x · W
A = square matrix resulting from pairwise comparison,
λ m a x = maximum eigenvalue, and
W = Eigenvector.
The Consistency Index (CI) measures consistency. λ m a x getting closer to n indicates that matrix A has a greater consistency.
C I = λ m a x n n 1
When CI is less than or equal to 0.1, the responses are considered consistent and reliable [41]. The ranking of several alternatives is computed by integrating the relative weights of the determining factors and multiplying the weights according to the rankings of the alternatives, which indicates the final importance of the vector. The weighting equation of the alternatives is shown as follows:
ω i = ( ω j ) ( μ j i )
ω i = total weight of the alternative i,
ω j = relative weight of the valuation standard j, and
μ j i = weight of the alternative i to the valuation standard j.

2.3. Sentiment Analysis Based on Web Crawling

Web crawling on internet blogs and social media websites occurred simultaneously with the contents’ cross-validation; similar approaches were used by Liu [29] and Hu and Liu [42]. They designed and generated a sentiment dictionary to account for the number of positive and negative words. The dictionary enables creating a density map of positive and negative sentiments in the study areas.
After the web crawling, the keywords regarding tourist attractions within 10 km of the two forests were extracted for a sentiment analysis. For the process of extraction, the present study referred to the Pyeongchang Cultural Tourism and Jeongseongwan Tourism websites for Gariwangsan and the Gapyeong and Pocheon City Culture and Tourism websites for Yeoninsan (Table S2).
Data from a total of 225 blogs and social media were obtained for the study areas. Locational and spatial information in textual form from the collected text data were geo-coded using Google Map Engine following the approach proposed by previous studies [43,44,45,46,47]. Sentiment scores ranging from 2 to −2 were given in accordance with the ten ES. The sentiment scores were mainly determined by establishing a sentiment dictionary to ascertain the positivity and negativity. The number of words corresponding to each was counted by applying a similar method to that of Liu [29] and Hu and Liu [42]. The scoring scheme is shown in Table 1.
If negative, the score is under zero, and if positive, the score is above zero. First, using the text obtained, we visualized a word cloud (in Korean) and analyzed the word frequency. Then, the demand factors were extracted and ranked. Lastly, the geographical patterns of ES sentiment scores in Gariwangsan and Yeoninsan were analyzed (Table 2). We applied kernel density to the sentiment score weights to spatially portray the demand density and ultimately applied the appropriate translation into English.

2.4. Spatial Analysis Based on Floating Population

The floating population can represent ES demands, because it represents visits made by real people. In this study, such demands were spatially analyzed according to the total amount of population floating and their locations in March, June, September, and December 2020. This analysis relies on the data recorded every hour based on the population’s cell phone movement. The movement is accounted not by a global positioning system but by the number of cell phones connected to a particular communication tower; there are more than 100 thousand towers in South Korea. Specifically, if a cell phone moves from one place to another, its connection will get lost from the first tower and will get detected by the second or a later tower. Such data are considered confidential, only accessible at specific government facilities. In other words, the floating population data are not filtered per visit. If one stays longer in the forests, the stay will be accounted for accordingly. Therefore, it is different from ordinary traffic data (or tourist counts) used in the other research. Kernel density maps were introduced to convert sentiment scores into weights in order to indicate the actual locations of people’s visits and the spatial locations of the positive and negative sentiments. Table 3 corresponds to the data, sources, and basis of utilization of the three methodologies used to identify the ES demands.

3. Results

3.1. AHP Analysis

In the section with the major classification of ES, respondents of both forest regions commonly gave the highest ranking to the cultural ES category and the lowest ranking to the supporting category (Table 4). In the case of Gariwangsan, the provisioning category ranked higher than the regulating category, and in the case of Yeoninsan, the relative rank of the provisioning category was lower than that of regulating. In terms of specific ES, under the provisioning category, supplying water resources was seen as the most important ES in Gariwangsan by the local residents, while supplying non-timber forest products was seen to be the most important ES in Yeoninsan. It has long-been recognized that Gariwangsan is an important source for supplying drinking water to nearby areas. In the case of Yeoninsan, local residents are aware of the high income that is brought by pine nuts in some of the municipalities, and hence, non-timber forest product supply services are seen to be more important than the rest. In terms of the water resource supply around Yeoninsan, the local residents replied that other nearby forests and mountains, such as Hwaeksan and Myeongjisan, play that role instead. In terms of regulating the ES in Gariwangsan, the local residents think the role of water quality regulation is important, and the water resource supply and water quality are considered important indicators. As there have been many cases of landslides and floods in nearby areas, the ES controlling erosion was considered very important. However, air quality improvement ES was considered most important in Yeoninsan, followed by water quality, soil erosion control, and carbon absorption. In terms of the cultural ES in Gariwangsan, the local residents were aware of the lack of infrastructure for recreational and sightseeing services that could potentially increase their income and suggested that such ES was helpful in attracting tourists. In comparison, in the case of Yeoninsan, about 60% of the residents in the municipality were engaged in tourism already, so it turned out that programs for learning and utilizing the existing infrastructure were more important.
Figure 2a,b mapped the scores of the provisioning and regulating ES categories. The closer to a red color, the higher the scores are for the provisioning category, and the closer to a blue color, the higher are the scores for the regulating category. The distance of 5, 7, and 10 km are marked on the map to make it easier to identify the score comparison by distance.
Figure 3 illustrates the comparison of the scores regarding the provisioning and regulating categories by distance in a scatterplot graph where the y-axis is the score for ES, and the x-axis is the distance from the center point of each forest to the corresponding municipality. As shown in the maps (Figure 2a,b) and the graph (Figure 3), the local residents clearly find the provisioning category to be of greater importance compared to the regulating category. All local residents within the 10 km area of Gariwangsan responded that the provisioning category is important, but as the distance from the forest increases, there is a gradual decrease in the perception of its importance. In the case of Jeongseon and Pyeongchang municipalities, non-timber forest products obtained from Gariwangsan were often directly related to residents’ livelihood; even if they were situated farther away from the forest center, they still tended to prioritize the provisioning category over the regulating category (Figure 2a). In Yeoninsan, respondents preferred the provisioning category when the distance was closer but favored the regulating category when the distance was farther from the 5 km radius (Figure 2b). Because forest products, such as pine nuts and timber, from Yeoninsan are closely associated with the local residents’ livelihood, the AHP results showed that the provisioning category was more important to the local residents within the distance range, but the regulating ES such as water quality regulation and erosion control became more important to the local residents outside the 5 km radius (Figure 2b).
Figure 4a,b shows the score differences of the regulating and cultural categories, and both forests show the same tendencies. The local residents of both forest regions recognized that the management of the cultural category should be prioritized over the regulating category. In the case of Gariwangsan, this trend was seen more strongly the closer the distance to the forest center. This is related to the increase in the cultural ES, such as the installation of alpine ski slopes and gondolas for the 2018 Pyeongchang Winter Olympics. At the time of the interview, the majority of local residents around Gariwangsan said that tourists’ access to the Pyeongchang Winter Olympics venue was helpful for community development, and they valued the development of the cultural ES over restoring the forest cover in and around the alpine ski slopes and other regulating ES (Figure 4a). In the case of Yeoninsan, as opposed to Gariwangsan, the farther away from the forest center, the more emphasis the local residents placed on the importance of the cultural category (Figure 5). Other ES categories’ relationships, such as provisioning–cultural, provisioning–supporting, and regulating–supporting, were omitted, because they did not show any meaningful outcomes. The detailed data regarding Figure 2, Figure 3, Figure 4 and Figure 5 are presented in Supplementary Materials (Table S3).

3.2. Sentiment Analysis
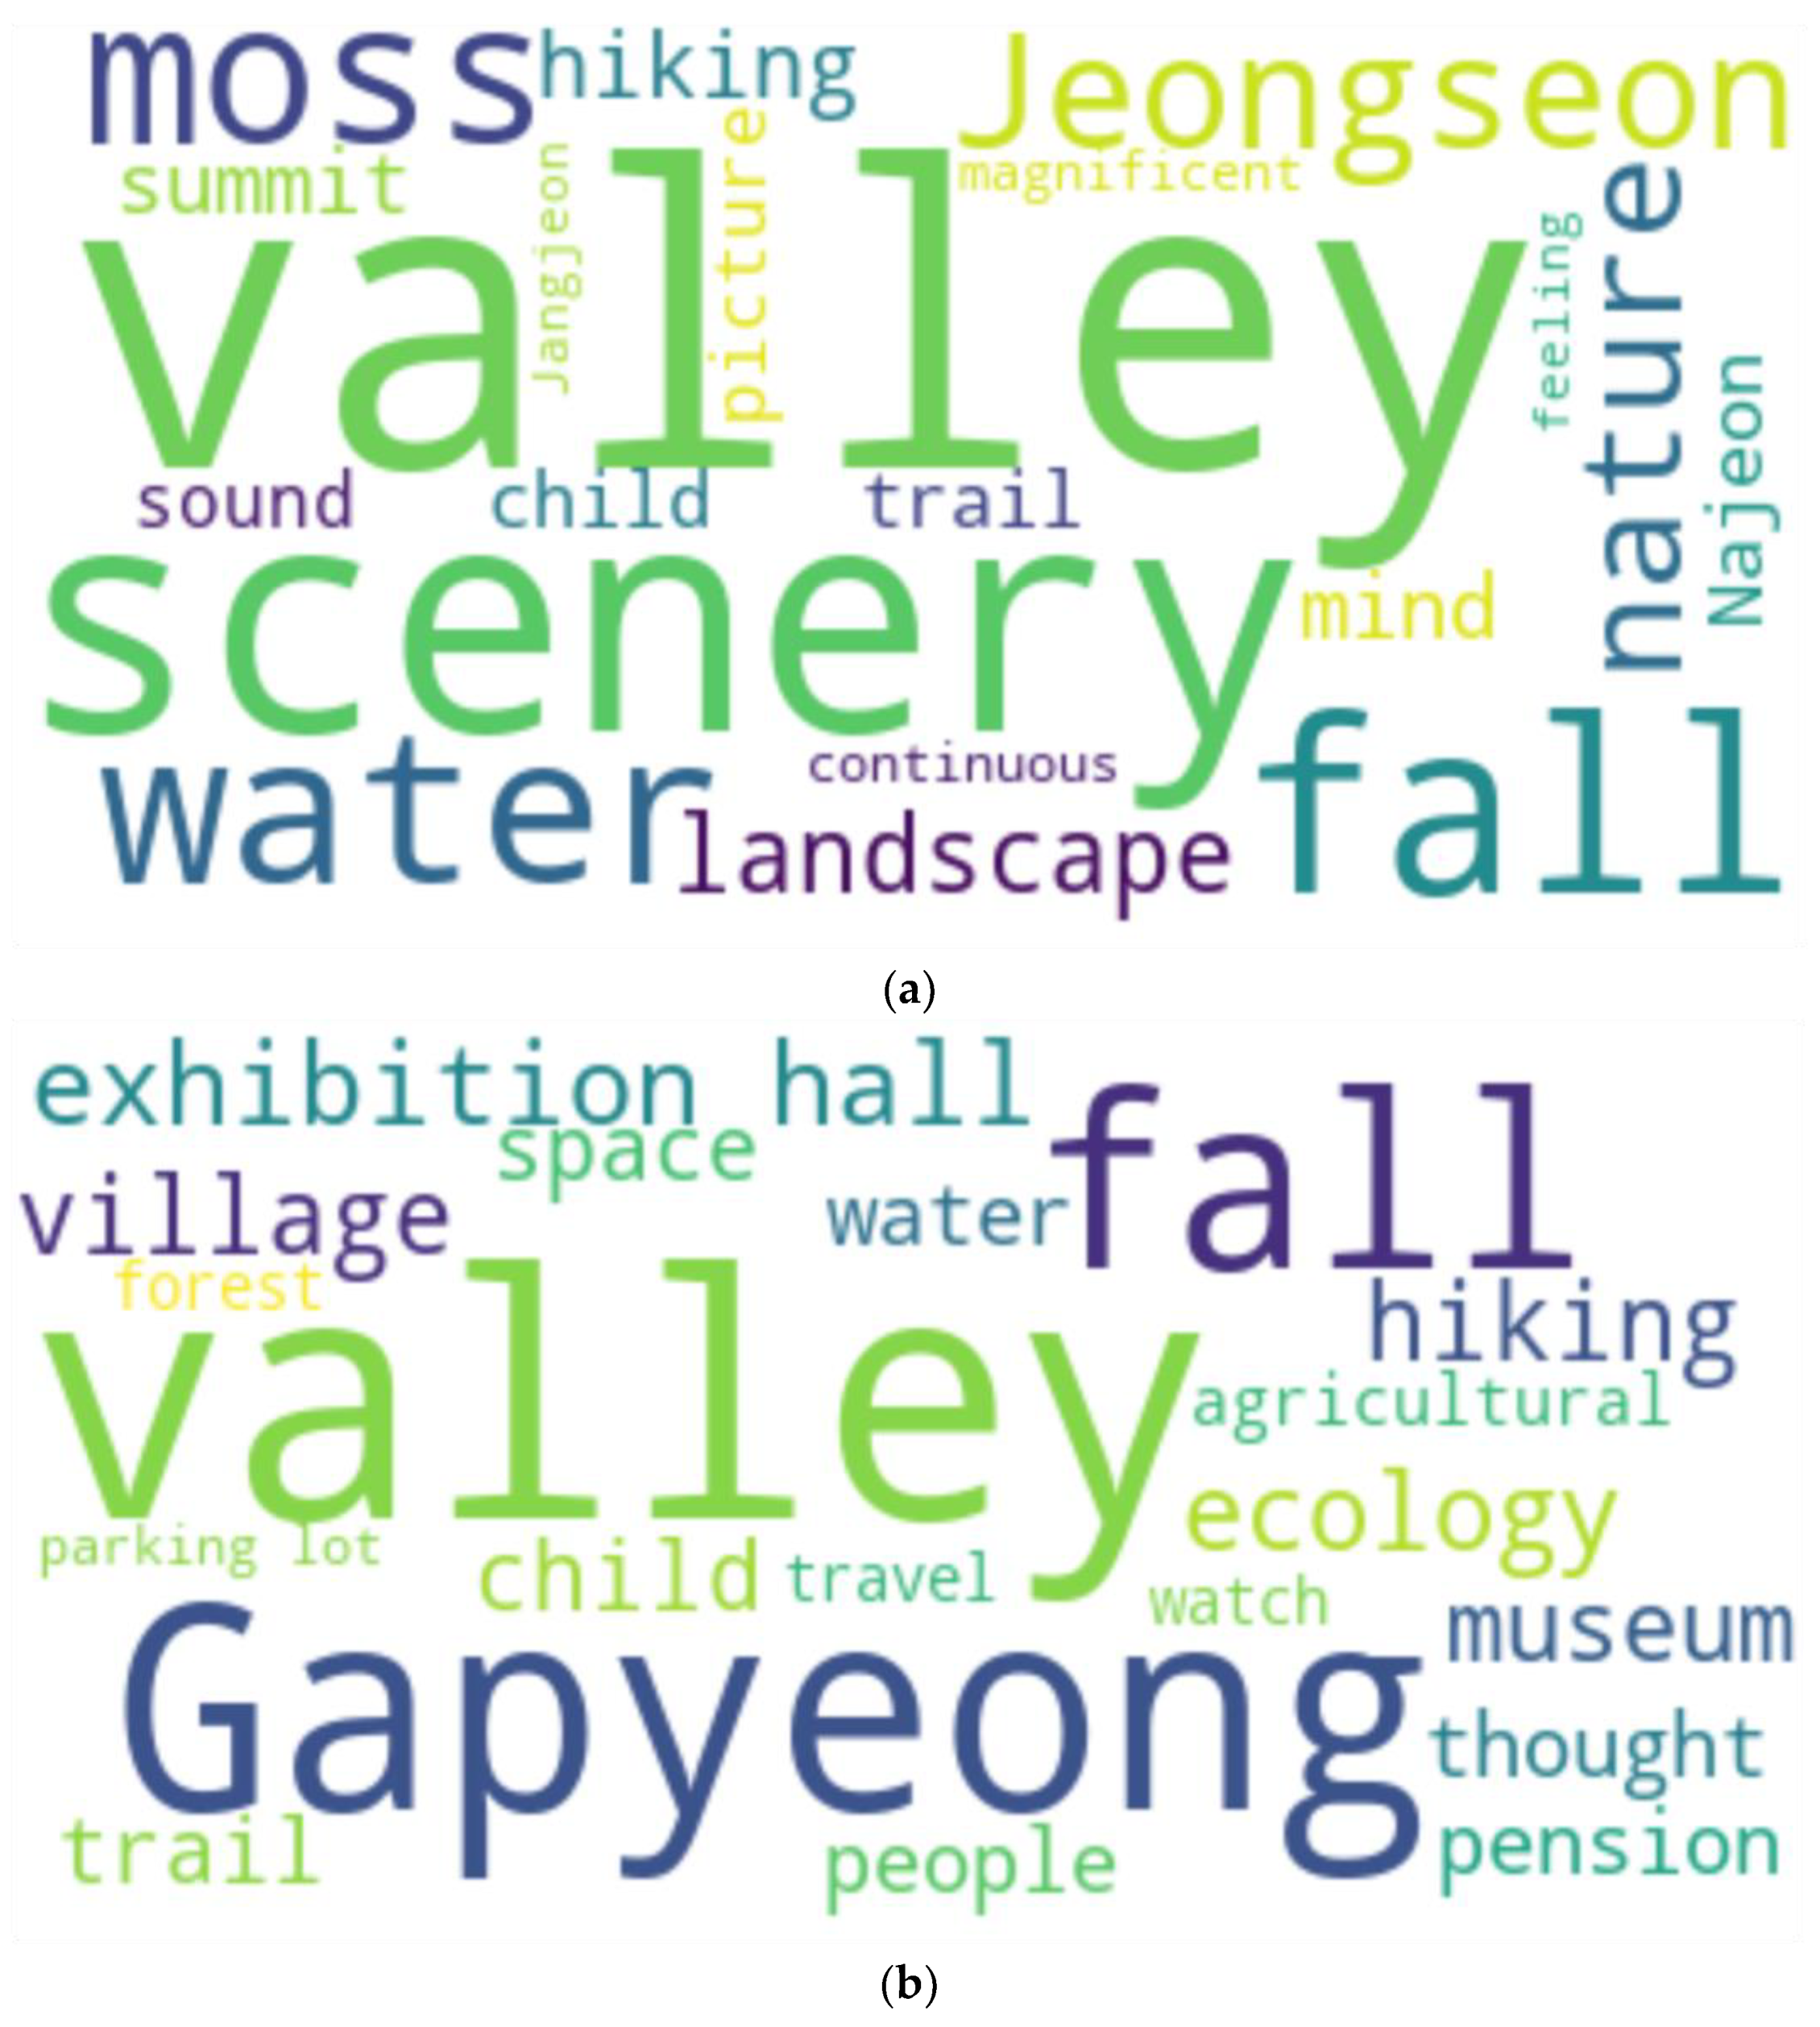
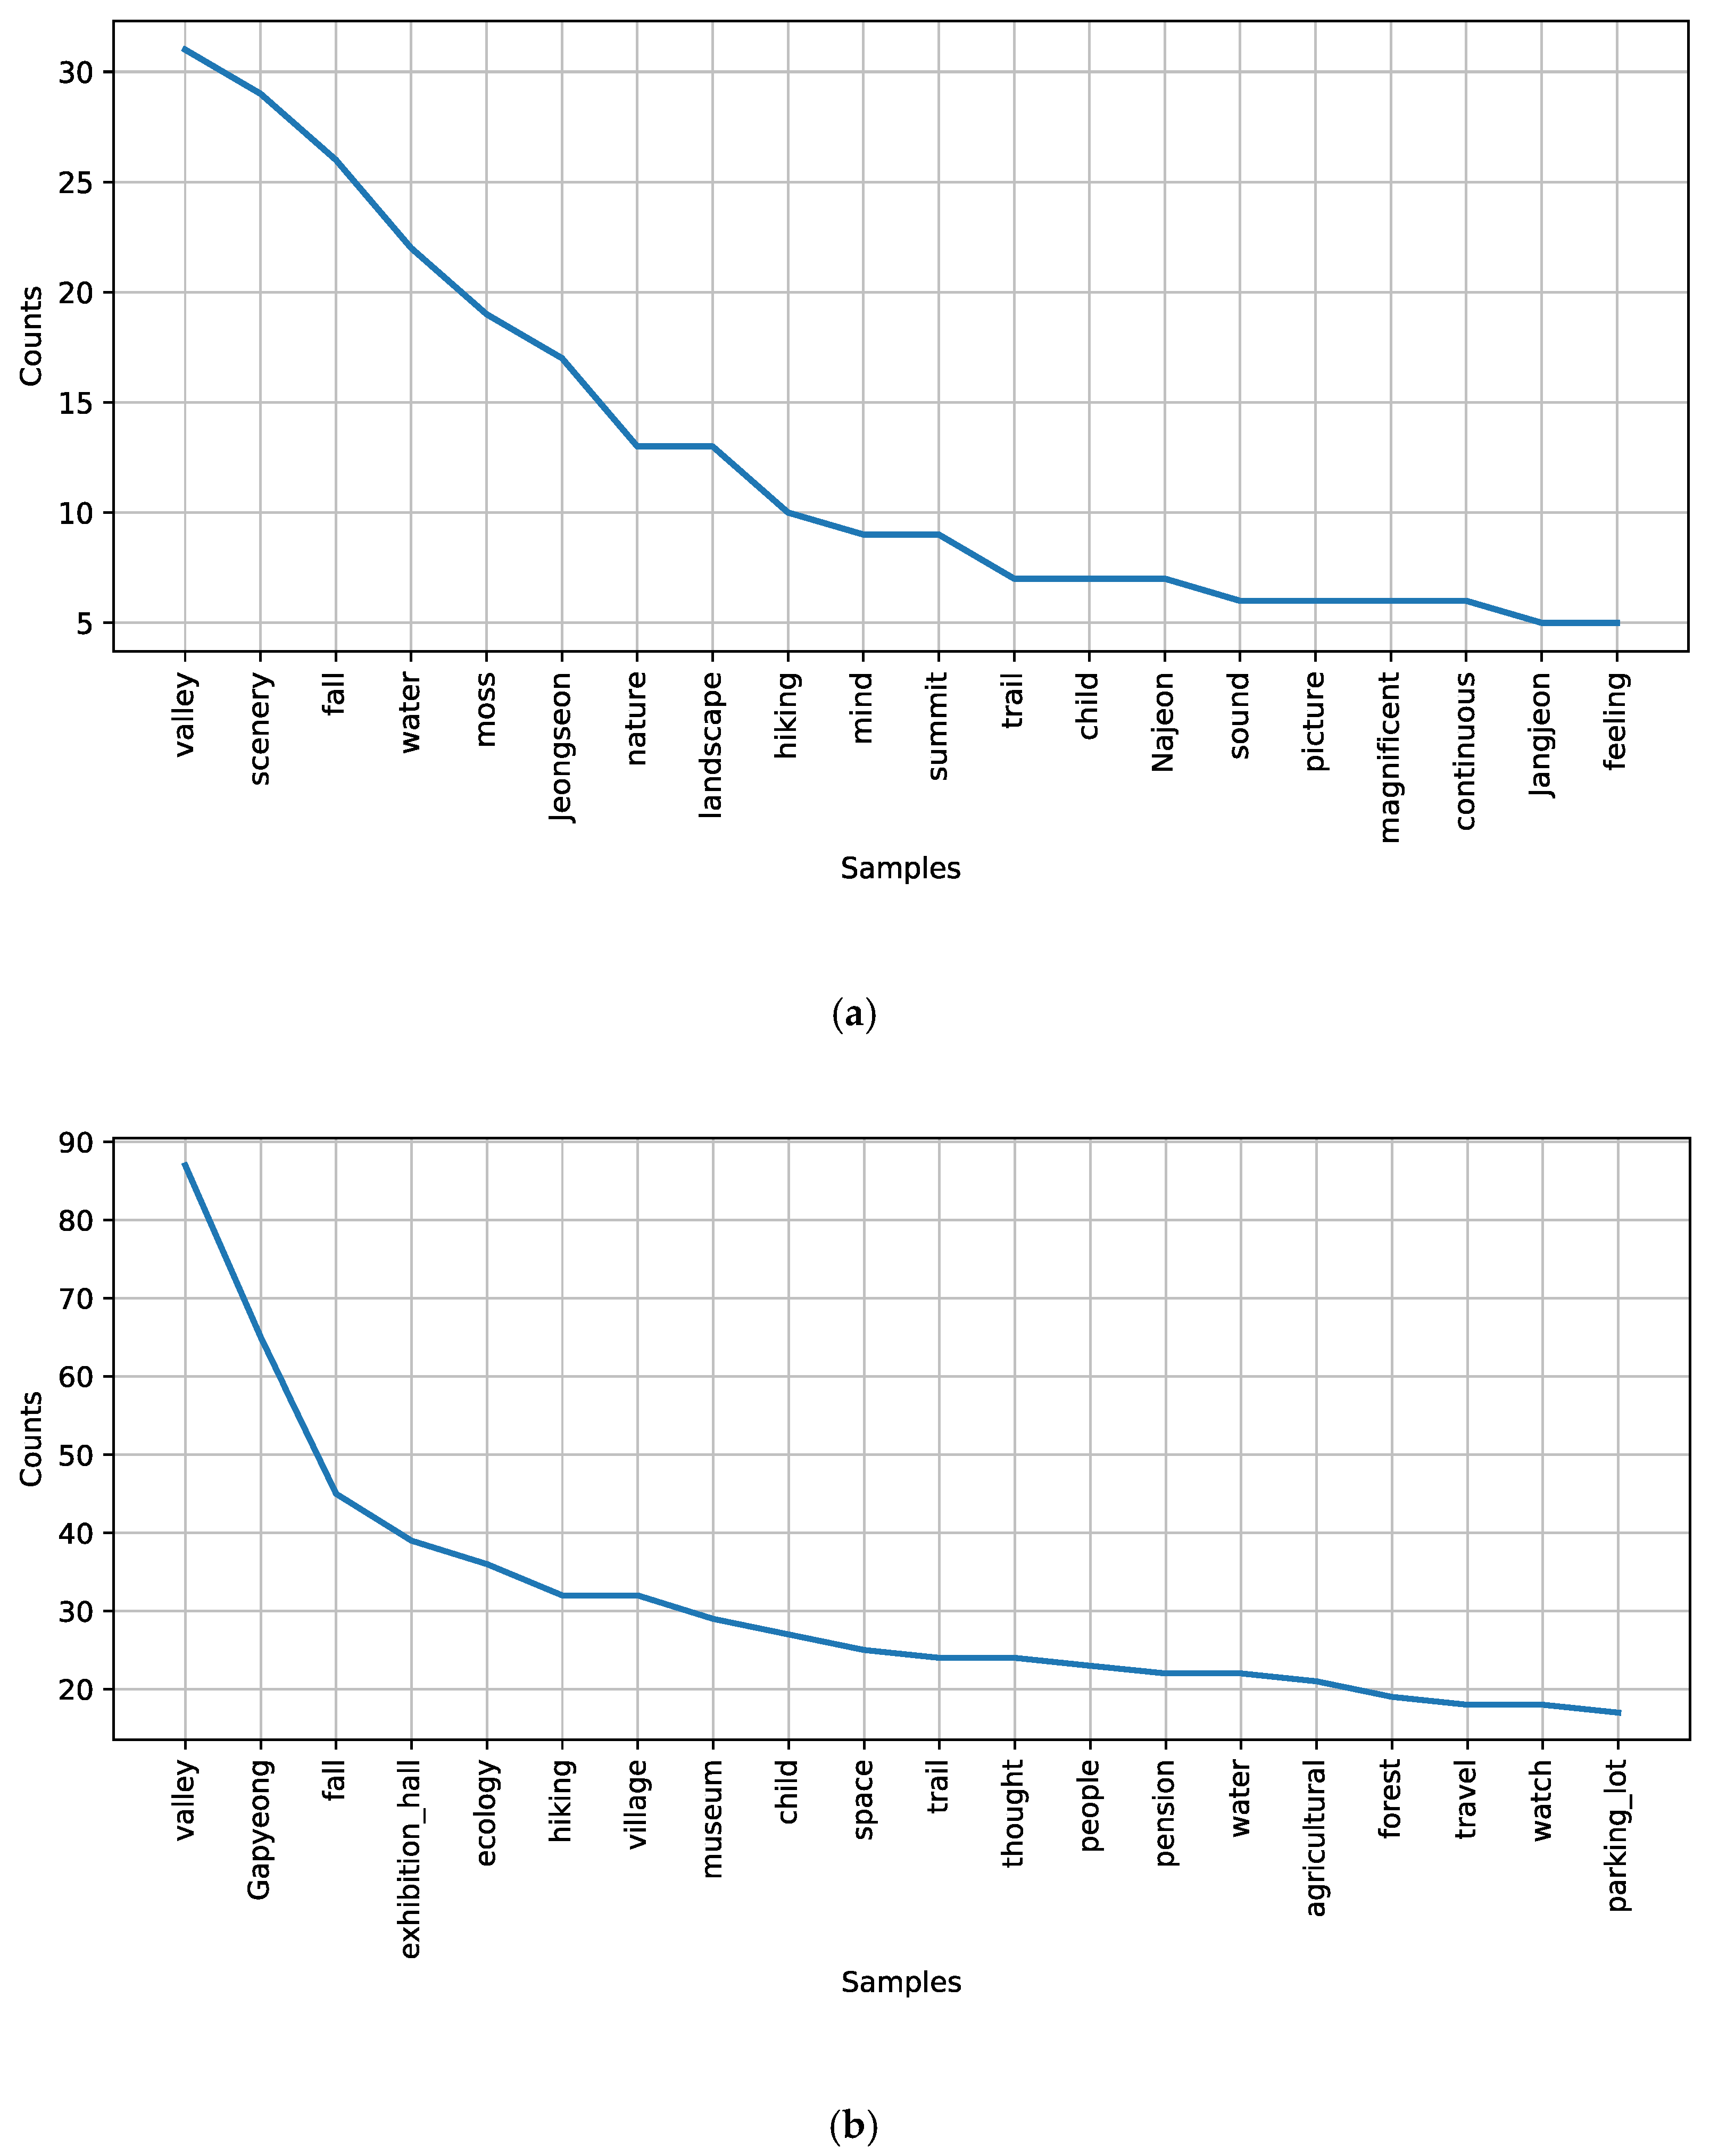
3.2.1. Word Cloud

Using data collected from blogs and social media, the word cloud and word frequency analyses were conducted. In Gariwangsan, the most frequently mentioned word was Valley, with most of the words being related to the regulating and cultural ES about nature and ecology, such as Fall, Water, Moss, Nature, and Scenery (Figure 6a). In the case of Yeoninsan, the most frequent word was also Valley, followed by Gapyeong (the municipality’s name), Fall, Exhibition Hall, Ecology, Village, Museum, and Child (Figure 6b). That is, many people visited Yeoninsan with families demanding mostly for cultural ES and some regulating ES. Figure 7a,b shows the top 20 most frequent words in English for both forests (Figure S1).

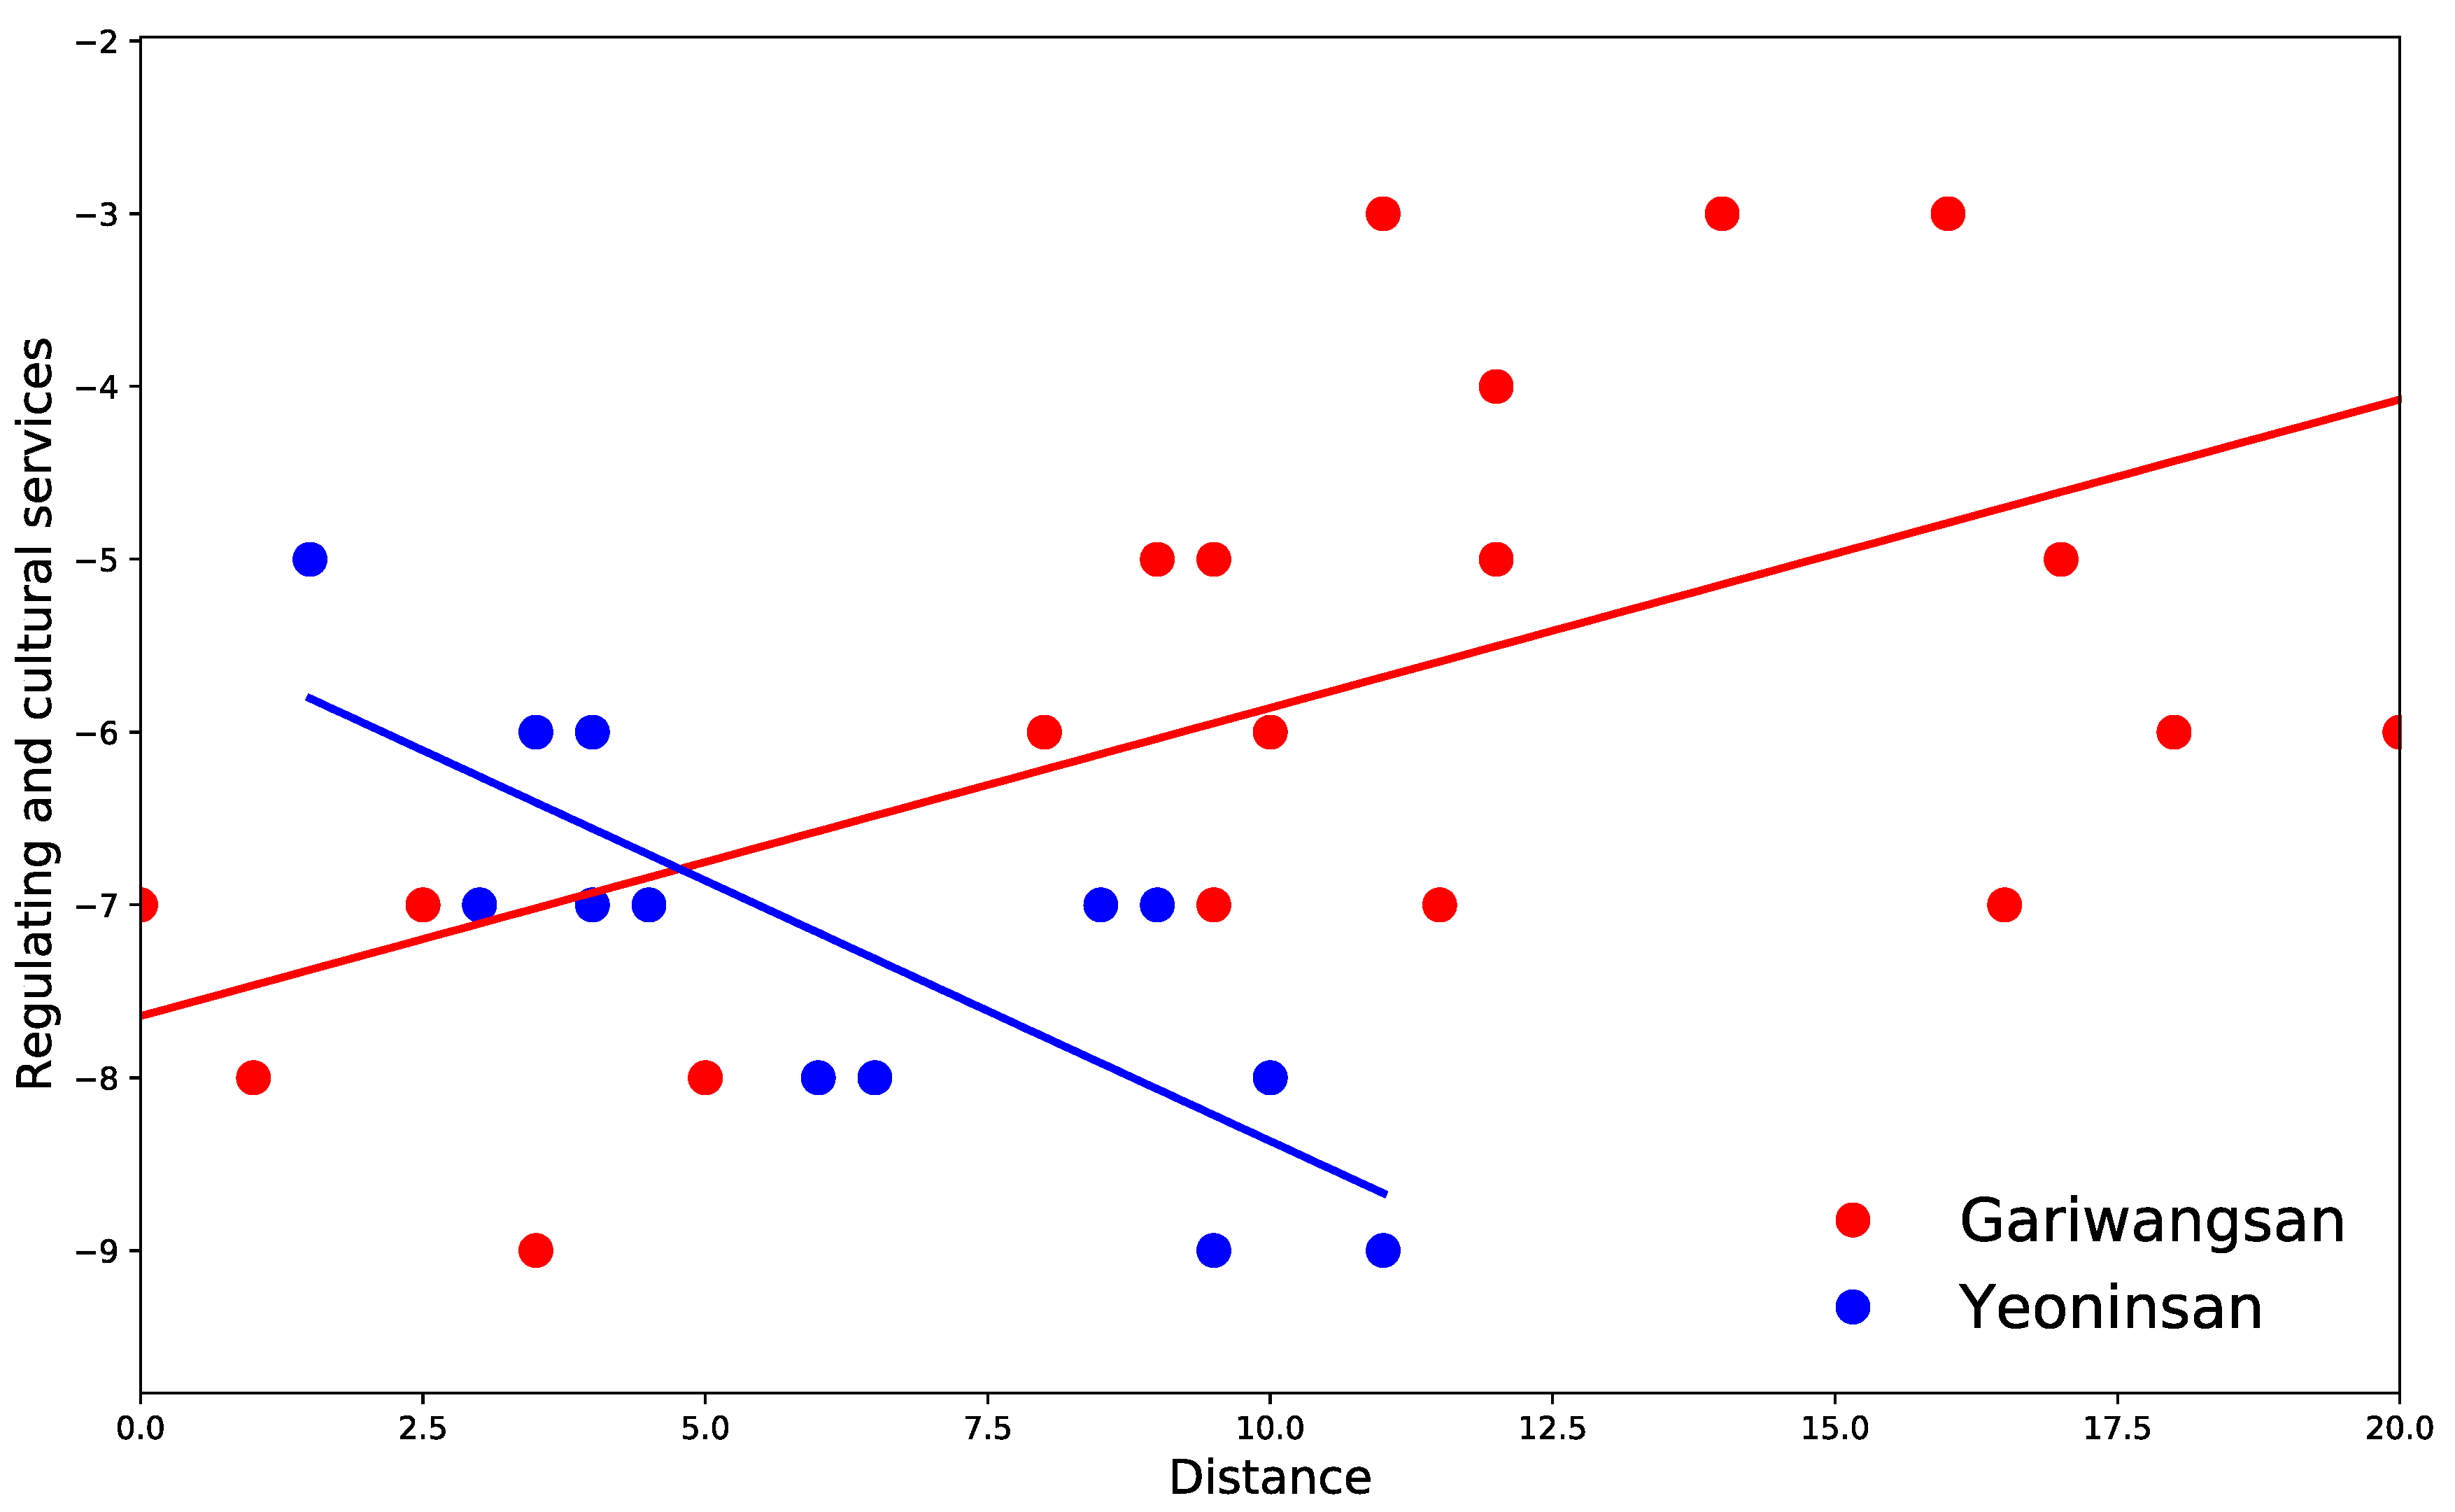
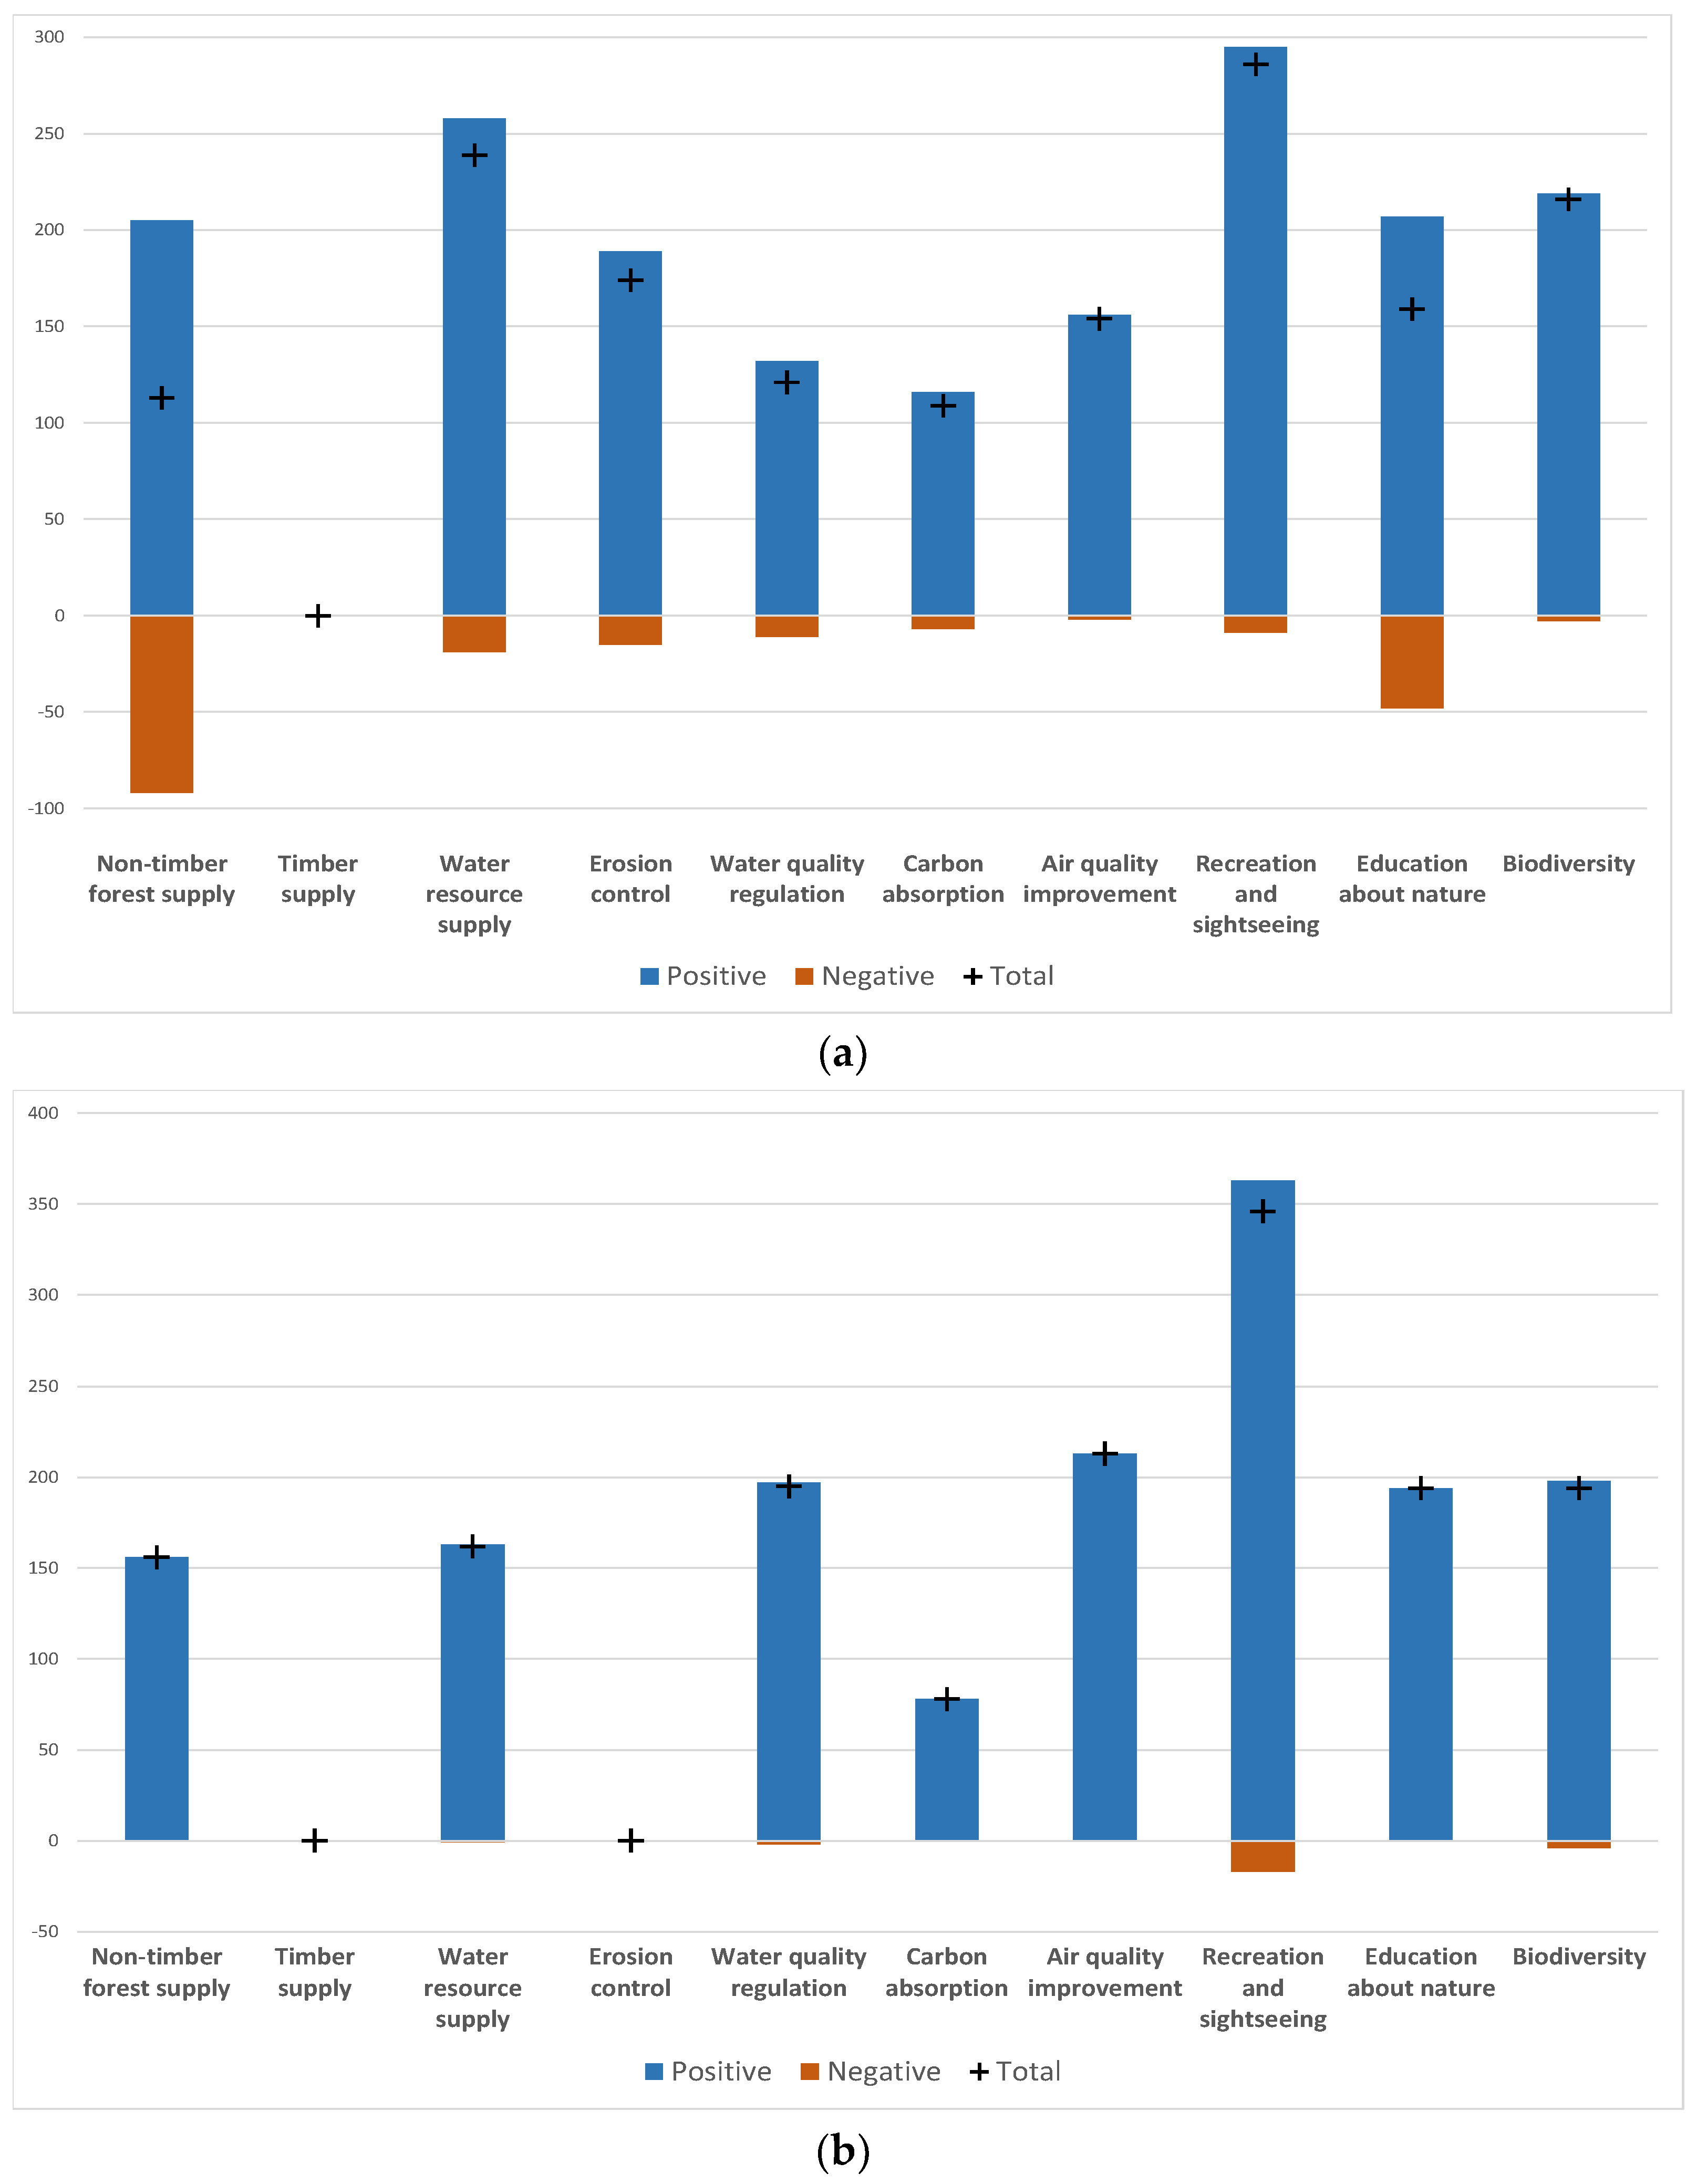
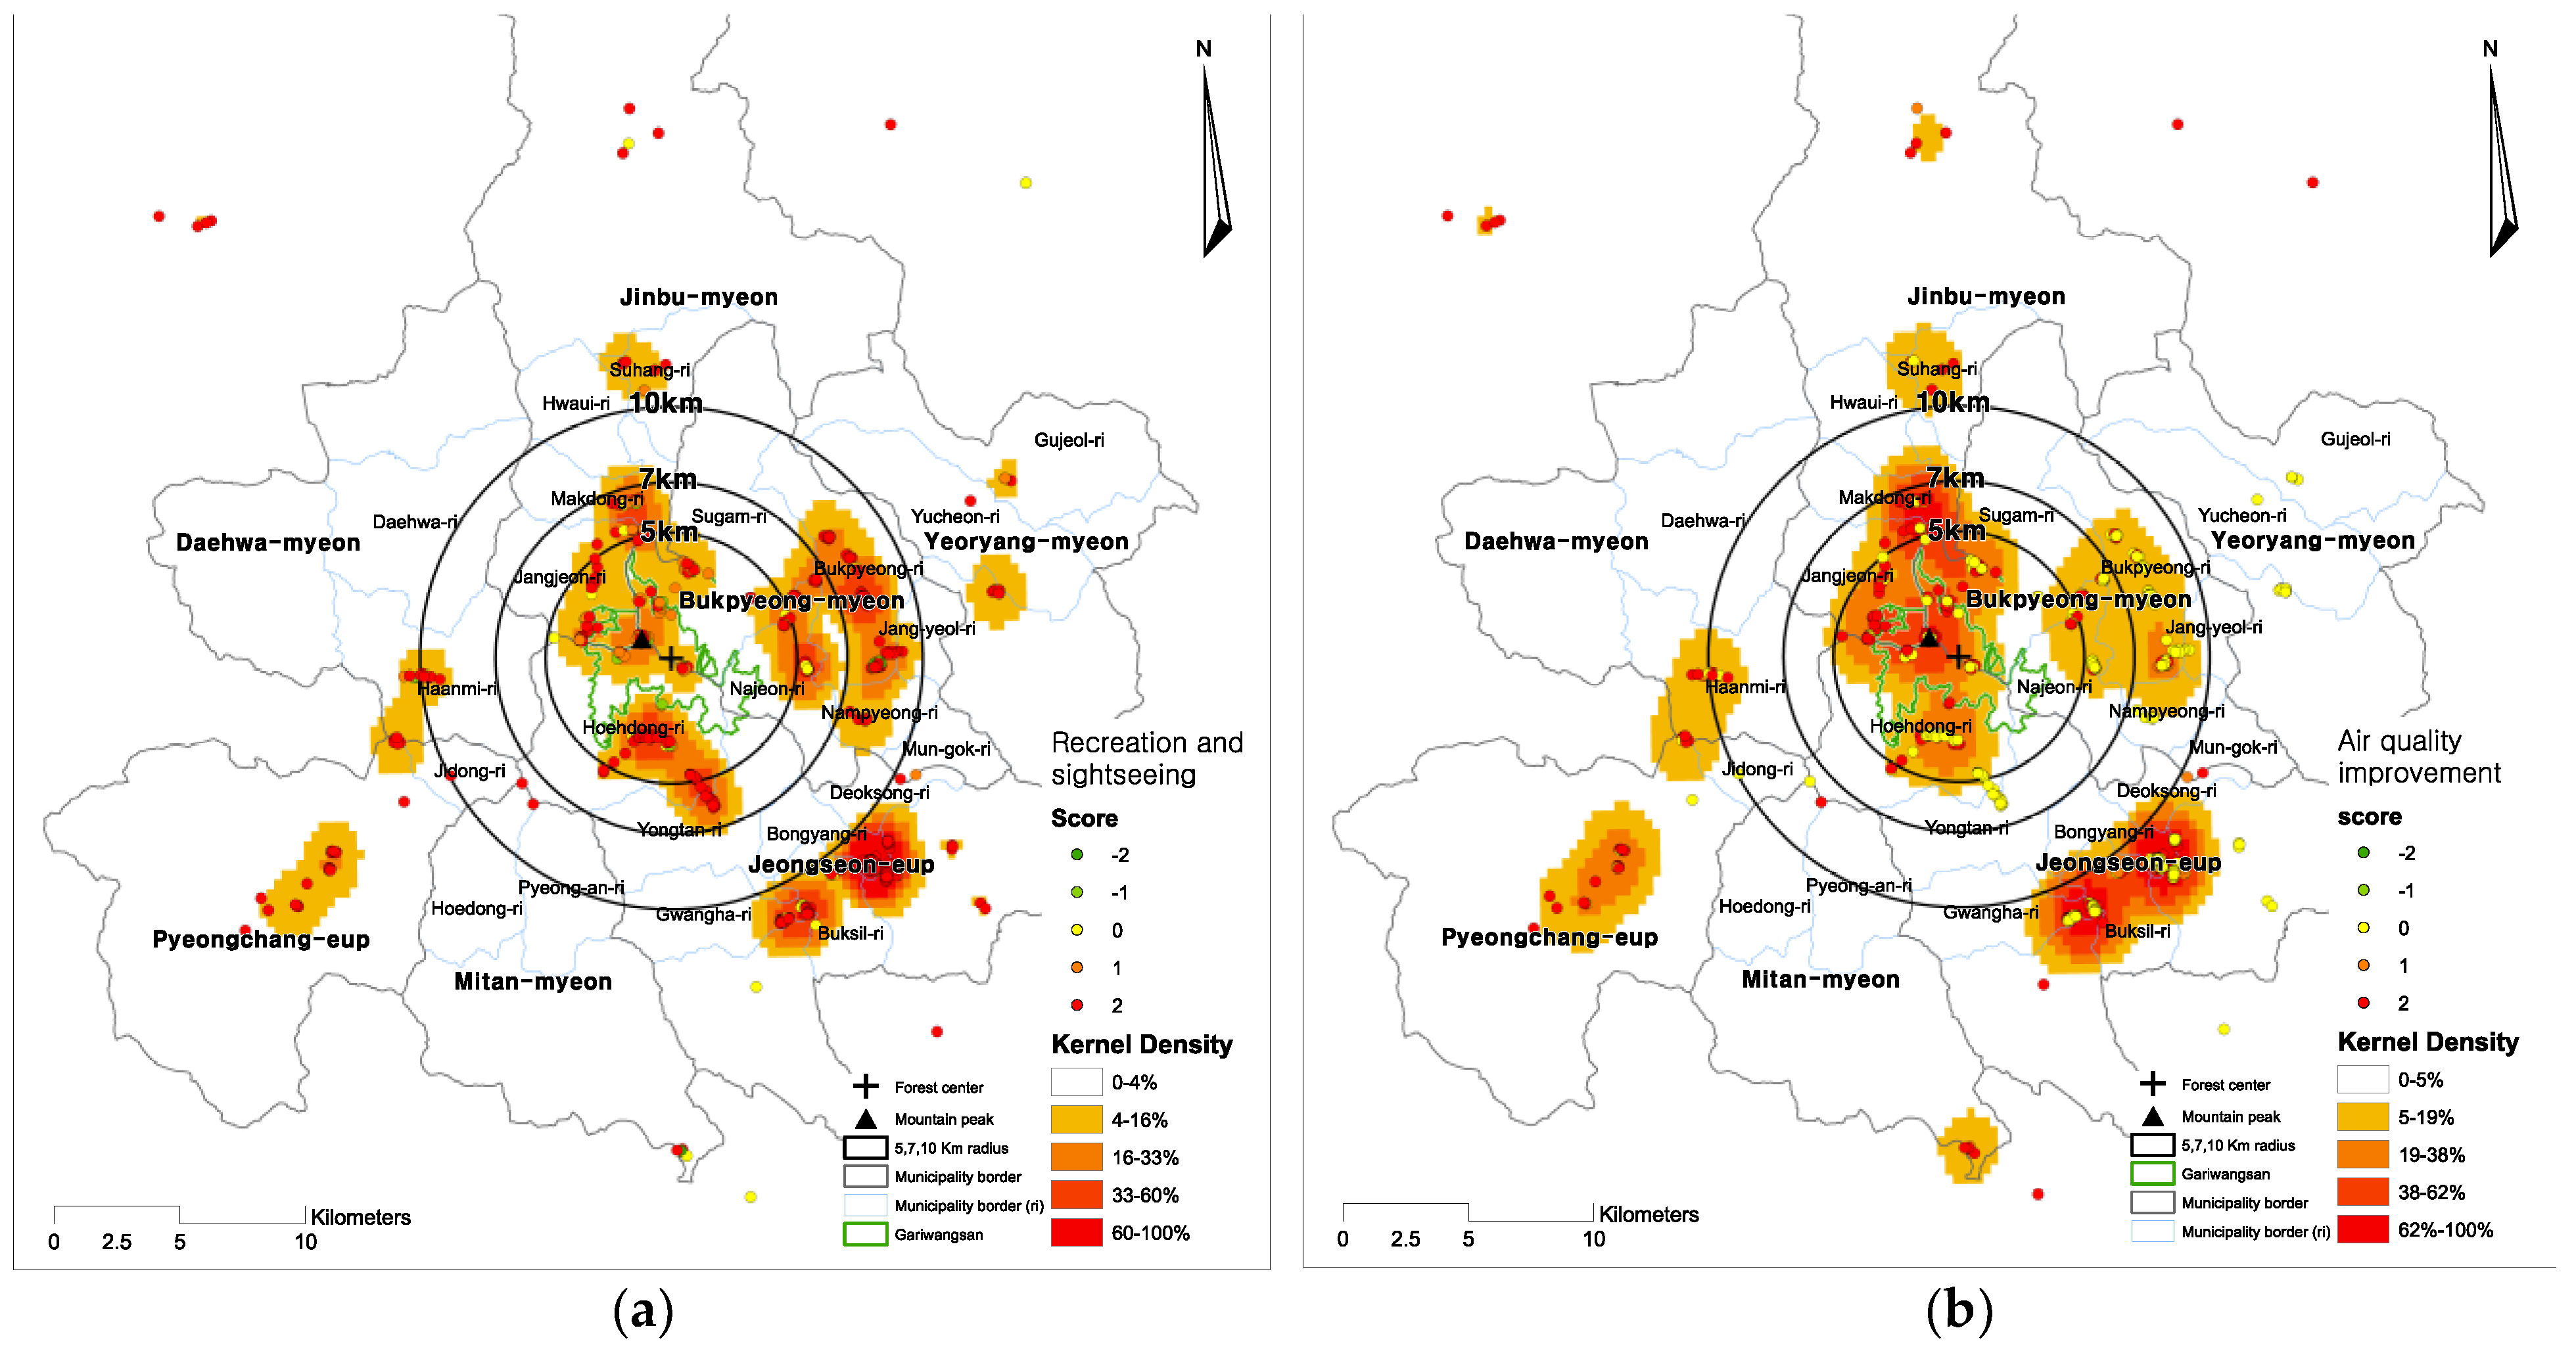
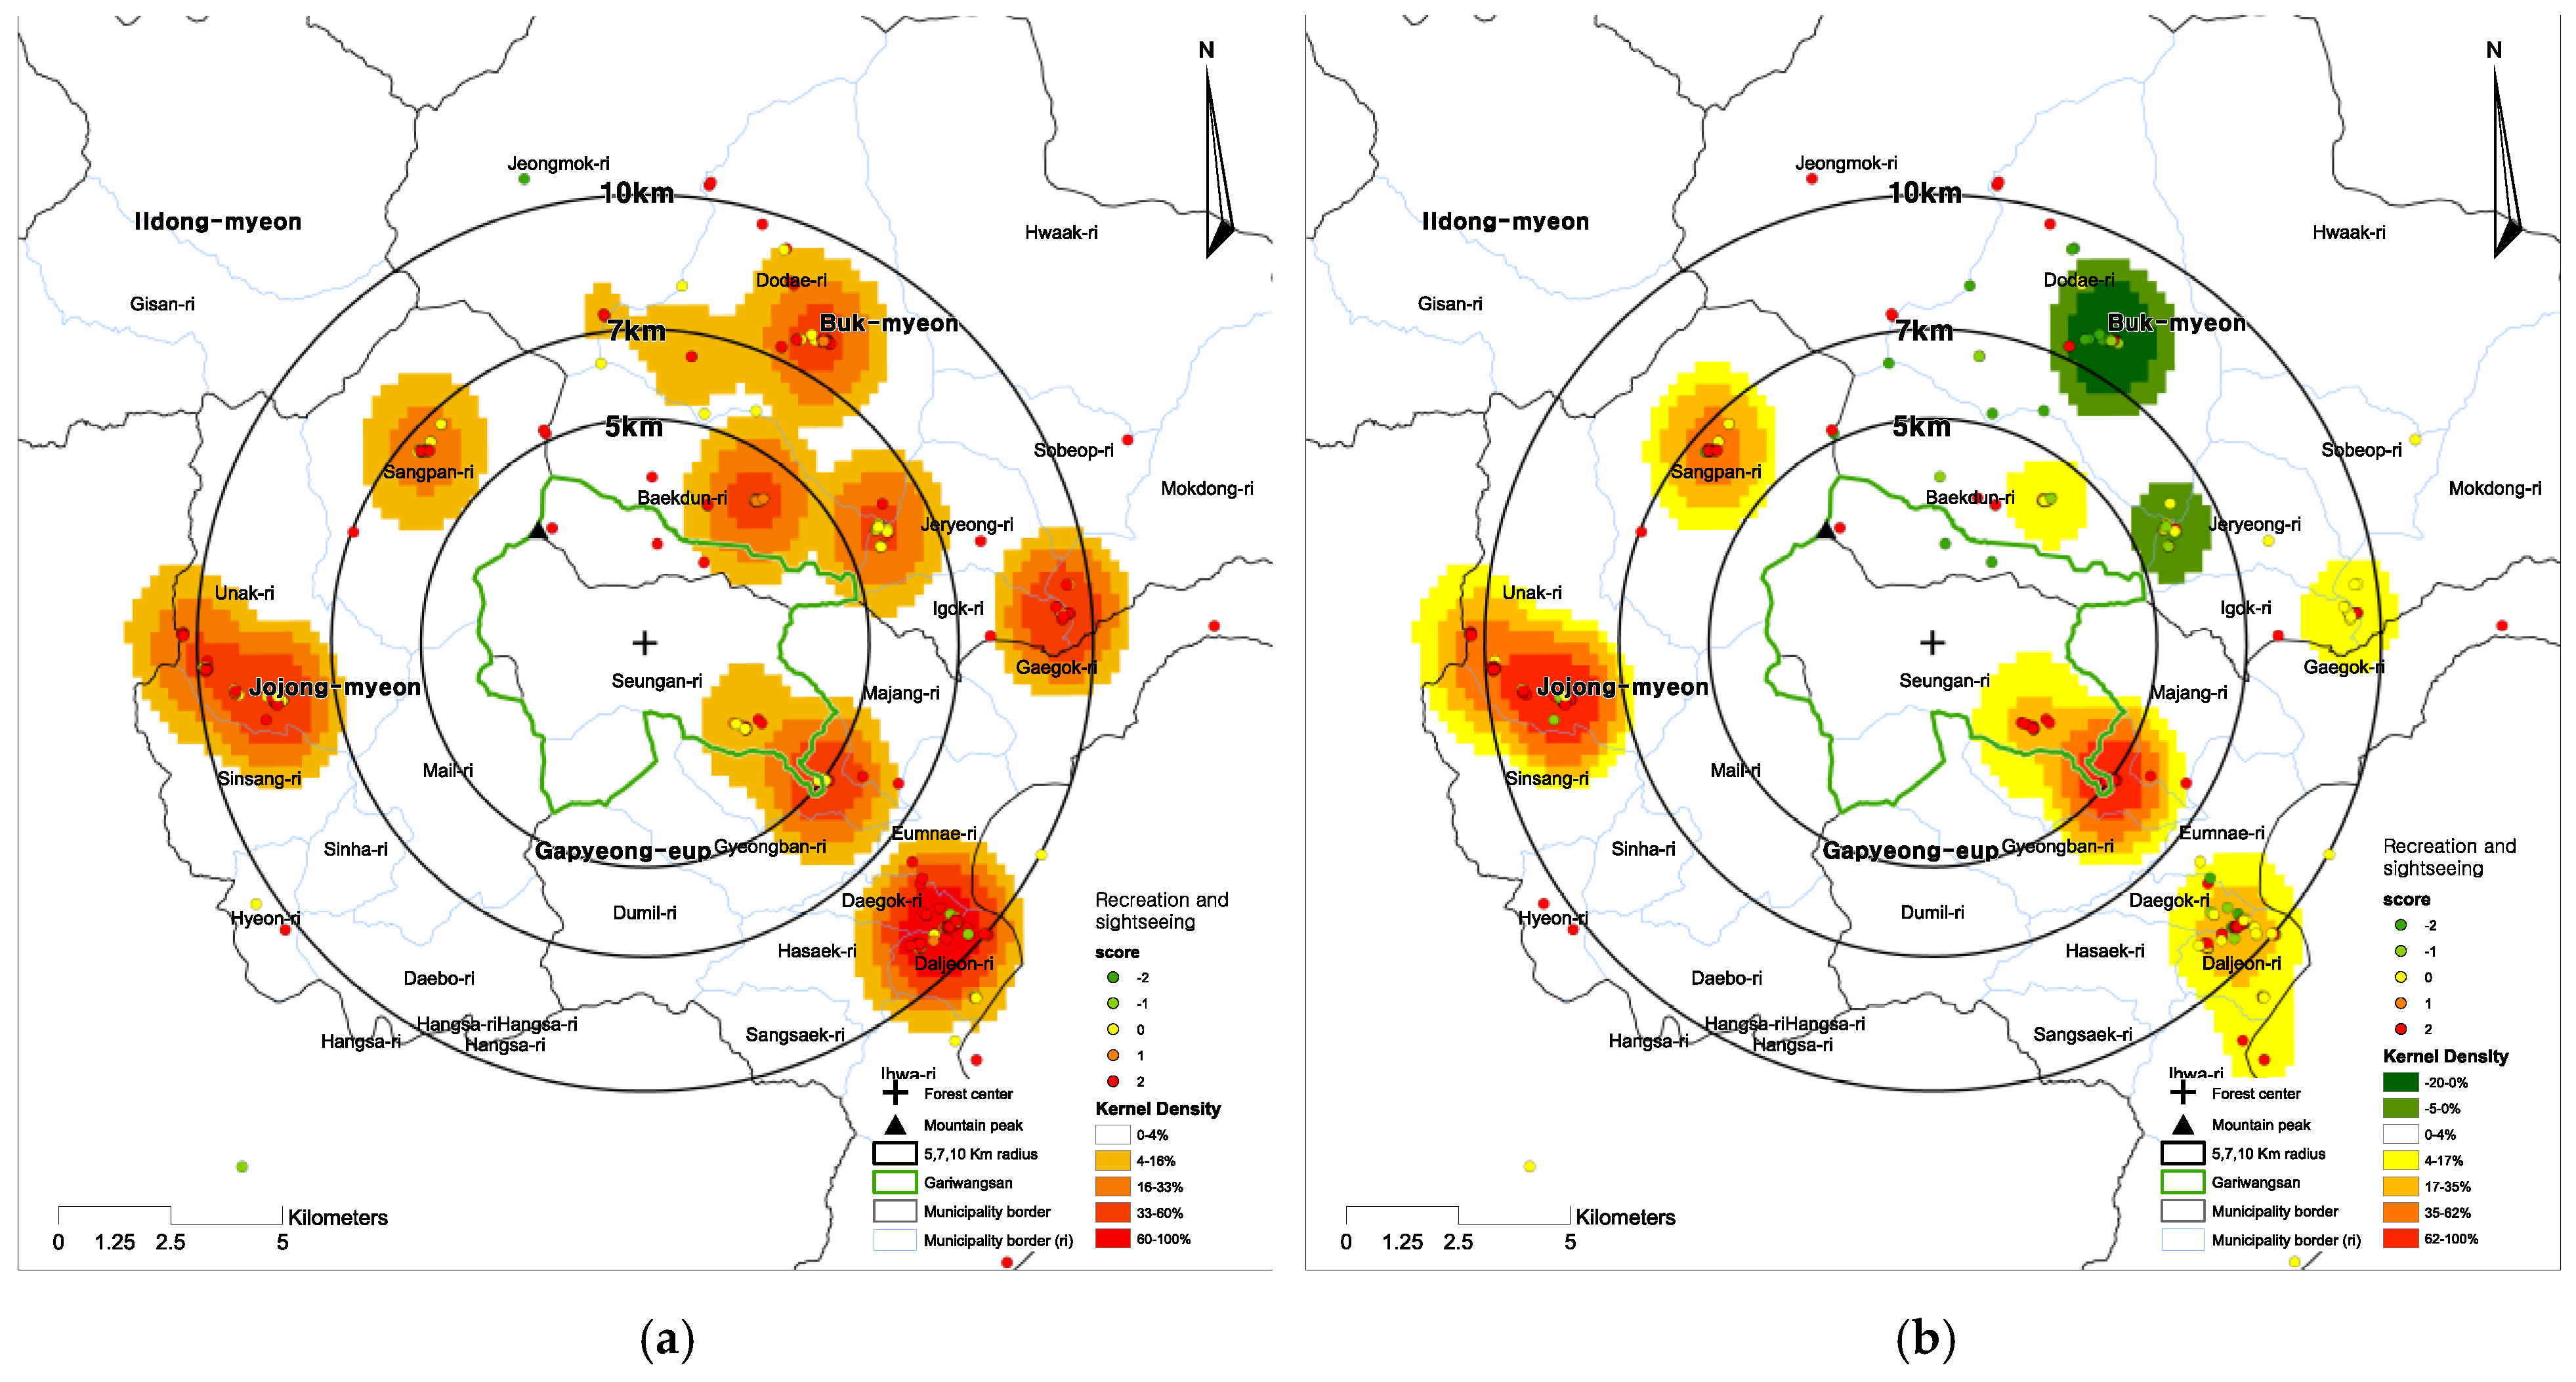
3.2.2. Sentiment Analysis Mapping

Total cumulative sentiment scores of Gariwangsan and Yeoninsan, based on a sentiment dictionary and the text acquired from blogs and social media, are shown in Figure 8a,b. The total positive and negative scores of each sentiment score of the demand for Gariwangsan is listed in an order of ranking from the best to the worst (Figure 8a and Table 5).
Due to the nature of the blogs and social media, the number of articles on the demand for recreation tourism is the highest. Hence, it was ranked at the top, and the demand for air quality improvement and water quality control was high, because hikers and campers frequently mentioned the air quality. In the case of water quality control, it was ranked third due to the frequent mention of garbage collection and its management, cleaning, and public toilet maintenance in and around the valley of Gariwangsan. In the case of recreational and sightseeing demands, these sentiments were ranked the highest in both the positive and negative categories at the same time. While the positives had to do with joyful activities, such as paragliding, ziplining, rafting, visiting cattle farms, etc., the negatives were attributed to factors such as the uncooperative attitudes of tourists, garbage dumping, lack of management for restored wastelands, and steep slopes in hiking trails.
In addition, Yeoninsan’s sentiment score graph can be used to identify the total positive and negative scores of each sentiment and the total cumulative score (Figure 8b and Table 6). The ranking according to the total combined score of the demand for Yeoninsan in the order of decreasing priority is as follows: recreation and sightseeing, water resource supply, biodiversity improvement, erosion control, and finally, education about nature. Recreation and sightseeing appeared the highest because of the nature of internet blogs and social media; the majority of articles on the internet are about tourism. The water resource supply was ranked high because of a positive response to the use of valley water in experience-based tourism, such as temple stays. When comparing the positive and negative scores to the total score, positive words ranked seventh for the forest product supply, but the final total score was eighth because of the high frequency of negative sentiments. Many negative aspects of education about nature (which includes rural experiences and museum visits) also seemed to exist because of tourists collecting forest products without permission, families with children damaging native plants, and people drinking alcohol and causing noise in the forest region.
The point vectors on the maps represent the locations obtained through web crawling, and the closer it gets to green, the sentiment score falls under zero, hence referring to a negative sentiment, whereas the closer it gets to red, the score rises above zero, hence meaning a positive sentiment (Figure 9a,b and Figure 10a,b). In the case of non-timber forest products in Yeoninsan, actions such as the collection and damage of wild plants in a no-collection zone are found to cause a negative perception of visitors (Figure 10b).

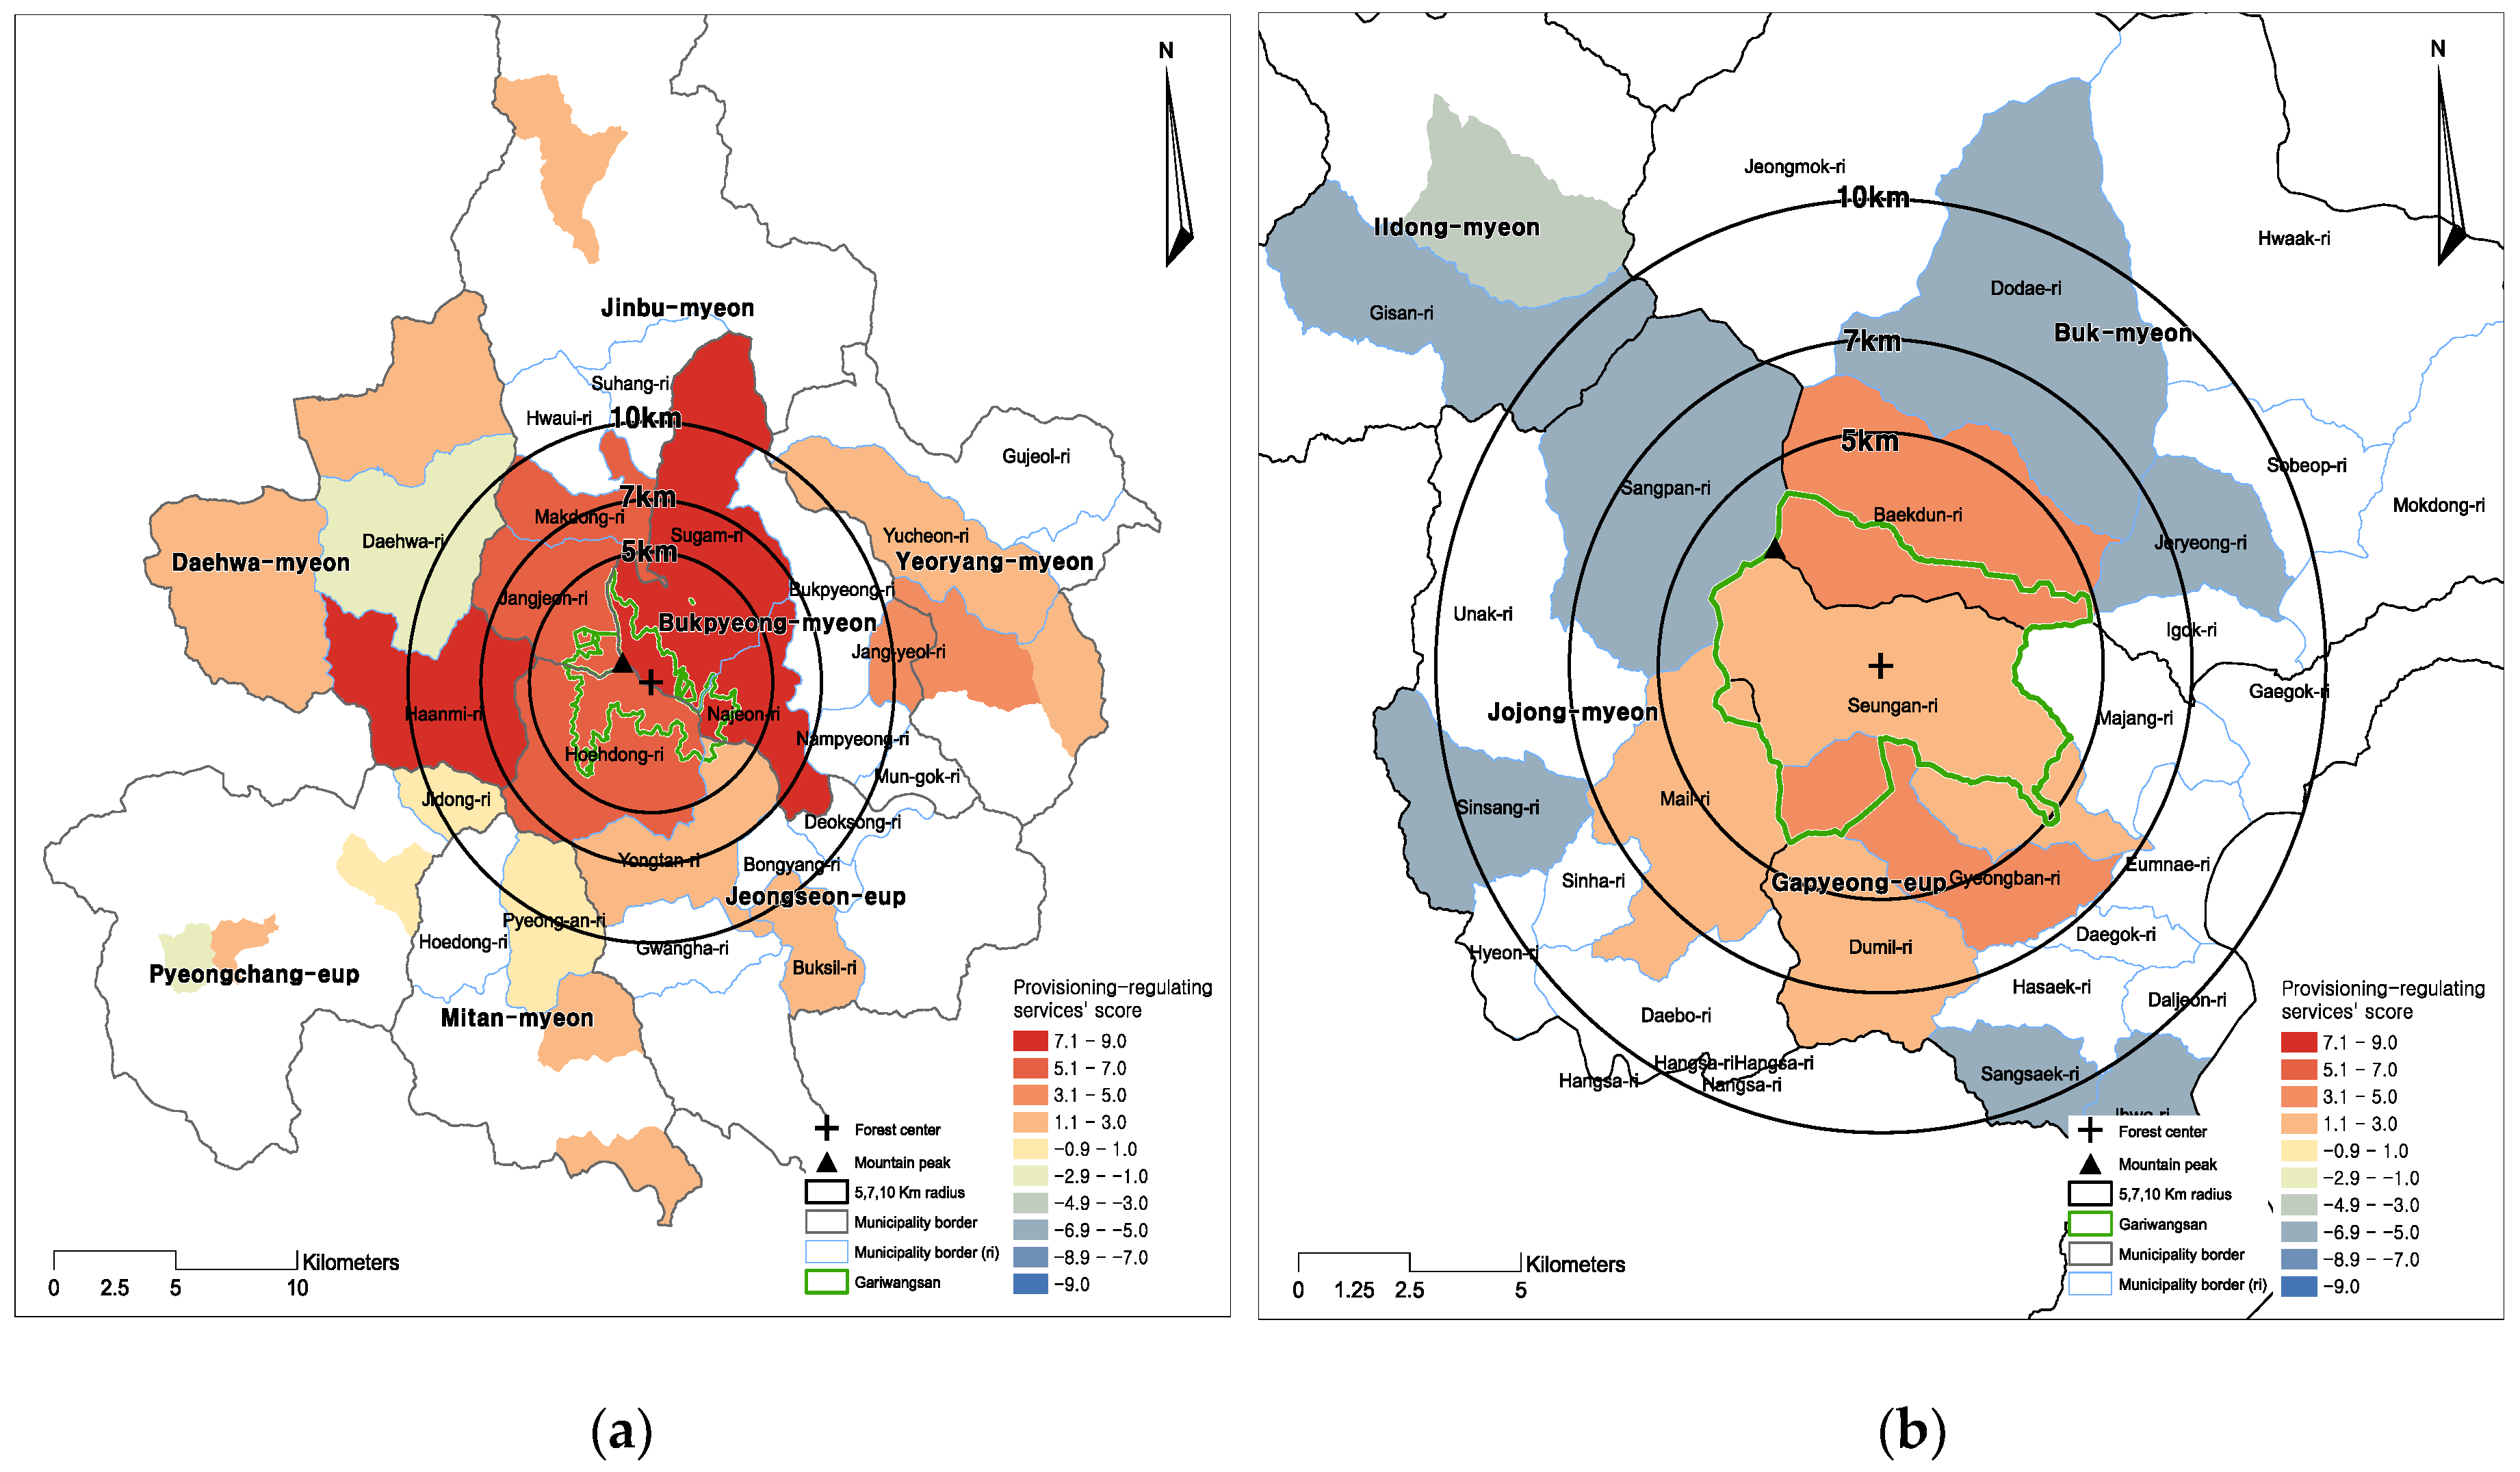
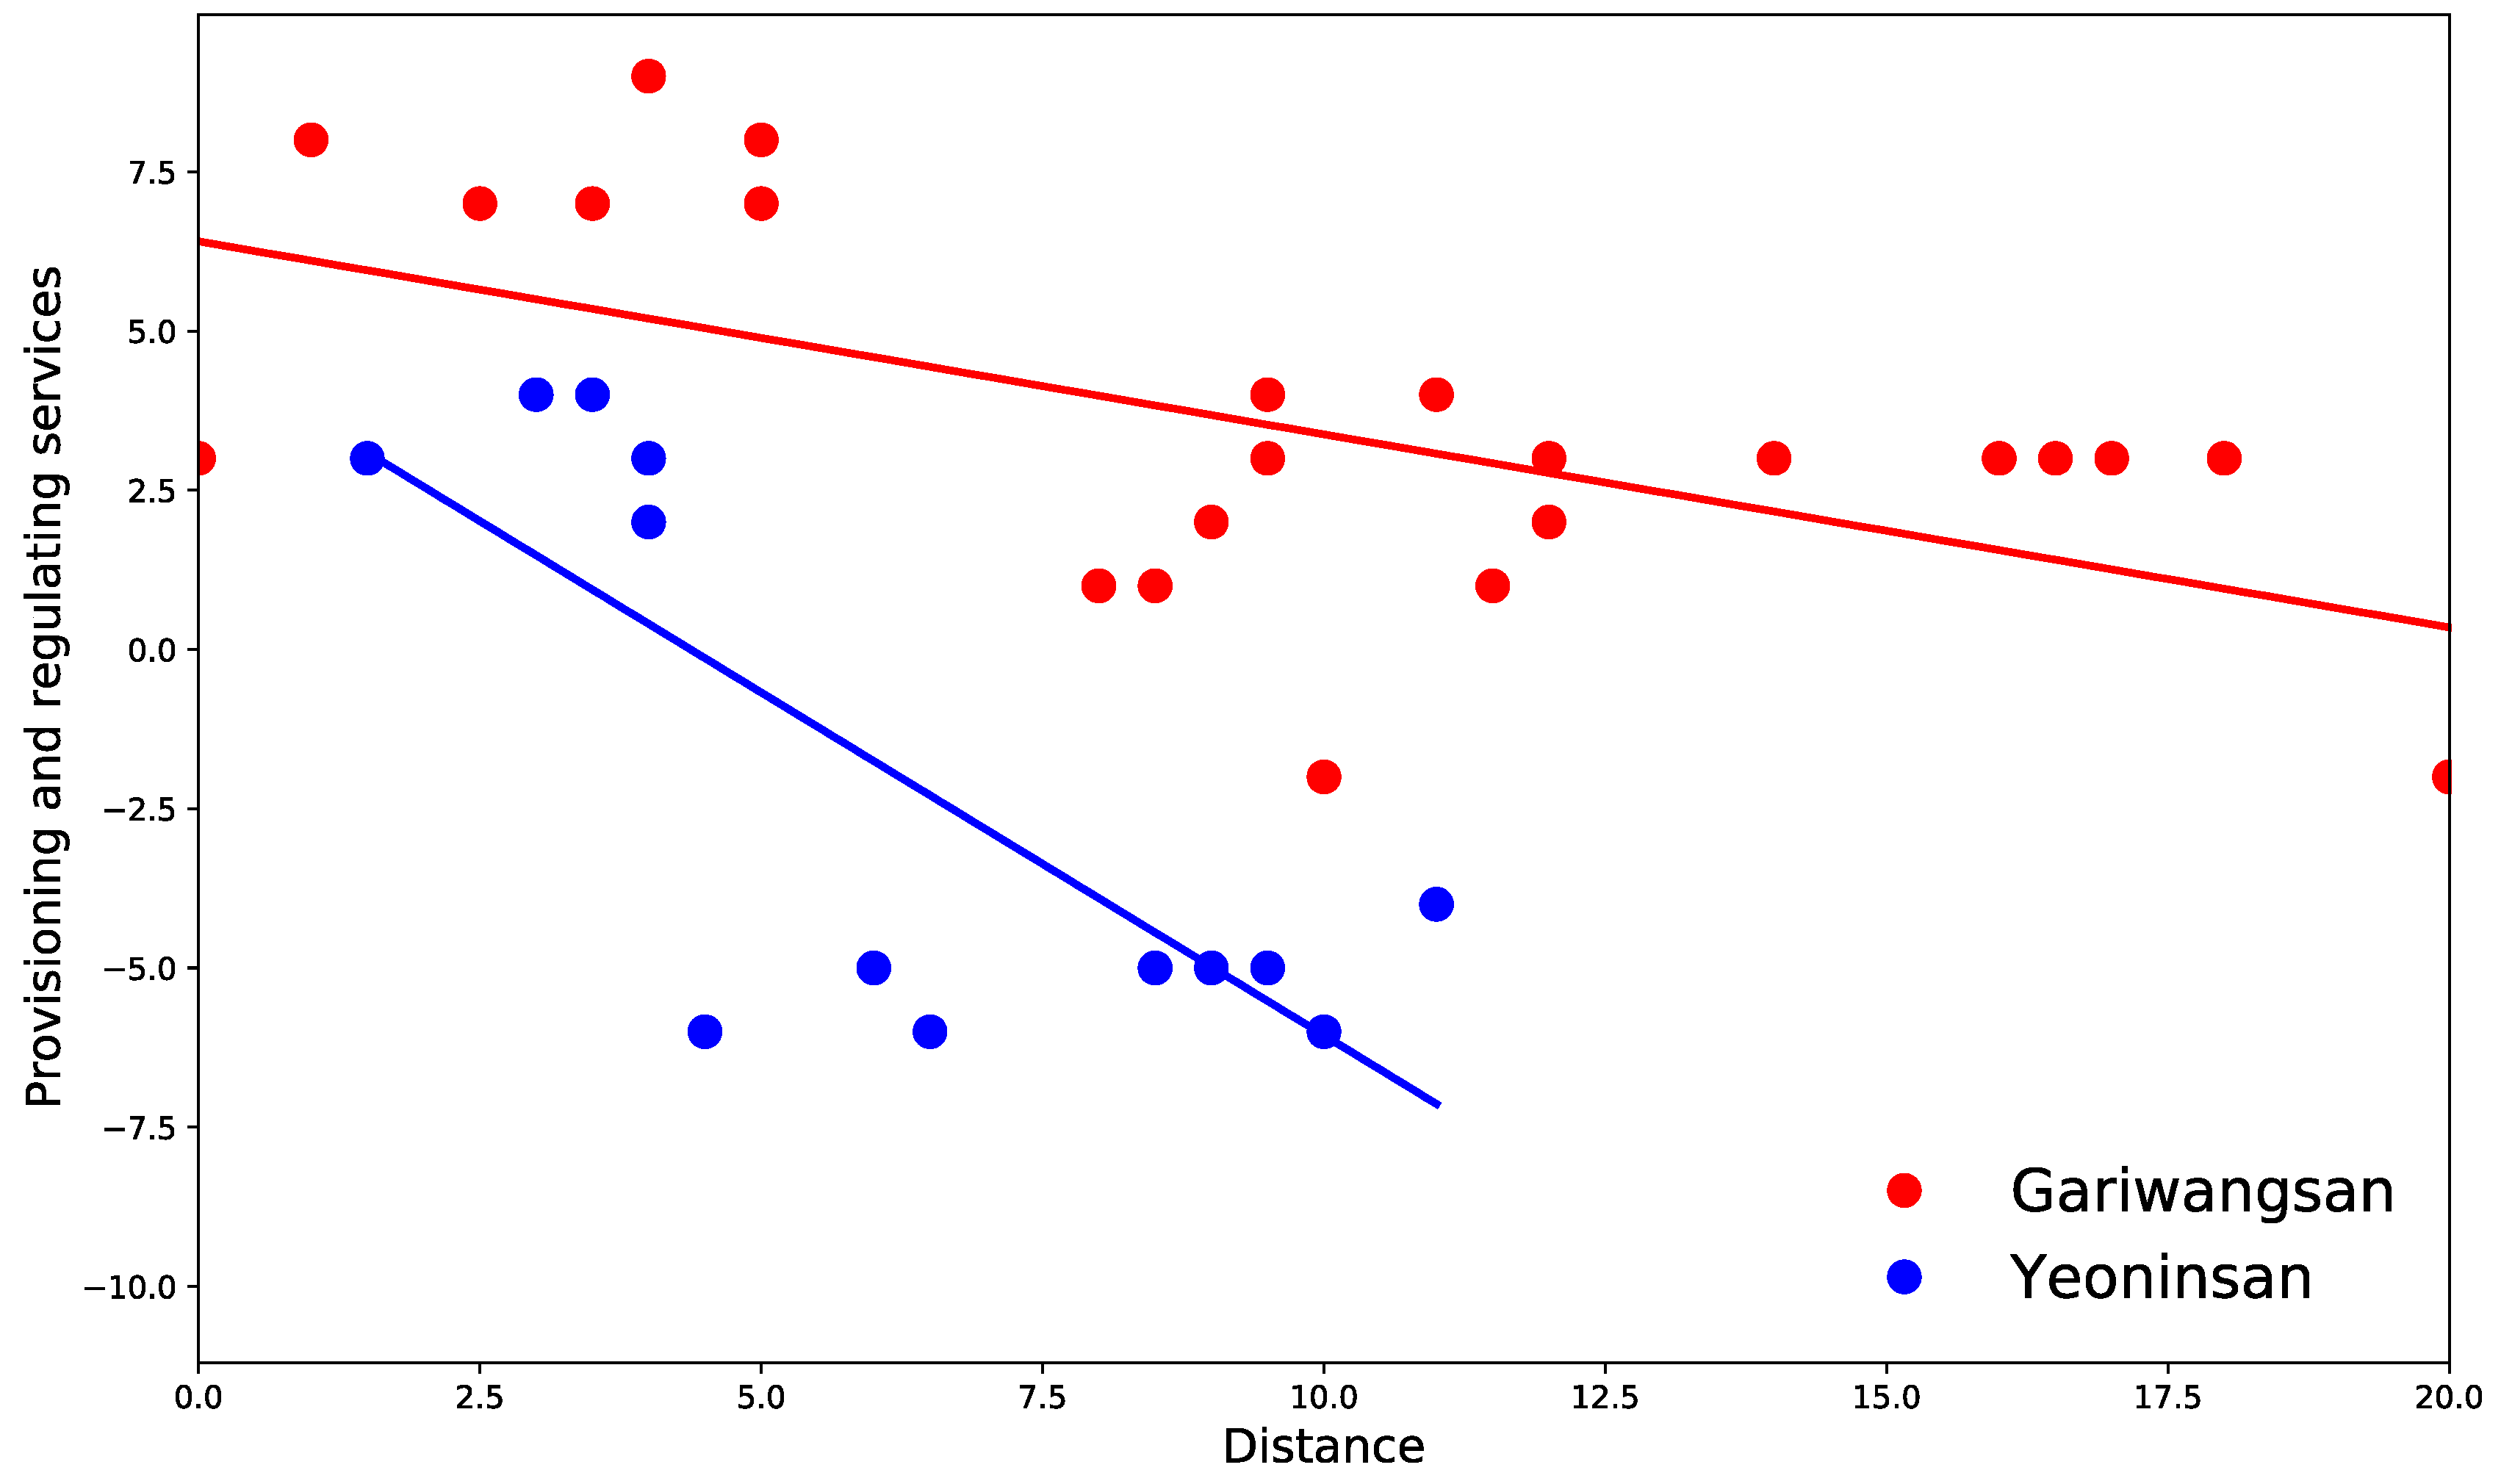
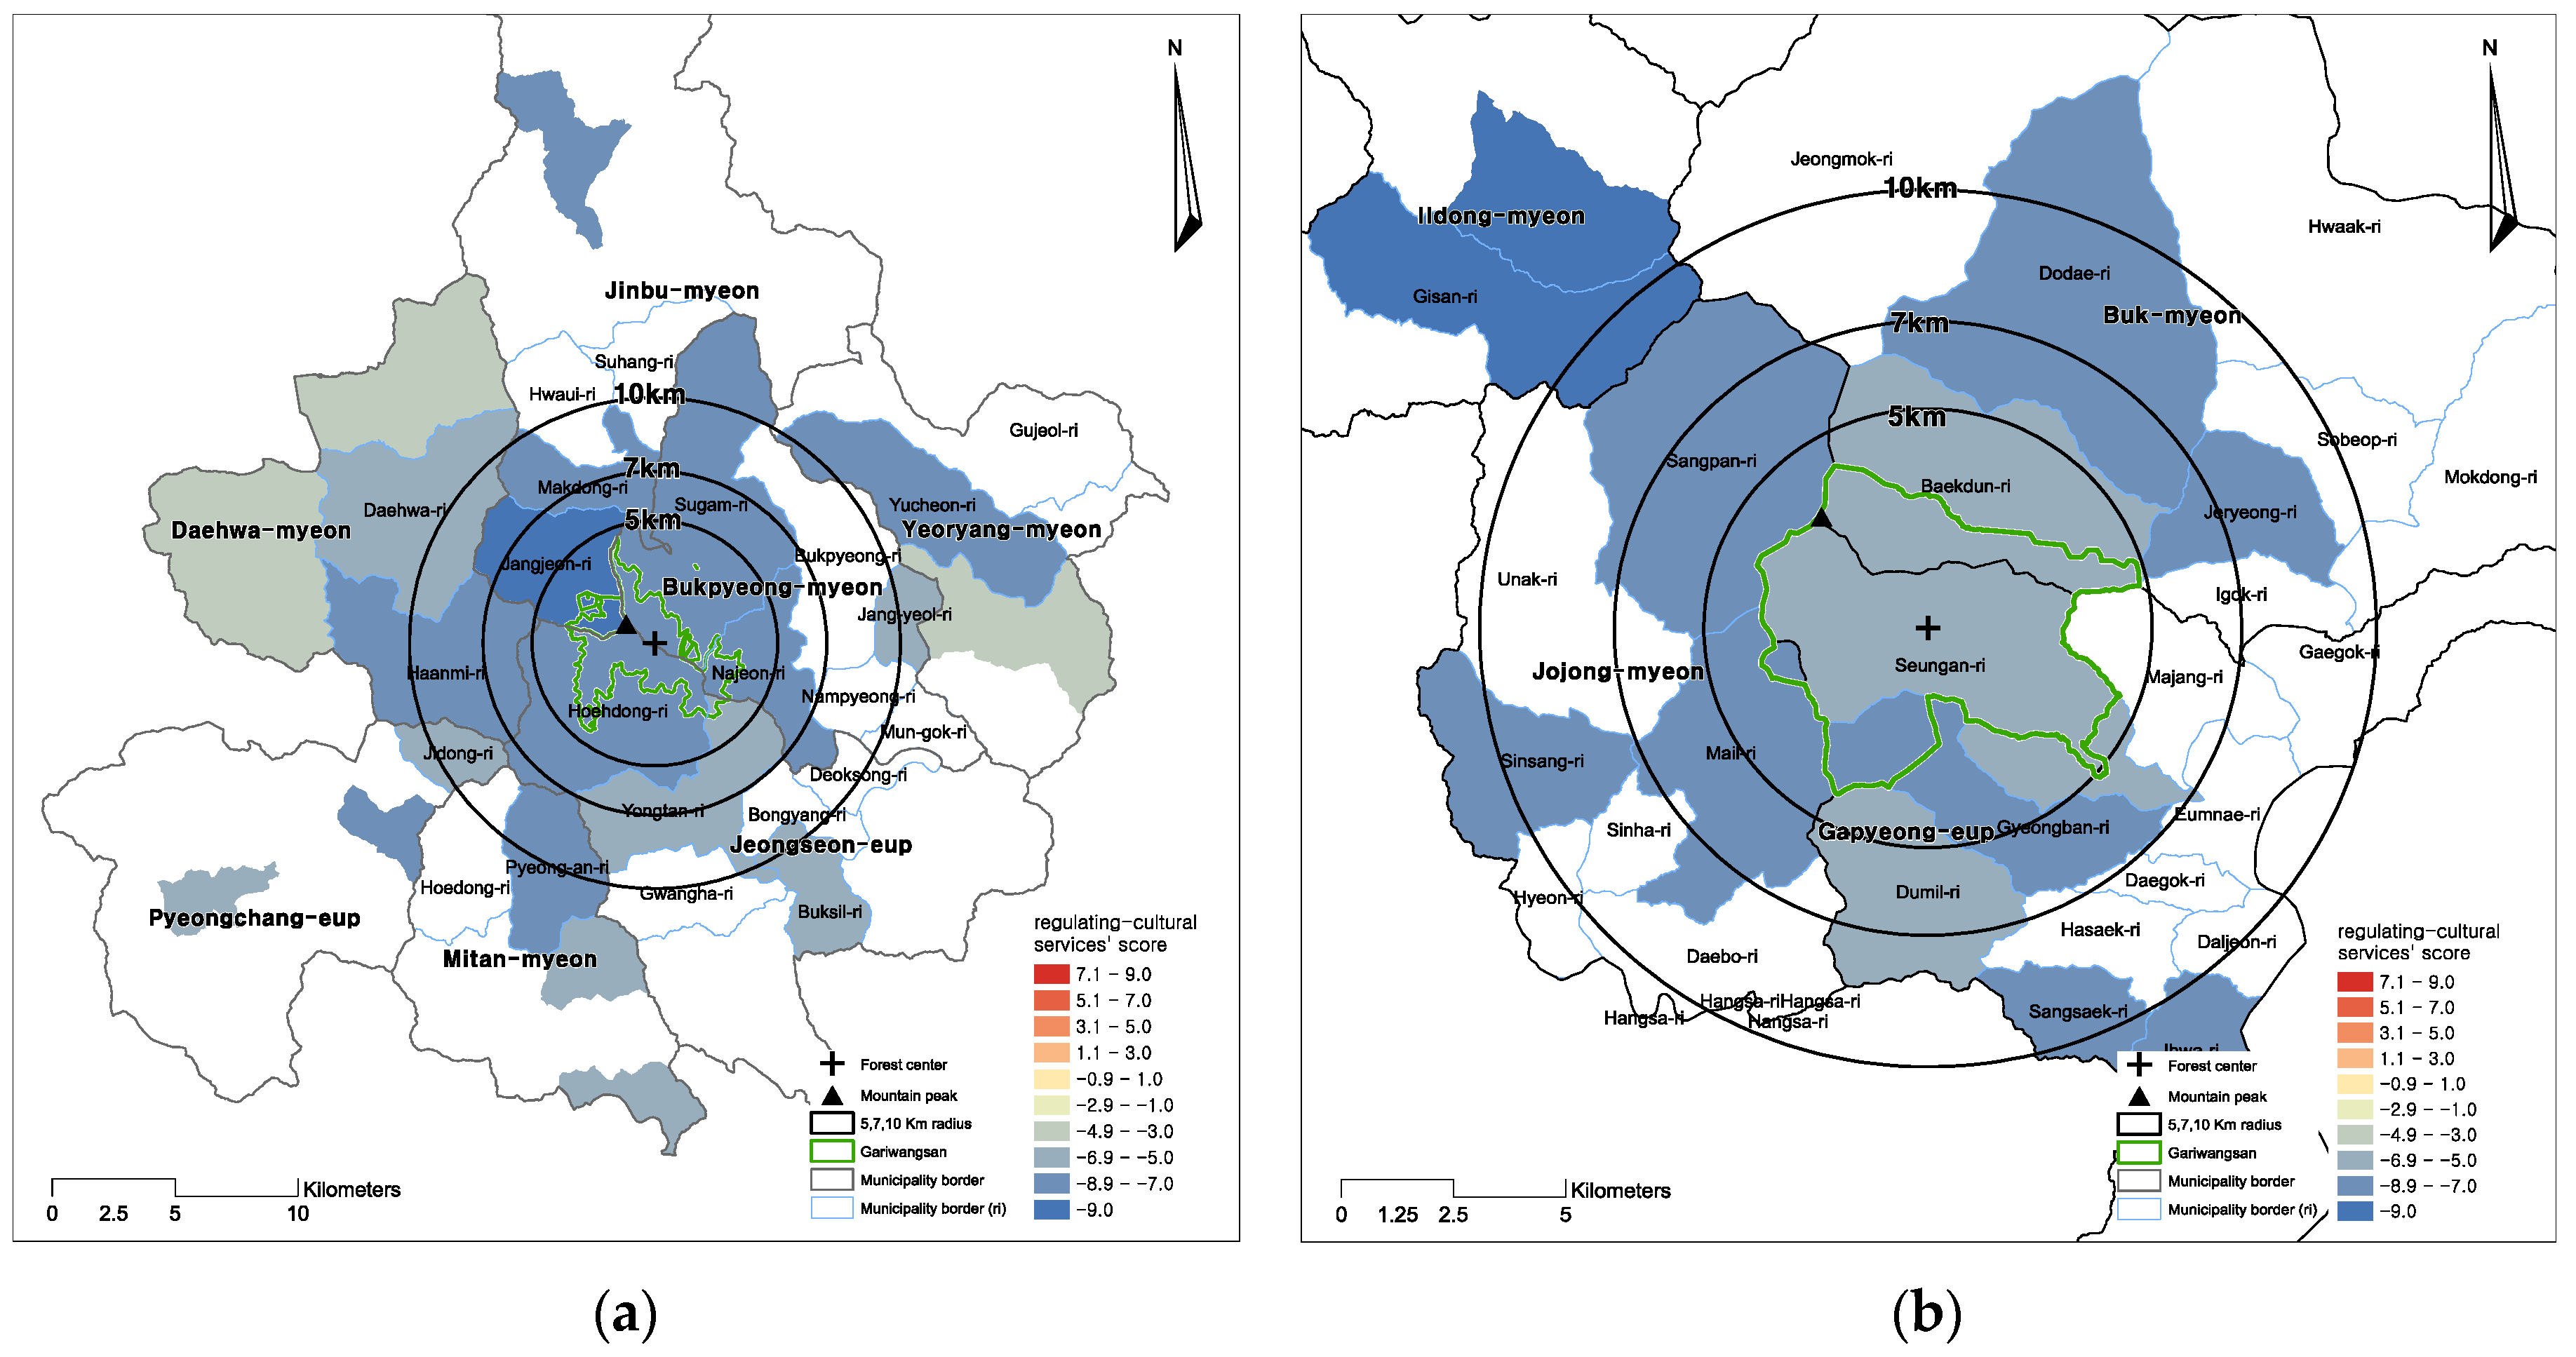
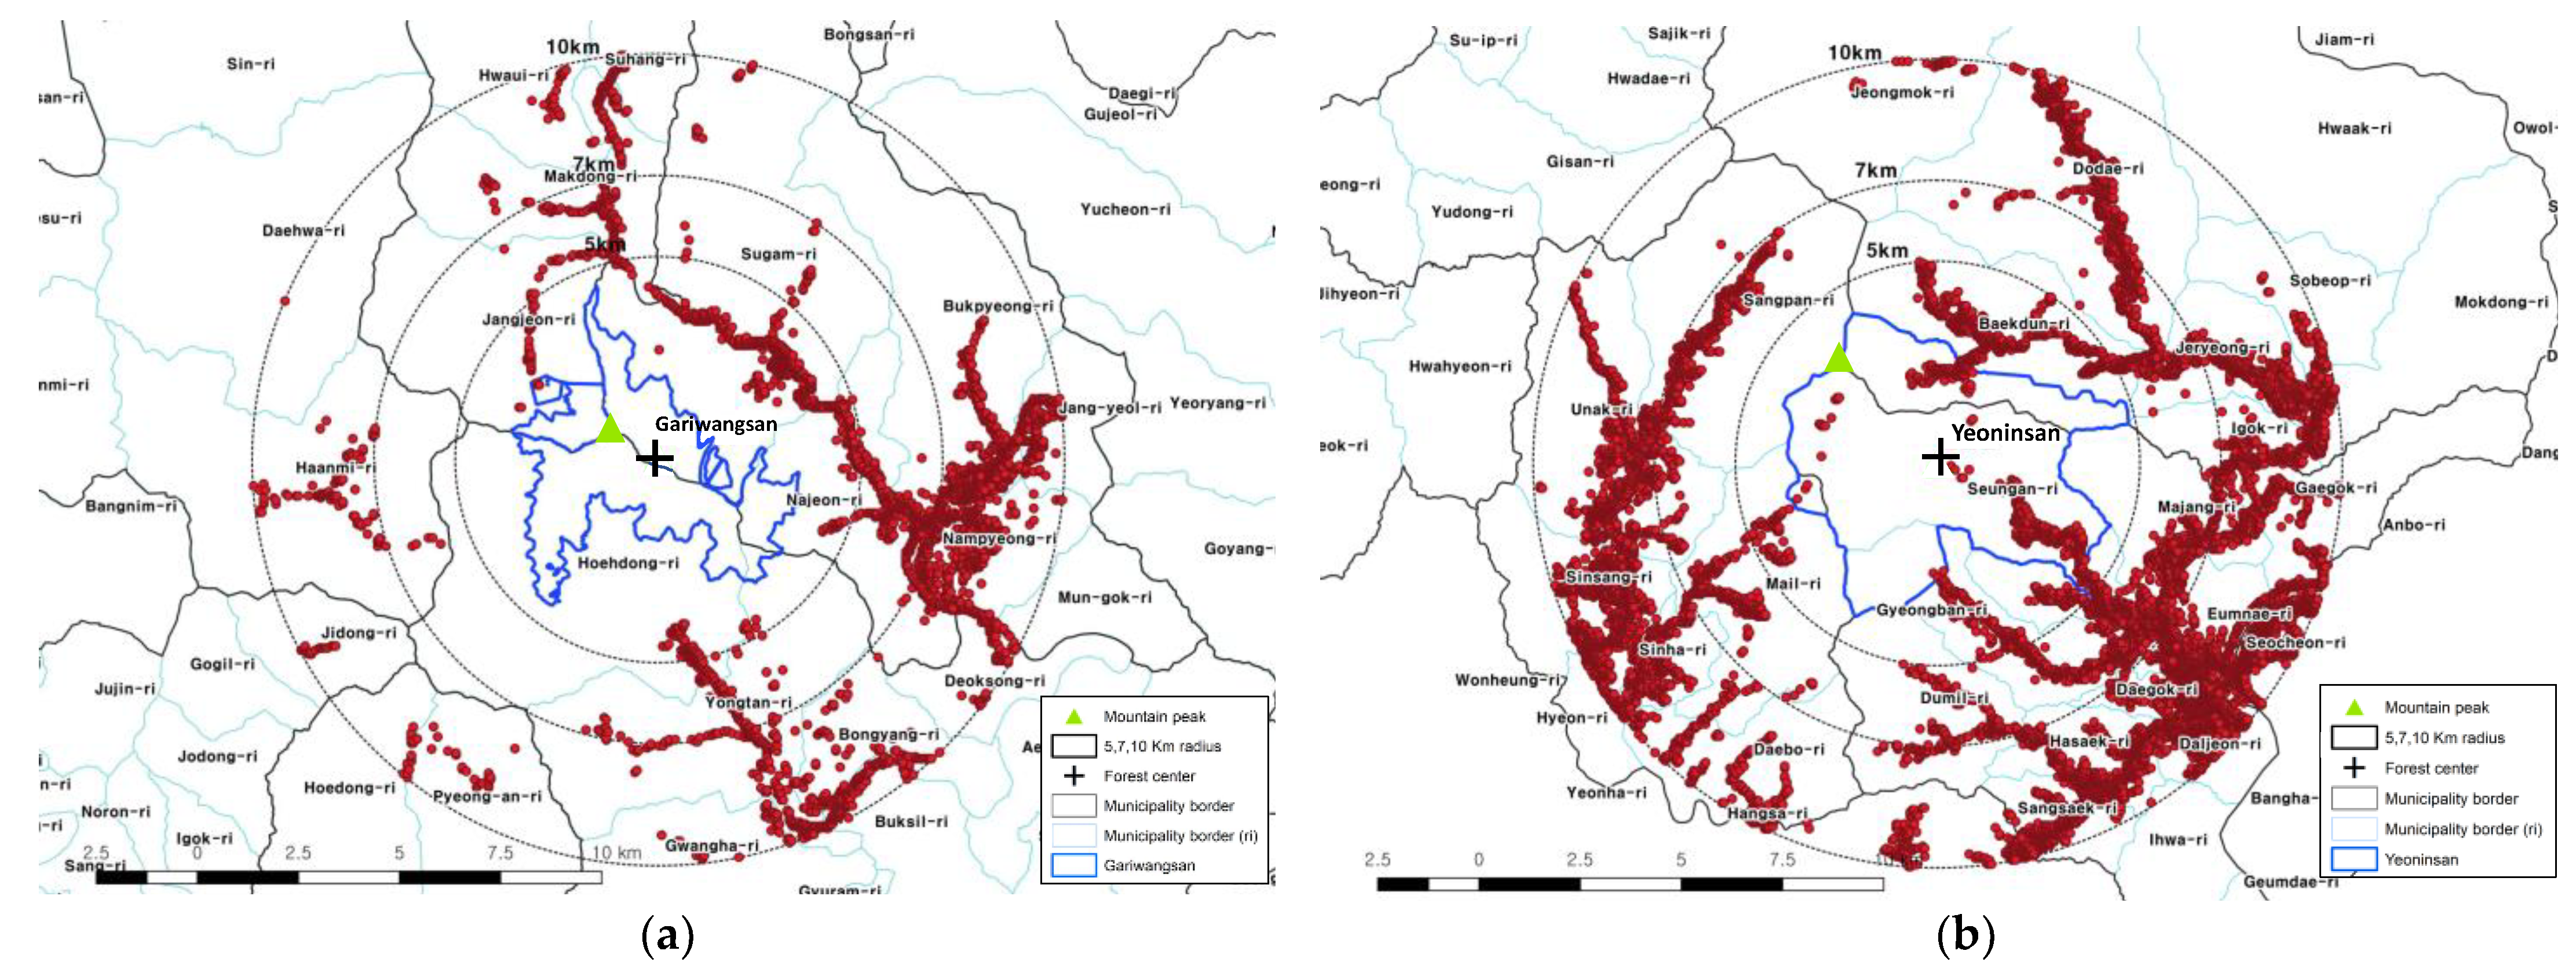
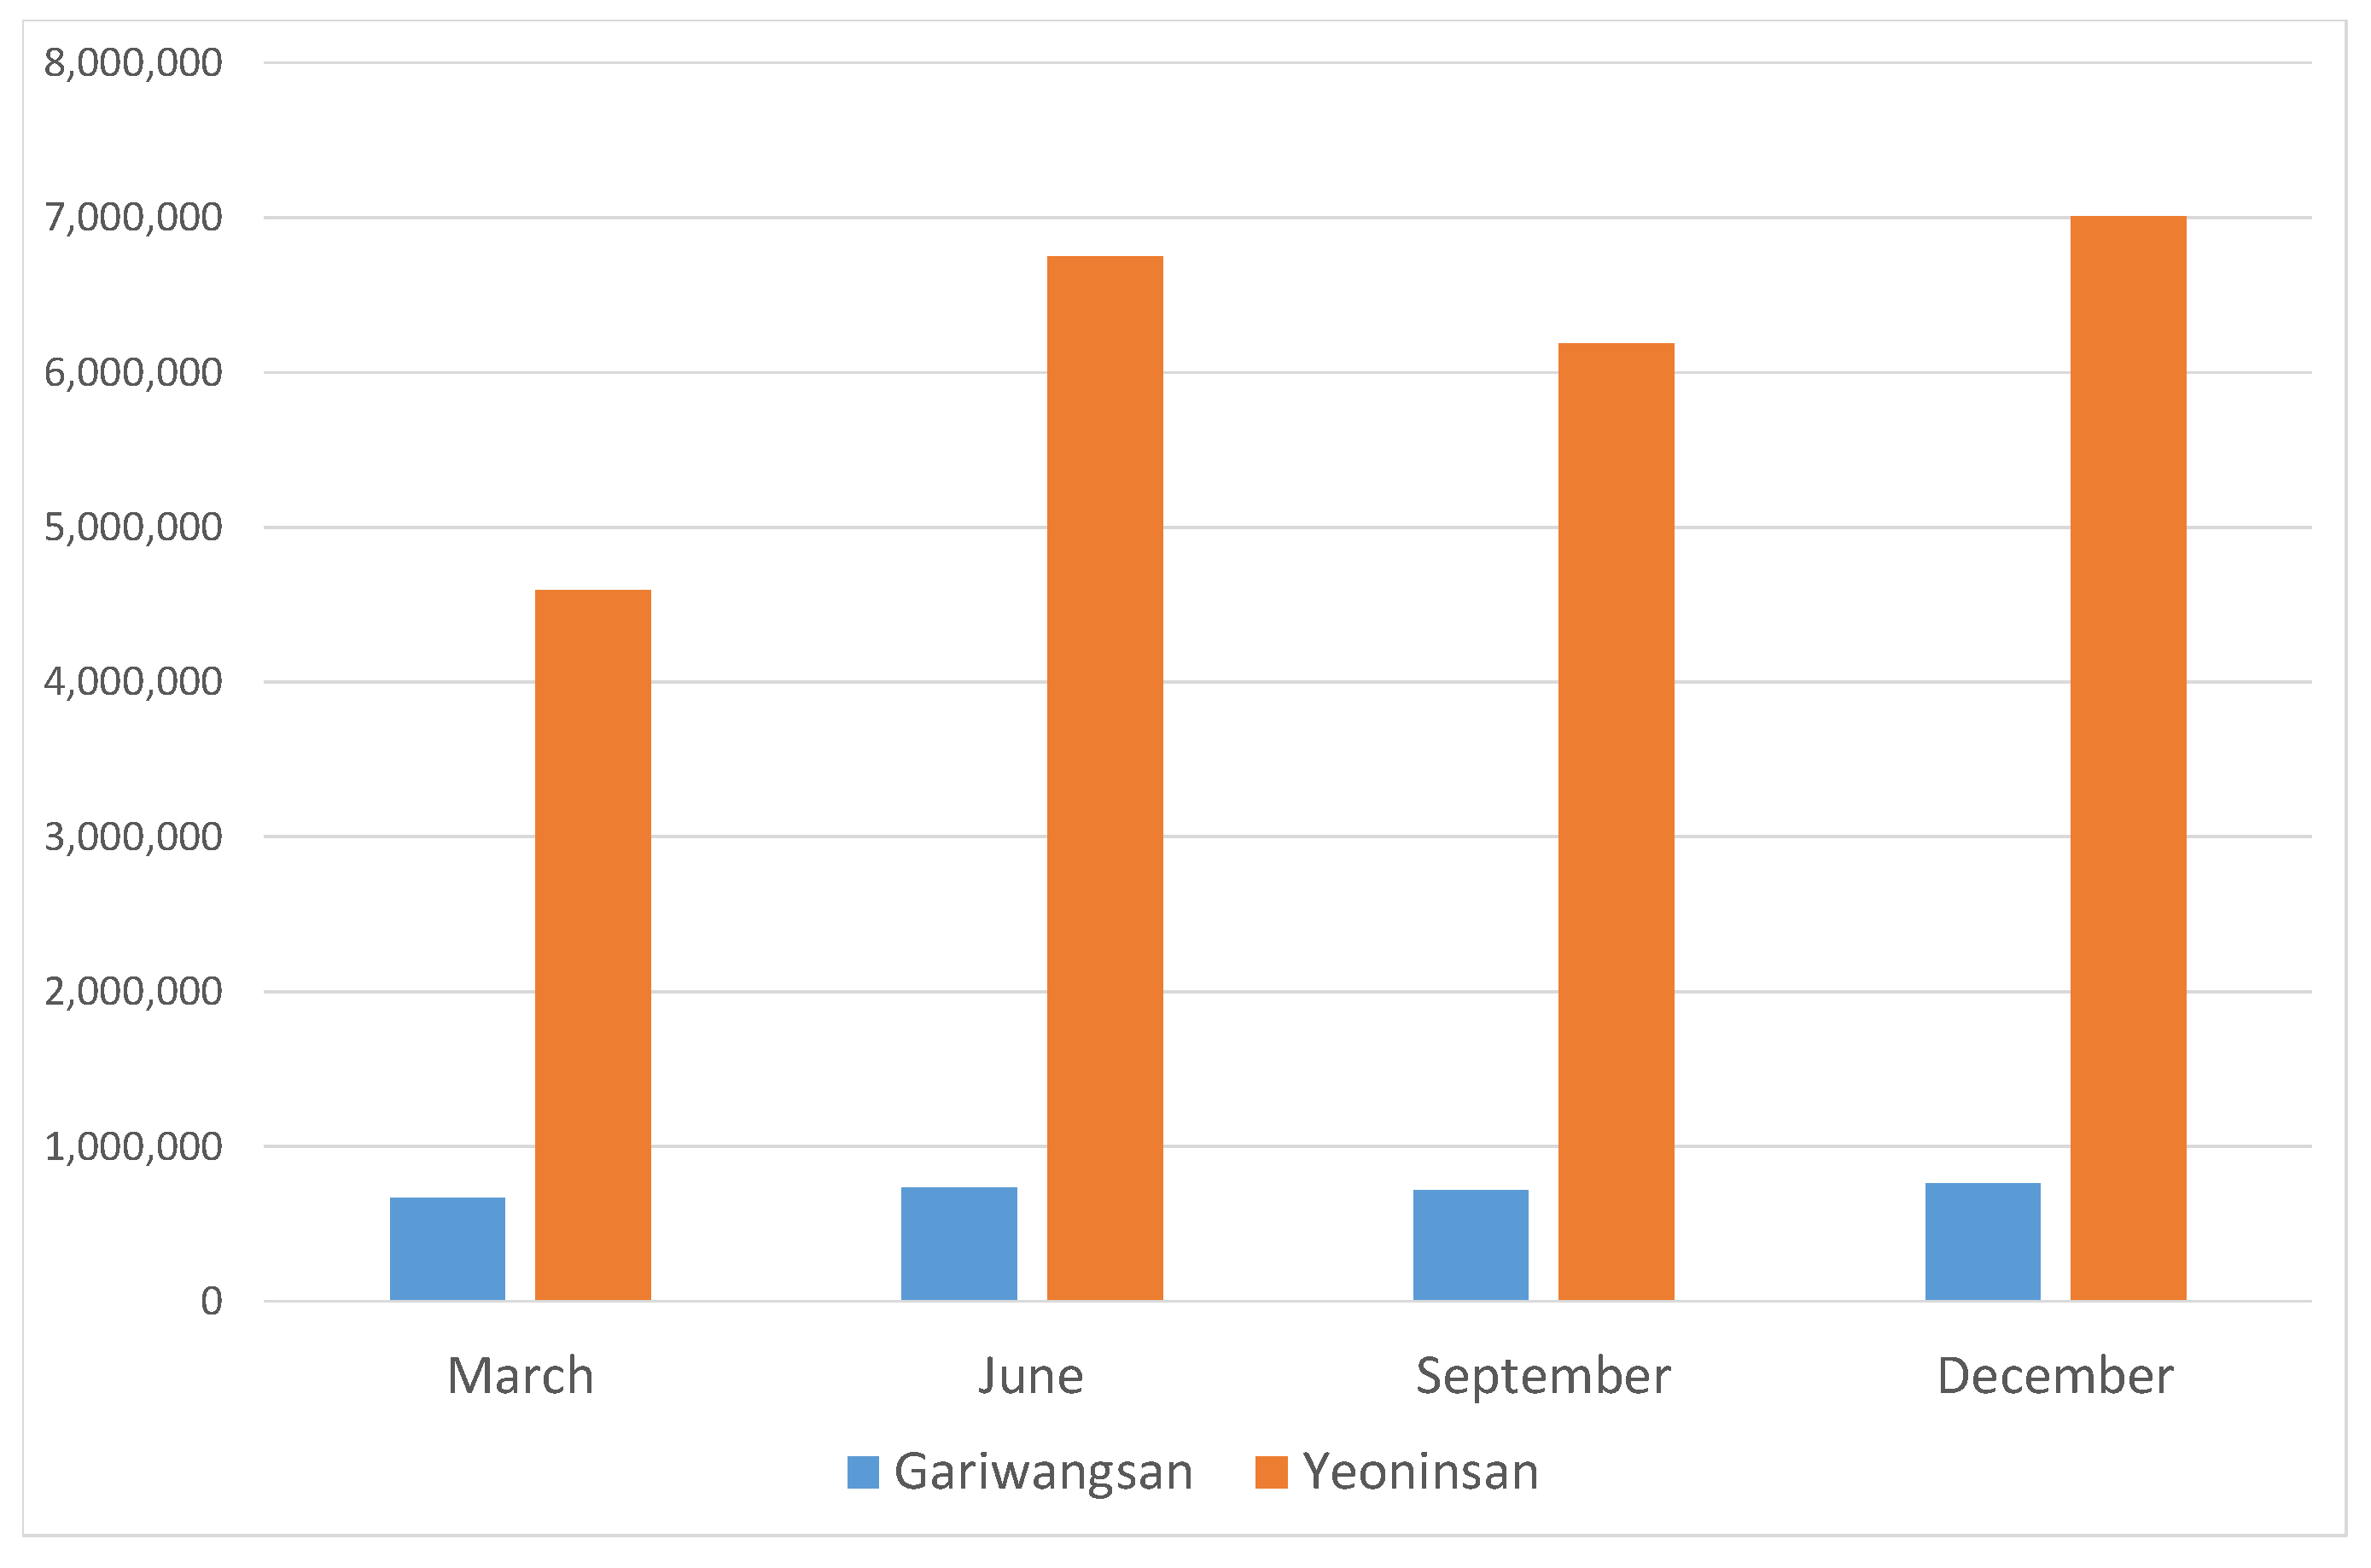
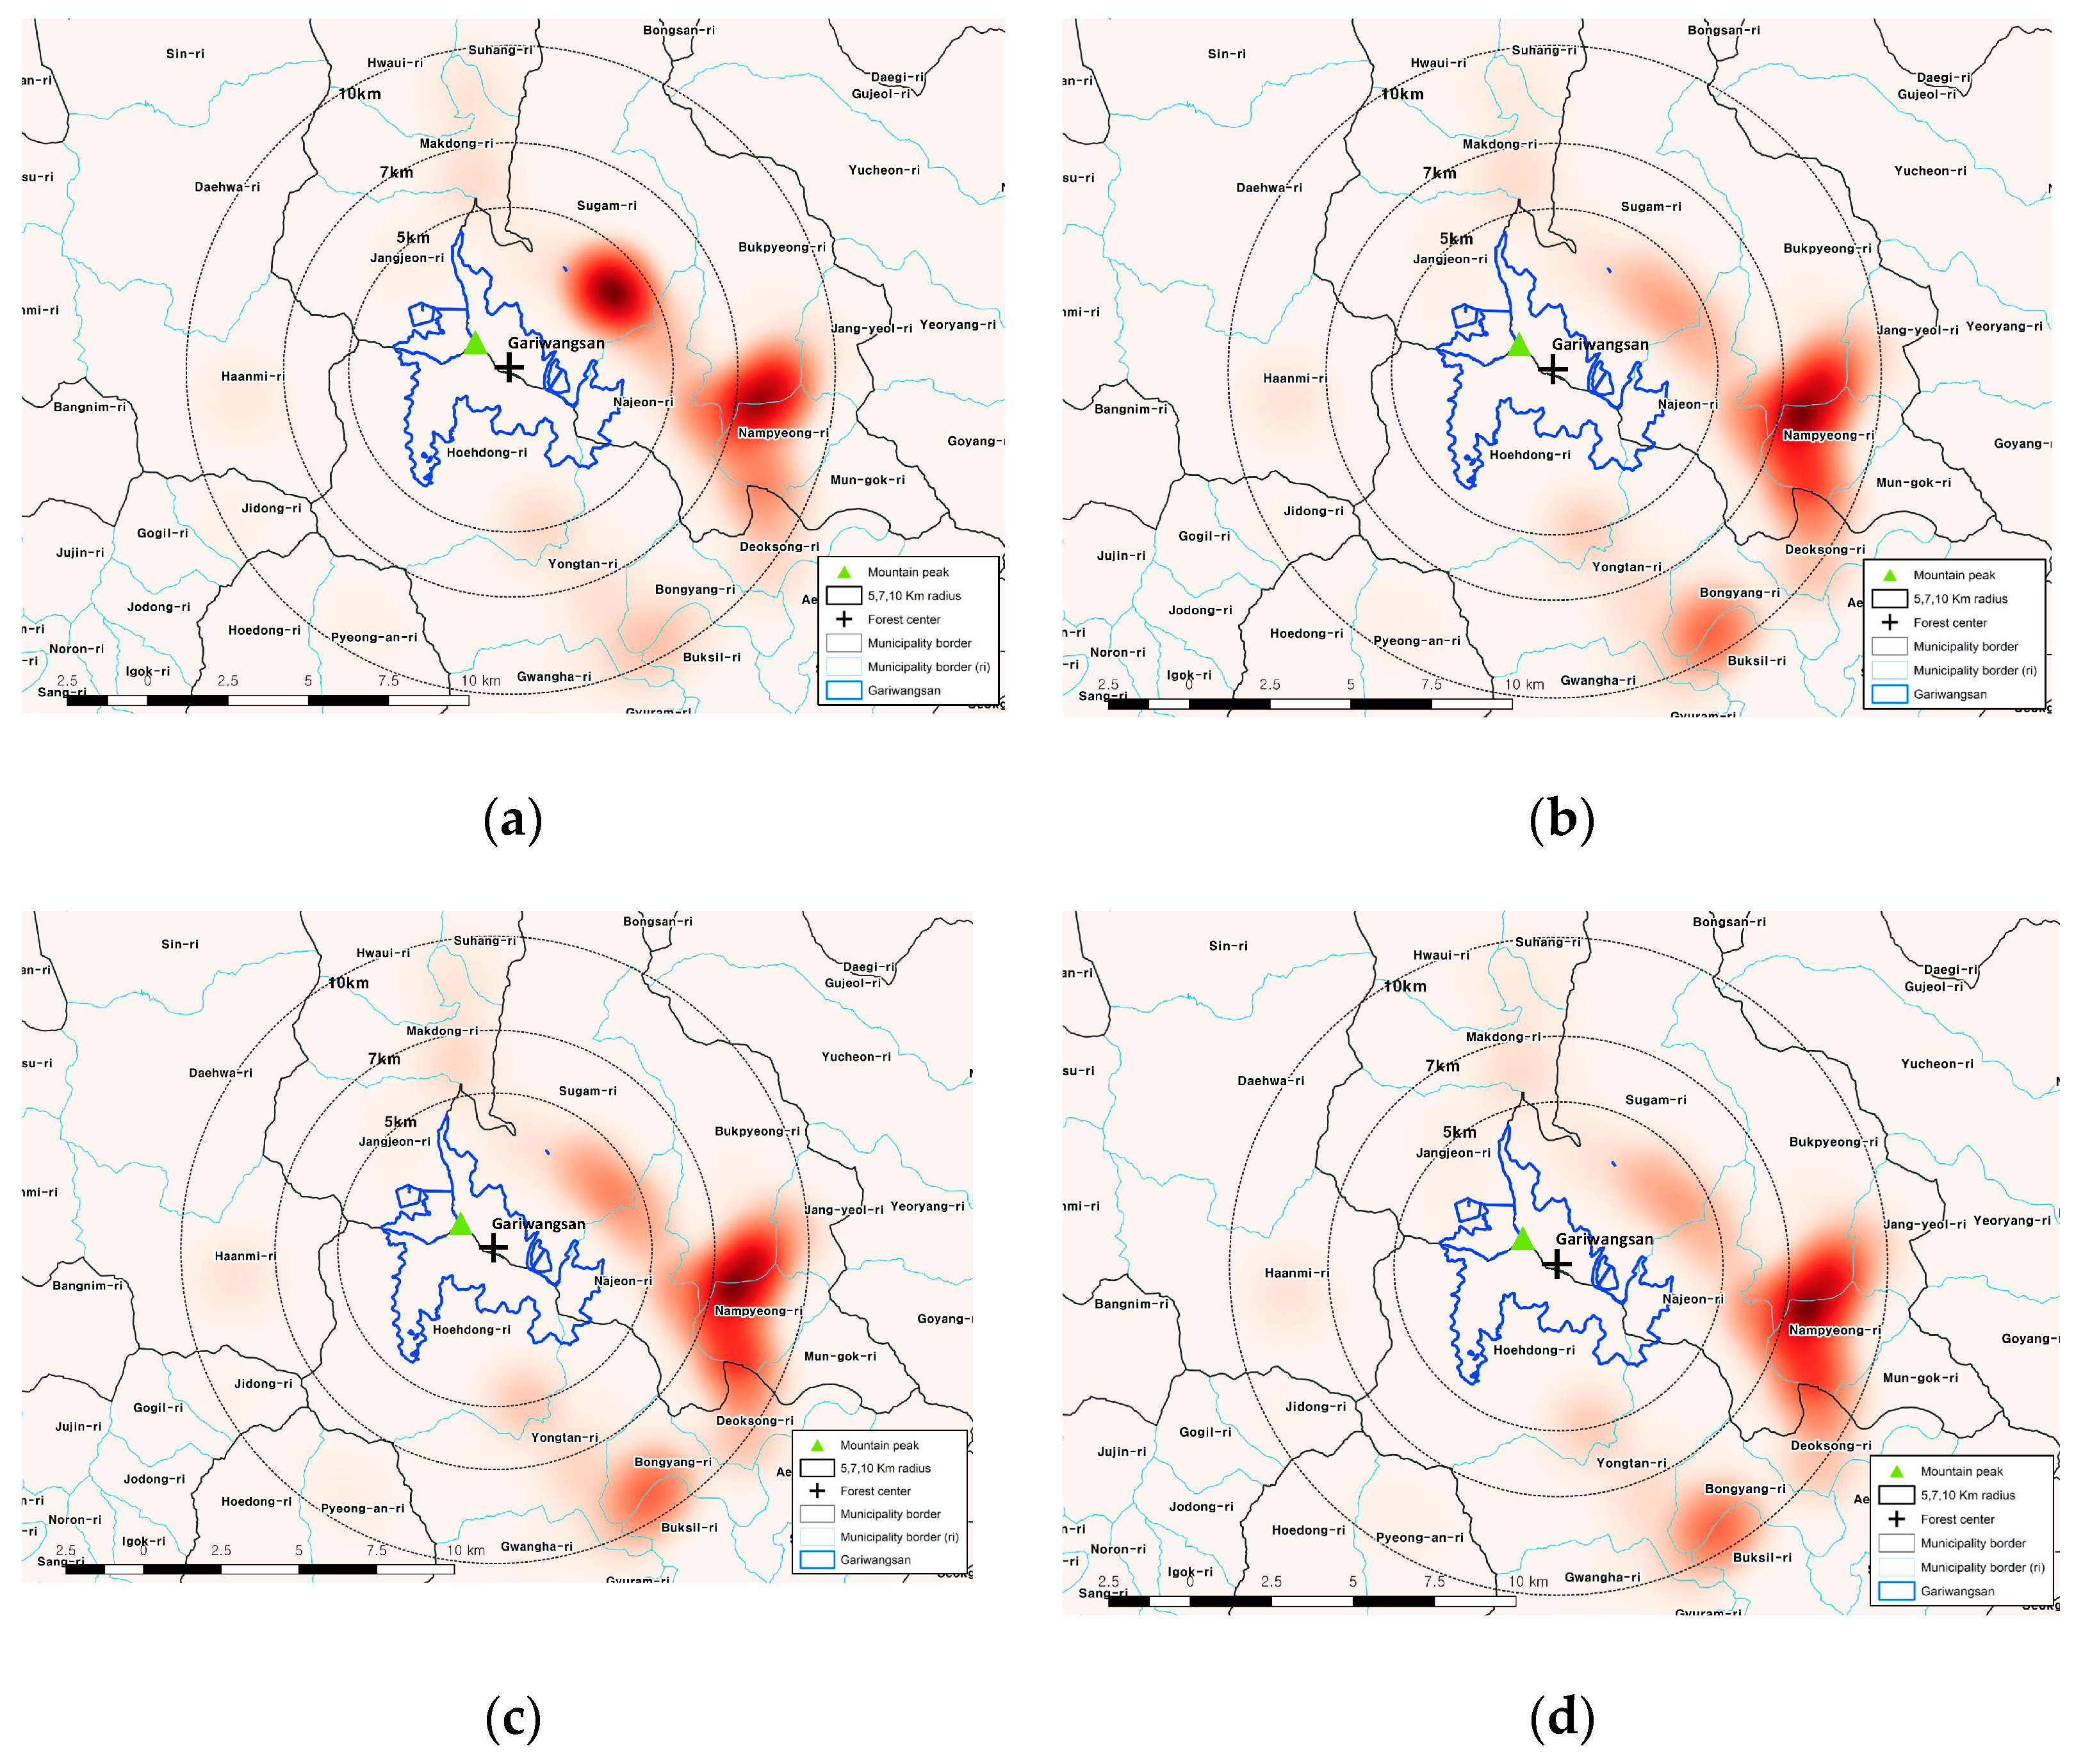
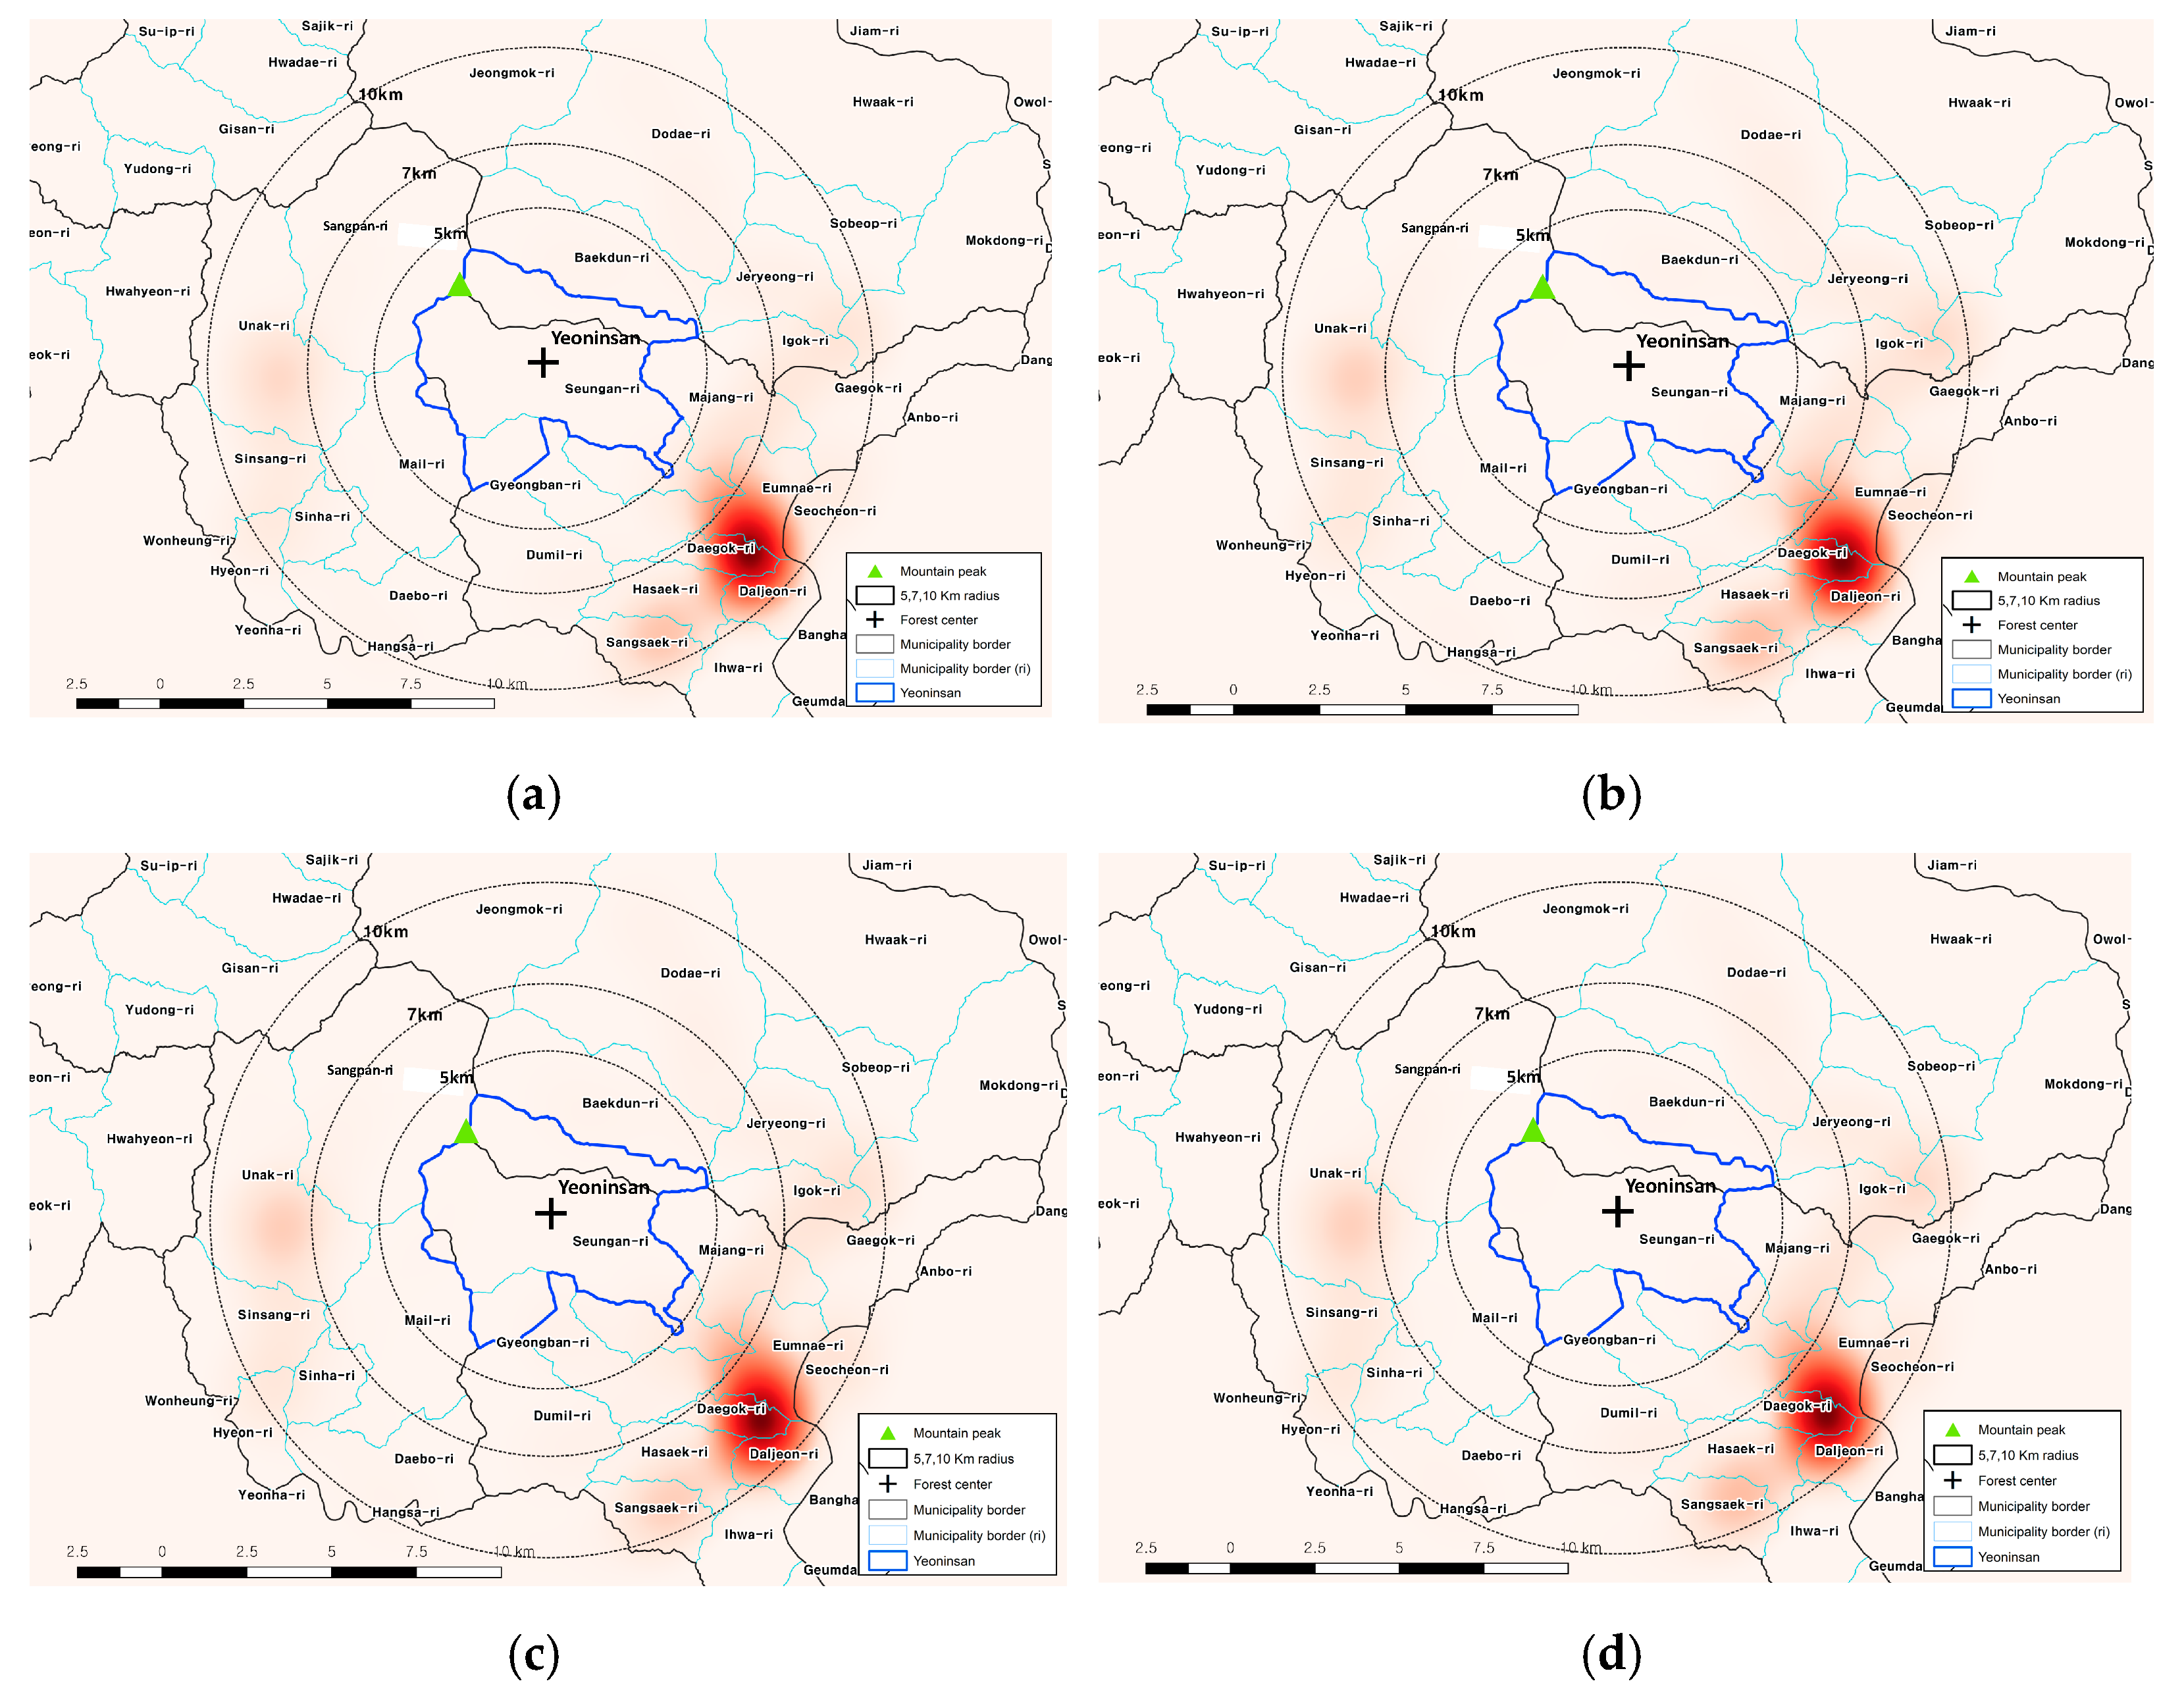
3.3. Floating Population Analysis

Figure 11a,b shows maps of the floating population within and near Gariwangsan and Yeoninsan, using data collected every three months from March 2018 to December 2019. It is an aggregation of the floating population within 10 km from the center of Gariwangsan and Yeoninsan, where the maps show that the floating populations are mainly distributed along with the water bodies, such as rivers and valley streams. This suggests that the distribution of the floating population is concentrated mainly in mountainous areas and valleys for tourism purposes.
Figure 12 shows the floating population sizes for each forest; as the graph shows, the total floating population of Yeoninsan is eight to nine times larger than that of Gariwangsan. This difference is reasonable, because Yeoninsan is closer to the capital of South Korea, hosting the largest population in the nation. Both forests had the largest floating population in December, followed by June, September, and March (Table 7).
The number of people who visited each forest in March, June, September, and December 2019 was accounted for and represented as a series of Kernel density maps showing the intensity of the ES demand each month. Figure 13a–d shows the areas of high demand intensity in Gariwangsan, where one can see the similarities in each month’s spatial patterns of the population concentration. In the case of Gariwangsan, the demand was concentrated in Nampyeong-ri, which is mainly due to the demand for various cultural ES such as Najeon Old Train Station, Sangwonsan Mountain, Ice Cave, and Odacheon Stream. In March, a high demand was seen in parts of Sookam-ri, which is largely due to the Pyeongchang Winter Olympics held from 9 to 25 February 2018 and the Paralympics from 9 to 18 March 2019.
Figure 14a–d exhibits the demand intensity of Yeoninsan, with no spatial change in the areas that experienced a high demand intensity between March and December. Intensive demands were found mainly in parts of Daegok-ri, Eupnae-ri, and Daljeon-ri; some in Unak-ri in the west; and Igok-ri and Majeong-ri in the east. That is, areas servicing cultural and regulating ES, such as valleys, holiday pensions, etc., were high in demand, similar to Gariwangsan. Moreover, Daegok-ri and Eupnae-ri are also located near downtown areas where they include the Gapyeong-gun Office and Gapyeong Train Station, resulting in drawing more people. Jaraseom River Island was formed by Gapyeongcheon Stream and Bukhangang River and considered the center of Gapyeong’s ES demand, because this island is a hotspot of various activities (Figure 14a–d). This is due to the development of mountainous areas and hotel accommodations in the upper stream of Gapyeongcheon Stream in the north and various cultural and tourism activities in the Bukhangang River in the south.
The characteristics indicating the strengths and weaknesses of the three approaches are summarized in Table 8. The main advantage of the AHP analysis is that, through this approach, a researcher can clearly identify the respondents’ demand and management preferences by providing detailed explanations to the respondents about the research topic and ask specific questions directly. However, the AHP analysis is limited in comparing the absolute amount of demand objectively. The advantage of the sentiment analysis is that it allows one to investigate the demands of potential tourists. While this approach seems to be suitable for understanding the demands of actual tourists for some ES category (such as ES specifics under the cultural category), the data is not valid for investigating the demand of all ES categories. The floating population analysis has the advantage of easily comparing the absolute values of the demand amount by the target site. This method also has an advantage in terms of objectivity when estimating the demand through preferences displayed by actual behavior and, also, can include both local residents and visitors as the survey participants. However, this approach appears to be limited and may not be the best option in evaluating individual ES demands.

4. Discussion

Burkhard et al. [10] conceptualized the ES demand as the sum of the goods and services consumed in a specific time and space, while their work did not explicitly consider the ES consumers’ perspectives. Our research demonstrates that the ES demand can be further specified when people’s choices for their preferred ES are taken into account. The AHP analysis identified that the cultural and provisioning ES was perceived as important by the local residents from both Gariwangsan and Yeoninsan. The supporting ES, on the other hand, were considered to be the least important. The results also show that those local residents who live further from the forest tend to think of the cultural and provisioning categories as less important compared to those who live near the local forest. A similar tendency was found for the regulating category. Other similar research studied forest ES demands of urban residents in metropolitan areas, such as Seoul in South Korea and Beijing in mainland China. The urban residents in Seoul and Beijing preferred the supporting and regulating categories the most, respectively [40,48]. As such, people’s preferred ES may differ substantially depending on their living environments, including, but not limited to, the distance from forests and forest and non-forest products (provisioning category) that have much to do with livelihood [49].
The AHP can clearly identify the direct ES demand and even priorities with respect to forest management. While its methodological strength lies in the quantification of the relative priorities among various ES, there are also weaknesses in that the approach is relatively less objective than the floating population analysis. In an attempt to objectively analyze the ES demand, Baró et al. [31] introduced a demand index that is based on floating population grid data and spatially mapped the outcome. By doing so, they were not only able to portray the spatial pattern of the ES demand but, also, could evaluate the relationship between the ES capacity and demand. Ala-Hulkko et al. [32] also applied a population grid to measure the forest product’s demand in Europe, and the population concentration area was used as a measure of such demand. Since the floating population data are purely quantitative, any comparison based on the data would be objective. However, the selection of target ES heavily relies on the subjective judgement of researchers, and it may not be applicable to certain ES categories, as shown in our work.
The strength of the sentiment analysis based on text-mining and web crawling is that the approach enables identifying the ES demands of those who show certain knowledge of and interests in the forests. We regard such people as potential tourists. The approach is even suitable for spatially mapping their ES demands similar to Liu [29] and Hu and Liu [42]. However, the methodology is not yet explored for ES categories other than the cultural category.
The limitations of this study are as follows. First, the study was limited to the selection and comparison of only three methodologies for assessing the social demand for ES. In the future, if different approaches are undertaken and their results are compared to our study results, we may be able to come up with more sophisticated outcomes in estimating the ES demand and providing more advanced suggestions in evaluating the social demand of local forest ES. Second, our study did not cover how much the changes in the quality and quantity of specific ES affect citizens’ social demands. With regards to this, we believe that future studies could employ different approaches such as the contingent evaluation method. Further investigations on other methodologies will enable the development of more useful tools for evaluating the social demands of local forest ES.

5. Conclusions

The social demands for ES are not only defined based on the goods and services consumed in a specific time and space but are also based on the concrete and clear estimation of the ES consumer’s perspective on ES. This is because the consumers with different perspectives at the same time and space can have different demands for ES. Considering this, we used three methodological approaches—analytic hierarchy process, sentiment analysis, and floating population analysis—to quantify, map, and compare the social demand for two South Korean local forests (Gariwangsan and Yeoninsan).
Accordingly, the local resident leaders perceived the cultural ES category and supporting ES category to be the ES that should be maintained the most and the least, respectively. Meanwhile, their specific ES priorities for the target areas differed. Moreover, the leaders at a further distance from the forest perceived the regulating ES category as more important than the provisioning ES category. However, this pattern appeared to be the opposite for the leaders near the forest. They perceived the provisioning ES category as more important than the regulating ES category. The sentiment analysis revealed that recreation and sightseeing ranked the highest in the positive sector and non-timber forest product supply ranked first in the negative sector for Gariwangsan. For Yeoninsan, recreational and sightseeing ranked the highest in both the positive and negative sectors. Through the analysis of the floating population data (March, June, September, and December), we found that the total demand for Yeoninsan was higher than that of Gariwangsan. In addition, the distribution of floating populations in both the forests followed the valleys and mountain areas, which allowed the study to infer that the demand for cultural and regulating ES categories was concentrated in specific areas.
Our study is novel, as it employed multiple methods to investigate and provided an index that can grasp the diverse types of consumers’ social demands for ES. Overall, the research outcomes revealed that the methodology for estimating consumers’ social demands should differ depending on the type of consumer (local residents, potential tourists, and actual visitors). Implications regarding the local forest management are also evident. If stakeholders or decision-makers were to analyze the forest, they are responsible for comprehending its ES demand (as well as supply), and their understanding shall be very limited when only applying and relying on a single methodology. Our research provided empirical evidence in that respect and showed the areas that were high in demand and those that were not; these results are helpful to forest management. If a forest (e.g., Gariwangsan) has a controversial and complex issue, it is all the more essential to identify diverse ES demands in a thorough manner so that the stakeholders or decision-makers can reflect that in forest ES management.

Supplementary Materials

The following are available online at https://www.mdpi.com/article/10.3390/f12040497/s1, Table S1: AHP analysis table, Table S2: Tourist attractions near Gariwangsan and Yeoninsan, Table S3. Survey results of the local residents’ perception on the ecosystem services, Figure S1. Word cloud results of (a) Gariwangsan and (b) Yeoninsan in Korean.

Author Contributions

Conceptualization, J.-H.J., O.S.K. and C.-B.L.; methodology, J.-H.J. and M.C.; formal analysis, J.-H.J. and M.C.; fieldwork, J.-H.J. and M.C.; data curation, J.-H.J., M.C. and O.S.K.; writing—original draft preparation, J.-H.J. and O.S.K.; writing—review and editing, J.-H.J., K.-h.L. and O.S.K. and supervision, O.S.K. and C.-B.L. All authors have read and agreed to the published version of the manuscript.

Funding

This study was carried out with the support of the Research and Development Program for Forest Science Technology (Project No. 2019159A00-1920-AB02) provided by the Korea Forest Service (Korea Forestry Promotion Institute). Additional funding was provided by the College of Education Grant of the Korea University in 2021.

Acknowledgments

We gratefully thank Pam Berry and Alison Smith (Environmental Change Institute, School of Geography and the Environment, University of Oxford) for their inspiring advice and comments for formulating the initial idea of this project.

Conflicts of Interest

The authors declare no conflict of interest.

References

  1. Costanza, R.; d’Arge, R.; De Groot, R.; Farber, S.; Grasso, M.; Hannon, B.; Limburg, K.; Naeem, S.; O’neill, R.V.; Paruelo, J. The value of the world’s ecosystem services and natural capital. Nature 1997, 387, 253–260. [Google Scholar] [CrossRef]
  2. De Groot, R.S.; Wilson, M.A.; Boumans, R.M. A typology for the classification, description and valuation of ecosystem functions, goods and services. Ecol. Econ. 2002, 41, 393–408. [Google Scholar] [CrossRef] [Green Version]
  3. Millennium Ecosystem Assessment. Ecosystems and Human Well-Being; Island Press: Washington, DC, USA, 2005. [Google Scholar]
  4. Maes, J.; Paracchini, M.L.; Zulian, G.; Dunbar, M.B.; Alkemade, R. Synergies and trade-offs between ecosystem service supply, biodiversity, and habitat conservation status in europe. Biol. Conserv. 2012, 155, 1–12. [Google Scholar] [CrossRef]
  5. Brown, G. The relationship between social values for ecosystem services and global land cover: An empirical analysis. Ecosyst. Serv. 2013, 5, 58–68. [Google Scholar] [CrossRef]
  6. Sikor, T.; Martin, A.; Fisher, J.; He, J. Toward an empirical analysis of justice in ecosystem governance. Conserv. Lett. 2014, 7, 524. [Google Scholar] [CrossRef] [Green Version]
  7. Jo, J.; Roh, T.; Hwang, J.; Lee, K.; Lee, C. Factors and paths affecting payment for forest ecosystem service: Evidence from voluntary forest carbon market in South Korea. Sustainability 2020, 12, 7009. [Google Scholar] [CrossRef]
  8. Kim, O.S.; Newell, J.P. The ‘geographic emission benchmark’ model: A baseline approach to measuring emissions associated with deforestation and degradation. J. Land Use Sci. 2015, 10, 466–489. [Google Scholar] [CrossRef] [Green Version]
  9. Kim, O.S. An assessment of deforestation models for reducing emissions from deforestation and forest degradation (REDD). Trans. GIS 2010, 14, 631–654. [Google Scholar] [CrossRef]
  10. Burkhard, B.; Kroll, F.; Nedkov, S.; Müller, F. Mapping ecosystem service supply, demand and budgets. Ecol. Ind. 2012, 21, 17–29. [Google Scholar] [CrossRef]
  11. Jo, J.; Choi, M.; Kim, O.S.; Lee, K.; Lee, C. Mapping the supply of local forest ecosystem services: Based on delphi and land use scoring method. J. Assoc. Korean Geogr. 2020, 295–312. (In Korean) [Google Scholar] [CrossRef]
  12. Bastian, O.; Syrbe, R.U.; Rosenberg, M.; Rahe, D.; Grunewald, K. The five pillar EPPS framework for quantifying, mapping and managing ecosystem services. Ecosyst. Serv. 2013, 4, 15–24. [Google Scholar] [CrossRef]
  13. Haines-Young, R. The Links between Biodiversity, Ecosystem Services and Human Well-Being; Cambridge University Press: Cambridge, UK, 2010; pp. 110–139. [Google Scholar]
  14. Wolff, S.; Schulp, C.J.E.; Verburg, P.H. Mapping ecosystem services demand: A review of current research and future perspectives. Ecol. Ind. 2015, 55, 159–171. [Google Scholar] [CrossRef]
  15. Schröter, M.; van der Zanden, E.H.; van Oudenhoven, A.P.E.; Remme, R.P.; Serna-Chavez, H.M.; de Groot, R.S.; Opdam, P. Ecosystem services as a contested concept: A synthesis of critique and counter-arguments. Conserv. Lett. 2014, 7, 514–523. [Google Scholar] [CrossRef] [Green Version]
  16. Martín-López, B.; Iniesta-Arandia, I.; García-Llorente, M.; Palomo, I.; Casado-Arzuaga, I.; Amo, D.G.D.; Gómez-Baggethun, E.; Oteros-Rozas, E.; Palacios-Agundez, I.; Willaarts, B.; et al. Uncovering ecosystem service bundles through social preferences. PLoS ONE 2012, 7, e38970. [Google Scholar] [CrossRef] [Green Version]
  17. Plieninger, T.; Dijks, S.; Oteros-rozas, E.; Bieling, C. Assessing, mapping, and quantifying cultural ecosystem services at community level. Land Use Policy 2013, 33, 118–129. [Google Scholar] [CrossRef] [Green Version]
  18. Casado-Arzuaga, I.; Madariaga, I.; Onaindia, M. Perception, demand and user contribution to ecosystem services in the bilbao metropolitan greenbelt. J. Environ. Manag. 2013, 129, 33–43. [Google Scholar] [CrossRef]
  19. Wei, H.; Fan, W.; Wang, X.; Lu, N.; Dong, X.; Zhao, Y.; Ya, X.; Zhao, Y. Integrating supply and social demand in ecosystem services assessment: A review. Ecosyst. Serv. 2017, 25, 15–27. [Google Scholar] [CrossRef]
  20. Reed, P.; Brown, G. Values suitability analysis: A methodology for identifying and integrating public perceptions of ecosystem values in forest planning. J. Environ. Plann. Manag. 2003, 46, 643–658. [Google Scholar] [CrossRef]
  21. Rathore, S.; Kumar, P.; Loia, V.; Jeong, Y.; Park, J.H. Social network security: Issues, challenges, threats, and solutions. Inf. Sci. 2017, 421, 43–69. [Google Scholar] [CrossRef]
  22. Yoshimura, N.; Hiura, T. Demand and supply of cultural ecosystem services: Use of geotagged photos to map the aesthetic value of landscapes in hokkaido. Ecosyst. Serv. 2017, 24, 68–78. [Google Scholar] [CrossRef]
  23. Hong, D.; Jeong, H.; Park, S.; Han, E.; Kim, H.; Yun, I. Study on the methodology for extracting information from SNS using a sentiment analysis. J. Korea Inst. Intell. Trans. Syst. 2017, 16, 141–155. (In Korean) [Google Scholar] [CrossRef]
  24. Bakshi, R.K.; Kaur, N.; Kaur, R.; Kaur, G. Opinion mining and sentiment analysis. In Proceedings of the 2016 3rd International Conference on Computing for Sustainable Global Development (INDIACom), New Delhi, India, 16–18 March 2016; pp. 452–455. [Google Scholar]
  25. Oke, A.; Osobajo, O.; Obi, L.; Omotayo, T. Rethinking and optimising post-consumer packaging waste: A sentiment analysis of consumers’ perceptions towards the introduction of a deposit refund scheme in Scotland. Waste Manag. 2020, 118, 463–470. [Google Scholar] [CrossRef]
  26. Loaiza, J.P.V.; Pérez-Torres, A.; Contreras, K.M.D. Semantic icons: A sentiment analysis as a contribution to sustainable tourism. Sustainability 2019, 11, 4655. [Google Scholar] [CrossRef] [Green Version]
  27. Yun, H.; Choi, E. A study on sentiment analysis of media and SNS response to national policy: Focusing on policy of child allowance, childbirth grant. J. Digit. Converg. 2019, 17, 195–200. (In Korean) [Google Scholar]
  28. Kim, Y. Using twitter sentiment analysis as a means of measuring housing satisfaction. Korean Soc. Cadastre 2017, 33, 1–21. (In Korean) [Google Scholar]
  29. Liu, B. Sentiment Analysis and Opinion Mining; Morgan & Claypool Publishers: San Rafael, CA, USA, 2012; pp. 1–184. [Google Scholar]
  30. Lee, J.; Park, H.; Kim, I.; Kwon, H. Issue difference of ecosystem service demand and supply through text mining analysis: Case study of shiheung using complaints and urban planning materials. J. Korean Soc. Rural. Plan. 2018, 24, 63–71. (In Korean) [Google Scholar] [CrossRef]
  31. Baró, F.; Palomo, I.; Zulian, G.; Vizcaino, P.; Haase, D.; Gómez-Baggethun, E. Mapping ecosystem service capacity, flow and demand for landscape and urban planning: A case study in the barcelona metropolitan region. Land Use Policy 2016, 57, 405–417. [Google Scholar] [CrossRef] [Green Version]
  32. Ala-Hulkko, T.; Kotavaara, O.; Alahuhta, J.; Hjort, J. Mapping supply and demand of a provisioning ecosystem service across europe. Ecol. Indic. 2019, 103, 520–529. [Google Scholar] [CrossRef]
  33. Dunford, R.; Harrison, P.; Smith, A.; Dick, J.; Barton, D.N.; Martin-Lopez, B.; Kelemen, E.; Jacobs, S.; Saarikoski, H.; Turkelboom, F.; et al. Integrating Methods for ecosystem service assessment: Experiences from real world situations. Ecosyst. Serv. 2018, 29, 499–514. [Google Scholar] [CrossRef]
  34. Saaty, T.L. An exposition of the ahp in reply to the paper “remarks on the analytic hierarchy process”. Manag. Sci. 1990, 36, 259–268. [Google Scholar] [CrossRef]
  35. Kurttila, M.; Pesonen, M.; Kangas, J.; Kajanus, M. Utilizing the analytic hierarchy process (ahp) in swot analysis—A hybrid method and its application to a forest-certification case. For. Policy Ecol. 2000, 1, 41–52. [Google Scholar] [CrossRef]
  36. Veisi, H.; Liaghati, H.; Alipour, A. Developing an ethics-based approach to indicators of sustainable agriculture using analytic hierarchy process (AHP). Ecol. Ind. 2016, 60, 644–654. [Google Scholar] [CrossRef]
  37. Elavarasan, R.M.; Leoponraj, S.; Vishnupriyan, J.; Dheeraj, A.; Sundar, G.G. Multi-criteria decision analysis for user satisfaction-induced demand-side load management for an institutional building. Renew. Energy 2021, 170, 1396–1426. [Google Scholar] [CrossRef]
  38. Gupta, P.; Mehlawat, M.; Aggarwal, U.; Charles, V. An integrated ahp-dea multi-objective optimization model for sustainable transportation in mining industry. Resour. Policy 2018. [Google Scholar] [CrossRef]
  39. Gupta, N.; Vrat, P. An evaluation of alternative business excellence models using AHP. J. Adv. Manag. Res. 2019, 17, 305–331. [Google Scholar] [CrossRef]
  40. Jang-Hwan, J.; So-Hee, P.; JaChoon, K.; Taewoo, R.; Lim, E.M.; Yeo-Chang, Y. Preferences for Ecosystem Services Provided by Urban Forests in South Korea. For. Sci. Technol. 2020, 16, 86–103. [Google Scholar] [CrossRef]
  41. Saaty, T.L. Decision Making with Dependence and Feedback: The Analytic Network Process; RWS publications: Pittsburgh, PA, USA, 1996. [Google Scholar]
  42. Hu, M.; Liu, B. Mining and summarizing customer reviews. In Proceedings of the 10th ACM SIGKDD International Conference on Knowledge Discovery and Data Mining, Seattle, WA, USA, 22–25 August 2004; pp. 168–177. [Google Scholar]
  43. Curtis, A.; Felix, C.; Mitchell, S.; Ajayakumar, J.; Kerndt, P.R. Contextualizing overdoses in Los Angeles’s skid row between 2014 and 2016 by leveraging the spatial knowledge of the marginalized as a resource. Ann. Am. Assoc. Geogr. 2018, 108, 1521–1536. [Google Scholar] [CrossRef]
  44. Curtis, A.; Squires, R.; Rouzier, V.; Pape, J.W.; Ajayakumar, J.; Bempah, S.; Taifur Alam, M.; Alam, M.; Rashid, M.H.; Ali, A. Micro-space complexity and context in the space-time variation in enteric disease risk for three informal settlements of port au prince, haiti. Int. J. Environ. Res. Public Health 2019, 16, 807. [Google Scholar] [CrossRef] [Green Version]
  45. Curtis, A.; Curtis, J.W.; Ajayakumar, J.; Jefferis, E.; Mitchell, S. Same space—Different perspectives: Comparative analysis of geographic context through sketch maps and spatial video geonarratives. Int. J. Geogr. Inf. Sci. 2019, 33, 1224–1250. [Google Scholar] [CrossRef]
  46. Ajayakumar, J.; Curtis, A.; Smith, S.; Curtis, J. The use of geonarratives to add context to fine scale geospatial research. Int. J. Environ. Res. Public Health 2019, 16, 515. [Google Scholar] [CrossRef] [PubMed] [Green Version]
  47. Bempah, S.; Curtis, A.; Awandare, G.; Ajayakumar, J. Appreciating the complexity of localized malaria risk in ghana: Spatial data challenges and solutions. Health Place 2020, 64, 102382. [Google Scholar] [CrossRef] [PubMed]
  48. Zhi-Ying, H.; Yeo-Chang, Y. Beijing resident’s preferences of ecosystem services of urban forests. Forests 2021, 12, 14. [Google Scholar] [CrossRef]
  49. Jo, J.; Roh, T.; Shin, S.; Youn, Y. Sustainable assets and strategies affecting the forestry household income: Empirical evidence from south korea. Sustainability 2019, 11, 3680. [Google Scholar] [CrossRef] [Green Version]
Figure 1. Study areas: (a) Gariwangsan and (b) Yeoninsan with shaded relief as the background.
Forests 12 00497 g001
Figure 2. Score maps of competing ecosystem services (provisioning versus regulating ES categories) in (a) Gariwangsan and (b) Yeoninsan.
Forests 12 00497 g002
Figure 3. Relationship of provisioning and regulating ES categories in Gariwangsan and Yeoninsan.
Forests 12 00497 g003
Figure 4. Score maps of competing ecosystem services (provisioning versus regulating ES categories) in (a) Gariwangsan and (b) Yeoninsan.
Forests 12 00497 g004
Figure 5. Relationship of regulating and cultural ES categories in Gariwangsan and Yeoninsan.
Forests 12 00497 g005
Figure 6. Word cloud results of (a) Gariwangsan and (b) Yeoninsan.
Forests 12 00497 g006
Figure 7. Word frequency analysis results of (a) Gariwangsan and (b) Yeoninsan.
Forests 12 00497 g007
Figure 8. Results of the sentiment analysis of (a) Gariwangsan and (b) Yeoninsan.
Forests 12 00497 g008
Figure 9. Kernel density maps of (a) recreation and sightseeing and (b) air quality improvements in Gariwangsan.
Forests 12 00497 g009
Figure 10. Kernel density maps of (a) recreation and sightseeing and (b) forest products demand in Yeoninsan.
Forests 12 00497 g010
Figure 11. Spatial distribution of the floating populations in (a) Gariwangsan and (b) Yeoninsan.
Forests 12 00497 g011
Figure 12. Sizes of the floating populations in Gariwangsan and Yeoninsan.
Forests 12 00497 g012
Figure 13. Spatial distribution of the demand intensity of Gariwangsan in (a) March, (b) June, (c) September, and (d) December 2019.
Forests 12 00497 g013
Figure 14. Spatial distribution of the demand intensity of Yeoninsan in (a) March, (b) June, (c) September, and (d) December 2019.
Forests 12 00497 g014
Table 1. Sentiment analysis’ scoring scheme.
ScoreStandard for Words
2Happiness, Best, I want to come visit again, Excellent, Enjoyable, I miss it already, Beautiful, Recommend, Well-done, Cheerful, Comfortable, Exciting, Well-made, Clean, etc.
1Feel relieved, Seems good, Was good but, Satisfied, etc.
0Not bad, Nothing great, Just right, Good for one visit, Just about OK, etc.
(Included also no opinions or assessments)
−1Annoying, Disappointing, Plain, Tiring, etc.
−2Uncomfortable, Dirty, Unpleasant, Regrettable, Nothing to see, Boring, etc.
Table 2. Categorization of texts obtained from word cloud.
Non-Timber Forest ProductTimberWater ResourceErosion PreventionWater Quality Control
Wild greens, Wild ginseng, Arrowroot, Collection & Picking signs, No-collection & Picking signs, Gom-chwi herb mushroom, Pine mushroom, Native plant, Provisions for residents, Cultivation, etc.-Drinking water, Dong-gang River, Jangjeon Valley, Residents’ use Drinking water fountain, Artificial waterfall, etc.-Clear water, Clear valley, Recycling, Trash, Trash bag, Announcement, etc.
Carbon AbsorptionAir QualityRecreation and SightseeingEducation about NatureBiodiversity Improvement
No-smoking, Clean nature, Breathing, Clean mountain, Oxygen, Role of trees, Carbon dioxide absorption, Comparison with Seoul air, Forest scent, etc.Air, Water fog, Breathing, Freshness, Fresh air, Refreshing breeze, Fresh air in the mountains, Comparison with Seoul air, Clean winds blowing from the mountains, Clear sky, Stars, Clean air, Clear view, Crisp air, etc.Tourism trains, City bus, Parking lot, Valley, Waterfall,
Camping ground, Recreation, Scenery, Toilets, Shower room, Experience, Hang-gliding, Paragliding, Boating, Stony path, History, Observatory, Skywalk, Olympics, Recreational forest, Glamping,
Railbike, Rides, Rafting, Trekking, etc.
Natural forests, History, Management, Education, Children, Past, Topography, Guidance, Explanation, Instructor, Appearance, Traditional culture, Festivals, Biology, Rural experience, Natural studies, Exhibition, Specimen, Teacher, Exhibition hall, Traditional bridge, Stars, Destruction, Damage, etc.Butterfly, Native, Plant, Bird, Elk, Owl, Frog, Fish, Egg, Insect, Animal, Fish species, Zooid, Moss, Pulsatilla koreana, Taxus cuspidata, Tree, Pine tree, Mole, Vegetation, Dense, broadleaf tree, etc.
Table 3. Classification of the three methods and their data.
ClassificationCollection MethodData TypeApplication
AHPSurvey and interview with local residentsInterview contentUsed as a basis for validity of AHP survey results
SurveyUsed as a basis for determining the ranking for 10 ES
Sentiment analysisBlogs and social mediaTextUsed for word cloud, interpretation of ES demand through word frequency, and used as the basis for sentiment scores
Sentiment score per ESUsed as a basis for comparison of demand by each ES category, determining positivity/negativity, and kernel density map weights
Visitors’ coordinatesUsed as input data for kernel density maps
Floating population analysisStatistical Data Center (Statistics Korea, 2020)Quantity of floating population during weekdays and weekends in March, June, September and December 2020Comparison of population density patterns in March, June, September, and December through finding high density areas of floating population and their heatmaps
Table 4. Ranking of the ecosystem services in accordance with the local residents’ responses.
Category/
Ecosystem Service
GariwangsanYeoninsan
Local ResidentsLocal Residents
Ecosystem services categoriesRank 1Cultural (0.604)Cultural (0.671)
Rank 2Provisioning (0.247)Regulating (0.136)
Rank 3Regulating (0.107)Provisioning (0.128)
Rank 4Supporting (0.042)Supporting (0.065)
CI0.09750.0448
Provisioning servicesRank 1Water resources supply (0.597)Non-timber forest products supply (0.742)
Rank 2Non-timber forest products supply (0.344)Timber supply (0.180)
Rank 3Timber supply (0.059)Water resources supply (0.078)
CI0.02820.0411
Regulating servicesRank 1Water quality regulation (0.594)Air quality improvement (0.445)
Rank 2Erosion control (0.257)Water quality regulation (0.391)
Rank 3Carbon absorption (0.104)Erosion control (0.119)
Rank 4Air quality improvement (0.046)Carbon absorption (0.045)
CI0.04640.0412
Cultural servicesRank 1Recreation and sightseeing (0.863)Education about nature (0.671)
Rank 2Education about nature (0.137)Recreation and sightseeing (0.329)
CI0.0000.000
Table 5. Rank by the sentiment analysis in Gariwangsan.
RankPositiveNegative
1Recreation and sightseeingRecreation and sightseeing
2Air quality improvementBiodiversity improvement
3Biodiversity improvementWater quality regulation
4Water quality regulation-
5Education about nature
6Water resource supply
7Non-timber forest product supply
8Carbon absorption
9Timber supply
10Erosion control
Table 6. Rank by the sentiment analysis in Yeoninsan.
RankPositiveNegative
1Recreation and sightseeingRecreation and sightseeing
2Air quality improvementBiodiversity improvement
3Biodiversity improvementWater quality regulation
4Water quality regulation-
5Education about nature
6Water resource supply
7Non-timber forest product supply
8Carbon absorption
9Timber supply
10Erosion control
Table 7. Number of floating populations in Gariwangsan and Yeoninsan (no. of people).
MonthGariwangsanYeoninsan
March665,1654,591,984
June735,7636,750,972
September714,0156,184,203
December762,1427,008,791
Table 8. Comparisons and characteristics of the three methods measuring the forest ecosystem services demands.
Evaluation IndexAHPSentiment AnalysisFloating Population
Possibility of evaluating individual ES demandHighAverageLow
Identifying the absolute amount of demandLowAverageHigh
Objectivity in quantifying demandAverageAverageHigh
Estimating spatial change of demandAverageHighHigh
Constraints in time taken to collect data
(High: longer time, Low: shorter time)
LowAverageHigh
Target of demand surveyLocal residentsPotential touristsVisitors
Publisher’s Note: MDPI stays neutral with regard to jurisdictional claims in published maps and institutional affiliations.

