Article

Molecular Signatures of Reticulate Evolution within the Complex of European Pine Taxa

by
Bartosz Łabiszak
1,* and
Witold Wachowiak
1,2
1
Institute of Environmental Biology, Adam Mickiewicz University in Poznań, Uniwersytetu Poznańskiego 6, 61-614 Poznań, Poland
2
Institute of Dendrology, Polish Academy of Sciences, Parkowa 5, 62-035 Kórnik, Poland
*
Author to whom correspondence should be addressed.
Forests 2021, 12(4), 489; https://doi.org/10.3390/f12040489
Submission received: 8 March 2021 / Revised: 12 April 2021 / Accepted: 13 April 2021 / Published: 15 April 2021
(This article belongs to the Section Genetics and Molecular Biology)

Abstract

:
Speciation mechanisms, including the role of interspecific gene flow and introgression in the emergence of new species, are the major focus of evolutionary studies. Inference of taxonomic relationship between closely related species may be challenged by past hybridization events, but at the same time, it may provide new knowledge about mechanisms responsible for the maintenance of species integrity despite interspecific gene flow. Here, using nucleotide sequence variation and utilizing a coalescent modeling framework, we tested the role of hybridization and introgression in the evolutionary history of closely related pine taxa from the Pinus mugo complex and P. sylvestris. We compared the patterns of polymorphism and divergence between taxa and found a great overlap of neutral variation within the P. mugo complex. Our phylogeny reconstruction indicated multiple instances of reticulation events in the past, suggesting an important role of interspecific gene flow in the species divergence. The best-fitting model revealed P. mugo and P. uncinata as sister species with basal P. uliginosa and asymmetric migration between all investigated species after their divergence. The magnitude of interspecies gene flow differed greatly, and it was consistently stronger from representatives of P. mugo complex to P. sylvestris than in the opposite direction. The results indicate the prominent role of reticulation evolution in those forest trees and provide a genetic framework to study species integrity maintained by selection and local adaptation.

1. Introduction

Since Darwin’s original work, the origin of species and mechanisms of speciation has been a major focus of evolutionary biology. However, in recent years the understanding of these processes has shifted from a simple divergence model driven by the long-lasting isolation with a gradual accumulation of reproductive isolation between two lineages and now encompasses a wide range of complex scenarios within the speciation continuum framework [1,2]. Within this framework, speciation is understood as a process with no fixed endpoints and a lack of clear boundaries between each stage. This perspective poses a challenge to species delineation, especially when secondary contact via gene flow between emerging evolutionary lineages is facilitated at different times [3]. A growing body of evidence indicates that speciation can occur despite the homogenizing effect imposed by interspecific gene flow [4,5,6,7], and hybridization is now regarded as an important force shaping the genetic diversity of species that can lead to the emergence of new species [8,9,10,11,12,13]. Despite hybridization itself being a very widespread phenomenon, the emergence of a new hybrid lineage is usually very rare. Because emerging hybrid individuals are initially rare and must compete with well-adapted parental species, they must either establish reproductive isolation and a unique ecological niche or backcross to one of the parental species and share a niche, to survive. Nevertheless, the reproductive isolation from parental species is one of the fundamental criteria of homoploid hybrid speciation (HHS) proposed by Schumer [8]; however, the relationship between hybridization and reproductive isolation is often hard to find, especially for species with long generation times, such as pines. Therefore, studies of closely related species can inform us about the different stages of the complex speciation continuum and the production of novel genetic diversity of potential adaptive importance [14].
Incomplete reproductive barriers during speciation facilitate the exchange of large genomic regions or preferential introgression of loci between two taxa, and the time since divergence influences the level of shared polymorphisms between them [5,15,16]. Differences in both magnitude and timeframe of secondary contact between diverging taxa can lead to contrasting evolutionary outcomes: from highly divergent species with varying proportions of admixed genomes to hybrid swarms with multiple intermediate forms present. Additionally, species boundaries can be blurred by the lack of morphological or ecological differences between taxa [17,18]. Consequently, investigation of the relationship among closely related species may prove difficult, and such species are often grouped together in taxonomically challenging species complexes. Species complexes were reported in diverse groups of taxa [6,19,20,21,22], and they are well studied in plants, including forest trees [23,24,25,26]. Nowadays, the application of molecular markers and coalescent ancestry modeling with phylogenetic analyses can greatly improve our ability to resolve evolutionary relationships in such challenging groups of taxa [27,28,29]. Such research may provide new insights into speciation and mechanisms that maintain species integrity despite gene flow, as our understanding of these processes is still incomplete [30].
In this study, we aimed to disentangle the phylogenetic relationships of such a complex group of closely related European hard pine taxa from the Pinus mugo complex. Several species are recognized in this pine complex, including dwarf mountain pine (Pinus mugo Turra), peat bog pine (Pinus uliginosa G.E.Neumann), and mountain pine (Pinus uncinata Ramond ex DC) (see reference [31] for detailed taxonomic descriptions). P. mugo is a polycromic shrub or small tree up to 5 m, native to the subalpine zones of European mountain ranges up to 2700 m above sea level and forming dense carpets on the ground [32]. P. uliginosa is a single-stemmed tree up to 20 m height, growing in small and isolated populations on peat bogs in lowland areas of Central Europe. P. uncinata is a typical erect tree up to 25 m tall and occurs naturally in Alps and Pyrenees at altitudes between 600 and 1600 m above sea level. It shares many morphological features with P. mugo, except for tree habit and some characteristics of cones [32]. Pines from the P. mugo complex are closely related to Scots pine (Pinus sylvestris L.), which has the largest distribution of all pines, mostly lowland, and forms forests of great ecological importance and economic value in Europe and Asia. Due to their relatively recent divergence, weak reproductive barriers, and similar genetic variation at neutral loci but at the same time phenotypical and ecological differentiation, the P. mugo complex pines are especially suitable for speciation, hybridization, and local adaptation studies [33,34,35,36,37].
Earlier reports that addressed the genetic relationships between species were focused mainly on the alternative speciation hypothesis of the origin of P. uliginosa from Central Europe, considered either as a marginal population of P. uncinata, a hybrid between P. mugo and P. uncinata, and/or P. mugo and P. sylvestris [35,38] or an example of ancient homoploid hybrid between the later taxa [36,39,40]. However, those studies were based on small sets of molecular markers, lacking detailed phylogenetic analysis, and thus were inconclusive about the divergence history of Scots pine and taxa from the P. mugo complex.
Therefore, the main objective of the study was to investigate the evolutionary relationships within the P. mugo complex and its close relative P. sylvestris. Clear species delineation is needed in this group to better understand the species divergence history at the genomic level that will help us to search regions under selection that maintain species integrity and local adaptation despite ongoing and historical gene flow [41]. Furthermore, as some members of the pine complex are endangered, the exact assessment of the extinction risk may heavily rely on a proper understanding of species phylogeny [42,43,44]. In particular, we conducted coalescent ancestry modeling and phylogenetic analysis using nucleotide polymorphism data across multiple nuclear loci to (1) examine the alternative scenarios of species origin within the P. mugo complex; (2) explore the role of hybridization and putative reticulation events in the history of this group; (3) delineate species boundaries within the P. mugo complex pines.

2. Materials and Methods

2.1. Sampling and Genotyping

A total of 122 individuals of four pine species and additionally 10 specimens from the outgroup P. pinaster were used in this study (Table S1). Each species was represented by 30 individuals except for P. uliginosa (n = 32). Seeds were collected from allopatric stands of the species from different populations across its core range. For this study, we sampled de novo 8 P. uliginosa and 10 P. pinaster individuals (seeds were obtained from the PUG3 population from the Batorów reserve and from the collection of INIA Forest Research Center in Spain, respectively) and used raw sequence data derived from earlier studies [45]. Genomic DNA was extracted from haploid megagametophytes from germinated seeds using a DNeasy Plant Mini Kit (Qiagen, Germany).
A subset of 48 genes from 79 analyzed by Wachowiak et al. [46] with no signatures of selection detected therein was selected and sequenced (Table S2). PCR amplifications of the nuclear regions were carried out in a total volume of 15µL containing 15 ng of haploid template DNA, 10 µM of each dNTP, 0.2 µM each of forward and reverse primers, 0.15 U Taq DNA polymerase, 1 × BSA, 1.5 µM of MgCl2 and 1 × PCR buffer (Novazym, Poland). Standard amplification procedures were used with an initial denaturation at 94 °C for 3 min followed by 35 cycles with 30 s denaturation at 94 °C, 30 s annealing at 60 °C for most loci and 1 min 30 s extension at 72 °C, and a final 5 min extension at 72 °C. PCR fragments were purified using Exonuclease I-Shrimp Alkaline Phosphatase enzymatic treatment. About 20 ng of PCR product was used as a template in 10 μL sequencing reactions with the Big Dye Terminator DNA Sequencing Kit (Applied Biosystems, Foster City, CA, USA) and run commercially (Genomed, Poland). CodonCode Aligner (Codon Code Corporation, Centerville, MA, USA) was used to edit and align sequences. Concatenated sequences of all genes were created in DnaSP v.6 [46]

2.2. Genetic Diversity and Structure

We looked at the overall pattern of genetic variation at within and between species levels and calculated the following descriptive statistics of DNA polymorphism for each species at each nuclear loci and averaged across all loci using DnaSP v.6: nucleotide diversity (π), Tajima’s D [47], silent divergence to P. pinaster (K), haplotype diversity (Hd) and a minimum number of recombination events (R) [48]. To investigate the level of divergence between the studied species, we calculated both locus by locus and global FST measures [49]. Negative values were reassigned to zero during the mean locus-wide FST calculation. In addition, net between-species divergences per site (Dnet) were calculated using SITES 1.1 [50]. Shared polymorphic sites among species could indicate recent divergence, hybrid origin, or gene exchange after speciation. Thus, we recorded the number of polymorphic sites and their distribution for each nuclear locus within and among species, classifying polymorphic sites as either polymorphisms shared between species or fixed differences between species. We visualized all data using the ggpubr package in R [51,52]
Next, to identify evolutionary clusters across the four pine species, we performed principal component analysis (PCA) in R package ggfotify [53]. Then, Bayesian clustering implemented in STRUCTURE 2.3.4 was performed to further visualize the genetic structure in our dataset [54,55,56]. STRUCTURE was run with an admixture model, no prior population information, and correlated allele frequencies in two variants: with and without P. pinaster as an outgroup, to gain more insight into the fine structure of pines from the P. mugo complex. For each variant, twenty independent runs were performed for the number of clusters (K) from  2 to 10, with burn-in lengths of 200,000, followed by 300,000 Markov chain Monte Carlo (MCMC) iterations. To detect the most likely number of genetic clusters in our data, both the likelihood estimate [54] and the Evanno method [57] were used. Both likelihood value computation and STRUCTURE plot visualization were performed using the pophelper package in R [58].

2.3. Phylogenetic Analyses

To resolve the phylogenetic relationships within the taxa of the P. mugo complex and between them and P. sylvestris, we used two methods. Firstly, we conducted maximum-likelihood (ML) analysis on a concatenated sequence set composed of 48 nuclear loci to reconstruct the phylogeny of the studied species on an individual level. Pinus pinaster was used as an outgroup in all phylogenetic analyses to root trees. Following the evaluation of nucleotide evolutionary models in jModelTest v2.1.7 [59], the ML tree was constructed in RAxML v.8.1.20 [60] using the best-fit model GTRGAMMAI with 1000 bootstrap replicates.
Secondly, to test whether reticulation events were present in the evolutionary history of the studied species, we performed PhyloNet analysis. Phylogenies per gene were constructed using RAxML with 100 rapid bootstraps under the GTRGAMMA substitution model. Each consensus gene topology was recorded, and the number of resulting phylogenies showing different topologies was counted by hand. All bootstrap trees for each gene were used as an input for PHYLONET v.3.8.2 [61,62] after conversion to the required input file with a custom Phyton script. Maximum pseudolikelihood (MPL) in a coalescent framework was used to infer integrated species trees (using the command InferNetwork_MPL). The analysis involved 10 runs for each gene to ensure finding the best network and allowing for up to 4 reticulation events. This method is robust to gene flow, it is computably efficient, and the results are as accurate as in the case of the maximum likelihood one [63].
To further explore the possibility of gene flow between studied pines after their divergence, we used a four-taxon D statistic test [64]. The test compares two patterns of frequency of ancestral and derived alleles in ingroups and outgroups (so-called ABBA and BABA patterns) under the assumption of equal frequencies of ABBA and BABA topologies (D statistic = 0) given the stochastic lineage sorting. Thus, this test is useful in tracking gene flow between species and can help distinguish incomplete lineage sorting from hybridization or admixtures. In the case of hybrid origin of P. uliginosa we should expect the D value to be significantly different from 0 in two topologies ((X1,U), X2) and ((X2,U), X1), where X1 and X2 represent the putative parental species. We also explored other possible introgression scenarios and chose a combination of 12 different topologies to perform ABBA–BABA test and D statistic estimation using the HybridCheck R package [65].

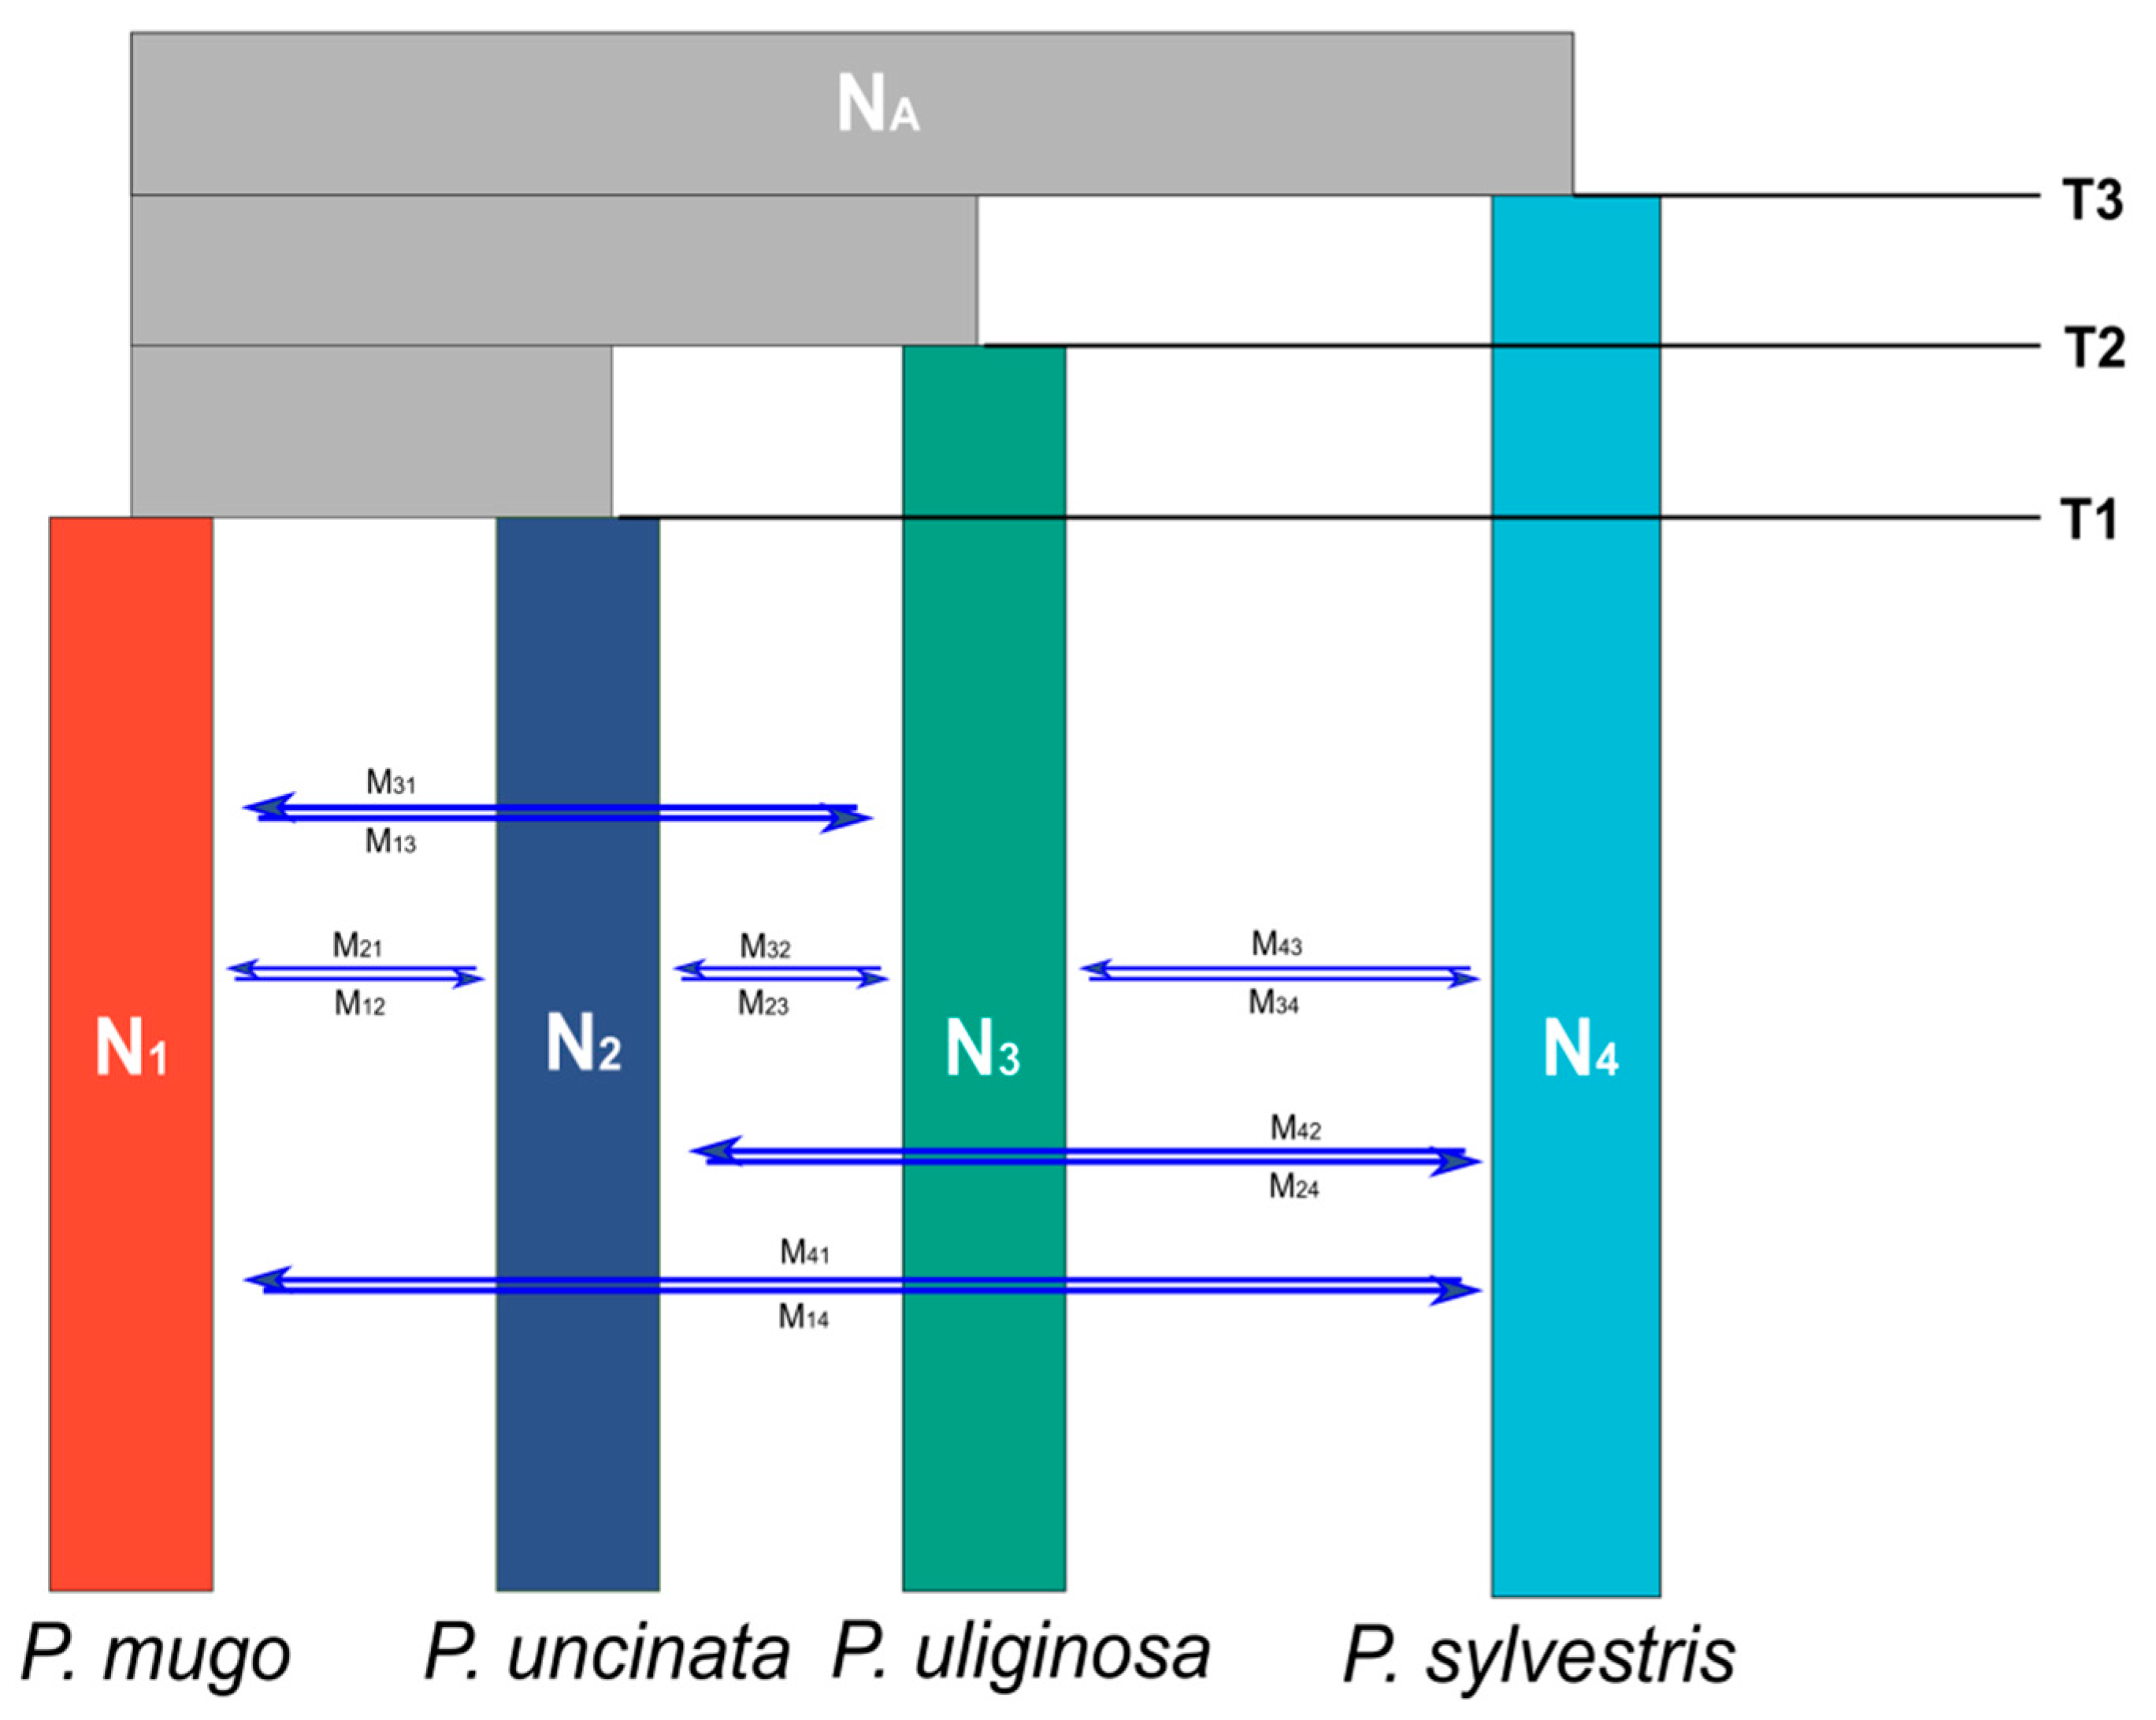
2.4. Testing Speciation Models Using Coalescent Simulations

We used fastsimcoal2 [66,67] to test the fit of our data to different predefined speciation models using coalescent simulations. Multi-site frequency spectra (MSFS) for four pine species were created using Arlequin v.3.5 [68] and used as summary statistics to estimate demographic parameters under an ABC framework. Overall, 16 speciation models were tested, representing different topologies within the P. mugo complex with P. sylvestris as an outgroup. They differed in the allowed levels of migration between species after their divergence, namely: models 1–4 represented possible dichotomous and polytomous topologies between P. mugo, P. uliginosa, and P. uncinata with no migration allowed. Models 5–6 were classic homoploid hybrid speciation (HHS) models of P. uliginosa with different putative parental species, and no migration (P. sylvestris and ancestor of P. uncinata and P. mugo vs. P. mugo and P. uncinata). Models 7–14 had the same topologies as 1–4 but with different, asymmetric migration matrix allowed: between all species within the P. mugo complex and between P. sylvestris and their common ancestor (models 7–10) or between all four species after their divergence (models 11–14). Models 15–16 had the same topologies as 5–6 but included migration between all four species (Figure S1).
For each model, we ran 1,000,000 coalescent simulations to approximate the expected MSFS and calculate the associated log-likelihood. A maximum likelihood parameter estimate was obtained from 50 independent runs with 40 cycles of ECM algorithm in each run. In each model, the highest likelihood run (i.e., with the best fitting parameter estimates) was selected using the fsc-selectbestrun.sh script [69], and the best model was chosen using the calculateAIC.R script [70] based on Akaike information criterion (AIC), to account for numbers of parameters in each model. As used in other conifers, the mutation rate was set to a robust rate of 4.01 × 10⁻⁸, and we assumed a generation time of 25 years [12,36,71,72]. To construct 95% confidence intervals (CI), 100 parametric bootstraps with 50 independent runs in each were run, and the parameter estimates of the best-run files of all bootstrapping replicates were calculated with the R package boot [73].

3. Results

3.1. Genetic Diversity and Population Structure

The nuclear dataset was comprised of 48 nuclear loci with no signatures of selection and a mean length of 404 bp (range: 213–720 bp), and 794 SNPs identified in four pines. The loci were found to be selectively neutral in an earlier study [45], and there was no indication of skew in the allelic frequency spectra across the genes in our dataset. Among all species, P. uliginosa was characterized by the highest number of polymorphic sites, singleton polymorphic sites, averaged nucleotide diversity, averaged divergence to outgroup, and haplotype diversity (Table 1).
However, in general, the distribution of those statistics across all genes was very similar in those pines (Table S3), and the overall level of variability was much alike. Consistent with the low divergence, we found no fixed differences between the studied taxa (only in comparison with P. pinaster such fixed SNPs were found), and the number of shared polymorphisms between species was similar across all genes (Figures S3 and S4). In addition, both average net divergence and global FST were lowest within species from the P. mugo complex (with P. uliginosa being more similar to P. mugo and P. uncinata, than the latter two to each other). There was a 3–4 fold higher difference between them and P. sylvestris with the highest FST and Dnet found between P. sylvestris and P. mugo (Table 2, Figure 1 and Figure S4). Additionally, all studied pines shared similar patterns of FST distribution in pairwise comparison with P. pinaster (Figure S2).
PCA analysis could only clearly identify a distinct species-specific cluster in the case of P. sylvestris (and P. pinaster when it was included as an outgroup), with individuals from species within the P. mugo complex forming mostly overlapping clusters with different levels of homogeneity (P. uncinata and P. uliginosa were the most heterogeneous ones) and the first two principal components explaining 19.81% (21.24%) and 9.04% (8.48%), respectively (Figure 2 and Figure S5).
Similarly, STRUCTURE results (with or without the outgroup P. pinaster included) revealed a close genetic relationship between P. mugo, P. uliginosa, and P. uncinata with the best-supported number of genetic clusters (K = 3) with outgroup and (K = 2) when P. pinaster was excluded from the analysis (Figure 3a,b and Figure S6). When P. pinaster was included, it formed its own cluster, while three taxa from the P. mugo complex were grouped together and were clearly delineated from the cluster composed of P. sylvestris individuals. The resolution of genetic structure within species from the P. mugo complex did not improved when P. pinaster was excluded and the two main clusters reflected P. sylvestris vs. P. mugo complex division with no signatures of further substructure. The contrast between P. mugo and P. uliginosa/P. uncinata was more evident, as the latter species shared a greater proportion of their genetic composition with P. sylvestris (Figure 3).

3.2. Reticulate Phylogeny of Four Pines

The results of our phylogenetic ML analysis provided additional insight into the complex evolutionary history of the studied pine species and the possibility of non-bifurcating speciation events in their past. Three main clades could be identified in the phylogenetic tree obtained from 19,414 bp concatenated sequences from 48 nuclear genes. However, individuals from the same species form a monophyletic group only for the outgroup P. pinaster. The second clade was composed predominantly of P. sylvestris (with four P. uncinata and one P. uliginosa specimens), and the remaining P. sylvetris individuals were grouped together with the species from the P. mugo complex (Figure S7).
Additionally, contrasting topologies were also recorded from individual consensus gene trees. Overall, high numbers of individual topologies (10 out of 15 possible unrooted topologies for five species) were reconstructed across 48 genes. The three most frequent topologies (~60% in total) are shown in Figure 4a–c. The first two are similar in respect to the position of the basal clades (P. pinaster followed by P. sylvestris) but differ in relationships within the P. mugo complex: indicating either P. mugo and P. uncinata or P. uliginosa and P. uncinata as pairs of most closely related species. Surprisingly, the third topology places P. sylvestris as the innermost clade with P. uncinata and P. uliginosa followed by P. mugo at the base of the tree with P. pinaster as the outgroup. The corresponding PhyloNet species tree indicated the presence of at least three reticulation events in the evolutionary history of the studied pines, not limited only to the origins of P. uliginosa, but also involving other members of the P. mugo complex and P. sylvestris as well (Figure 4d). Finally, significant gene flow between members of the P. mugo complex and between them and P. sylvestris was found using the ABBA–BABA test (Table 3).

3.3. Alternative Speciation Models

Among the 16 possible speciation models tested, model 12 (Figure 5) with dichotomous divergence within the P. mugo complex was chosen as the best fitting to our data, based on the lowest values of AIC (Supporting Table S4).
In this model, P. mugo and P. uncinata were sister species with basal P. uliginosa and asymmetric migration between all four species after their divergence. However, it is worth noting that the second-best model with relatively small ΔAIC was model 14 with an unresolved polytomous topology within the P. mugo complex after their split from P. sylvestris and migration between all species after the divergence (Figure S1, Table S4). The estimated parameters for the best model suggest that the common ancestors of the species from the P. mugo complex split from the P. sylvestris ~5.9 Ma (5–8.5 Ma, 95% CI), and further divergence within the complex occurred ~4Ma (3.9–5 Ma) with the origin of P. uliginosa and most recent divergence of P. mugo from P. uncinata ~2 Ma (1.5–2.4 Ma; Table 4). Under this scenario, the current effective population sizes for P. mugo, P. uliginosa, P. uncinata, and P. sylvestris were estimated to be 406,282, 77,680, 78,879, and 554,232, respectively (Table 4). The results indicate asymmetric gene flow and introgression between all four species with migration rates from 3.28−10 to 4.91−5 per generation and the strongest gene flow in pairs: P. mugo vs. P. uliginosa, P. uncinata vs. P. uliginosa and P. sylvestris vs. P. uliginosa (Table 4).

4. Discussion

4.1. Models of Speciation

The patterns of nucleotide polymorphism and the signatures of divergence between species, including clustering analysis, reflected the greater similarity of pines in the P. mugo complex and their slight distinctiveness from P. sylvetsris, than expected under the pure HHS model. However, as we demonstrate in our study, the speciation history of those pines did not conform to the strict bifurcating divergence but was heavily influenced by interspecific gene flow and reticulation events in the past. Out of 16 tested alternative evolutionary models of relationships between taxa, including the two most likely scenarios of homoploid hybrid speciation of P. uliginosa, the best fitting one indicated P. mugo and P. uncinata as a sister species with basal P. uliginosa and P. sylvestris as an outgroup. Furthermore, the most accurate model involved an asymmetric gene flow between all four species after their divergence (Table 4, Figure 5).
Our estimates of about 5 Ma divergence time between P. sylvestris and taxa from the P. mugo complex are in line with earlier reports [36]. Furthermore, we were able to estimate the time of two subsequent divergence events within the pine complex, which happened 4 Ma and 2 Ma, respectively. Initially, P. uliginosa split from the common ancestor of P. uncinata and P. mugo, and then those two pines further diverged, which led to the emergence of contemporary P. uncinata and P. mugo (Table 4). A short time since divergence could explain the lack of fixed differences between all studied pines, particularly the low divergence within taxa from the P. mugo complex and the generally high number of shared polymorphisms between them. Such similarity could also be explained by the time required for the reciprocal monophyly between diverging species - the greater the effective population size and the more time is necessary to observe it [74]. Given the generally large effective population sizes of the studied pine taxa, estimated here to be in range of 77,680–554,232, this time would be orders of magnitude greater than the mean divergence time between them (2 Ma). Our estimates of effective population sizes are analogous to the results of previous studies [36,75], with P. sylvestris and P. mugo characterized by the highest and P. uncinata and P. uliginosa by the lowest sizes. However, considerably lower estimates of effective population size were reported in a recent study of the demographic history of P. uliginosa [76]. The difference between those estimates is most likely caused by the number and type of loci (794 SNPs from nuclear genes vs. nine SSR and 12 cpSSR loci) used in each analysis and the fact that we provide estimates for the whole species but not individual populations.

4.2. Interspecific Gene Flow

Significant gene flow after divergence could further reduce the observed species’ genetic differentiation [4,5,16]. Different tests used in our study confirmed that gene exchange had played a significant role in the evolutionary history of those pines (Table 3, Figure 4 and Figure 5). Additionally, coalescent estimations helped us infer both the magnitude and relative timing of gene flow between species, which suggests that secondary contact was possible long after species divergence. Similar findings in different conifer systems confirm that reproductive barriers between congeners in this group are weak and reticulate speciation is not only possible but often influences patterns of species diversity in this genus [25,77,78]. Our data indicate that the pattern of introgression is not symmetric between taxa, and in general, stronger gene flow was estimated from representatives of the P. mugo complex to P. sylvestris than in the opposite direction. Earlier studies reported such asymmetric ongoing gene flow within present-day contact zones of P. uliginosa, P. mugo, and P. sylvestris [79,80,81]. Surprisingly, the strength of gene flow within the P. mugo complex is not consistent considering the genetic relatedness between the taxa-in fact, P. mugo and P. uncinata are characterized by the lowest reciprocal migration rates among all analyzed species. Those results may reflect their rapid divergence after the split, facilitated by the geographic isolation and contemporary disjoint distribution of sympatric populations found only in the Alps, with P. uncinata primarily located in the western and P. mugo in the eastern parts of the mountains. Patterns of mitochondrial DNA variation support this ongoing divergence, as both species, could be clearly delineated by mitochondrial markers, and P. uncinata harbors unique and fixed mitotypes [33]. Nevertheless, there is evidence for interspecific gene exchange between those pines in their contact zone in the Alps [82]. Considering the relatively strong signals of gene flow between P. uncinata and P. uliginosa and given their current allopatric ranges with the limited and fragmented distribution of the latter species, we hypothesize that it may reflect an ancient introgression between those pines. Although pollen records could infer past plant species distribution [83], palynological records only poorly distinguished taxa of the P. mugo complex from P. sylvestris, and further distinction within the complex is impossible [84].
Evidence of widespread introgression between studied pines is further supported by the particularly high number of inconsistencies of gene trees with species trees found in our dataset. This pattern was especially conspicuous for those gene topologies where P. uncinata and P. sylvestris were indicated as the most closely related species (Figure 4). Similar patterns could also arise as an effect of incomplete lineage sorting; however, it is less likely in our case, as the results of the ABBA–BABA test confirmed a significant excess of allelic patterns consistent with a history of introgression (Table 3). Introgression could also explain the pattern observed in individual-based phylogeny, where the three main clades were not species-specific and individuals from different species grouped together. It should also be noted that overall, the bootstrap support for most of the phylogenetic tree branches was low (<50) with highly supported nodes only in the case of outgroup P. pinaster main branch and some terminal nodes. Additionally, some specimens from two P. sylvestris populations (from Poland and Finland) were more closely related to individuals from P. uliginosa and P. uncinata, than those from conspecific populations (Figure S7). The wide distribution of P. sylvestris and its known long-distance migration associated with postglacial recolonization of Europe could facilitate overlap with other pine species and locally restricted gene flow. Previous studies reported similarities between Scots pine populations from Poland and Finland [85,86], reflecting their common phylogeographic history, and mitotype sharing between P. uliginosa, P. mugo, and P. sylvestris in their contact zones was also reported [33,80].
Although our dataset contained selectively neutral loci, such preferentially introgressed alleles could reveal the genomic location of regions of adaptive value that were predominantly targeted by introgression and linked to neutral variants [87]. Examples of such adaptive introgression in plant systems are emerging in recent years, especially in crop species and their wild relatives [88,89,90,91]. Thus, scans for signatures of selection in introgressed genomic regions could be valuable research targets in future studies.

4.3. Species Integrity within the P. mugo Complex

Due to introgression and hybridization between related species, the tree-like, bifurcating phylogeny is difficult or even impossible as widespread introgression across the genome will result in many genes with incongruent phylogenies. Thus, in case of frequent introgression, the maximum likelihood or most probable species tree from a series of genes may reflect proper relationships between taxa as a phylogeny consistent across the whole genome might not exist [92]. In systems like the pine taxa studied here, where successive divergence occurred relatively quickly, and the possibility of hybridization between both sister and no-sister species prevailed for long enough, we should rather seek phylogenetic webs or reticulate networks instead of a phylogenetic tree [92]. Nevertheless, despite interspecific gene flow, largely shared neutral polymorphism and reticulation events evident in the evolution of pines from the P. mugo complex and P. sylvestris, they maintain their distinct morphological and ecological features. The species can be recognized phenotypically and show patterns of local adaptations related to temperature, water availability, pathogen resistance, or photoperiod [93,94]. Such species integrity was found to be preserved due to natural selection in spite of gene flow and interspecific hybridization in other trees, such as oaks, poplars, and eucalyptuses [95]. Under the model of speciation with gene flow, a divergence between populations and species is considered mainly driven by directional selection in a few genomic regions, harboring genes associated with adaptation to different habitats, and it is accompanied by generally low levels of genetic differentiation at other loci in the genome [5]. Predictions regarding the heterogeneous genomic landscape of differentiation were recently confirmed in diverging populations of various taxa [96,97,98,99]. Ecological differences are evident within the P. mugo complex, including P. uliginosa adapted to peat-bog environments and P. mugo and P. uncinata adapted to mountain regions of Europe that reflects the species divergence in phenology and growth of young trees under common garden experiments [93]. However, the molecular basis of the species’ adaptive variation to specific environmental variables is still mostly unknown.
Detailed inspections of species-specific niche envelopes within this complex are required to guide further studies of adaptively important traits associated with species divergence and maintenance of species integrity. The ability to conduct genome scans in search of loci under selection was restricted only to sets of candidate genes [45,100] as until recently, access to genomic resources was seriously imposed by the extremely large and complex genomes of pines [101,102]. However, the recent development of the transcriptome sequence of the species and the Affymetrix ~50 k SNPs array [103] overcomes the limitations of earlier studies, and genome-wide analyses are now feasible. Those studies should advance the search for genomic landscapes of divergence and selection to better understand the genetic basis of adaptation and speciation with interspecific gene flow.

5. Conclusions

Our study demonstrates the complex evolutionary history of the investigated taxa with strong patterns of reticulated rather than strictly bifurcating divergence as a result of speciation with a significant interspecific gene flow. Consequently, the taxa of P. mugo complex share much of the neutral genetic variation, different genes yield contrasting phylogenies, and the majority consensus tree could be the best approximation of species genetic relatedness. However, despite past hybridization and introgression, the species integrity is maintained through ecological and morphological differences, most likely due to selection at specific genomic regions and local adaptation to slightly disjunct environmental envelopes. Considering novel genomic resources and analytical tools recently developed for the investigated species, the pines could be useful to search for loci involved in the species phenotypic and ecological divergence.

Supplementary Materials

The following are available online at https://www.mdpi.com/article/10.3390/f12040489/s1, Figure S1: Schematic representation of the 16 demographic models tested in fastsimcoal2, Figure S2: Distribution of genetic differentiation (FST) in pairwise comparisons between four studied pines and an outgroup P. pinaster based on all variable sites in a set of 48 nuclear loci, Figure S3: Number of shared polymorphisms between studied species in pairwise comparisons across all of the 48 nuclear loci studied, Figure S4: Net between-species divergence per site: (A), and number of shared polymorphisms: (B) in pairwise comparisons averaged across 48 nuclear loci, Figure S5: The results of the principal component analysis (PCA) showing differentiation of species (P. pinaster included as an outgroup) by the first two principal axes, Figure S6: The results of likelihood estimate and Evanno method for STRUCTURE runs, Figure S7: Phylogenetic relationships (ML tree) of 132 samples of P. uliginosa, P. mugo, P. uncinata and P. sylvestris rooted with P. pinaster based on the concatenated sequence of 48 nuclear loci, Table S1: Location samples analysed, Table S2: Nuclear loci studied, Table S3: Summary statistics at each locus in four pine species, Table S4: Maximum likelihood and Akaike statistics for all 16 evolutionary models tested in fastsimcoal2.

Author Contributions

Conceptualization, B.Ł., and W.W.; methodology, B.Ł., and W.W; formal molecular analysis B.Ł.; computer data analysis, B.Ł.; writing—original draft preparation, B.Ł., and W.W.; writing—review and editing, B.Ł., and W.W.; supervision, funding acquisition, W.W. All authors have read and agreed to the published version of the manuscript.

Funding

This research was funded by Polish National Science Centre, grant number UMO-2015/19/B/NZ9/00024.

Data Availability Statement

The dataset supporting results of this publication are available online at Dryad DOI:10.5061/dryad.qfttdz0gs.

Acknowledgments

The authors would like to thank Mateusz Konczal from the Evolutionary Biology Group at the Faculty of Biology, Adam Mickiewicz University in Poznań, for granting access to the computing cluster, which enabled data analysis required for this manuscript. We thank Delphine Grivet from the National Institute for Agricultural and Food Research and Technology (INIA) in Spain for providing us the P. pinaster seeds used in the study.

Conflicts of Interest

The authors declare no conflict of interest.

References

  1. Hendry, A.P. Ecological speciation! Or the lack thereof? Can. J. Fish. Aquat. Sci. 2009, 66, 1383–1398. [Google Scholar] [CrossRef] [Green Version]
  2. Mallet, J. Hybridization, ecological races and the nature of species: Empirical evidence for the ease of speciation. Philos. Trans. R. Soc. Lond. B Biol. Sci. 2008, 363, 2971–2986. [Google Scholar] [CrossRef] [Green Version]
  3. Galtier, N. Delineating species in the speciation continuum: A proposal. Evol. Appl. 2019, 12, 657–663. [Google Scholar] [CrossRef] [PubMed] [Green Version]
  4. Nosil, P. Speciation with gene flow could be common. Mol. Ecol. 2008, 17, 2103–2106. [Google Scholar] [CrossRef]
  5. Feder, J.L.; Egan, S.P.; Nosil, P. The genomics of speciation-with-gene-flow. Trends Genet. 2012, 28, 342–350. [Google Scholar] [CrossRef]
  6. Martin, S.H.; Dasmahapatra, K.K.; Nadeau, N.J.; Salazar, C.; Walters, J.R.; Simpson, F.; Blaxter, M.; Manica, A.; Mallet, J.; Jiggins, C.D. Genome-wide evidence for speciation with gene flow in Heliconius butterflies. Genome Res. 2013, 23, 1817–1828. [Google Scholar] [CrossRef] [Green Version]
  7. Gailing, O.; Curtu, A.L. Interspecific gene flow and maintenance of species integrity in oaks. Ann. For. Res. 2014, 57, 5–18. [Google Scholar] [CrossRef] [Green Version]
  8. Schumer, M.; Rosenthal, G.G.; Andolfatto, P. How common is homoploid hybrid speciation? Evolution 2014, 68, 1553–1560. [Google Scholar] [CrossRef] [PubMed]
  9. Gao, J.; Wang, B.S.; Mao, I.F.; Ingvarsson, P.; Zeng, Q.Y.; Wang, X.R. Demography and speciation history of the homoploid hybrid pine Pinus densata on the Tibetan Plateau. Mol. Ecol. 2012, 21, 4811–4827. [Google Scholar] [CrossRef] [PubMed]
  10. Arnold, M.L. Evolution through Genetic Exchange; Oxford University Press: Oxford, UK, 2007; pp. 1–252. [Google Scholar] [CrossRef]
  11. Lamichhaney, S.; Han, F.; Webster, M.T.; Andersson, L.; Grant, B.R.; Grant, P.R. Rapid hybrid speciation in Darwin’s finches. Science 2018, 359, 224–228. [Google Scholar] [CrossRef] [PubMed] [Green Version]
  12. Ru, D.; Sun, Y.; Wang, D.; Chen, Y.; Wang, T.; Hu, Q.; Abbott, R.J.; Liu, J. Population genomic analysis reveals that homoploid hybrid speciation can be a lengthy process. Mol. Ecol. 2018, 27, 4875–4887. [Google Scholar] [CrossRef] [Green Version]
  13. Mallet, J. Hybridization as an invasion of the genome. Trends Ecol. Evol. 2005, 20, 229–237. [Google Scholar] [CrossRef] [PubMed]
  14. Nieto Feliner, G.; Álvarez, I.; Fuertes-Aguilar, J.; Heuertz, M.; Marques, I.; Moharrek, F.; Piñeiro, R.; Riina, R.; Rosselló, J.A.; Soltis, P.S.; et al. Is homoploid hybrid speciation that rare? An empiricist’s view. Heredity 2017, 118, 513–516. [Google Scholar] [CrossRef] [Green Version]
  15. Harrison, R.G.; Larson, E.L. Hybridization, introgression, and the nature of species boundaries. J. Hered. 2014, 105, 795–809. [Google Scholar] [CrossRef] [Green Version]
  16. Nosil, P.; Funk, D.J.; Ortiz-Barrientos, D. Divergent selection and heterogeneous genomic divergence. Mol. Ecol. 2009, 18, 375–402. [Google Scholar] [CrossRef]
  17. Bickford, D.; Lohman, D.J.; Sodhi, N.S.; Ng, P.K.L.; Meier, R.; Winker, K.; Ingram, K.K.; Das, I. Cryptic species as a window on diversity and conservation. Trends Ecol. Evol. 2007, 22, 148–155. [Google Scholar] [CrossRef]
  18. Grant, P.R.; Grant, B.R. Unpredictable Evolution in a 30-Year Study of Darwin’s Finches. Science 2002, 296, 707–711. [Google Scholar] [CrossRef] [PubMed] [Green Version]
  19. O’Donnell, K.; Ward, T.J.; Robert, V.A.R.G.; Crous, P.W.; Geiser, D.M.; Kang, S. DNA sequence-based identification of Fusarium: Current status and future directions. Phytoparasitica 2015, 43, 583–595. [Google Scholar] [CrossRef] [Green Version]
  20. Harbach, R.E. Culex pipiens: Species versus species complex taxonomic history and perspective. J. Am. Mosq. Control Assoc. 2012, 28, 10–23. [Google Scholar] [CrossRef]
  21. Welch, M.E.; Rieseberg, L.H. Habitat divergence between a homoploid hybrid sunflower species, Helianthus paradoxus (Asteraceae), and its progenitors. Am. J. Bot. 2002, 89, 472–478. [Google Scholar] [CrossRef]
  22. Crespo, M.; Azorín, M.; Mavrodiev, E. Can a rainbow consist of a single colour? A new comprehensive generic arrangement of the ‘Iris sensu latissimo‘ clade (Iridaceae), congruent with morphology and molecular data. Phytotaxa 2015, 232, 1–78. [Google Scholar] [CrossRef]
  23. Bucci, G.; Anzidei, M.; Madaghiele, A.; Vendramin, G.G. Detection of haplotypic variation and natural hybridization in halepensis-complex pine species using chloroplast simple sequence repeat (SSR) markers. Mol. Ecol. 1998, 7, 1633–1643. [Google Scholar] [CrossRef]
  24. Yeh, F.; Ye, T.; Yang, R.-C. Multilocus structure in the Pinus contortaPinus banksiana complex. Can. J. Bot. 2007, 85, 774–784. [Google Scholar] [CrossRef]
  25. Sun, Y.; Abbott, R.J.; Lu, Z.; Mao, K.; Zhang, L.; Wang, X.; Ru, D.; Liu, J. Reticulate evolution within a spruce (Picea) species complex revealed by population genomic analysis. Evolution 2018, 72, 2669–2681. [Google Scholar] [CrossRef] [Green Version]
  26. Moeller, M.; Gao, L.-M.; Mill, R.; Liu, J.; Zhang, D.-Q.; Poudel, R.; Li, D.-Z. A multidisciplinary approach reveals hidden taxonomic diversity in the morphologically challenging Taxus wallichiana complex. Taxon 2013, 62, 1161–1177. [Google Scholar] [CrossRef] [Green Version]
  27. Pons, J.; Barraclough, T.G.; Gomez-Zurita, J.; Cardoso, A.; Duran, D.P.; Hazell, S.; Kamoun, S.; Sumlin, W.D.; Vogler, A.P. Sequence-Based Species Delimitation for the DNA Taxonomy of Undescribed Insects. Syst. Biol. 2006, 55, 595–609. [Google Scholar] [CrossRef] [PubMed] [Green Version]
  28. Knowles, L.L.; Carstens, B.C. Delimiting Species without Monophyletic Gene Trees. Syst. Biol. 2007, 56, 887–895. [Google Scholar] [CrossRef] [PubMed] [Green Version]
  29. Naciri, Y.; Linder, H.P. Species delimitation and relationships: The dance of the seven veils. Taxon 2015, 64, 3–16. [Google Scholar] [CrossRef]
  30. Via, S. Natural selection in action during speciation. Proc. Natl. Acad. Sci. USA 2009, 106, 9939–9946. [Google Scholar] [CrossRef] [Green Version]
  31. Christensen, K.L. Taxonomic revision of the Pinus mugo complex and P. rhaetica (P. mugo sylvestris) (Pinaceae). Nord. J. Bot. 1987, 7, 383–408. [Google Scholar] [CrossRef]
  32. Farjon, A. A Handbook of the World’s Conifers (2 Vols.): Revised and Updated Edition; Brill: Leiden, The Netherlands, 2010. [Google Scholar]
  33. Łabiszak, B.; Zaborowska, J.; Wachowiak, W. Patterns of mtDNA variation reveal complex evolutionary history of relict and endangered peat bog pine (Pinus uliginosa). AoB Plants 2019, 11. [Google Scholar] [CrossRef]
  34. Wachowiak, W.; Zukowska, W.B.; Wojkiewicz, B.; Cavers, S.; Litkowiec, M. Hybridization in contact zone between temperate European pine species. Tree Genet. Genomes 2016, 12. [Google Scholar] [CrossRef] [Green Version]
  35. Businský, R.; Kirschner, J. Pinus mugo and P. uncinata as parents of hybrids a taxonomic and nomenclatural survey. Phyton 2010, 50, 27–57. [Google Scholar]
  36. Wachowiak, W.; Palme, A.E.; Savolainen, O. Speciation history of three closely related pines Pinus mugo (T.), P. uliginosa (N.) and P. sylvestris (L.). Mol. Ecol. 2011, 20, 1729–1743. [Google Scholar] [CrossRef] [PubMed]
  37. Dzialuk, A.; Boratyńska, K.; Romo, A.; Boratyński, A. Taxonomic and geographic variation of the Pinus mugo complex on chloroplast microsatellite markers. Syst. Biodivers. 2017, 15, 464–479. [Google Scholar] [CrossRef] [Green Version]
  38. Krzakowa, M.; Naganowska, B.; Bobowicz, M.A. Investigations on taxonomic status of Pinus uliginosa Neumann. Bull. Soc. Pol. Acad. Sci. 1984, 24, 87–96. [Google Scholar]
  39. Boratynska, K.; Boratynski, A. Taxonomic differences among closely related pines Pinus sylvestris, P. mugo, P. uncinata, P. rotundata and P. uliginosa as revealed in needle sclerenchyma cells. Flora 2007, 202, 555–569. [Google Scholar] [CrossRef]
  40. Lewandowski, A.; Boratynski, A.; Mejnartowicz, L. Allozyme investigations on the genetic differentiation between closely related pines—Pinus sylvestris, P. mugo, P. uncinata, and P. uliginosa (Pinaceae). Plant Syst. Evol. 2000, 221, 15–24. [Google Scholar] [CrossRef]
  41. Żukowska, W.B.; Wachowiak, W. Utility of closely related taxa for genetic studies of adaptive variation and speciation: Current state and perspectives in plants with focus on forest tree species. J. Syst. Evol. 2016, 54, 17–28. [Google Scholar] [CrossRef]
  42. Newton, A.C.; Allnutt, T.R.; Gillies, A.C.M.; Lowe, A.J.; Ennos, R.A. Molecular phylogeography, intraspecific variation and the conservation of tree species. Trends Ecol. Evol. 1999, 14, 140–145. [Google Scholar] [CrossRef]
  43. Frankham, R.; Ballou, J.D.; Briscoe, D.A. Introduction to Conservation Genetics, 2nd ed.; Cambridge University Press: Cambridge, UK; New York, NY, USA, 2010; 618p. [Google Scholar]
  44. Allendorf, F.W.; Luikart, G.H.; Aitken, S.N. Conservation and the Genetics of Populations; Wiley: Hoboken, NJ, USA, 2012. [Google Scholar]
  45. Wachowiak, W.; Zaborowska, J.; Labiszak, B.; Perry, A.; Zucca, G.M.; Gonzalez-Martinez, S.C.; Cavers, S. Molecular signatures of divergence and selection in closely related pine taxa. Tree Genet. Genomes 2018, 14, 83. [Google Scholar] [CrossRef] [PubMed] [Green Version]
  46. Rozas, J.; Ferrer-Mata, A.; Sanchez-DelBarrio, J.C.; Guirao-Rico, S.; Librado, P.; Ramos-Onsins, S.E.; Sanchez-Gracia, A. DnaSP 6: DNA Sequence Polymorphism Analysis of Large Data Sets. Mol. Biol. Evol. 2017, 34, 3299–3302. [Google Scholar] [CrossRef] [PubMed]
  47. Tajima, F. Statistical method for testing the neutral mutation hypothesis by DNA polymorphism. Genetics 1989, 123, 585–595. [Google Scholar] [CrossRef]
  48. Hudson, R.R.; Kaplan, N.L. Statistical properties of the number of recombination events in the history of a sample of DNA sequences. Genetics 1985, 111, 147–164. [Google Scholar] [CrossRef]
  49. Weir, B.S.; Cockerham, C.C. Estimating F-Statistics for the Analysis of Population Structure. Evolution 1984, 38, 1358–1370. [Google Scholar] [CrossRef]
  50. Hey, J.; Wakeley, J. A coalescent estimator of the population recombination rate. Genetics 1997, 145, 833–846. [Google Scholar] [CrossRef] [PubMed]
  51. Kassambara, A. Ggpubr: ‘Ggplot2’ Based Publication Ready Plots. Available online: https://CRAN.R-project.org/package=ggpubr (accessed on 15 January 2021).
  52. R Core Team. R: A Language and Environment for Statistical Computing; R Foundation for Statistical Computing: Vienna, Austria, 2020; Available online: https://www.R-project.org (accessed on 15 December 2020).
  53. Tang, Y.; Horikoshi, M.; Li, W.X. ggfortify: Unified Interface to Visualize Statistical Results of Popular R Packages. R J. 2016, 8, 474–485. [Google Scholar] [CrossRef] [Green Version]
  54. Pritchard, J.K.; Stephens, M.; Donnelly, P. Inference of population structure using multilocus genotype data. Genetics 2000, 155, 945–959. [Google Scholar]
  55. Falush, D.; Stephens, M.; Pritchard, J.K. Inference of population structure using multilocus genotype data: Dominant markers and null alleles. Mol. Ecol. Notes 2007, 7, 574–578. [Google Scholar] [CrossRef]
  56. Hubisz, M.J.; Falush, D.; Stephens, M.; Pritchard, J.K. Inferring weak population structure with the assistance of sample group information. Mol. Ecol. Resour. 2009, 9, 1322–1332. [Google Scholar] [CrossRef] [Green Version]
  57. Evanno, G.; Regnaut, S.; Goudet, J. Detecting the number of clusters of individuals using the software STRUCTURE: A simulation study. Mol. Ecol. 2005, 14, 2611–2620. [Google Scholar] [CrossRef] [Green Version]
  58. Francis, R.M. pophelper: An R package and web app to analyse and visualize population structure. Mol. Ecol. Resour. 2017, 17, 27–32. [Google Scholar] [CrossRef] [Green Version]
  59. Darriba, D.; Taboada, G.L.; Doallo, R.; Posada, D. jModelTest 2: More models, new heuristics and parallel computing. Nat. Methods 2012, 9, 772. [Google Scholar] [CrossRef] [Green Version]
  60. Stamatakis, A. RAxML version 8: A tool for phylogenetic analysis and post-analysis of large phylogenies. Bioinformatics 2014, 30, 1312–1313. [Google Scholar] [CrossRef] [PubMed]
  61. Than, C.; Ruths, D.; Nakhleh, L. PhyloNet: A software package for analyzing and reconstructing reticulate evolutionary relationships. BMC Bioinform. 2008, 9, 322. [Google Scholar] [CrossRef] [PubMed] [Green Version]
  62. Wen, D.; Yu, Y.; Zhu, J.; Nakhleh, L. Inferring Phylogenetic Networks Using PhyloNet. Syst. Biol. 2018, 67, 735–740. [Google Scholar] [CrossRef] [PubMed]
  63. Elworth, R.; Ogilvie, H.; Zhu, J.; Nakhleh, L. Advances in Computational Methods for Phylogenetic Networks in the Presence of Hybridization. Bioinform. Phylogenet. 2019, 29, 317–360. [Google Scholar] [CrossRef] [Green Version]
  64. Durand, E.Y.; Patterson, N.; Reich, D.; Slatkin, M. Testing for Ancient Admixture between Closely Related Populations. Mol. Biol. Evol. 2011, 28, 2239–2252. [Google Scholar] [CrossRef] [PubMed] [Green Version]
  65. Ward, B.J.; van Oosterhout, C. hybridcheck: Software for the rapid detection, visualization and dating of recombinant regions in genome sequence data. Mol. Ecol. Resour. 2016, 16, 534–539. [Google Scholar] [CrossRef]
  66. Excoffier, L.; Foll, M. fastsimcoal: A continuous-time coalescent simulator of genomic diversity under arbitrarily complex evolutionary scenarios. Bioinformatics 2011, 27, 1332–1334. [Google Scholar] [CrossRef] [Green Version]
  67. Excoffier, L.; Dupanloup, I.; Huerta-Sanchez, E.; Sousa, V.C.; Foll, M. Robust demographic inference from genomic and SNP data. PLoS Genet. 2013, 9. [Google Scholar] [CrossRef] [Green Version]
  68. Excoffier, L.; Lischer, H.E.L. Arlequin suite ver 3.5: A new series of programs to perform population genetics analyses under Linux and Windows. Mol. Ecol. Resour. 2010, 10, 564–567. [Google Scholar] [CrossRef]
  69. Meier, J. Fsc-selectbestrun.sh. GitHub Repository. 2018. Available online: https://github.com/speciationgenomics/scripts/blob/master/fsc-selectbestrun.sh (accessed on 15 December 2020).
  70. Meier, J. calculateAIC.R. GitHub Repository. 2018. Available online: https://github.com/speciationgenomics/scripts/blob/master/calculateAIC.sh (accessed on 15 December 2020).
  71. Li, Y.; Stocks, M.; Hemmila, S.; Kallman, T.; Zhu, H.; Zhou, Y.; Chen, J.; Liu, J.; Lascoux, M. Demographic histories of four spruce (Picea) species of the Qinghai-Tibetan Plateau and neighboring areas inferred from multiple nuclear loci. Mol. Biol. Evol. 2010, 27, 1001–1014. [Google Scholar] [CrossRef] [PubMed] [Green Version]
  72. De La Torre, A.R.; Li, Z.; Van de Peer, Y.; Ingvarsson, P.K. Contrasting rates of molecular evolution and patterns of selection among Gymnosperms and flowering plants. Mol. Biol. Evol. 2017, 34, 1363–1377. [Google Scholar] [CrossRef] [PubMed] [Green Version]
  73. Davison, A.; Hinkley, D. Bootstrap Methods and Their Application. J. Am. Stat. Assoc. 1997, 94. [Google Scholar] [CrossRef]
  74. Rosenberg, N.A. The shapes of neutral gene genealogies in two species: Probabilities of monophyly, paraphyly, and polyphyly in a coalescent model. Evolution 2003, 57, 1465–1477. [Google Scholar] [CrossRef] [PubMed]
  75. Heuertz, M.; Teufel, J.; González-Martínez, S.C.; Soto, A.; Fady, B.; Alía, R.; Vendramin, G.G. Geography determines genetic relationships between species of mountain pine (Pinus mugo complex) in western Europe. J. Biogeogr. 2010, 37, 541–556. [Google Scholar] [CrossRef] [Green Version]
  76. Łabiszak, B.; Zaborowska, J.; Wójkiewicz, B.; Wachowiak, W. Molecular and paleo-climatic data uncover the impact of an ancient bottleneck on the demographic history and contemporary genetic structure of endangered Pinus uliginosa. J. Syst. Evol. 2019. [Google Scholar] [CrossRef]
  77. Willyard, A.; Cronn, R.; Liston, A. Reticulate evolution and incomplete lineage sorting among the Ponderosa pines. Mol. Phylogenet. Evol. 2009, 52, 498–511. [Google Scholar] [CrossRef]
  78. Li, J.; Milne, R.I.; Ru, D.; Miao, J.; Tao, W.; Zhang, L.; Xu, J.; Liu, J.; Mao, K. Allopatric divergence and hybridization within Cupressus chengiana (Cupressaceae), a threatened conifer in the northern Hengduan Mountains of western China. Mol. Ecol. 2020, 29, 1250–1266. [Google Scholar] [CrossRef]
  79. Wachowiak, W.; Prus-Glowacki, W. Hybridisation processes in sympatric populations of pines Pinus sylvestris L., P. mugo Turra and P. uliginosa Neumann. Plant Syst. Evol. 2008, 271, 29–40. [Google Scholar] [CrossRef]
  80. Sobierajska, K.; Wachowiak, W.; Zaborowska, J.; Labiszak, B.; Wojkiewicz, B.; Sekiewicz, M.; Jasinska, A.K.; Sekiewicz, K.; Boratynska, K.; Marcysiak, K.; et al. Genetic consequences of hybridization in relict isolated trees Pinus sylvestris and the Pinus mugo complex. Forests 2020, 11, 1086. [Google Scholar] [CrossRef]
  81. Kormutak, A.; Galgoci, M.; Sukenikova, D.; Bolecek, P.; Libantova, J.; Gőmőry, D. Maternal inheritance of chloroplast DNA in Pinus mugo Turra: A case study of Pinus mugo × Pinus sylvestris crossing. Plant Syst. Evol. 2018, 304, 71–76. [Google Scholar] [CrossRef]
  82. Zaborowska, J.; Łabiszak, B.; Wachowiak, W. Population history of European mountain pines Pinus mugo and Pinus uncinata revealed by mitochondrial DNA markers. J. Syst. Evol. 2019. [Google Scholar] [CrossRef]
  83. McLachlan, J.S.; Clark, J.S. Reconstructing historical ranges with fossil data at continental scales. For. Ecol. Manag. 2004, 197, 139–147. [Google Scholar] [CrossRef]
  84. Willis, K.J.; van Andel, T.H. Trees or no trees? The Environments of central and eastern Europe during the last glaciation. Quat. Sci. Rev. 2004, 23. [Google Scholar] [CrossRef]
  85. Wojkiewicz, B.; Litkowiec, M.; Wachowiak, W. Contrasting patterns of genetic variation in core and peripheral populations of highly outcrossing and wind pollinated forest tree species. Aob Plants 2016, 8. [Google Scholar] [CrossRef] [PubMed] [Green Version]
  86. Hebda, A.; Wójkiewicz, B.; Wachowiak, W. Genetic characteristics of Scots pine in Poland and reference populations based on nuclear and chloroplast microsatellite markers. Silva Fenn. 2017, 51. [Google Scholar] [CrossRef] [Green Version]
  87. Baack, E.J.; Rieseberg, L.H. A genomic view of introgression and hybrid speciation. Curr. Opin. Genet. Dev. 2007, 17, 513–518. [Google Scholar] [CrossRef] [Green Version]
  88. Kwit, C.; Moon, H.S.; Warwick, S.I.; Stewart, C.N. Transgene introgression in crop relatives: Molecular evidence and mitigation strategies. Trends Biotechnol. 2011, 29, 284–293. [Google Scholar] [CrossRef]
  89. Ellstrand, N.C.; Meirmans, P.; Rong, J.; Bartsch, D.; Ghosh, A.; de Jong, T.J.; Haccou, P.; Lu, B.-R.; Snow, A.A.; Neal Stewart, C.; et al. Introgression of crop alleles into wild or weedy populations. Annu. Rev. Ecol. Evol. Syst. 2013, 44, 325–345. [Google Scholar] [CrossRef] [Green Version]
  90. Snow, A.A.; Pilson, D.; Rieseberg, L.H.; Paulsen, M.J.; Pleskac, N.; Reagon, M.R.; Wolf, D.E.; Selbo, S.M. A Bt transgene reduces herbivory and enhances fecundity in wild sunflowers. Ecol. Appl. 2003, 13, 279–286. [Google Scholar] [CrossRef] [Green Version]
  91. Hufford, M.B.; Lubinksy, P.; Pyhäjärvi, T.; Devengenzo, M.T.; Ellstrand, N.C.; Ross-Ibarra, J. The genomic signature of crop-wild introgression in maize. PLoS Genet. 2013, 9, e1003477. [Google Scholar] [CrossRef]
  92. Mallet, J.; Besansky, N.; Hahn, M.W. How reticulated are species? Bioessays 2016, 38, 140–149. [Google Scholar] [CrossRef]
  93. Wachowiak, W.; Perry, A.; Donnelly, K.; Cavers, S. Early phenology and growth trait variation in closely related European pine species. Ecol. Evol. 2018, 8, 655–666. [Google Scholar] [CrossRef] [PubMed] [Green Version]
  94. Perry, A.; Wachowiak, W.; Brown, A.V.; Ennos, R.A.; Cottrell, J.E.; Cavers, S. Substantial heritable variation for susceptibility to Dothistroma septosporum within populations of native British Scots pine (Pinus sylvestris). Plant Pathol. 2016, 65, 987–996. [Google Scholar] [CrossRef] [Green Version]
  95. Ortiz-Barrientos, D.; Baack, E.J. Species integrity in trees. Mol. Ecol. 2014, 23, 4188–4191. [Google Scholar] [CrossRef] [PubMed]
  96. Harr, B. Genomic islands of differentiation between house mouse subspecies. Genome Res. 2006, 16, 730–737. [Google Scholar] [CrossRef] [PubMed] [Green Version]
  97. Renaut, S.; Grassa, C.J.; Yeaman, S.; Moyers, B.T.; Lai, Z.; Kane, N.C.; Bowers, J.E.; Burke, J.M.; Rieseberg, L.H. Genomic islands of divergence are not affected by geography of speciation in sunflowers. Nat. Commun. 2013, 4, 1827. [Google Scholar] [CrossRef] [Green Version]
  98. Michel, A.P.; Sim, S.; Powell, T.H.; Taylor, M.S.; Nosil, P.; Feder, J.L. Widespread genomic divergence during sympatric speciation. Proc. Natl. Acad. Sci. USA 2010, 107, 9724–9729. [Google Scholar] [CrossRef] [PubMed] [Green Version]
  99. Poelstra, J.W.; Vijay, N.; Bossu, C.M.; Lantz, H.; Ryll, B.; Muller, I.; Baglione, V.; Unneberg, P.; Wikelski, M.; Grabherr, M.G.; et al. The genomic landscape underlying phenotypic integrity in the face of gene flow in crows. Science 2014, 344, 1410–1414. [Google Scholar] [CrossRef] [PubMed] [Green Version]
  100. Wachowiak, W.; Boratynska, K.; Cavers, S. Geographical patterns of nucleotide diversity and population differentiation in three closely related European pine species in the Pinus mugo complex. Bot. J. Linn. Soc. 2013, 172, 225–238. [Google Scholar] [CrossRef] [Green Version]
  101. Neale, D.B.; Wegrzyn, J.L.; Stevens, K.A.; Zimin, A.V.; Puiu, D.; Crepeau, M.W.; Cardeno, C.; Koriabine, M.; Holtz-Morris, A.E.; Liechty, J.D.; et al. Decoding the massive genome of loblolly pine using haploid DNA and novel assembly strategies. Genome Biol. 2014, 15. [Google Scholar] [CrossRef] [PubMed] [Green Version]
  102. Nystedt, B.; Street, N.R.; Wetterbom, A.; Zuccolo, A.; Lin, Y.C.; Scofield, D.G.; Vezzi, F.; Delhomme, N.; Giacomello, S.; Alexeyenko, A.; et al. The Norway spruce genome sequence and conifer genome evolution. Nature 2013, 497, 579–584. [Google Scholar] [CrossRef] [PubMed] [Green Version]
  103. Perry, A.; Wachowiak, W.; Downing, A.; Talbot, R.; Cavers, S. Development of a single nucleotide polymorphism array for population genomic studies in four European pine species. Mol. Ecol. Resour. 2020, 20, 1697–1705. [Google Scholar] [CrossRef] [PubMed]
Figure 1. Distribution of genetic differentiation (FST) between species pairs based on all variable sites in a set of 48 nuclear loci.
Forests 12 00489 g001
Figure 2. Results of principal component analysis (PCA) showing the differentiation of species by the first two principal axes.
Forests 12 00489 g002
Figure 3. Results of STRUCTURE analysis between studied pine species with (a) and without (b) P. pinaster as outgroup species. The best number of genetic clusters K = 3 and K = 2 (with and without the outgroup, respectively) was indicated by the results of likelihood estimates and the Evano method.
Forests 12 00489 g003
Figure 4. Genetic relationships between P. uliginosa (PUG), P. mugo (PM), P. uncinata (PUN), and P. sylvestris (PS) with P. pinaster (PP) as the outgroup. Three most frequent gene topologies obtained from maximum pseudo-likelihood analysis for a set of 48 gene trees are shown (ac); (d) Maximum pseudolikelihood (MPL) bootstrap network generated by PhyloNet with up to four reticulations allowed. Reticulation events are drawn in blue.
Forests 12 00489 g004
Figure 5. Schematic representation of the best fit model (12) inferred by fastsimcoal2. Detailed demographic parameters for this model are presented in Table 4. Parameters acronyms: NA: ancestral population effective size; N1:N4: effective population sizes for the four studied pines (P. mugo, P. uliginosa, P. uncinata, and P. sylvestris, respectively); T1:T3: time for three divergence events in years; M: migration per generation after the divergence between pairs of species (arrows indicate migration direction).
Forests 12 00489 g005
Table 1. Summary statistic at 48 nuclear loci in four pine species.
SpeciesnL (bp)PSπDRKsHd (SD)
P. uliginosa29.319,4144411550.005245−0.28391.8640.689 (0.066)
P. mugo29.319,4143651540.004039−0.3781.5010.601 (0.071)
P. uncinata29.619,4143631130.004546−0.1481.6560.623 (0.066)
P. sylvestris27.819,4143671280.004576−0.16141.6820.598 (0.073)
n: average number of sequences analyzed per locus; L: total length of the sequence in base pairs excluding indels; P: total number of polymorphic sites; S: total number of singleton mutations; π: average nucleotide diversity; D: Tajima’s D statistic; R: average number of recombination events; Ks: average pairwise divergence per site to the outgroup P. pinaster at all loci; Hd: haplotype diversity (SD standard deviation), none of the D values were statistically significant.
Table 2. Summary statistics for FST and net divergence between species.
Species PairFST ± SDDnet ± SD
P. uliginosa vs. P. mugo0.068 ± 0.0880.00032 ± 0.00042
P. uliginosa vs. P. uncinata0.056 ± 0.0670.00032 ± 0.00046
P. uliginosa vs. P. sylvestris0.167 ± 0.1550.00108 ± 0.00109
P. mugo vs. P. uncinata0.088 ± 0.1040.00054 ± 0.00087
P. sylvestris vs. P. mugo0.260 ± 0.1970.00181 ± 0.00203
P. sylvestris vs. P. uncinata0.142 ± 0.1380.00084 ± 0.00110
Table 3. Results of the ABBA–BABA test.
P1P2P3ADpZ
PMPUGPUNPP0.601ns1.073
PMPUNPUGPP0.161ns1.172
PUNPUGPMPP0.487<0.00013.304
PMPSPUNPP−0.035ns−0.128
PUNPSPMPP0.288<0.051.990
PUNPMPSPP0.320ns1.67
PMPSPUGPP0.516<0.00014.521
PMPUGPSPP0.641<0.00015.057
PMPUGPUNPS0.603ns1.073
PMPUNPUGPS0.183ns1.172
PUNPUGPMPS0.472<0.00013.304
Patterson’s D value for introgression between taxa with Z score and significance values. Acronyms for species: PUG: P. uliginosa; PM: P. mugo; PUN: P. uncinata; PS: P. sylvestris; PP: P. pinaster. Topologies with statistically significant values of D are bolded.
Table 4. Maximum likelihood estimates and 95% confidence intervals of demographic parameters for the best supported model shown in Figure 5.
ParametersPoint EstimateLower Boundof 95% CIUpper Boundof 95% CI
NA1,817,5211,223,6541,511,901
N1406,282353,176674,610
N278,879483988,690
N377,680584281,793
N4554,232508,589761,921
T12,074,6751,403,7632,422,625
T23,999,9253,915,6255,303,234
T35,925,1755,038,7818,507,750
M1→23.28−106.97−119.83−9
M2→11.26−92.30−107.83−8
M1→38.11−83.78−94.00−7
M3→14.91−58.56−61.41−4
M2→31.24−73.15−82.00−7
M3→23.36−56.25−98.75−4
M1→41.62−61.50−61.76−6
M4→11.55−75.71−95.39−6
M2→42.94−56.90−61.06−5
M4→21.55−75.71−95.39−6
M3→46.03−65.38−69.47−6
M4→31.55−75.71−95.39−6
Parameters acronyms: NA: ancestral population effective size; N1:N4: effective population sizes for four studied pines (P. mugo, P. uliginosa, P. uncinata, and P. sylvestris, respectively); T1:T3: time for three divergence events in years; M: migration per generation after the divergence between pairs of species (arrows indicate the migration direction). See Figure 5 for a model summary.
Publisher’s Note: MDPI stays neutral with regard to jurisdictional claims in published maps and institutional affiliations.

