Article

Effects of Vegetation Type on Soil Shear Strength in Fengyang Mountain Nature Reserve, China

1
Co-Innovation Center for Sustainable Forestry in Southern China, Jiangsu Province Key Laboratory of Soil and Water Conservation and Ecological Restoration, Nanjing Forestry University, 159 Longpan Road, Nanjing 210037, China
2
Nanjing Institute of Environmental Sciences, Jiangwangmiao Street, Nanjing 210042, China
3
Nanchang Institute of Technology, College of Water Conservancy and Ecological Engineering, 289 Tianxiang Street, Nanchang Hi-tech Development Zone, Nanchang 330000, China
4
Department of Natural Resource Ecology and Management, Oklahoma State University, Stillwater, OK 74078, USA
*
Author to whom correspondence should be addressed.
These authors contributed equally to this work.
Forests 2021, 12(4), 490; https://doi.org/10.3390/f12040490
Submission received: 9 March 2021 / Revised: 5 April 2021 / Accepted: 13 April 2021 / Published: 16 April 2021
(This article belongs to the Section Forest Ecology and Management)

Abstract

:
Shear strength is an important mechanical property of soil, as its mechanical function plays critical roles in reducing land degradation and preventing soil erosion. However, shear strength may be affected by vegetation type through changes in the soil and root patterns. To understand the influences of different types of vegetation on shear strength, the soil shear indices of three typical vegetation types (broad-leaved forest, coniferous broad-leaved mixed forest, and grassland) were studied and evaluated at the Fengyang Mountain Nature Reserve, China. We employed a direct shear apparatus to measure the soil shear resistance index. We quantified the soil porosity, moisture content, and composition of particle size to determine the properties of the soil, and a root scanner was used to quantify the root index. The results revealed that there were significant differences in shear resistance indices at the stand level. Between the three vegetation types, the internal friction angle of the broad-leaved forest was the largest and the cohesion was the smallest. The soil moisture content and porosity of the coniferous broad-leaved mixed forest were higher than those of the broad-leaved forest, and the root volume density (RVD/cm3) of the broad-leaved forest was higher than that of the coniferous and broad-leaved mixed forest and grassland. Structural equation modeling results show that the soil particle size and root characteristics indirectly impacted the soil water content by affecting porosity, which finally affected shear strength. In general, there were significant differences in soil properties and plant root indices between the different stands, which had an impact on soil shear strength.

1. Introduction

The impacts of global climate change can lead to extreme precipitation cycles that adversely affect the natural environment. Climate and its modification control or affect some of these phenomena; mainly precipitation and temperature [1]. It is expected that changes in precipitation and its indirect effects (such as changes in soil moisture content) will affect slope stability on geographical scales [2], leading to increased erosion and other degradative impacts on slope stability [3]. Geological hazards associated with mountain slopes (e.g., landslides and soil degradation) are frequently reported [4,5]. Landslides involve the movement of soil down a slope under the action of external forces and gravity. Therefore, the study of the effects of different soil types on soil strength has attracted intense attention. The shear strength of soil relates to its resistance to shear stress. Soil strength is one of the most dynamic mechanical attributes of soil, where cultivation, plant growth, and soil and water conservation is vital [6].
A number of studies have revealed that soil manifests its shear strength from two aspects, including cohesion between particles (stress-independent components) and frictional resistance between particles (stress-related components). Soil shear strength is a practicable dynamic index for the evaluation of soil erodibility [7,8]. Improving the mechanical properties of soil through the enhancement of shear resistance is an important facet of rehabilitation programs that have the aim of reducing soil degradation and erosion.
The most common factors that influence the shear strength of topsoil involve the physical characteristics of soil moisture [9], the composition of soil particles [10], and characteristics of plant roots [11]. The reinforcement effects of plant roots on soil have been broadly established [12,13]. Plants can significantly improve the slope stability and prevent soil sliding by reducing the hydrologic mechanisms of pore water pressure [14] and by the mechanical reinforcement of soil through roots. However, in subtropical regions, root reinforcement is considered to contribute more to the stability of shallow soils than hydrological factors [15]. Plant roots provide additional cohesion to the soil, such that soils penetrated by root systems can withstand soil erosion processes far better than soils devoid of roots [16]. Researchers have previously demonstrated that vegetation can improve the soil shear strength and slope stability [17]; thus, vegetation coverage can effectively promote the restoration of slope ecosystems [18]. Reagrding root behavior in soil matrices, there are reliable theoretical models and conclusions [19,20], which are similar to soil nails that are commonly used in geotechnical and environmental engineering. Plant roots transform the shear stress of soil into the tensile force of the root themselves via friction along the root surface interface, so as to mechanically enhance the shear strength of the soil [21].
The root systems of various vegetation have different anti-shear effects on soil, as the root characteristics of different plants are variable. Grasslands have shallow and dense fine root mats, which are considered to be useful in resisting erosion, whereas the roots of woody species can penetrate deeply and fix firmly in the stratum, which can also stabilize the soil layer and optimize the composition of soil particles [22]. Studies have shown that root cohesion is not only affected by root tensile strength but also by the amount of root biomass available. The root biomass strongly depends on the species of vegetation [23]. Therefore, the influence of different vegetation root characteristics on soil shear resistance exists.
Research reveals that fine soil particles exhibit robust adhesion and adsorption capacities, and have good expansibility, viscosity, and water holding abilities. Therefore, the higher the content of fine particles in the soil, the more unfavorable the sliding and occlusive friction between particles, and the smaller the internal friction angle [24]. Furthermore, it has been reported that shear strength is also influenced by soil bulk density and moisture. In general, with increased water content, the cohesion and internal friction angle of soil typically decreases nonlinearly, which is due to the formation of a water film between soil particles with higher water content; thus, the internal friction angle and cohesion are reduced [25]. The shear strength of soil is also increased by lower pore water pressure (matrix potential) [26].
Previous investigations on the impacts of vegetation types focused primarily on physical and chemical properties of soil [27,28], as well as changes in the characteristics of soil microbial communities [29,30]. Research on soil shear has mainly focused on degraded karst and sandy areas that are prone to soil erosion [31,32,33]. Due to loose soil and sparse vegetation, and therefore poor soil stability, soil particles become separated, thus, landslides can occur with strong winds and impacting rain [34].
However, few studies have reported on the effects of vegetation type on soil surface shear strength, particularly in China’s subtropical regions. Due to long-term human disturbances and intensive land-use activities, most of the original vegetation (i.e., evergreen broad-leaved forests) has been seriously degraded or destroyed [35]. Over the last few decades, the Chinese government has conducted forestry ecological projects to promote the vegetation restoration of subtropical primary forests [36]. Consequently, there are many secondary vegetation communities composed of different tree species in subtropical China. It is predicted that the frequency and intensity of extreme climate events (e.g., typhoons, heavy rainfall, etc.) in East and Southeast Asia will increase in the future, leading to an increased risk of landslide in subtropical areas in the coming years [37]. Landslide risks are a function of the probability of occurrence and their consequences. Previous studies have indicated that preventive measures are far better than passive measures to reduce risk; however, such measures are rarely adopted in developing countries [38]. Therefore, it is necessary to study the soil shear resistance of typical vegetation in subtropical China, which can provide a theoretical basis for disaster risk reduction from the perspective of shear strength. The experimental site for this study was the Fengyang Mountain Nature Reserve, China. In 1975, the entire area was declared a nature reserve [39].
Specifically, we tested the following hypotheses: (i) there are differences in the soil moisture characteristics and pH of soil, including the composition of soil particles and root characteristics between different vegetation types; (ii) there are differences in soil shear strength between different vegetation types; and (iii) differences in soil shear strength may be reasonably explained by variances in soil and plant root characteristics.

2. Materials and Methods

2.1. Study Area

This study was conducted at the Fengyang Mountain Nature Reserve (longitude: 119°06′–119°15′ E, latitude: 27°46′–27°58′ N), Longquan City, Zhejiang Province, China. The reserve is situated between 600 m and 1929 m above sea level. It belongs to a subtropical humid climate with an annual average temperature of 12.3 °C and an annual rainfall of 2400 mm. Historically, the reserve was an evergreen broad-leaved forest, dominated by Schima superba Gardn. et Champ., Cyclobalanopsis glauca (Thunberg) Oersted, and Betula luminifera H. Winkl. In 1975, Fengyang Mountain was designated as a nature reserve, and subsequently, the entire study area was protected from human disturbance. The general vegetation composition is shown in Table 1.
The soil type in Fengyang Mountain Nature Reserve is mainly yellow loam, yellow brown, which is widely distributed in the nature reserve, and the soil layer develops early. The general soil configuration is AO-A-B-C. AO stands for litter layer. A layer consists of three layers: litter layer, semi-decomposed organic matter layer, and humus accumulation layer. The litter layer is thicker and the soil is mainly loamy clay or clay loam. The central soil layer of the B layer is 20–40 cm thick, and there is clear delineation between the B layer and A layer. The soil texture is loamy clay, containing partly clay loam and accompanied by gravel. The C layer is a semi-weathered parent rock, the color of which is yellowish-orange, and the soil texture is stony or gravelly sandy loam. The three stands are located in the same geological conditions.

2.2. Sampling

For this study, in August 2017, areas at similar altitudes with three different vegetation types (evergreen broad-leaved forest, mixed forest, and shrub-grass forest) were randomly selected. In each of the three forest types, we selected three stands, resulting in a total of 9 sampling stands. In each sampled stand, a 20 × 20 m2 plot was randomly established to represent the stand and was at least 500 m away from the forest edge. During sampling, two points were taken along a diagonal line in each sample plot and soil profiles were excavated. The soil at a distance of 5 m from the trunk on the diagonal of the quadrate was selected. Since the soil layer below 30 cm contained a lot of gravel, the samples were extracted from the 0–10 cm, 10–20 cm, and 20–30 cm soil layers of slope soil, where each layer was (20 mm high × Ø 61.8 mm). Four replicate samples were extracted from each layer, with a total of 216 soil samples taken from each layer. The samples were sealed with plastic film to determine the shear strength of undisturbed soil and were placed in hermetic boxes and immediately taken to the laboratory. In order to prevent the sampling of the ring knife samples from being disturbed during transportation, we used plastic foam to fix the ring knife to prevent the soil from spreading. Each soil sample was removed from a self-sealed bag and returned to the laboratory for air drying and screening, after which the soil pH and soil particle composition were determined. Next, the undisturbed soil of each layer was immediately transported to the laboratory to quantify the soil physical properties (bulk density, water content, and porosity).

2.3. Soil Moisture Characteristics and pH Analysis

The soil water content (MC, %) was measured by taking the proportion of the loss of mass, after oven-drying at 105 °C, to the constant mass of dry soil. The soil bulk density (BD, g cm−3) was measured using a stainless-steel cylindrical ring of 100 cm3 volume to collect the samples. According to Coulomb’s formula:
B D = ( W W r ) / V
where W (g) is the weight of the ring cutter + the weight of dry soil after drying, Wr (g) is the weight of the empty ring cutter, and V (cm3) is the volume of the ring cutter.
The upper and lower covers of the ring knife were taken off indoors, one end was replaced with a bottom cover with mesh and filter paper, and the ring knife was put into the porcelain plate with a water depth of 2–3 mm. After immersing for 12 h, the water outside the ring knife was wiped off and it was weighed (W1). After weighing, it was immersed in water again. The water surface was up to the upper edge of the ring knife. The soaking time was until the filter paper on the ring knife was fully wet. At that time, the water outside the ring knife was wiped off and it was weighed (W2), and then transferred to the oven at 105 °C [40] for constant weight (W3).
The total soil porosity (SAT, %), non-capillary porosity (NCAP, %) and capillary porosity (CAP, %) were calculated with the formula below [40]:
C A P = W 1 W 3 V × 100
S A T = W 2 W 3 V × 100
N C A P = S A T     C A P
where V (cm3) is the volume of the ring cutter.
Soil grain-size distributions were determined using a laser particle size analyzer (Malvern Mastersizer 2000, Shanghai, China) according to Wei et al. [25]. The soil texture class was identified via an International Society of Soil Science (ISSS) soil texture classification system (clay: <0.002 mm; silt: 0.002–0.02 mm; and sand: 0.02–2 mm) [41].
The pH value was determined by the potential method (water/soil ratio 2.5:1, pH meter).

2.4. Determination and Calculation of Shear Strength

The soil shear strength was measured using a ZJ-2 Isostrain Direct Shear Apparatus (Nanjing Soil instrument factory, Nanjing, China), where the unconsolidated and undrained fast shear test was performed in strict accordance with the “geotechnical experiment specification SL237-1999”. During the determination, it was necessary to keep the natural dry density and moisture content of soil samples within the ring cutter. During shearing, vertical pressures of 100, 200, 300, and 400 kPa were applied, respectively, and the handwheel was rotated at a speed of 10 s/R (six revolutions per minute) until the specimen was sheared.
The shear strength parameters, the cohesion (c) and internal friction angle (φ), were calculated automatically by the software installed on the PC. The calculations were in strict accordance with the Chinese Standards for Soil Test Methods (GB/T50123-1999), with the following equations being used to calculate the results [42]:
τ = C × R
where τ is the shear stress in kPa and C is the calibration coefficient of the dynamometer in kPa/0.01 mm. The calibration coefficient of the dynamometer was 1.825 kPa/0.01 mm; R is the degree of the dynamometer to 0.01 mm.
The shear stresses under different pressures were obtained, according to Coulomb’s formula:
τ = ϲ + σ t a n φ
where σ is the initial normal stress (kPa). The cohesion (ϲ; kPa) and the internal friction angle ( φ ;   ° ) of each group of samples were calculated.

2.5. Determination of Root Characteristics

At the conclusion of the shear strength test, the soil in the ring cutter was removed and washed using a 0.05 mm mesh screen to remove all of the roots in the ring knife. Parameters including the root length, root surface area, and root volume were also determined. Finally, the root system was placed into a paper envelope and dried at 90 °C for 72 h to obtain the root biomass.
The roots were separated from soil samples using a 5 mm mesh sieve, after which the roots were placed in basins with water to be gently washed to remove soil particles and other debris. The roots were scanned and analyzed using the WinRHIZO root analysis system for morphological parameter measurements. The root length density (RLD, cm.cm−3), defined as the total root length per soil volume (mm (100 cm3)−1), root surface area density (RSAD; cm2.cm−3), root volume density (RVD; cm3.cm−3), and root weight density (RWD, mg. cm−3) were estimated [40].

2.6. Statistical Analyses

The Duncan test was used when one-way ANOVA (SPSS Inc., Chicago, IL, USA) revealed that the effects of land use type on shear strength were significant. We examined model residuals and confirmed that the assumptions of normality and homogeneity were met. Two-way ANOVA was employed to test the main effects and interactions of land use type, soil layers on root soil, physical and chemical soil properties, and root index by SPSS 19.0. All histograms were fit using Origin8.5 software. Redundancy discriminant analysis (RDA) was performed to reveal the relationships between the shear strength parameters of root soil, the physical and chemical properties, and root index, using a Canoco 5.0 (Microcomputer Power, Ithaca, NY, USA). Each arrow (usually representing a numeric variable) points in the direction of the steepest increase in environmental variable values. The angle between arrows (alpha) indicates the correlation between individual environmental variables. The approximated correlation is positive when the angle is sharp and negative when the angle is larger than 90 degrees. The length of the arrow is a measure of fit for the indicators.
Structural equation modelling (SEM) was used to investigate the effects of soil characteristics and plant root characteristics on the soil shear strength. The model was used to test whether different vegetation types directly or indirectly affected the soil shear strength by influencing soil and root characteristics. SEM analyses were performed using AMOS 24.0 (SPSS Inc., Chicago, IL, USA).

3. Results

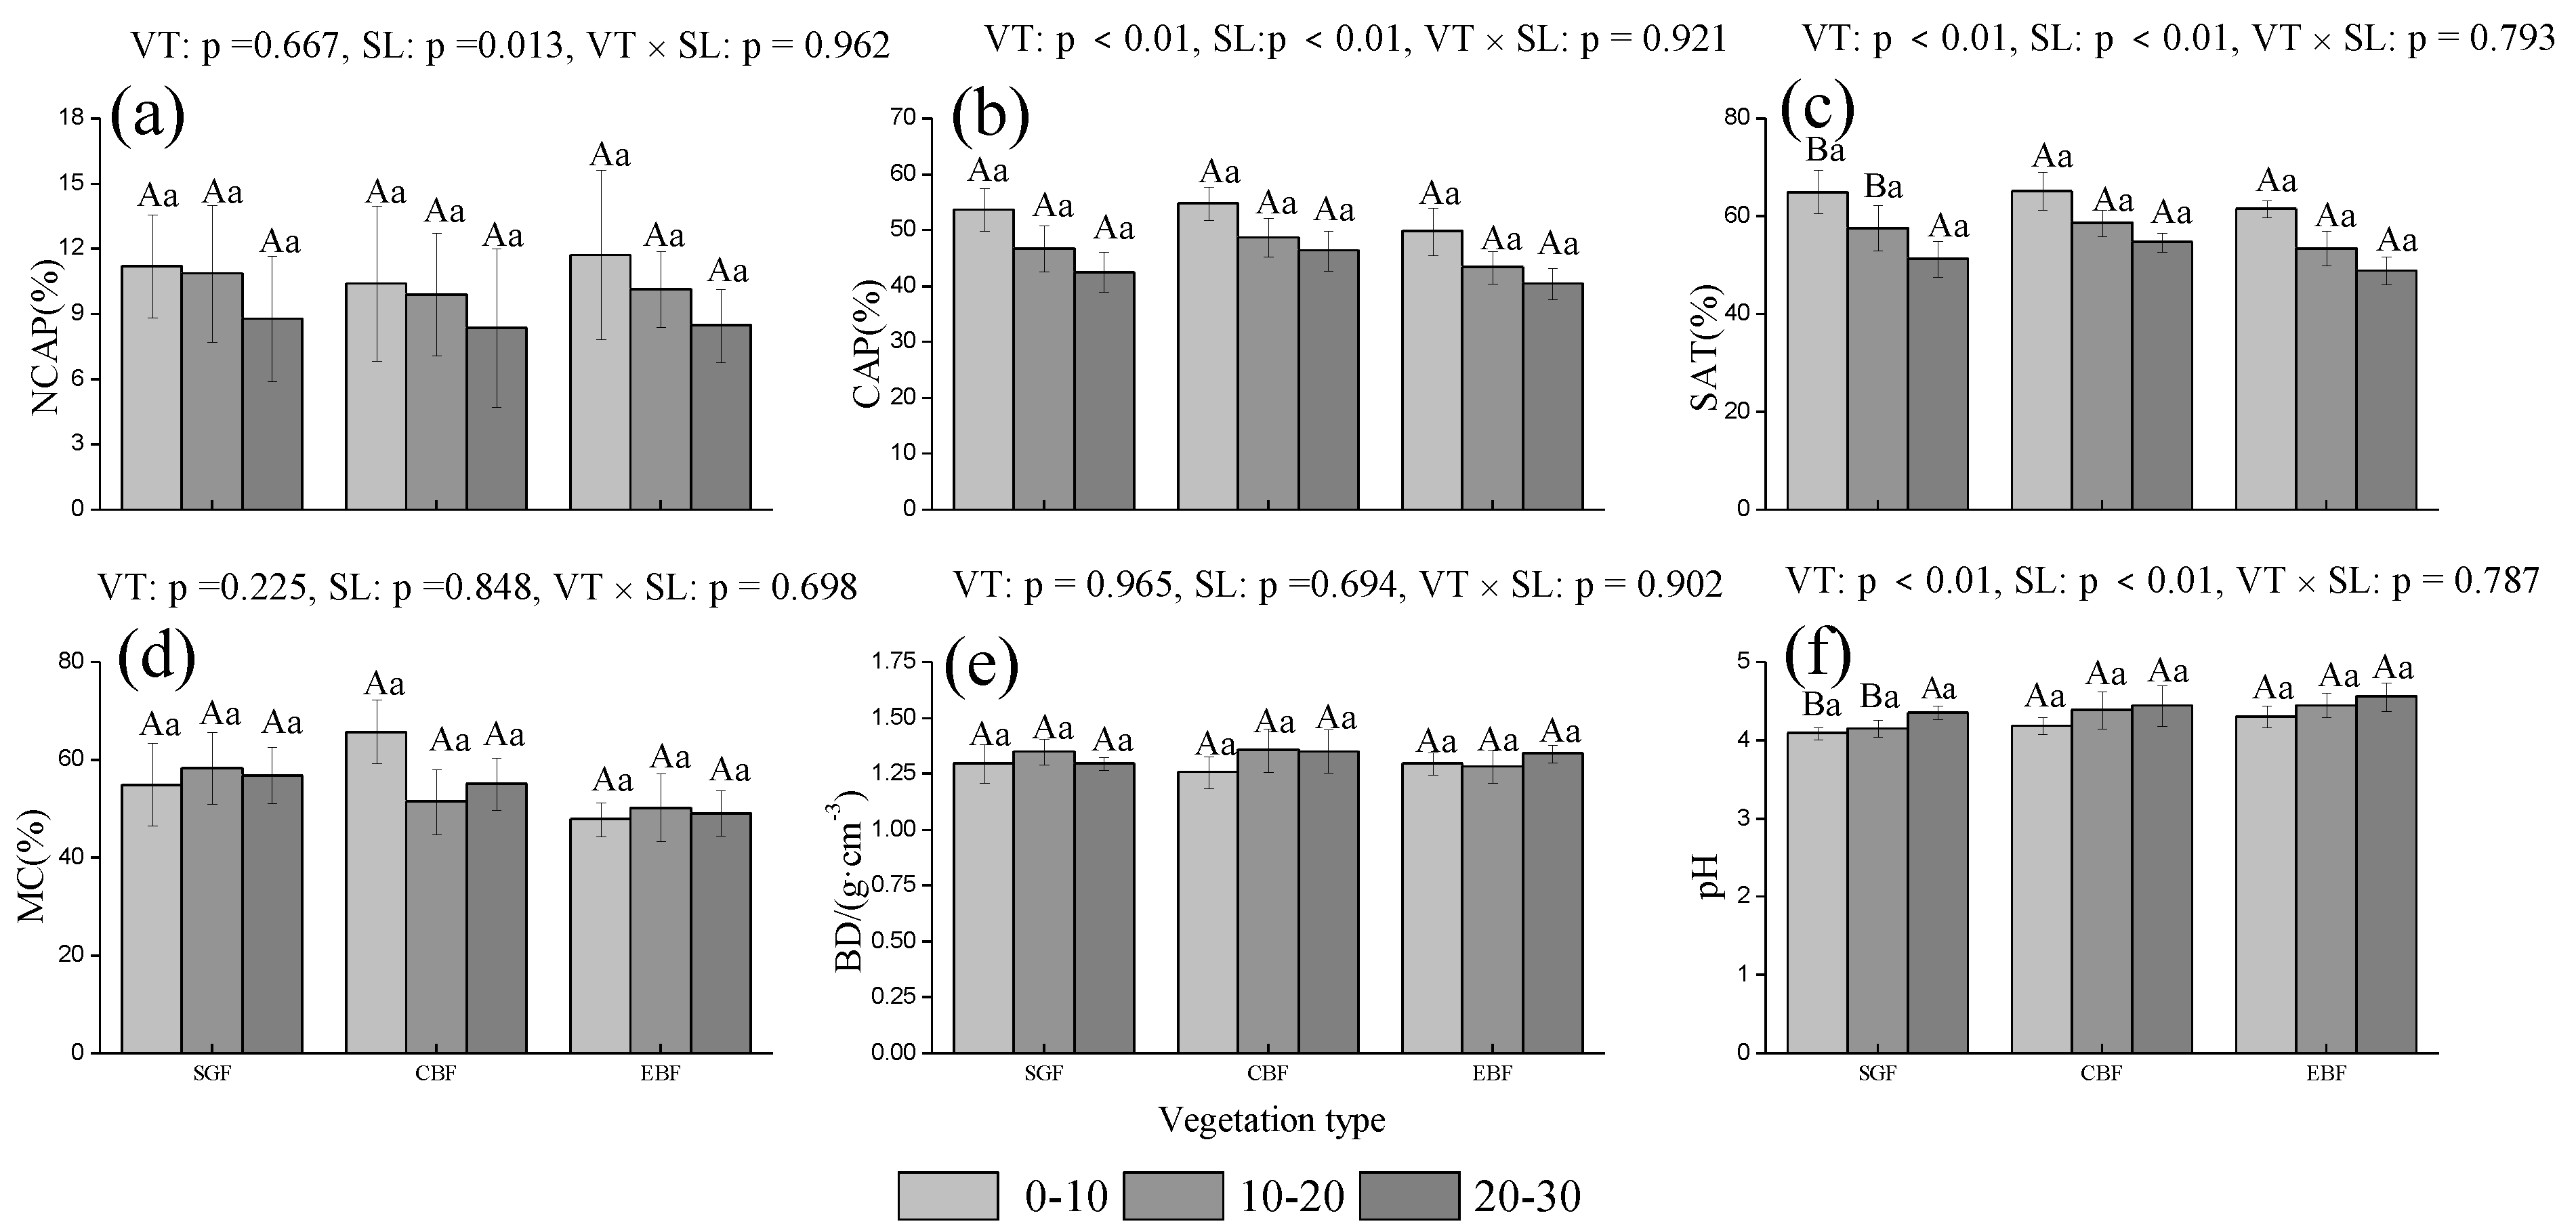
3.1. Soil Moisture Characteristics and pH Value

There were significant differences in the capillary porosity (CAP) (p < 0.01), total porosity (SAT), and pH between different land use types and soil layers (Figure 1b,c,f). Within the deeper soil layers, the non-capillary porosity (NCAP), CAP, and SAT exhibited a downward trend (Figure 1a–c), contrary to the trend in pH (Figure 1f). Compared with the broad-leaved forest, mixed forest and grassland soil samples had larger CAP and SAT values, while the pH and NCAP values were the opposite; however, the differences were not significant. Compared with the native broad-leaved forest and grassland, the moisture content (MC) of mixed forest was slightly larger and the difference was not significant (Figure 1d).

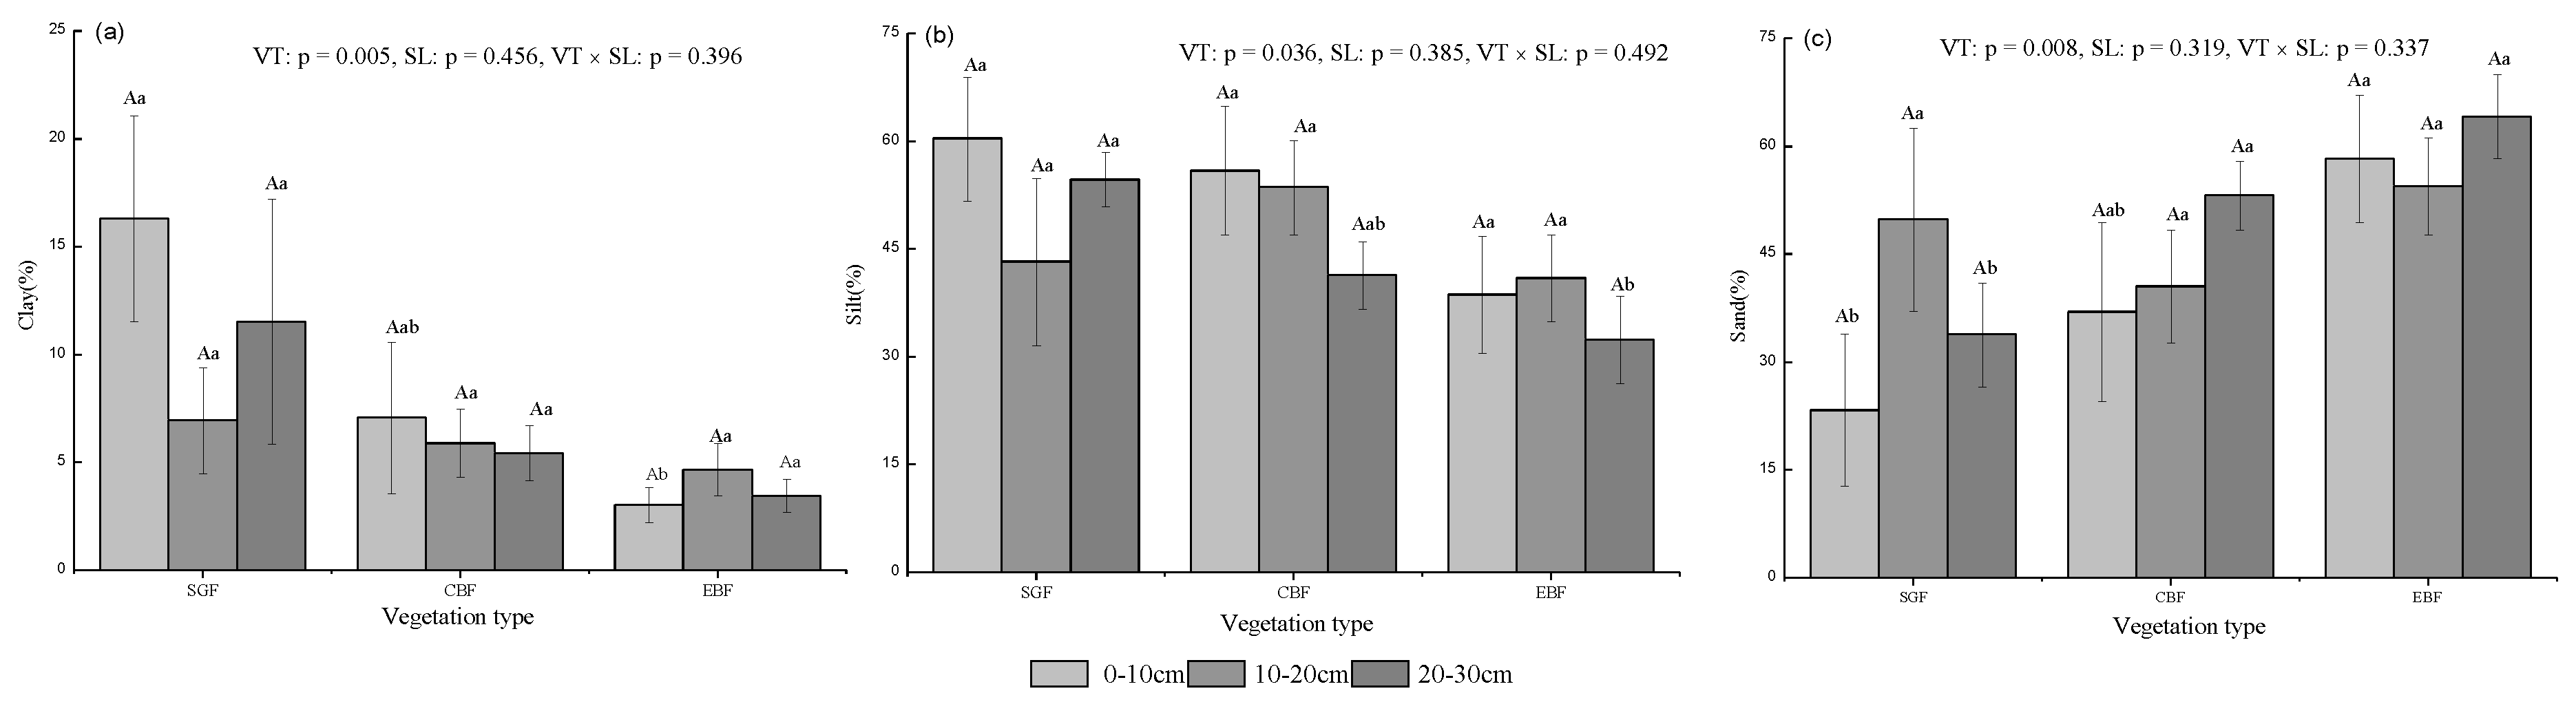
3.2. Soil Particle Composition

The clay, silt, and sand contents of different stands were significantly different (p < 0.05). The contents of clay and silt in the broad-leaved forest were lower than those in the coniferous broad-leaved forest and grassland (Figure 2a,b); however, the content of sand was the highest (Figure 2c). In the deeper soil layers, the content of clay and silt in the three stands exhibited the same change trends. The change trend of sand content in the stands was the opposite, however; the difference was not significant.

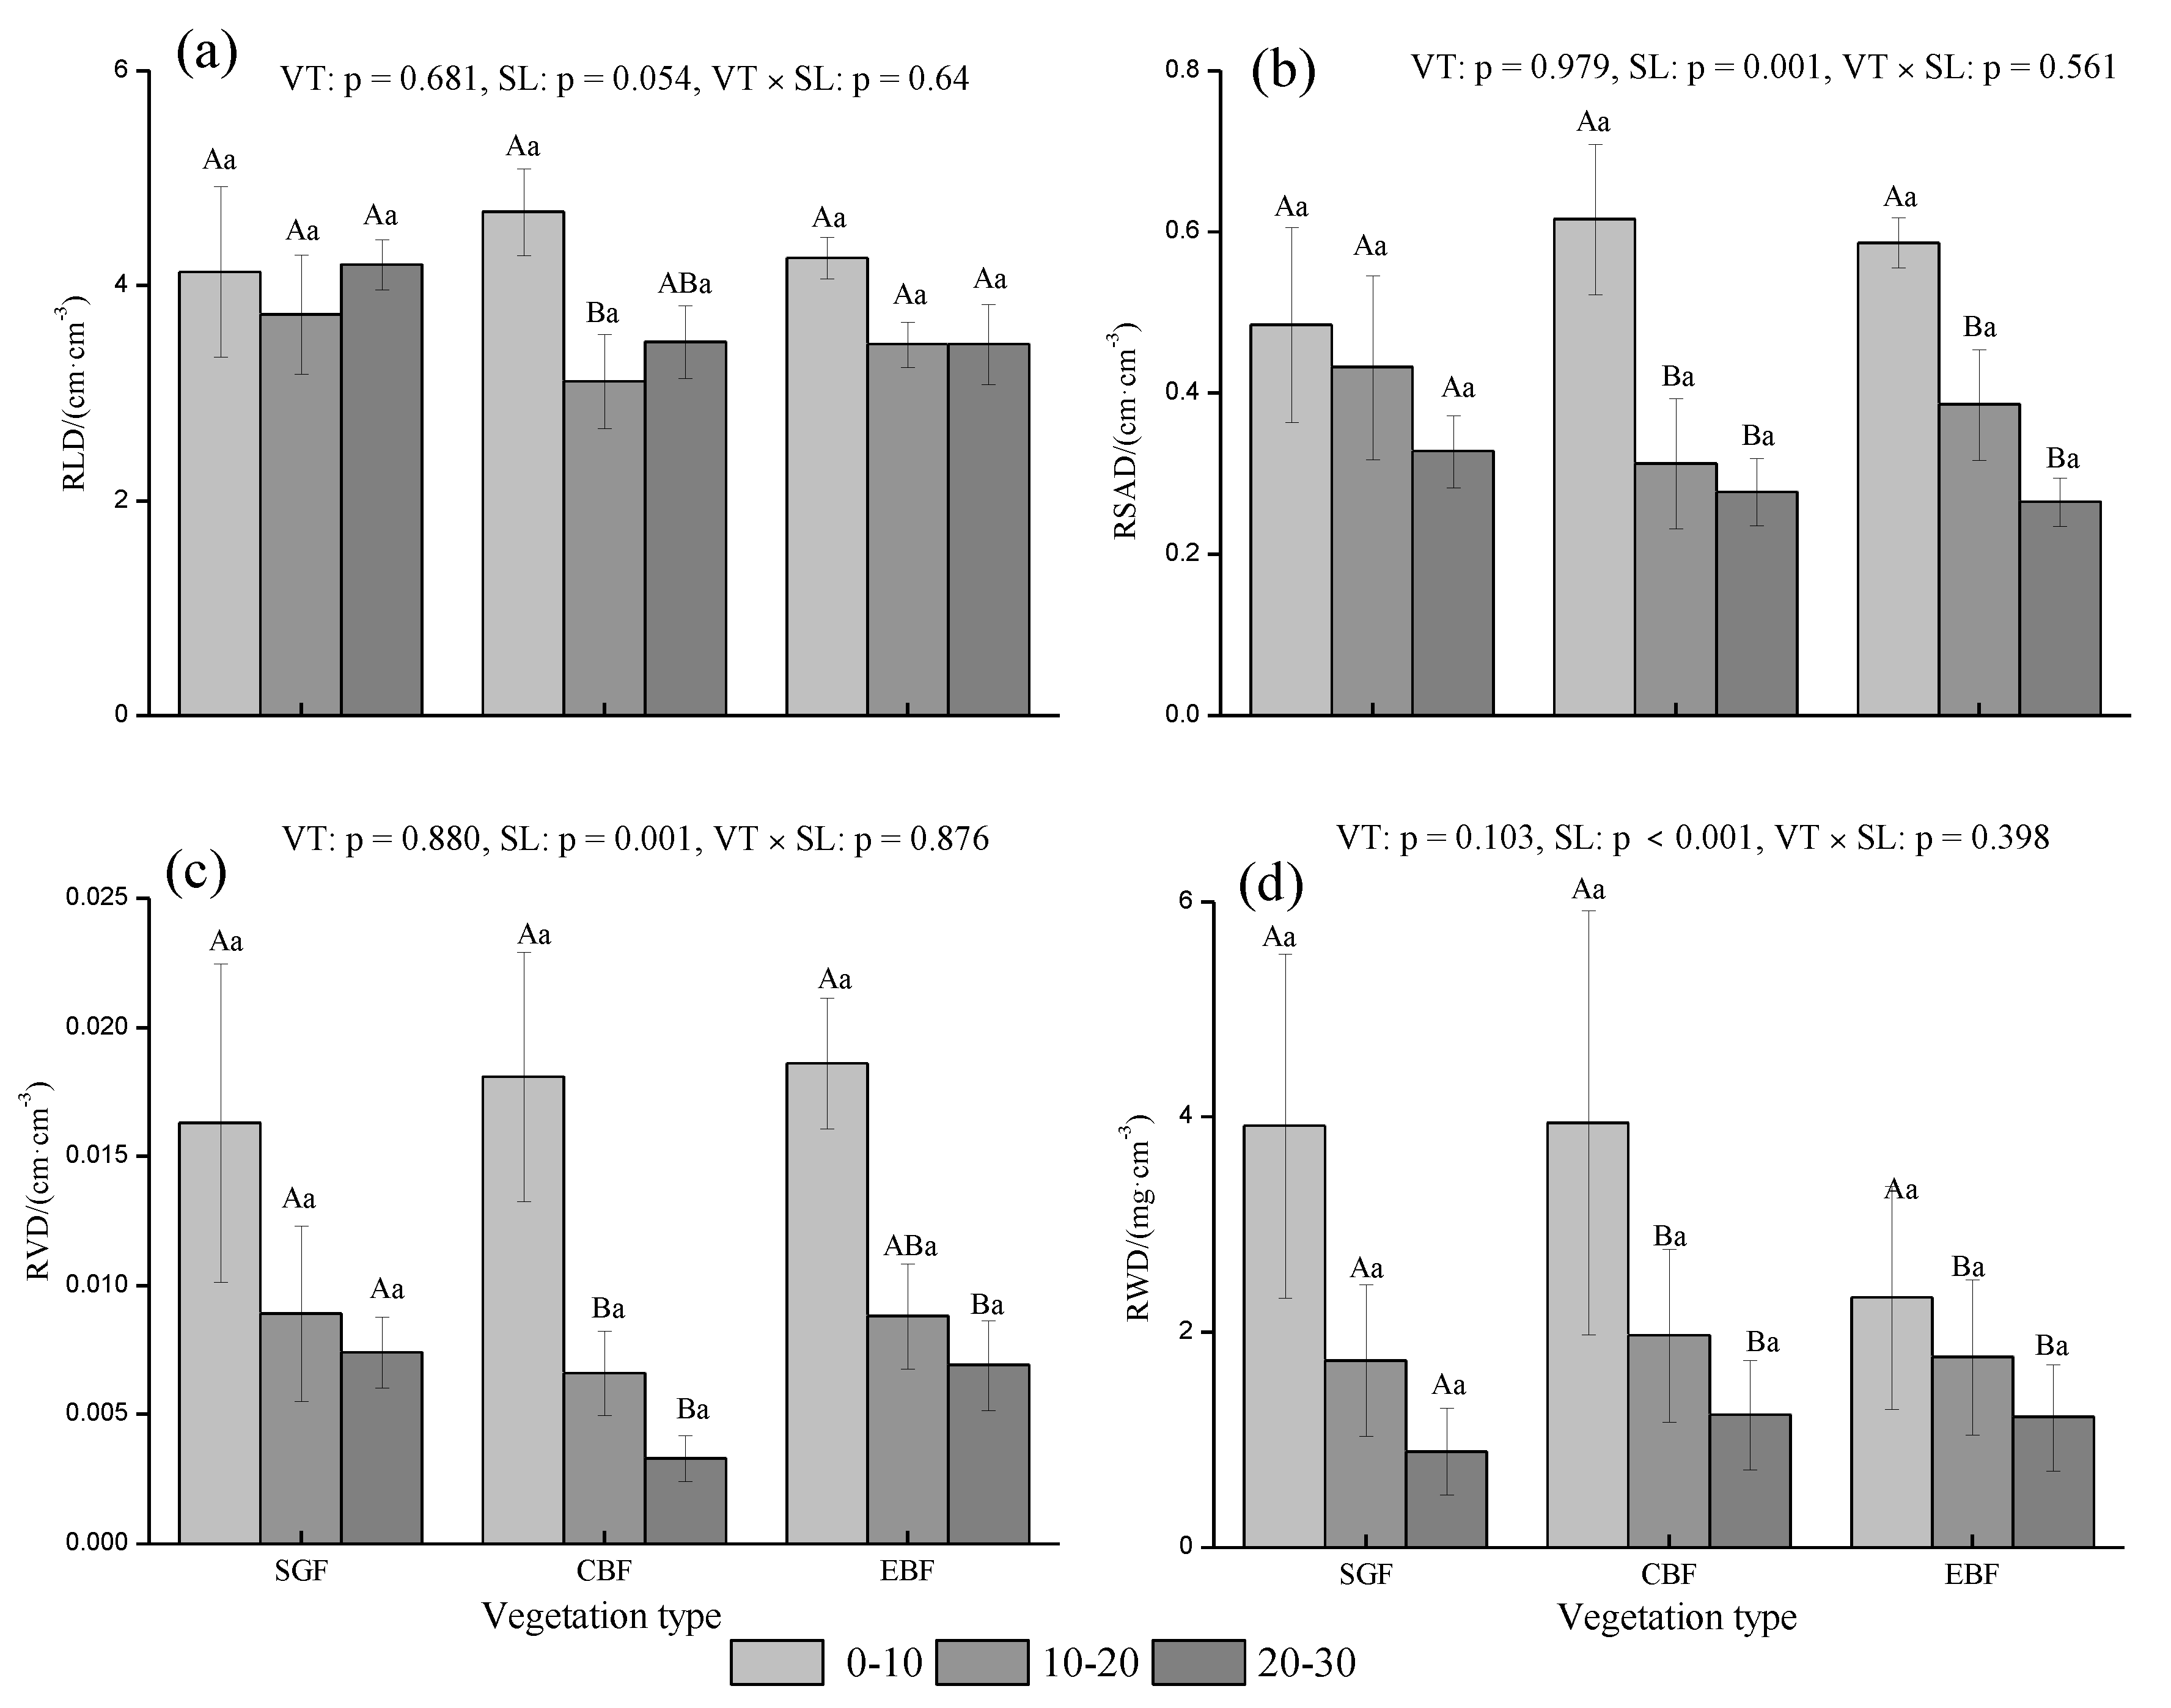
3.3. Root Distribution Characteristics

With deeper soil layers, changes in the root surface area density (RSAD), root volume density (RVD), and root weight density (RWD) in different stands exhibited a downward trend with significant differences (p < 0.01) (Figure 3b–d). In addition to the native broad-leaved forest, the RLD of the coniferous and broad-leaved mixed forest and grassland initially decreased and then increased to attain a significant level in the coniferous and broad-leaved mixed forest (p < 0.05) (Figure 3a).
Compared with broad-leaved forest and grassland, the coniferous and broad-leaved mixed forest had the lowest root length density (RLD), RSAD, and RVD in the 10–20 cm and 20–30 cm soil layers, while the RWD was just the opposite, with no significant difference. The RLD, RSAD, and RWD in the 0–10 cm soil layer of the mixed coniferous and broadleaved forest were the highest; however, the difference was not significant.

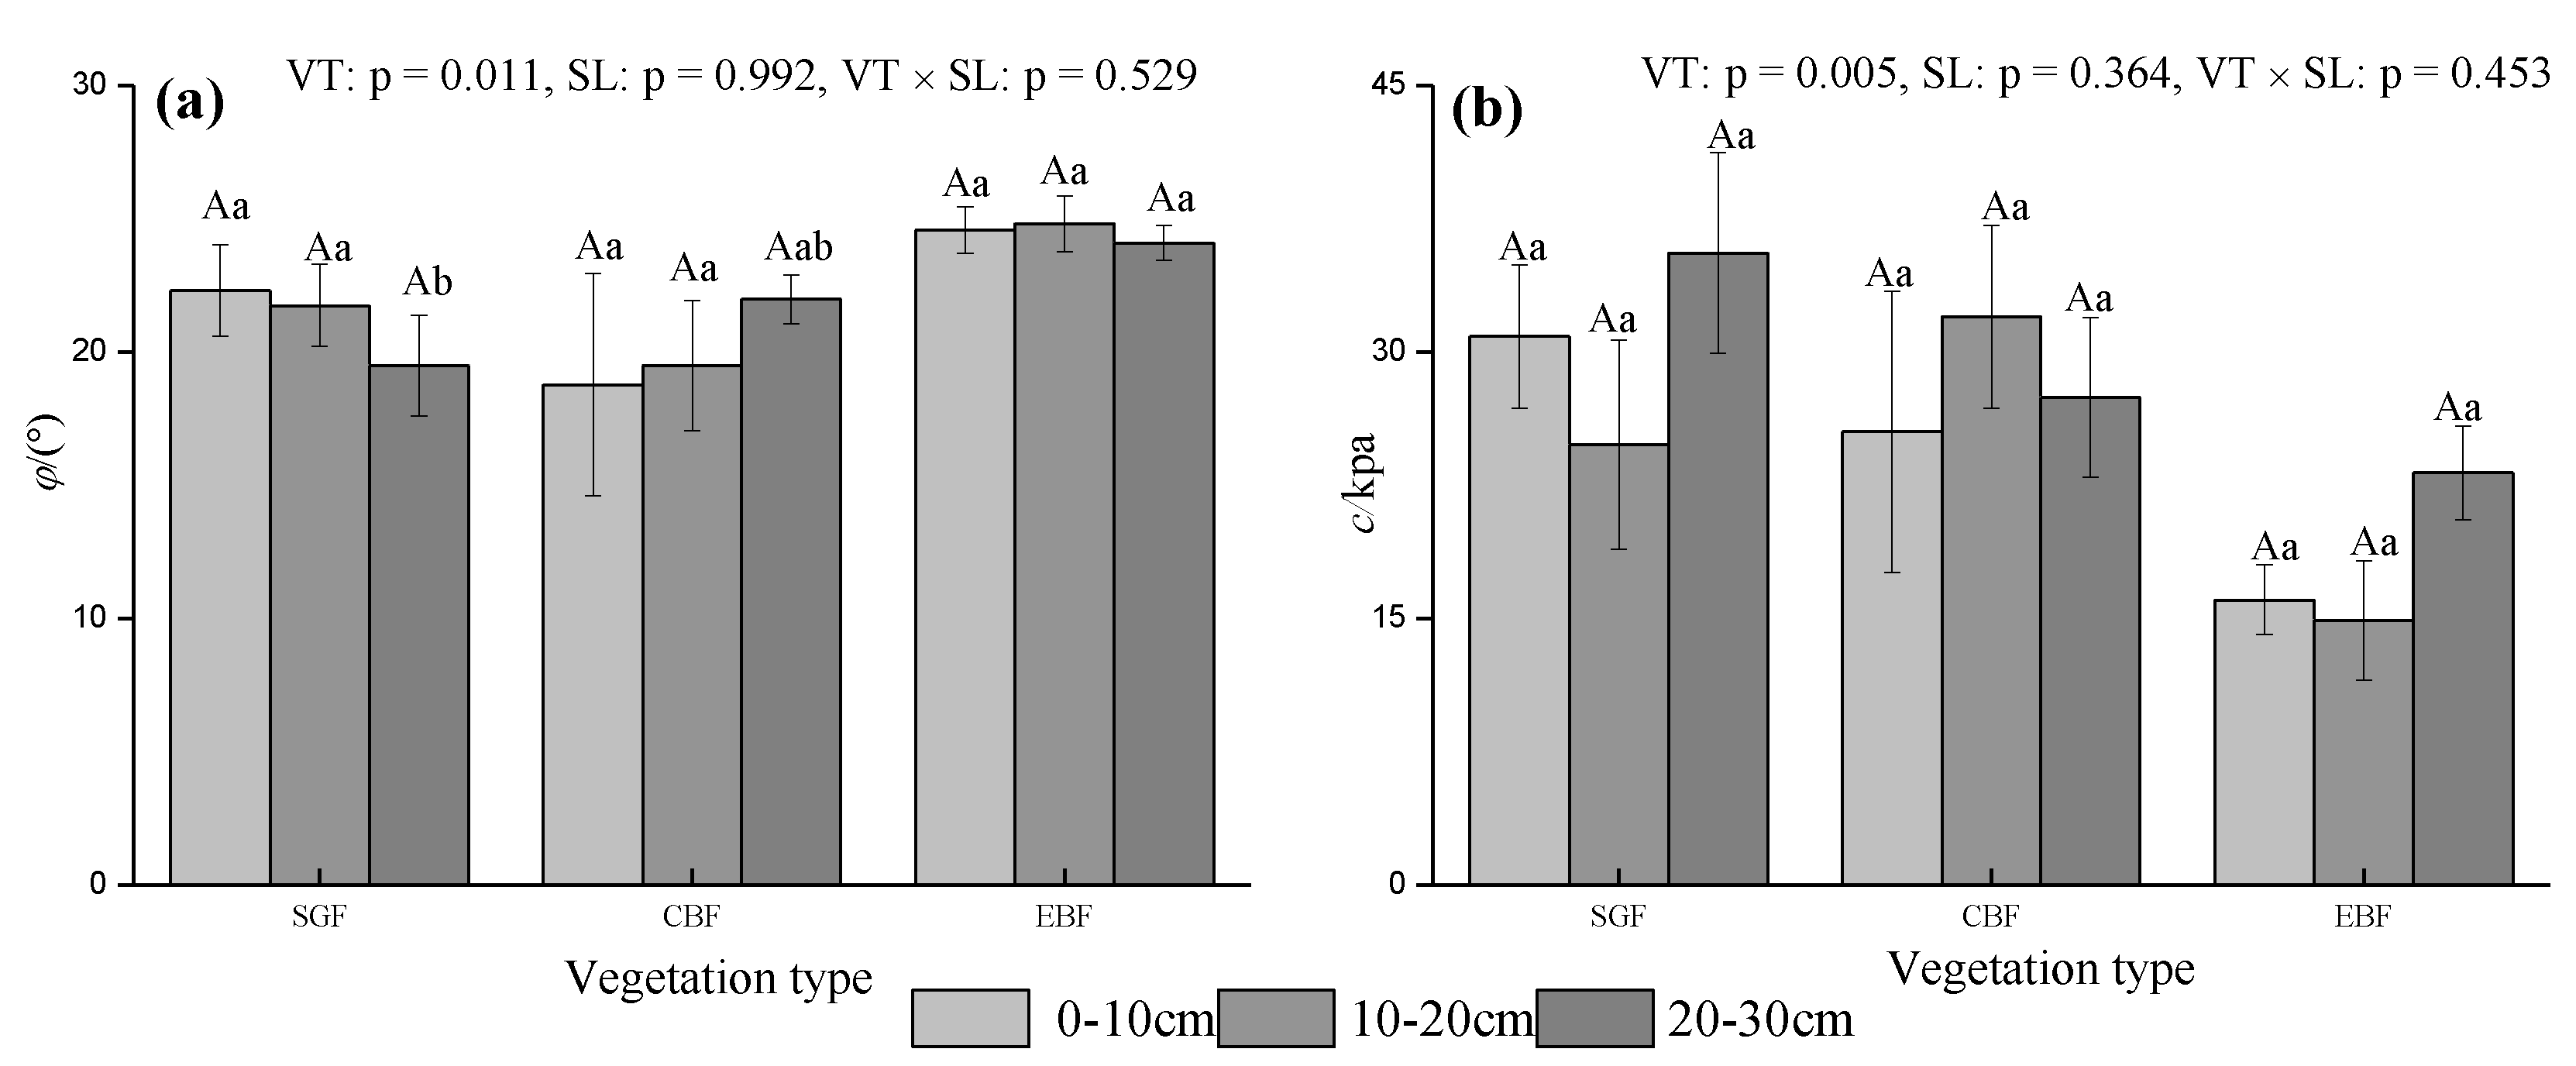
3.4. Shear Strength Parameters of Root Soil

The internal friction angle and cohesion of the different classes of soil were significantly different (p < 0.05) (Figure 4a,b). In different soil layers, the internal friction angle of mixed coniferous and broad-leaved forest was significantly lower than that of the grassland and native broad-leaved forest, while the internal friction angle of broad-leaved forest was the largest (Figure 4a). Moreover, the cohesiveness of the broad-leaved forest soil was significantly lower than that of the mixed broad-leaved forest and grassland (Figure 4b). Except for the 10–20 cm soil layer, the soil cohesiveness of the mixed broad-leaved forest and grassland were the largest, while that of the other soil layers was grassland.

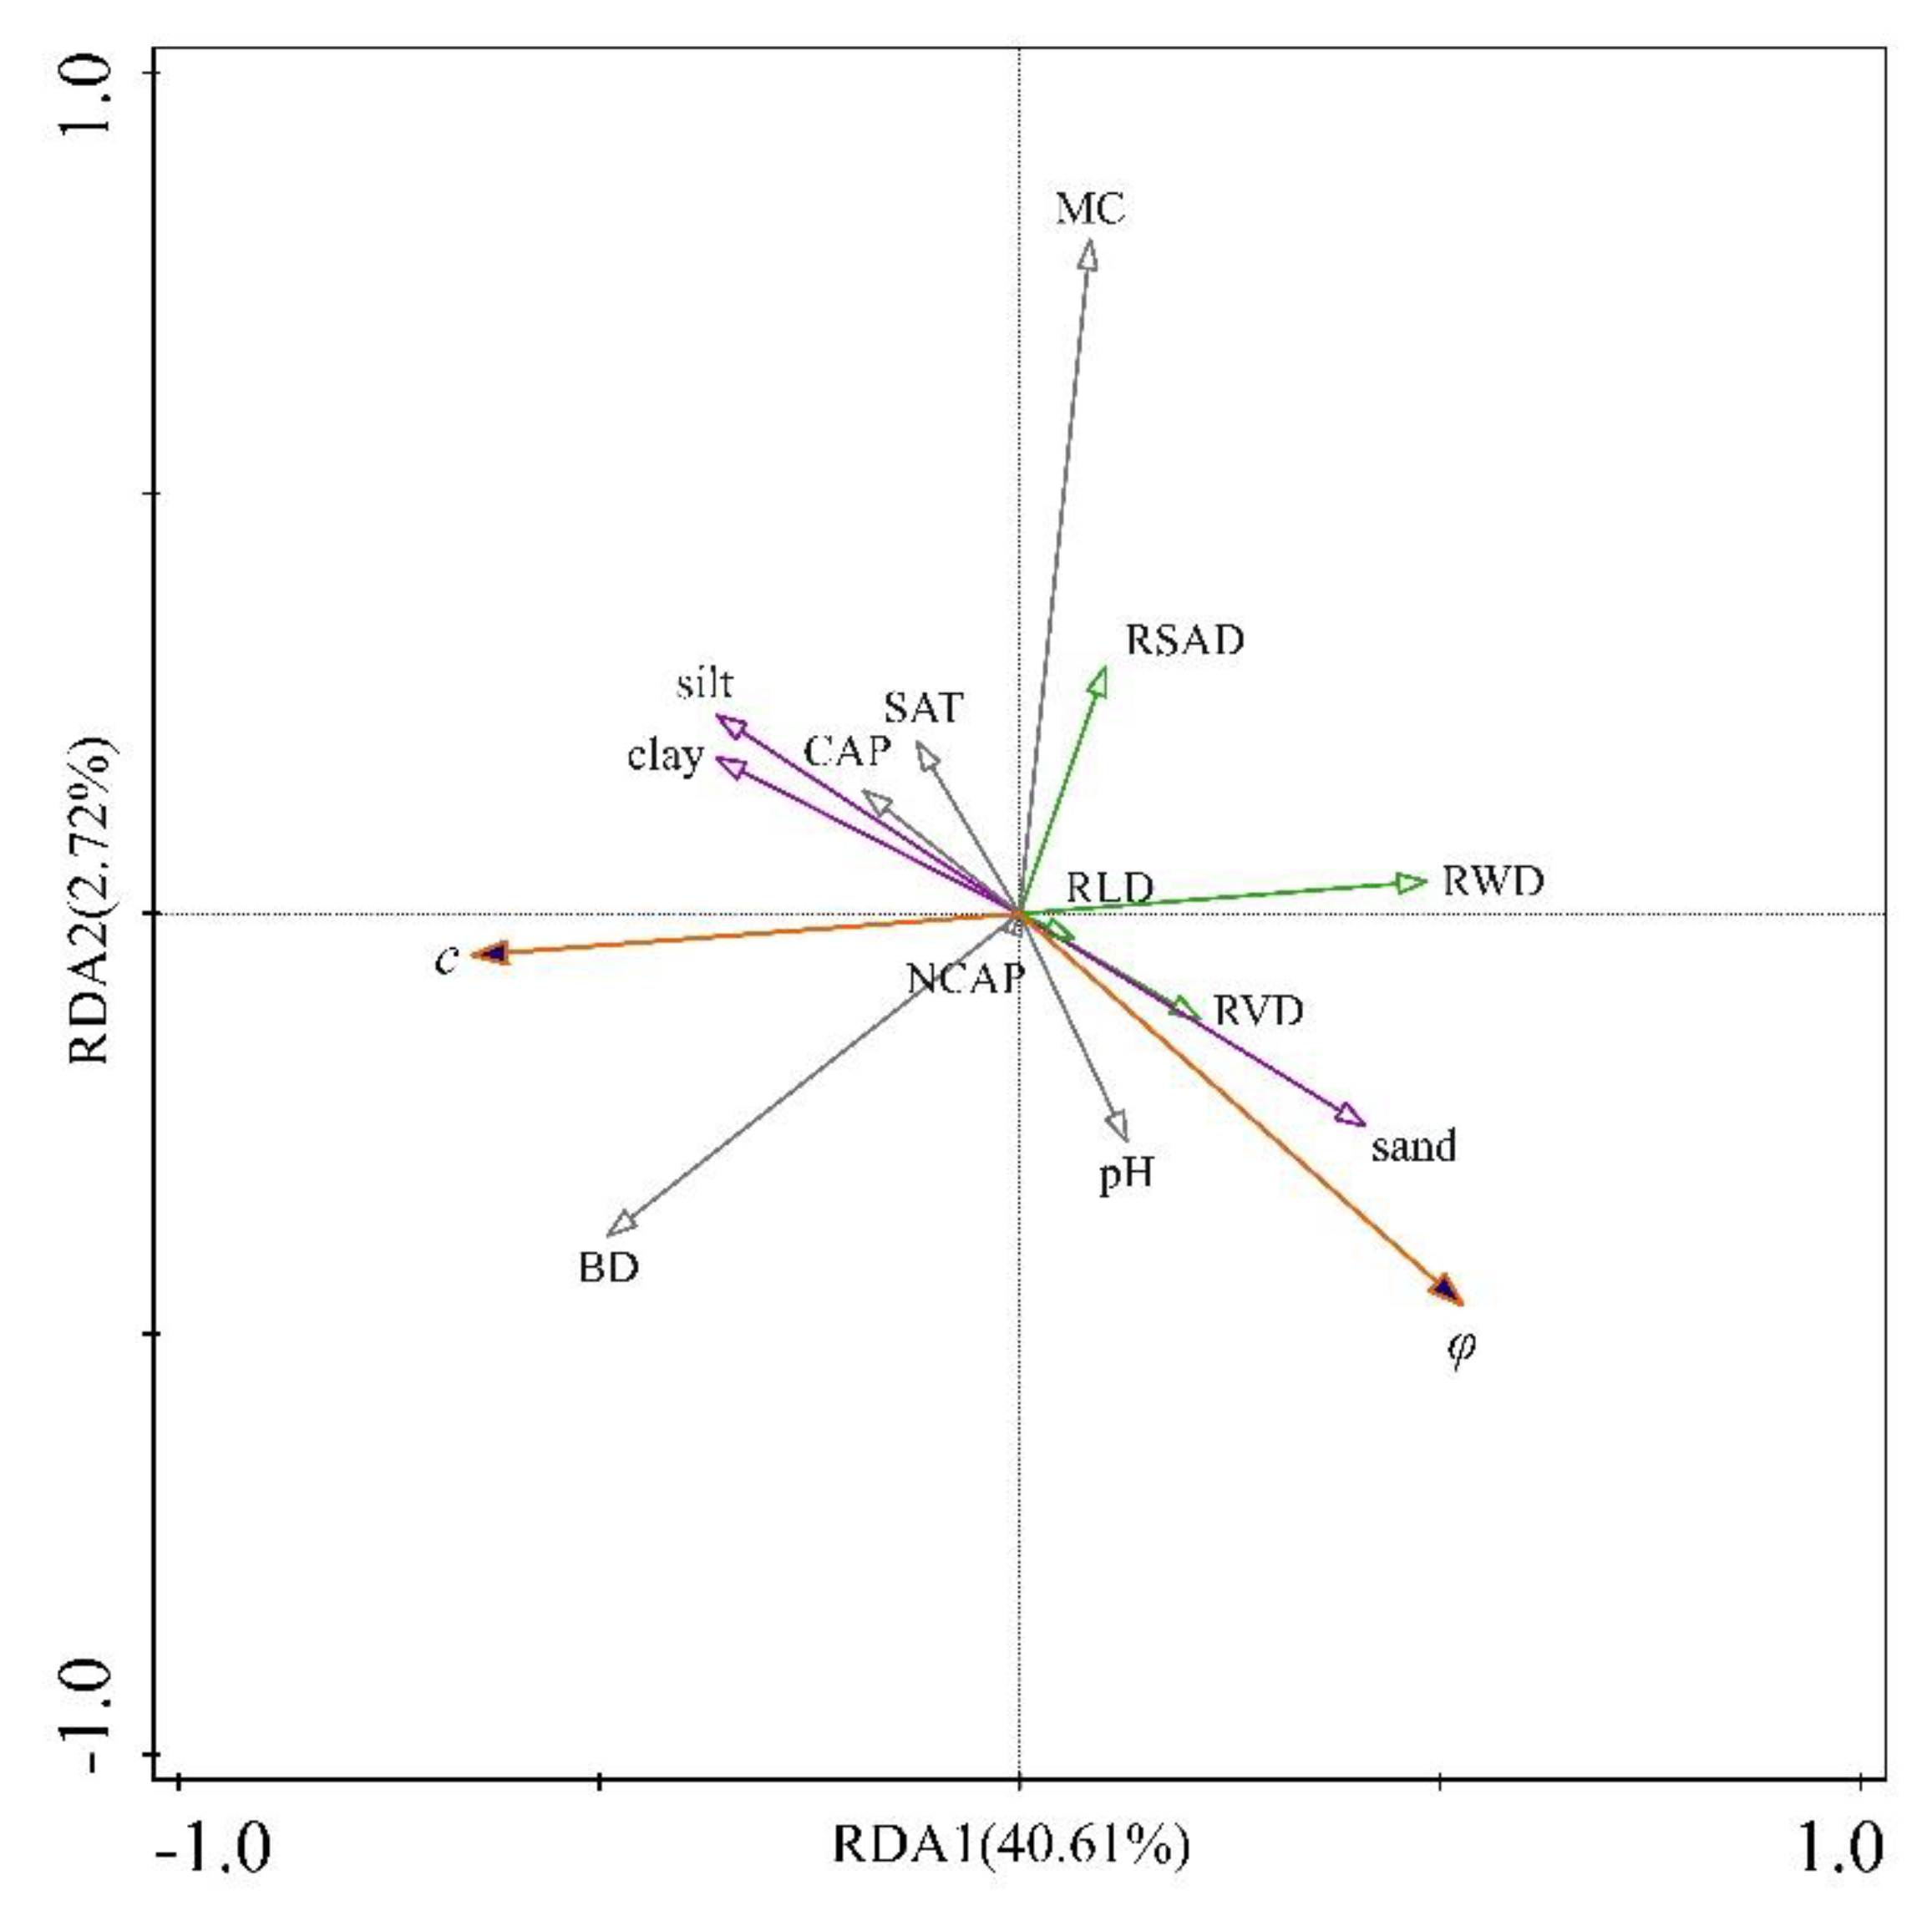
3.5. Linking Physical Properties of Soil Moisture and pH, Soil Particle Composition, Root Distribution Characteristics, and Shear Strength Parameters of Root Soil
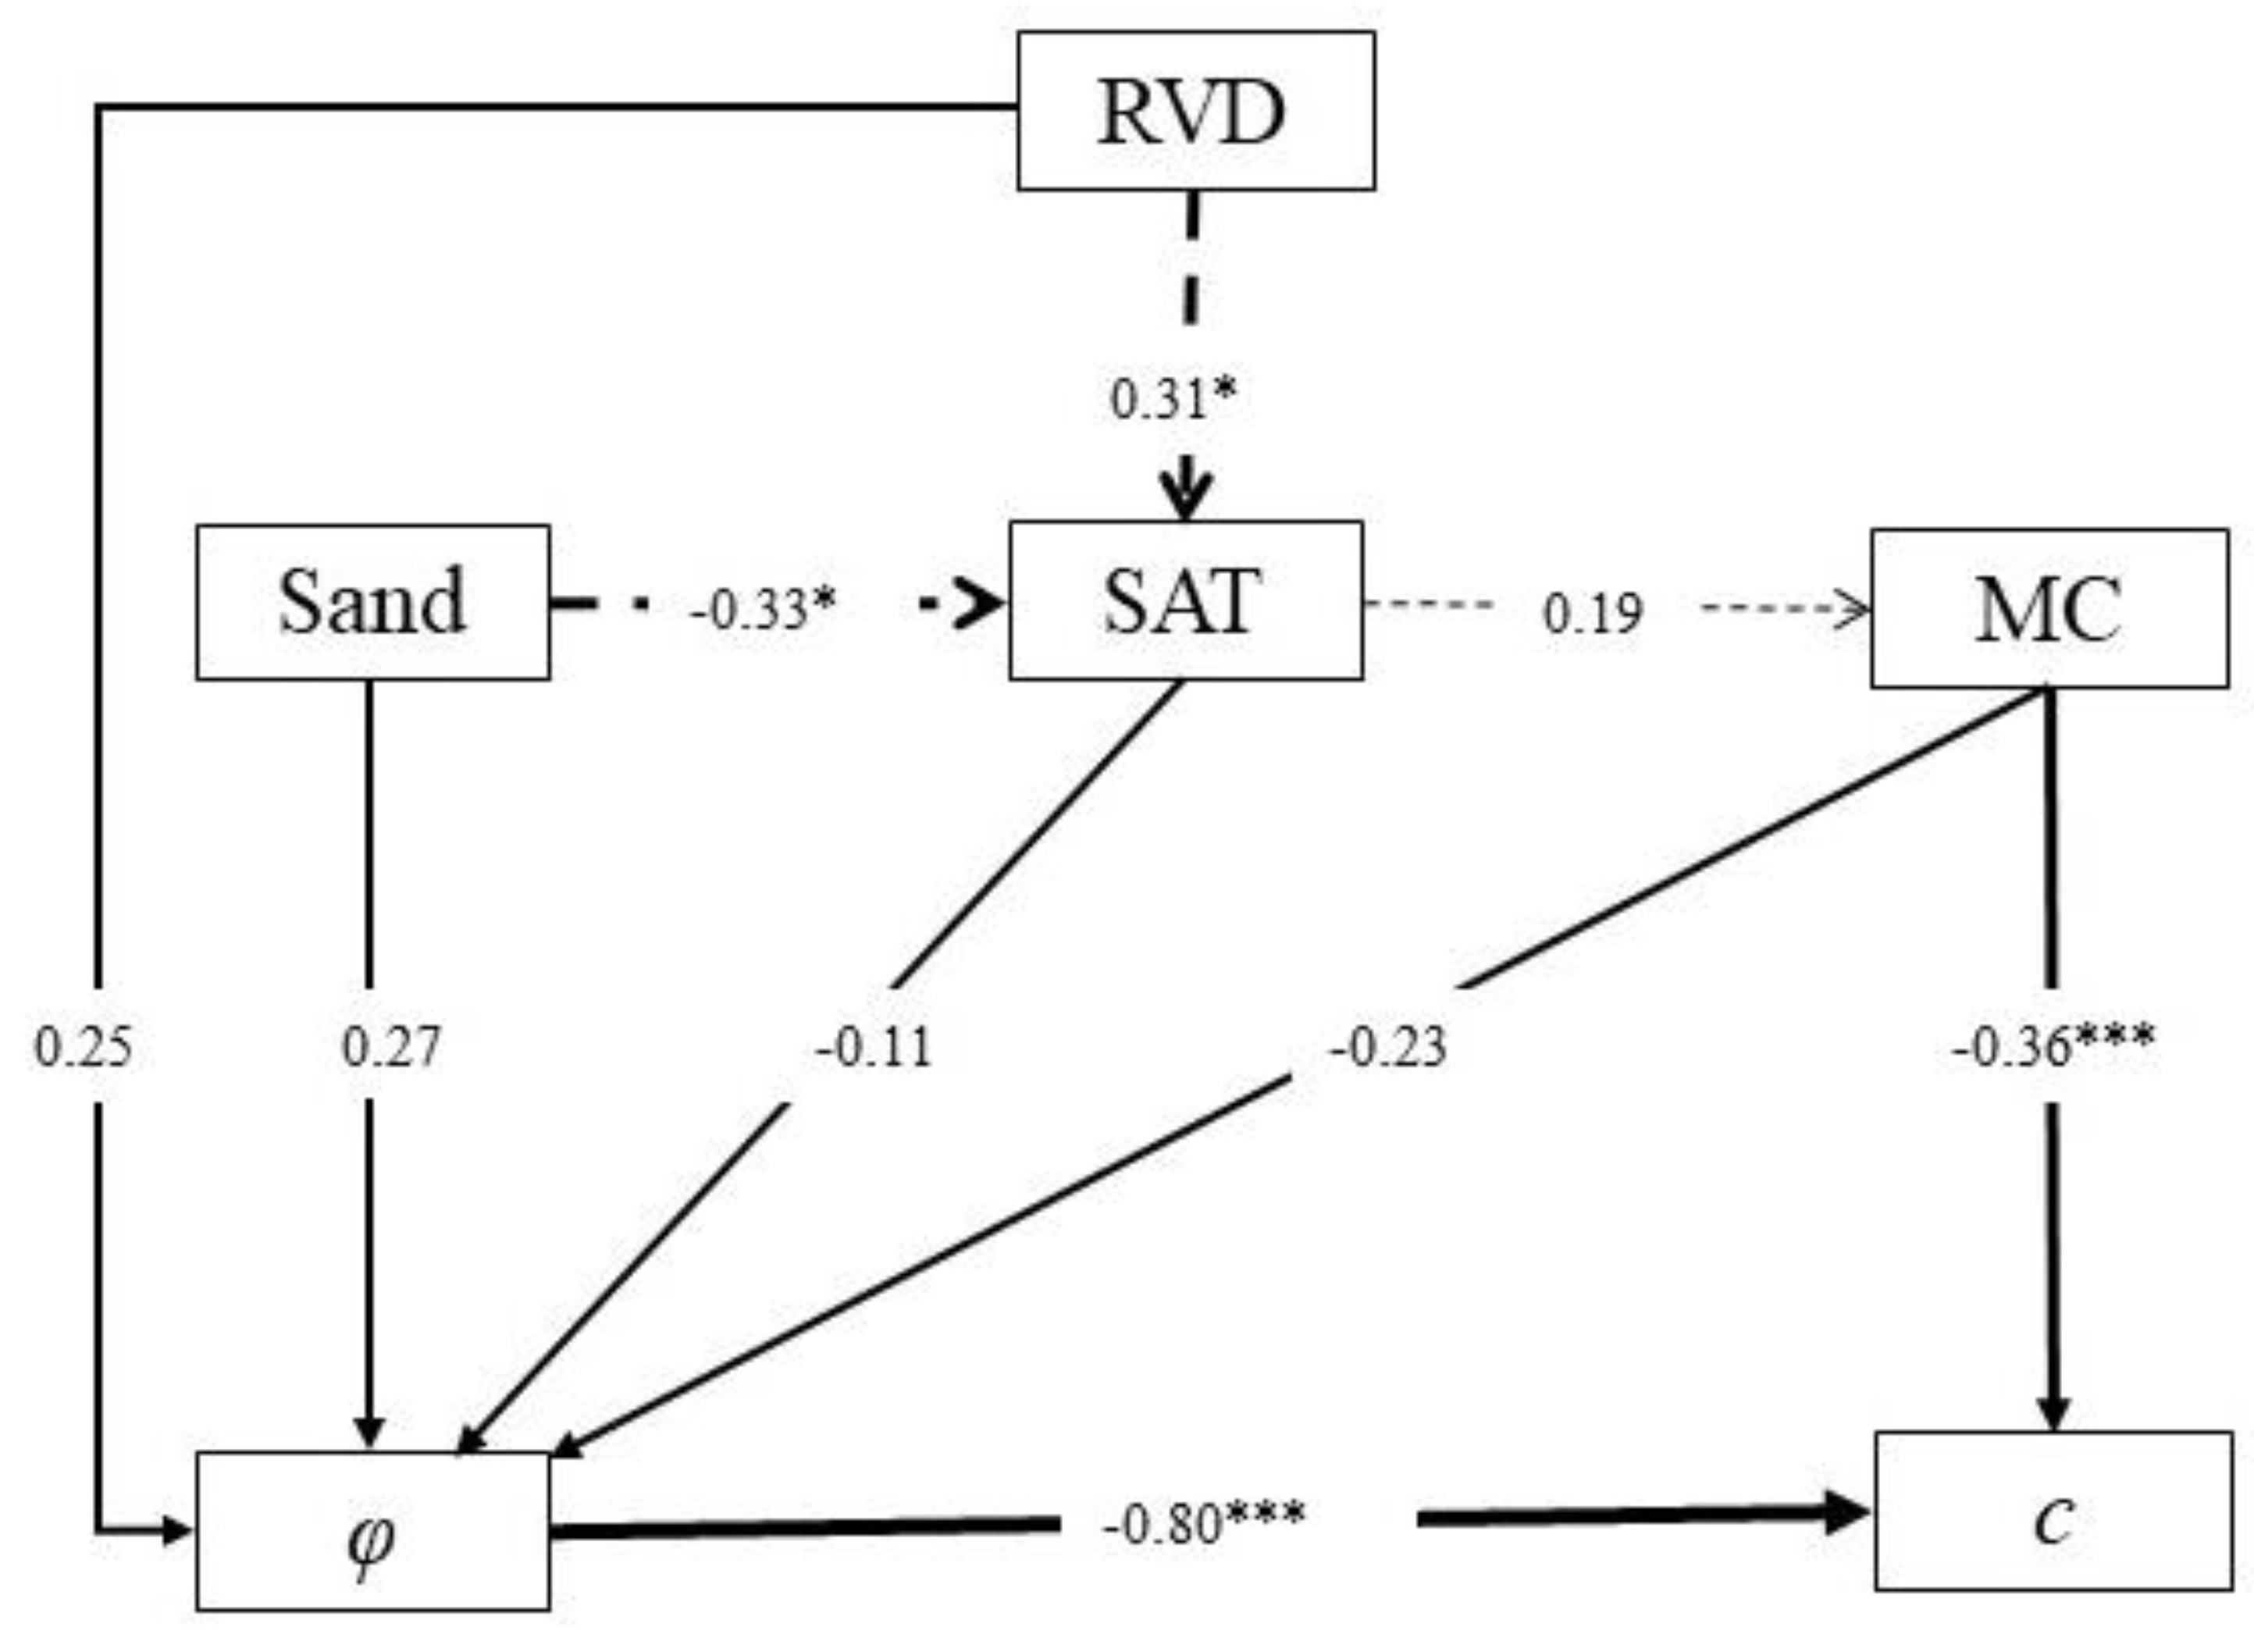
In the RDA of the shear strength parameters of the root soil, with soil and root properties as the explanatory variables, Axis 1 accounted for 40.61% of the variation in the dataset, with 2.72% of the variation accounted for by Axis 2 (Figure 5). High φ with high sand, pH, RVD, RVD, and RLD, was found at the right-hand end of the ordination plots and associated with lower clay, silt, CAP, and SAT. The c, BD, clay, and silt increased along the y-axis, whereas the RWD, RLD, and sand decreased.

3.6. SEM Results

Figure 6 shows the structural equation modeling (SEM) as estimated by AMOS. Each of the observed variables is displayed in a rectangle. The χ2 test revealed that the model generated χ2 = 6.160, df = 6, and p = 0.406 (>0.05). The goodness-of-fit index (GFI) was 0.963 (>0.900), and the root mean square error of approximation (RMSEA) was 0.023 (<0.080). Table 2 displays the standardized direct and indirect influence parameters of the RVD, MC, sand, and SAT on the φ and c.
The direct effects of MC (−0.36, p < 0.000) on c were significant. However, the direct effects of MC (−0.23), RVD (0.25), SAT (−0.11), and sand (0.27) on φ were lower. Both sand and RVD also indirectly altered φ (−0.33, p < 0.05; 0.31, p < 0.05, respectively) through changes in the SAT, and the SAT indirectly altered c (0.19) through changes in the MC. Therefore, the total effects of RVD, sand, SAT, and MC on φ were 0.21, 0.32, −0.15, and −0.23, respectively, whereas the total effects on c were −0.19, −0.23, 0.05, and −0.17, respectively. There was a significant correlation between φ and c (−0.80, p < 0.000).

4. Discussion

In accordance with previous research results, soil properties changed significantly in the subtropics due to the presence of different vegetation cover types, which directly reflected soil structural changes [43]. The results show that the soil pH and bulk density had minor differences along with soil depths for each vegetation type. This result may have been due to a common parent material and type [44]. Compared with the broad-leaved forest soil, the pH values of the grassland, coniferous forest, and coniferous broad-leaved forest soil decreased. This might have been due to the release of organic acids from tree roots, the conversion of exchangeable cations during plant uptake and/or soil microbial processes, the transformation of organic matter, and the release of organic acids [45,46]. The water content of coniferous broad-leaved mixed forest was higher than that of broad-leaved forest and grassland, and was positively correlated with soil porosity and root characteristics. This result was consistent with that observed in Li et al. [47]. These changes may be attributed to the stimulating effect of the increase in water content on plant growth. At the same time, good root permeability helps to store soil water [48,49].
In contrast to the broad-leaved forest with only a single tree species, the root biomass, root specific surface area, and root length density of the coniferous and broad-leaved mixed forest with diverse species were higher, which may have been due to more abundant fine roots in the mixed forest [50]. With deeper soil layer, changes in the root surface area, root volume, and root biomass showed similar trends (from high to low), and were similar between different vegetation types. It was verified by research that the fine root density in the upper 0–10 cm soil layer was higher than that at 10–20 cm across all forest types [40,51]. Simultaneously, root characteristics and soil porosity were significantly positively correlated. Therefore, the root system of vegetation was related to the improvement of soil structure. The results show that the capillary porosity and total porosity of coniferous and broad-leaved mixed forest were higher than those of the grassland and broad-leaved forest. This corresponded to previous results showing that root systems in coniferous and broad-leaved mixed forests were more developed This difference may also be attributed to the difference in the amount of litter, which is easily decomposed for different vegetation types [52,53].
The results of the two factors test showed that the soil particle size and soil shear index were also affected by the vegetation type, and there were significant differences (p < 0.05). SEM analysis indicated that the soil particle size, soil water physical properties, and plant roots could directly affect the soil internal soil friction angle, and the direct effect of soil particle size was the largest. In addition to the soil water content, soil cohesion was directly affected by plant root system characteristics and particle size, indirectly through the soil water content, and the final comprehensive effect.
The results show that the soil particle size had the greatest effect on soil shear resistance, followed by the soil water physical properties and plant root index. The internal friction angle of broad-leaved forest was significantly larger than that of the grassland and coniferous broad-leaved forest; however, the cohesion was the opposite. Previous studies have shown that fine roots, such as those of most herb roots, and the root hairs and fibrous roots of the lateral roots and taproots of woody plants, can enhance the cohesion of the soil but not the friction angle of the soil. In contrast, the coarse roots of woody plants can enhance both the soil’s cohesion and its internal friction angle. This is because the lignification degree and the stiffness of the coarse roots of woody plants are greater than those of fine roots [54]. Compared with coniferous broad-leaved forest and grassland, the clay content of broad-leaved forest was the lowest, whereas the sand content was the highest, which was consistent with reported results [55].
The RDA results show that the internal friction angle was positively correlated with the characteristics of soil sand and vegetation roots, and negatively correlated with the fine grain content and porosity, while the cohesion was the opposite. However, its internal friction angle was the highest, which have been because the higher the content of fine particles, the more unfavorable the sliding and occluding friction between particles, and the smaller the internal friction angle. The results reveal that there was a positive correlation between clay content and cohesion, but it was not significant. This result is reasonable, as the fineness of the colloid, the high surface area, and the large number of chemical bonds enhanced the population of bonds between the particulates and promoted aggregation, which resulted in an increase in cohesion [56]. Consequently, coarse particles (i.e., gravel) reduced soil cohesion, and fine particles (i.e., fine clay) greatly reduced the friction strength of the soil in this area [57]. Simultaneously, the soil particle size was significantly related to soil water characteristics.
The soil cohesion and internal friction angle exhibited a nonlinear attenuation trend with the soil water content. Previous studies revealed that the distribution of soil particle dimensions determined soil hydraulic properties [58], the actual effective soil stress, and soil shear strength. A higher clay content can retain additional soil moisture [59], which in turn increases the distance between soil particles. At the same time, the internal structures of the soil samples with different porosities were different, where the contact and arrangement of particulates were also different. The greater the total porosity and capillary porosity, the smaller the friction force between soil particles [60]. This was consistent with the conclusion of this study. Therefore, soil fine particles have a strong adhesion and adsorption capacity, and have a good expansibility, viscosity, and water holding capacity, which can increase the available soil moisture of plants to a certain extent, thus promoting their growth.
The correlation between the root index and shear index was not significant; however it had an indirect effect on the shear strength, which may have been because the interactions between roots and soil involve a very complex process, not only related to the root index, but also including the influences of root exudates. Several reports have verified that plant root systems are the main driving factor in the physical properties of soil water [61], and indirectly so through root-induced changes in soil properties (e.g., soil bulk density and porosity) [62]. Previous studies have shown that roots can physically change particle contacts in soil by either loosening or infiltration [63]. The cohesive strength of the soil in the grassland and coniferous broad-leaved mixed forest was higher than that of broad-leaved forest, which may have been due to the higher fine roots (Ø < 2 mm) turnover rate, compared with coarse roots (Ø > 2 mm) in the 0–30 cm soil layer [64,65]. Furthermore, the roots generate fungal hyphae and globulins that indirectly bind to soil particles, which contribute to soil stability by producing exudates (e.g., gum and arabinogalactan) that bind to these bonds [66]. Therefore, a greater focus on functional root traits should be considered in future research of the influences of root shear strength, to explain the changes in the physical properties of soil and deepen our understanding of the complex relationships of root soil shear resistance [67].
Subtropical forests have long been significantly impacted by anthropogenic land use habits and deforestation due to climatic and economic drivers, deforestation (e.g., access to timber or agricultural land), or changes in forest coverage (e.g., conversion from local vegetation to mixed forest) in response to climatic and economic drivers [68]. Meanwhile, a 2014 IPCC report indicated that extreme precipitation events in most mid-latitude and tropical humid regions are expected to become more intense and frequent [69]. Consequently, the frequency of landslides is anticipated to increase. In these cases, it is particularly important to study the shear erosion resistance of plantation soil. At present, people are paying more and more attention to the ecological benefits of plantations [70]. The results of this study show that the shear strength of different vegetation types is different, and this difference can be explained by soil properties and plant root characteristics. The difference in forest root causes the change of soil structure, enhances soil water holding capacity, and finally leads to the difference in forest shear strength. However, the effect of different forest roots on soil shear strength is not deep enough. There is no research on root exudation and the tensile strength of the root system itself, which will be further studied in combination with rainfall in the future.

5. Conclusions

The results reveal that the soil moisture characteristics and pH of soil and vegetation root indices of different vegetation types were variable. The direct and indirect impacts of soil properties and plant roots modified the soil shear strength. Compared with the broad-leaved forest, the internal friction angle of the coniferous broad-leaved mixed forest and grassland soil was smaller, and the cohesion was greater, which improved the soil shear strength to a certain extent. These results are of great significance for the effective restoration of soils that have been subject to human disturbances, to reduce land water flow and erosion.

Author Contributions

Conceptualization, X.L. and N.W.; methodology, N.W.; software, X.C.; validation, X.L., X.C. and J.Z.; formal analysis, X.C.; investigation, N.W.; resources, X.C.; data curation, X.C.; writing—original draft preparation, X.C. and X.L.; writing—review and editing, X.C., X.L.; visualization, B.Z.; supervision, C.L. and Z.J.; project administration, M.M., L.Z. and Y.T.; funding acquisition, J.Z., S.M. and J.W. All authors have read and agreed to the published version of the manuscript.

Funding

This research was supported by the National Special Fund for Forestry Scientific Research of the Jiangsu Agriculture Science and Technology Innovation Fund (Grant No. CX (17)1004), the China Postdoctoral Science Foundation (2018M642260), the Natural Science Foundation for Youth of Jiangsu Province (BK20200785), and the Postgraduate Education Reform Project of Jiangsu Province (KYCX18_0959).

Data Availability Statement

The data presented in this study are available on request from the corresponding author.

Acknowledgments

We would like to thank Frank Boehm, from Lakehead University, for the language editing of this manuscript.

Conflicts of Interest

The authors declare no conflict of interest.

References

  1. Crozier, M.J. Deciphering the effect of climate change on landslide activity: A review. Geomorphology 2010, 124, 260–267. [Google Scholar] [CrossRef]
  2. Dhakal, A.S.; Sidle, R.C. Distributed simulations of landslides for different rainfall conditions. Hydrol. Process. 2004, 18, 757–776. [Google Scholar] [CrossRef]
  3. Olsson, J.; Yang, W.; Graham, L.P.; Rosberg, J.R.; Andr´Easson, J. Using an ensemble of climate projections for simulating recent and near-future hydrological change to lake V¨anern in Sweden. Tellus A Dyn. Meteorol. Oceanogr. 2016, 63, 126–137. [Google Scholar] [CrossRef]
  4. Gariano, S.L.; Guzzetti, F. Landslides in a changing climate. Earth-Sci. Rev. 2016, 162, 227–252. [Google Scholar] [CrossRef] [Green Version]
  5. Hao, H.-X.; Wang, J.-G.; Guo, Z.-L.; Hua, L. Water erosion processes and dynamic changes of sediment size distribution under the combined effects of rainfall and overland flow. Catena 2019, 173, 494–504. [Google Scholar] [CrossRef]
  6. Amiri, E.; Emami, H.; Mosaddeghi, M.R.; Astaraei, A.R. Shear strength of an unsaturated loam soil as affected by vetiver and polyacrylamide. Soil Tillage Res. 2019, 194. [Google Scholar] [CrossRef]
  7. Torri, D.; Poesen, J. A review of topographic threshold conditions for gully head development in different environments. Earth-Sci. Rev. 2014, 130, 73–85. [Google Scholar] [CrossRef]
  8. Torri, D.; Santi, E.; Marignani, M.; Rossi, M.; Borselli, L.; Maccherini, S. The recurring cycles of biancana badlands: Erosion, vegetation and human impact. Catena 2013, 106, 22–30. [Google Scholar] [CrossRef]
  9. Havaee, S.; Mosaddeghi, M.R.; Ayoubi, S. In situ surface shear strength as affected by soil characteristics and land use in calcareous soils of central Iran. Geoderma 2015, 237–238, 137–148. [Google Scholar] [CrossRef]
  10. Knapen, A.; Poesen, J.; Govers, G.; Gyssels, G.; Nachtergaele, J. Resistance of soils to concentrated flow erosion: A review. Earth-Sci. Rev. 2007, 80, 75–109. [Google Scholar] [CrossRef]
  11. Fattet, M.; Fu, Y.; Ghestem, M.; Ma, W.; Foulonneau, M.; Nespoulous, J.; Le Bissonnais, Y.; Stokes, A. Effects of vegetation type on soil resistance to erosion: Relationship between aggregate stability and shear strength. Catena 2011, 87, 60–69. [Google Scholar] [CrossRef]
  12. Cislaghi, A.; Bordoni, M.; Meisina, C.; Bischetti, G.B. Soil reinforcement provided by the root system of grapevines: Quantification and spatial variability. Ecol. Eng. 2017, 109, 169–185. [Google Scholar] [CrossRef]
  13. Fan, C.-C.; Su, C.-F. Role of roots in the shear strength of root-reinforced soils with high moisture content. Ecol. Eng. 2008, 33, 157–166. [Google Scholar] [CrossRef]
  14. Gyssels, G.; Poesen, J.; Bochet, E.; Li, Y. Impact of plant roots on the resistance of soils to erosion by water: A review. Prog. Phys. Geogr. Earth Environ. 2005, 29. [Google Scholar] [CrossRef] [Green Version]
  15. Burylo, M.; Hudek, C.; Rey, F. Soil reinforcement by the roots of six dominant species on eroded mountainous marly slopes (Southern Alps, France). Catena 2011, 84, 70–78. [Google Scholar] [CrossRef]
  16. Comino, E.; Marengo, P.; Rolli, V. Root reinforcement effect of different grass species: A comparison between experimental and models results. Soil Tillage Res. 2010, 110, 60–68. [Google Scholar] [CrossRef]
  17. Reubens, B.; Poesen, J.; Danjon, F.; Geudens, G.; Muys, B. The role of fine and coarse roots in shallow slope stability and soil erosion control with a focus on root system architecture: A review. Trees 2007, 21, 385–402. [Google Scholar] [CrossRef]
  18. Yuan, Z.Q.; Yu, K.L.; Epstein, H.; Fang, C.; Li, J.T.; Liu, Q.Q.; Liu, X.W.; Gao, W.J.; Li, F.M. Effects of legume species introduction on vegetation and soil nutrient development on abandoned croplands in a semi-arid environment on the Loess Plateau, China. Sci Total Environ. 2016, 541, 692–700. [Google Scholar] [CrossRef]
  19. Mickovski, S.B.; Bengough, A.G.; Bransby, M.F.; Davies, M.C.R.; Hallett, P.D.; Sonnenberg, R. Material stiffness, branching pattern and soil matric potential affect the pullout resistance of model root systems. Eur. J. Soil Sci. 2007, 58, 1471–1481. [Google Scholar] [CrossRef]
  20. Dupuy, L.; Fourcaud, T.; Stokes, A. A Numerical Investigation into the Influence of Soil Type and Root Architecture on Tree Anchorage. Plant Soil 2005, 278, 119–134. [Google Scholar] [CrossRef]
  21. Bischetti, G.B.; Chiaradia, E.A.; D’Agostino, V.; Simonato, T. Quantifying the effect of brush layering on slope stability. Ecol. Eng. 2010, 36, 258–264. [Google Scholar] [CrossRef]
  22. Stokes, A.; Atger, C.; Bengough, A.G.; Fourcaud, T.; Sidle, R.C. Desirable plant root traits for protecting natural and engineered slopes against landslides. Plant Soil 2009, 324, 1–30. [Google Scholar] [CrossRef]
  23. Ni, J.J.; Leung, A.K.; Ng, C.W.W.; So, P.S. Investigation of plant growth and transpiration-induced matric suction under mixed grass-tree conditions. Can. Geotech. J. 2017, 54, 561–573. [Google Scholar] [CrossRef] [Green Version]
  24. Schjønning, P.; Lamandé, M.; Keller, T.; Labouriau, R. Subsoil shear strength—Measurements and prediction models based on readily available soil properties. Soil Tillage Res. 2020, 200. [Google Scholar] [CrossRef]
  25. Wei, J.; Shi, B.; Li, J.; Li, S.; He, X. Shear strength of purple soil bunds under different soil water contents and dry densities: A case study in the Three Gorges Reservoir Area, China. Catena 2018, 166, 124–133. [Google Scholar] [CrossRef]
  26. Zhou, W.-H.; Xu, X.; Garg, A. Measurement of unsaturated shear strength parameters of silty sand and its correlation with unconfined compressive strength. Measurement 2016, 93, 351–358. [Google Scholar] [CrossRef]
  27. Wang, Z.; Hu, Y.; Wang, R.; Guo, S.; Du, L.; Zhao, M.; Yao, Z. Soil organic carbon on the fragmented Chinese Loess Plateau: Combining effects of vegetation types and topographic positions. Soil Tillage Res. 2017, 174, 1–5. [Google Scholar] [CrossRef]
  28. Ma, W.; Li, G.; Wu, J.; Xu, G.; Wu, J. Response of soil labile organic carbon fractions and carbon-cycle enzyme activities to vegetation degradation in a wet meadow on the Qinghai–Tibet Plateau. Geoderma 2020, 377. [Google Scholar] [CrossRef]
  29. Wang, L.; Pang, X.; Li, N.; Qi, K.; Huang, J.; Yin, C. Effects of vegetation type, fine and coarse roots on soil microbial communities and enzyme activities in eastern Tibetan plateau. Catena 2020, 194. [Google Scholar] [CrossRef]
  30. Wan, P.; He, R. Soil microbial community characteristics under different vegetation types at the national nature reserve of Xiaolongshan Mountains, Northwest China. Ecol. Inform. 2020, 55. [Google Scholar] [CrossRef]
  31. Zhu, M.; Yang, S.; Ai, S.; Ai, X.; Jiang, X.; Chen, J.; Li, R.; Ai, Y. Artificial soil nutrient, aggregate stability and soil quality index of restored cut slopes along altitude gradient in southwest China. Chemosphere 2020, 246, 125687. [Google Scholar] [CrossRef] [PubMed]
  32. Ajedegba, J.O.; Choi, J.-W.; Jones, K.D. Analytical modeling of coastal dune erosion at South Padre Island: A consideration of the effects of vegetation roots and shear strength. Ecol. Eng. 2019, 127, 187–194. [Google Scholar] [CrossRef]
  33. Zhang, Y.; Xu, X.; Li, Z.; Liu, M.; Xu, C.; Zhang, R.; Luo, W. Effects of vegetation restoration on soil quality in degraded karst landscapes of southwest China. Sci Total Environ. 2019, 650, 2657–2665. [Google Scholar] [CrossRef] [PubMed]
  34. Nearing, M.A.; Bradford, J.M. Single Waterdrop Splash Detachment and Mechanical Properties of Soils. Soil Sci. Soc. Am. J. 1985, 49, 547–552. [Google Scholar] [CrossRef]
  35. Sun, Z.; Ren, H.; Schaefer, V.; Guo, Q.; Wang, J. Using ecological memory as an indicator to monitor the ecological restoration of four forest plantations in subtropical China. Environ. Monit Assess 2014, 186, 8229–8247. [Google Scholar] [CrossRef] [PubMed]
  36. Xiang, W.; Liu, S.; Lei, X.; Frank, S.C.; Tian, D.; Wang, G.; Deng, X. Secondary forest floristic composition, structure, and spatial pattern in subtropical China. J. For. Res. 2017, 18, 111–120. [Google Scholar] [CrossRef]
  37. Liang, A.T.-Y.; Oey, L.; Huang, S.; Chou, S. Long-term trends of typhoon-induced rainfall over Taiwan: In situ evidence of poleward shift of typhoons in western North Pacific in recent decades. J. Geophys. Res. Atmos. 2017, 122, 2750–2765. [Google Scholar] [CrossRef]
  38. Andersson-Sköld, Y.; Bergman, R.; Johansson, M.; Persson, E.; Nyberg, L. Landslide risk management—A brief overview and example from Sweden of current situation and climate change. Int. J. Disaster Risk Reduct. 2013, 3, 44–61. [Google Scholar] [CrossRef]
  39. Guo, X.; Chen, H.Y.; Meng, M.; Biswas, S.R.; Ye, L.; Zhang, J. Effects of land use change on the composition of soil microbial communities in a managed subtropical forest. For. Ecol. Manag. 2016, 373, 93–99. [Google Scholar] [CrossRef]
  40. Liu, Y.; Guo, L.; Huang, Z.; López-Vicente, M.; Wu, G.-L. Root morphological characteristics and soil water infiltration capacity in semi-arid artificial grassland soils. Agric. Water Manag. 2020, 235. [Google Scholar] [CrossRef]
  41. Minasny, B.; McBratney, A.B. The Australian soil texture boomerang: A comparison of the Australian and USDA/FAO soil particle-size classification systems. Aust. J. Soil Res. 2001, 39, 1443–1451. [Google Scholar] [CrossRef]
  42. Li, C.; Jia, Z.; Yuan, Y.; Cheng, X.; Shi, J.; Tang, X.; Wang, Y.; Peng, X.; Dong, Y.; Ma, S.; et al. Effects of mineral-solubilizing microbial strains on the mechanical responses of roots and root-reinforced soil in external-soil spray seeding substrate. Sci. Total Environ. 2020, 723, 138079. [Google Scholar] [CrossRef] [PubMed]
  43. Sun, W.; Zhu, H.; Guo, S. Soil organic carbon as a function of land use and topography on the Loess Plateau of China. Ecol. Eng. 2015, 83, 249–257. [Google Scholar] [CrossRef]
  44. Liu, D.; Huang, Y.; An, S.; Sun, H.; Bhople, P.; Chen, Z. Soil physicochemical and microbial characteristics of contrasting land-use types along soil depth gradients. Catena 2018, 162, 345–353. [Google Scholar] [CrossRef]
  45. Wei, X.; Hao, M.; Shao, M.; Gale, W.J. Changes in soil properties and the availability of soil micronutrients after 18 years of cropping and fertilization. Soil Tillage Res. 2006, 91, 120–130. [Google Scholar] [CrossRef]
  46. Kuang, Y.W.; Sun, F.F.; Wen, D.Z.; Zhou, G.Y.; Zhao, P. Tree-ring growth patterns of Masson pine (Pinus massoniana L.) during the recent decades in the acidification Pearl River Delta of China. For. Ecol. Manag. 2008, 255, 3534–3540. [Google Scholar] [CrossRef]
  47. Li, H.; Futch, S.H.; Stuart, R.J.; Syvertsen, J.P.; McCoy, C.W. Associations of soil iron with citrus tree decline and variability of sand, soil water, pH, magnesium and Diaprepes abbreviatus root weevil: Two-site study. Environ. Exp. Bot. 2007, 59, 321–333. [Google Scholar] [CrossRef]
  48. Ji, C.J.; Yang, Y.H.; Han, W.X.; He, Y.F.; Smith, J.; Smith, P. Climatic and Edaphic Controls on Soil pH in Alpine Grasslands on the Tibetan Plateau, China: A Quantitative Analysis. Pedosphere 2014, 24, 39–44. [Google Scholar] [CrossRef]
  49. Yan, F.; Schubert, S.; Mengel, K. Soil pH increase due to biological decarboxylation of organic anions. Soil Biol. Biochem. 1996, 28, 617–624. [Google Scholar] [CrossRef]
  50. Finér, L.; Domisch, T.; Dawud, S.M.; Raulund-Rasmussen, K.; Vesterdal, L.; Bouriaud, O.; Bruelheide, H.; Jaroszewicz, B.; Selvi, F.; Valladares, F. Conifer proportion explains fine root biomass more than tree species diversity and site factors in major European forest types. For. Ecol. Manag. 2017, 406, 330–350. [Google Scholar] [CrossRef]
  51. Muthukumar, T.; Sha, L.; Yang, X.; Cao, M.; Tang, J.; Zheng, Z. Distribution of roots and arbuscular mycorrhizal associations in tropical forest types of Xishuangbanna, southwest China. Appl. Soil Ecol. 2003, 22, 241–253. [Google Scholar] [CrossRef] [Green Version]
  52. Zeng, X.; Zhang, W.; Cao, J.; Liu, X.; Shen, H.; Zhao, X. Changes in soil organic carbon, nitrogen, phosphorus, and bulk density after afforestation of the “Beijing–Tianjin Sandstorm Source Control” program in China. Catena 2014, 118, 186–194. [Google Scholar] [CrossRef]
  53. Hou, G.; Delang, C.O.; Lu, X. Afforestation changes soil organic carbon stocks on sloping land: The role of previous land cover and tree type. Ecol. Eng. 2020, 152. [Google Scholar] [CrossRef]
  54. Liu, Y.-B.; Hu, X.-S.; Yu, D.-M.; Zhu, H.-L.; Li, G.-R. Influence of the roots of mixed-planting species on the shear strength of saline loess soil. J. Mt. Sci. 2021, 18, 806–818. [Google Scholar] [CrossRef]
  55. Yang, S.; Zhao, W.; Pereira, P. Determinations of environmental factors on interactive soil properties across different land-use types on the Loess Plateau, China. Sci. Total Environ. 2020, 738. [Google Scholar] [CrossRef]
  56. Horn, R.; Fleige, H. A method for assessing the impact of load on mechanical stability and on physical properties of soils. Soil Tillage Res. 2003, 73, 89–99. [Google Scholar] [CrossRef]
  57. Wang, G.; Suemine, A.; Schulz, W.H. Shear-rate-dependent strength control on the dynamics of rainfall-triggered landslides, Tokushima Prefecture, Japan. Earth Surf. Process. Landf. 2010. [Google Scholar] [CrossRef]
  58. Satyanaga, A.; Rahardjo, H.; Leong, E.-C.; Wang, J.-Y. Water characteristic curve of soil with bimodal grain-size distribution. Comput. Geotech. 2013, 48, 51–61. [Google Scholar] [CrossRef]
  59. Davidson, E.A.; Janssens, I.A. Temperature sensitivity of soil carbon decomposition and feedbacks to climate change. Nature 2006, 440, 165–173. [Google Scholar] [CrossRef]
  60. Zuo, C.; Liu, D.; Ding, S.; Chen, J. Micro-characteristics of strength reduction of tuff residual soil with different moisture. KSCE J. Civ. Eng. 2015, 20, 639–646. [Google Scholar] [CrossRef]
  61. Sun, D.; Yang, H.; Guan, D.; Yang, M.; Wu, J.; Yuan, F.; Jin, C.; Wang, A.; Zhang, Y. The effects of land use change on soil infiltration capacity in China: A meta-analysis. Sci Total Environ. 2018, 626, 1394–1401. [Google Scholar] [CrossRef]
  62. Huang, Z.; Tian, F.P.; Wu, G.L.; Liu, Y.; Dang, Z.Q. Legume Grasslands Promote Precipitation Infiltration better than Gramineous Grasslands in arid Regions. Land Degrad. Dev. 2016, 28, 309–316. [Google Scholar] [CrossRef]
  63. Bengough, A.G.; Bransby, M.F.; Hans, J.; McKenna, S.J.; Roberts, T.J.; Valentine, T.A. Root responses to soil physical conditions; growth dynamics from field to cell. J Exp. Bot. 2006, 57, 437–447. [Google Scholar] [CrossRef] [PubMed] [Green Version]
  64. Gale, W.J.; Cambardella, C.A.; Bailey, T.B. Root-Derived Carbon and the Formation and Stabilization of Aggregates. Soil Biol. Biochem. 2000, 64, 201–207. [Google Scholar] [CrossRef]
  65. Leung, A.K.; Garg, A.; Coo, J.L.; Ng, C.W.W.; Hau, B.C.H. Effects of the roots ofCynodon dactylonandSchefflera heptaphyllaon water infiltration rate and soil hydraulic conductivity. Hydrol. Process. 2015, 29, 3342–3354. [Google Scholar] [CrossRef] [Green Version]
  66. Galloway, A.F.; Pedersen, M.J.; Merry, B.; Marcus, S.E.; Blacker, J.; Benning, L.G.; Field, K.J.; Knox, J.P. Xyloglucan is released by plants and promotes soil particle aggregation. New Phytol 2018, 217, 1128–1136. [Google Scholar] [CrossRef] [Green Version]
  67. Freschet, G.T.; Roumet, C.; Treseder, K. Sampling roots to capture plant and soil functions. Funct. Ecol. 2017, 31, 1506–1518. [Google Scholar] [CrossRef] [Green Version]
  68. Lonigro, T.; Gentile, F.; Polemio, M. The influence of climate variability and land use variations on the occurrence of landslide events (subappennino dauno, southern Italy). Rend. Online Soc. Geol. Ital. 2015, 35, 192–195. [Google Scholar] [CrossRef] [Green Version]
  69. Pachauri, R.; Reisinger, A. Climate Change 2014: Synthesis Report. Contribution of Working Groups I, II and III to the Fifth Assessment Report of the Intergovernmental Panel on Climate Change. J. Roman. Stud. 2014, 4, 85–88. [Google Scholar]
  70. Sidle, R.C.; Ziegler, A.D.; Negishi, J.N.; Nik, A.R.; Siew, R.; Turkelboom, F. Erosion processes in steep terrain—Truths, myths, and uncertainties related to forest management in Southeast Asia. For. Ecol. Manag. 2006, 224, 199–225. [Google Scholar] [CrossRef]
Figure 1. Soil water-physical properties of three vegetation types and three soil layers (mean ± SE, n = 4). SE is the variance of the index. The error line indicates standard error; upper case letters indicate a significant difference among different soil layers of the same land use types (p < 0.05); the lower case letter indicates a significant difference between different land use types of the same soil layer (p < 0.05). EBF stands for evergreen broad-leaved forest; CBF stands for mixed forest; SGF stands for shrub-grass forest; NCAP stands for non-capillary porosity; CAP stands for capillary porosity; SAT stands for total porosity; BD stands for bulk density; MC stands for moisture content; VT stands for vegetation type; SL stands for soil layer. Two-way ANOVA was applied to indicate significant differences between variances. (a) shows the NCAP in different soil layers in different stands; (b) shows the CAP in different soil layers in different stands; (c) shows the SAT in different soil layers in different stands; (d) shows the MC in different soil layers in different stands; (e) shows the BD in different soil layers in different stands; (f) shows the pH in different soil layers in different stands.
Forests 12 00490 g001
Figure 2. Soil particle composition of three vegetation types and three soil layers (mean ± SE, n = 4), SE is the variance of the index. The error line indicates standard error; upper case letters indicate a significant difference between different soil layers of the same land use types (p < 0.05); the lower case letter indicates a significant difference among different land use types of the same soil layer (p < 0.05). EBF stands for evergreen broad-leaved forest; CBF stands for mixed forest; SGF stands for shrub-grass forest; VT stands for vegetation type; SL stands for soil layer. Two-way ANOVA was applied to indicate significant differences between variances. (a) shows the Clay in different soil layers in different stands; (b) shows the Silt in different soil layers in different stands; (c) shows the Sand in different soil layers in different stands.
Forests 12 00490 g002
Figure 3. Parameters of root characteristics of three vegetation types and three soil layers (mean ± SE, n = 4), SE is the variance of the index. The error line indicates standard error; upper case letters indicate a significant difference among different soil layers of the same land use types (p < 0.05); the lower case letter indicates a significant difference between different land use types of the same soil layer (p < 0.05). EBF stands for evergreen broad-leaved forest; CBF stands for mixed forest; SGF stands for shrub-grass forest; RLD stands for root length density; RSAD stands for root surface area density; RVD stands for root volume density; RWD stands for root weight density; VT stands for vegetation type; SL stands for soil layer. Two-way ANOVA was applied to indicate significant differences between variances. (a) shows the RLD in different soil layers in different stands; (b) shows the RSAD in different soil layers in different stands; (c) shows the RVD in different soil layers in different stands; (d) shows the RWD in different soil layers in different stands.
Forests 12 00490 g003
Figure 4. Change law of shear strength parameters of three vegetation types and three soil layers (mean ± SE, n = 4), SE is the variance of the index. The error line indicates standard error; the upper case letter indicates a significant difference among different soil layers of the same land use types (p < 0.05); lower case letters indicate a significant difference between different land use types of the same soil layer (p < 0.05). EBF stands for evergreen broad-leaved forest; CBF stands for mixed forest; SGF stands for shrub-grass forest; φ stands for internal frictional angle; c stands for cohesive force; VT stands for vegetation type; SL stands for soil layer. Two-way ANOVA was applied to indicate significant differences among variances. (a) shows the φ in different soil layers in different stands; (b) shows the c in different soil layers in different stands.
Forests 12 00490 g004
Figure 5. Redundancy analysis (RDA) of shear strength parameters of root soil and soil physical and chemical properties and root index. The angle and length of arrows indicate the direction and strength of the relationship between shear strength parameters of root and soil physical and chemical properties and root index. RLD stands for root length density; RSAD stands for roots surface area density; RVD stands for root volume density; RWD stands for root weight density; NCAP stands for non-capillary porosity; CAP stands for capillary porosity; SAT stands for total porosity; BD stands for bulk density; MC stands for moisture content; φ stands for internal frictional angle; c stands for cohesive force.
Forests 12 00490 g005
Figure 6. Structural equation models of the soil properties and root biomass on internal frictional angle (φ). (χ2 = 6.160; df = 6; p = 0.406, > 0.05; GFI = 0.963, > 0.900; RMSEA = 0.023, < 0.080). Numbers on arrows are standardized path coefficients. The width of arrows indicates the strength of the causal influence. Solid arrows mean a direct effect on internal frictional angle; dashes represent an indirect path to the internal frictional angle. MC stands for moisture content; RVD stands for root volume density; SAT stands for total porosity; φ stands for internal frictional angle, c stands for cohesive force. *** was significantly correlated at the.01 level (bilateral). * Significant correlation at 0.05 level (bilateral).
Forests 12 00490 g006
Table 1. General situation of the trees in sample plots.
Forest TypeMain PlantSlope/°Year Stand AgeCanopy DensityMean Height/mMean DBH/cm
SGFBambusoideae, Imperata cylindrica---0.85-
CBFPinus taiwanensis, Eurya japonica Thunb, Rhododendron simsii Planch13–20490.8110.9710.92
EBFSchima superba, Cyclobalanopsis multinervis, Betula luminifera10–15Old-growth0.7911.0912.79
SGF stands for shrub-grass forest; CBF stands for coniferous and broad–leaved mixed forest; EBF stands for evergreen broadleaved forest; DBH stands for diameter at breast height.
Table 2. Standardized direct and indirect effects of internal frictional angle.
SandMCRVDSAT
Direct EffectsIndirect EffectsDirect EffectsIndirect EffectsDirect EffectsIndirect EffectsDirect EffectsIndirect Effects
φ0.270.05 −0.23 0.00 0.25 −0.05 −0.11 −0.04
c0.00−0.23 −0.36 0.19 0.00 −0.19 0.00 0.05
MC stands for moisture content; RVD stands for root volume density; SAT stands for total porosity; φ stands for internal frictional angle.
Publisher’s Note: MDPI stays neutral with regard to jurisdictional claims in published maps and institutional affiliations.

