Article

Automated Marker-Free Registration of Multisource Forest Point Clouds Using a Coarse-to-Global Adjustment Strategy

1
School of Geospatial Engineering and Science, Sun Yat-Sen University, Zhuhai 519082, China
2
Southern Marine Science and Engineering Guangdong Laboratory (Zhuhai), Zhuhai 519080, China
3
IRIT, CNRS, University of Toulouse, 31062 Toulouse, France
4
State Key Laboratory of Remote Sensing Science, Beijing Engineering Research Center for Global Land Remote Sensing Products, Institute of Remote Sensing Science and Engineering, Faculty of Geographical Science, Beijing Normal University, Beijing 100875, China
5
Key Laboratory of Digital Earth Science, Aerospace Information Research Institute, Chinese Academy of Sciences, Beijing 100094, China
6
Guangxi Key Laboratory of Spatial Information and Geomatics, Guilin University of Technology, Guilin 541006, China
*
Author to whom correspondence should be addressed.
Forests 2021, 12(3), 269; https://doi.org/10.3390/f12030269
Submission received: 29 January 2021 / Revised: 22 February 2021 / Accepted: 23 February 2021 / Published: 26 February 2021
(This article belongs to the Section Forest Inventory, Modeling and Remote Sensing)

Abstract

:
Terrestrial laser scanning (TLS) and unmanned aerial vehicles (UAVs) are two effective platforms for acquiring forest point clouds. TLS has an advantage in the acquisition of below-canopy information but does not include the data above the canopy. UAVs acquire data from the top viewpoint but are confined to the information above the canopy. To obtain complete forest point clouds and exploit the application potential of multiple platforms in large-scale forest scenarios, we propose a practical pipeline to register multisource point clouds automatically. We consider the spatial distribution differences of trees and achieve the coarse alignment of multisource point clouds without artificial markers; then, the iterative closest point method is used to improve the alignment accuracy. Finally, a graph-based adjustment is designed to remove accumulative errors and achieve the gapless registration. The experimental results indicate high efficiency and accuracy of the proposed method. The mean errors for the registration of multi-scan TLS point clouds subsampled at 0.03 m are approximately 0.01 m, and the mean errors for registration of the TLS and UAV data are less than 0.03 m in the horizontal direction and approximately 0.01 m in the vertical direction.

1. Introduction

As one of the key contents of forest inventories, the accurate representation of three-dimensional (3D) structural information of forests is significant for ecological research and decision-making regarding the management of forests [1]. Therefore, accurate, complete acquisition of the 3D structural information of forests is an important problem to be solved. Due to the penetration and anti-interference ability, the light detection and ranging (LiDAR) technique has incomparable advantages in obtaining the vertical structural information of forests compared to optical remote sensing techniques [2]. Consequently, LiDAR-based forest mapping has been widely applied for forest inventories and has been used to extract various structural parameters of forests [3,4,5].
The common platforms for LiDAR-based forest inventories are terrestrial laser scanning (TLS) [6] and unmanned aerial vehicle (UAV) [7]. TLS is also known as ground-based LiDAR, which can acquire details from the surrounding 3D scenes at the millimeter level and supports the rapid, automatic reconstruction of forest stand structures [8]. Two TLS-based 3D data acquisition modes have been frequently used for forestry inventories: single-scan and multi-scan modes. In single-scan mode, the scanner is generally placed at the center of a plot and acquires the data of only one side of the visible trees [9]. However, due to the occlusion of the trees, single-scan mode usually attains a low detection rate for forest measurements [10,11]. Consequently, multi-scan acquisition is often necessary to measure forest plots [12]. In multi-scan mode, the scanner observes a sample plot from multiple viewpoints, e.g., 4–5 scans are generally necessary for a 30 m × 30 m sample plot, which has the potential to detect all the trees to provide full coverage of a tree stem surface. Although multi-scan mode appears to be the most accurate method for forest mapping, it poses a problem not to be ignored, i.e., the registration of multiple scans. Additionally, due to occlusion from the canopy, TLS is commonly restricted to stem mapping and the acquisition of understory information. A UAV is a data acquisition platform that is being increasingly applied in forest inventories [13], which usually carries camera or laser scanning (unmanned aerial vehicle laser scanning (ULS)) and integrates with the Global Navigation Satellite System/inertial measurement unit (GNSS-IMU) technique [14] to offer a georeferenced data for forest inventories. Due to the characteristics of the platform, more above-canopy information can be obtained by the UAV system, which results in more accurate tree height measurements and can serve as complement data to TLS data [15,16]. Nevertheless, UAVs are limited and cannot capture understory information because of the effects of occlusion. Therefore, the registration of point clouds is necessary for acquiring complete structural information of forests, which involves the registration of TLS point clouds and the registration of TLS and UAV data.
The conventional registration methods of multiple TLS point clouds place artificial markers in the forest plots, of which the markers are utilized to provide precise and distinct tie points. In general, some artificial markers, e.g., retroreflective spheres [17] and artificial reflectors [18,19], are mounted on poles or trees and then are detected manually or automatically with commercial software packages. For example, Pueschel [20] used four FARO laser scanner reference spheres and one planar target and manually registered three terrestrial laser scans; this method achieved a registration accuracy at the submillimeter level. Commonly, these methods can achieve accurate registration based on the markers. However, the identification of targets may require additional user intervention when the software cannot detect the targets; also, the placement of several targets is complex and time consuming because the targets need to be observed from different viewpoints. To simplify the marker-based methods, Zhang et al. [21] proposed a backsighting orientation method to register terrestrial LiDAR scans, which uses only one reflector as a target between two scans and avoids the difficulty in setting up many artificial targets. The method requires that the reflector under the scanner can be observed from the adjacent location. In this context, marker-free registration methods are necessary for forest inventories. Some effective algorithms have been presented for the registration of point clouds, such as 4-points congruent sets (4PCS) [22,23] and scale-invariant feature transform (SIFT) [24]. These methods are usually suitable for engineered surfaces [25,26,27] but are not directly used for matching multiple point clouds of forests. In addition, some factors, such as a single type of tree, occlusion, and various scanner viewpoints, may bring challenges for registration of intensity-based or range-based SIFT algorithms. Therefore, some studies achieved the automated registration of TLS point clouds of a forest by exploiting the natural geometric attributes of trees, especially the characteristics of tree stems. For example, Kelbe et al. [28] regarded stem-terrain intersection points as matching features and generated tie point triplets for registration of TLS data. Liu et al. [29] utilized two types of geometric primitives: the diameters of stem curves and the geometric distances between the stem curves in a set of trees, to describe the deformation between different scans and achieve automated matching of TLS data. Although these techniques appeared to be effective in a forest scene, they focused on the coarse alignment of pairwise TLS point clouds and are not capable of the fine registration of pairwise or even multiple TLS point clouds. In addition, these methods based on tree stem attributes typically extract tree stems first, which is generally time consuming. With respect to the fine registration of multiple TLS point clouds, conventional methods usually use the aforementioned artificial targets to solve this task with the help of algorithms in commercial software packages, e.g., the multistation adjustment algorithm in RIEGL RiSCAN PRO [30]. Kelbe et al. [31] used a graph-theoretical framework to achieve multiview marker-free registration of forest TLS data based on the previous work [28], but the deviations are large in the results.
Commonly, UAVs can acquire point clouds with georeferenced information based on the GNSS-IMU technique. Some TLS instruments integrate a Global Positioning System (GPS) receiver to survey the location of a scanner and an inclinometer or an inertial measurement unit to measure the orientation of the instrument. Therefore, many studies register point clouds using external devices [32,33]. Nevertheless, due to the occlusion of the forest, especially in a dense forest, the GPS signal may be blocked by the trees, which affects the practical performance [34]. Additionally, methods based on feature primitives, including corner point, line and plane features [35,36], have been proposed, which extract the feature and its correspondence to calculate the transformation between data. For example, Yang et al. [37] and Cheng et al. [38] achieved automatic registration of terrestrial and airborne point clouds using building outline features. The methods are suitable for urban scenes with regular buildings. However, there are low overlapping areas between TLS and UAV data because of occlusion and different perspectives of the forest, especially in a dense forest. As a result, tree outline features may appear with different shape contexts in both TLS and UAV data, and incorrectly corresponding geometric features may be identified by the methods. Therefore, the attributes of trees, e.g., tree locations [28,39,40], and tree canopies [41,42], have also been used as primitives for the registration of multiplatform point cloud. For example, Polewski et al. [39] detected tree locations to achieve marker-free coregistration of UAV and backpack LiDAR point clouds, in which the tree locations in the UAV data were determined by the highest point of the tree crowns, and the tree locations in the backpack LiDAR point clouds were derived from the tree stems. Then, the corresponding pairs were checked by a tree location distance descriptor for calculating the transformation. The methods based on the tree attributes perform well when the correspondences are recovered correctly. However, similar to the registration of TLS data, these methods generally take some time to extract the trees of tree stems. In addition, if trees are clustered together, the aforementioned attributes of trees will be difficult to detect accurately, especially in UAV data, and then inaccurate registration results may occur.
Some studies registered multiple point clouds, such as the registration of multiple/pairwise TLS point clouds and the registration of UAV and TLS data. However, few studies have attempted to develop a uniform method for the registration of multiple point clouds from different remote sensing platforms. In this paper, we present an approach for registering multisource point clouds for obtaining the complete structural information of forest plots. First, to reduce the dependence on tree attributes and improve the alignment efficiency, an automated, marker-free alignment algorithm is studied for the coarse alignment of multisource point clouds. Moreover, to avoid the use of artificial targets in the process of fine registration and ensure the registration accuracy, a graph-based optimization framework is used for the adjustment of multisource point clouds.

2. Materials and Methods

2.1. Study Area

The study area is located in Saihanba National Forest Park in Hebei Province in northern China. To demonstrate the effectiveness and robustness of the proposed method, we collected data from three sample plots with different tree species and stem densities, i.e., Plot A, Plot B, and Plot C, and the size of each plot is approximately 30 m × 30 m. The main tree species growing in the three plots are larch, Pinus sylvestris, and white birch, of which Plot A is a larch plot, Plot B is a white birch plot, and Plot C is a forest plot of both larch with pinus sylvestris. The stem density in Plot A is approximately 300 stems/ha, 150 stems/ha in Plot B, and 1000 stems/ha in Plot C. The diameter at breast height (DBH) values range from 23 cm to 34 cm in Plot A, 22 cm to 28 cm in Plot B, and 22 cm to 30 cm in Plot C, for which the breast height is defined as 1.3 m above the ground, which was extracted by the method of Zhang et al. [21]. In addition, the mean tree height is 19.71 m in Dataset 1, 17.86 m in Dataset 2, 13.42 m in Dataset 3, and 19.25 m in Dataset 4. In the three plots, we collected four datasets at different times, and each dataset consisted of multi-scan TLS point clouds and the corresponding UAV data. From Plot A, two datasets were collected: one dataset was collected in August 2018 (Dataset 1), and the other was collected in July 2016 (Dataset 4); the other two datasets were collected in August 2018 from Plot B (Dataset 2) and Plot C (Dataset 3).

2.2. Multisource Point Clouds

The TLS data (Figure 1d) were collected using a RIEGL VZ-1000 laser scanning system (Figure 1a) with a full field-of-view of 360° in the horizontal direction and 100° (+60°/−40°) in the vertical direction. The maximum scan range is 1400 m, the measurement precision can reach 5 mm at 100 m, and the maximum measurement rate is 122,000 points/s. The laser beam operated in increments of 0.03° in both the horizontal and vertical directions. To acquire complete structural information, each sample plot was measured using five scans: one scan was placed at the plot center, and the others were placed at the four corners of the plot. The height above ground of the TLS is approximately 1.5 m in each of scan locations.
The UAV data were mainly collected in August 2018 (Dataset 1 (Figure 1e), Dataset 2, and Dataset 3) using a RIEGL miniVUX-1UAV LiDAR system (Figure 1b) mounted on a six-rotor UAV platform. The UAV integrated a GNSS-IMU system and a LiDAR scanner with a scanning field-of-view of 360°. The five-returns-per-pulse system was operated at a 100-kHz pulse repetition rate. The flight altitude of the platform was 50 m above the ground level, and the UAV flew at a speed of 5 m/s. To increase the density of the point cloud, the UAV system made two flights in each plot, and thus, the density was approximately 150 points/m2. In addition, to assess the robustness of the proposed method, we obtained a point cloud from a digital camera (Figure 1c). The digital images were captured using a NEX-5N camera in July 2016 and correspond to Dataset 4; the field-of-view of the camera is 72° × 52°, the camera focal length is 16 mm and the camera resolution is 4912 × 3264. In total, 47 images were captured from a flight altitude of 50 m, and the corresponding point cloud was generated by the structure from motion (SfM) technique.

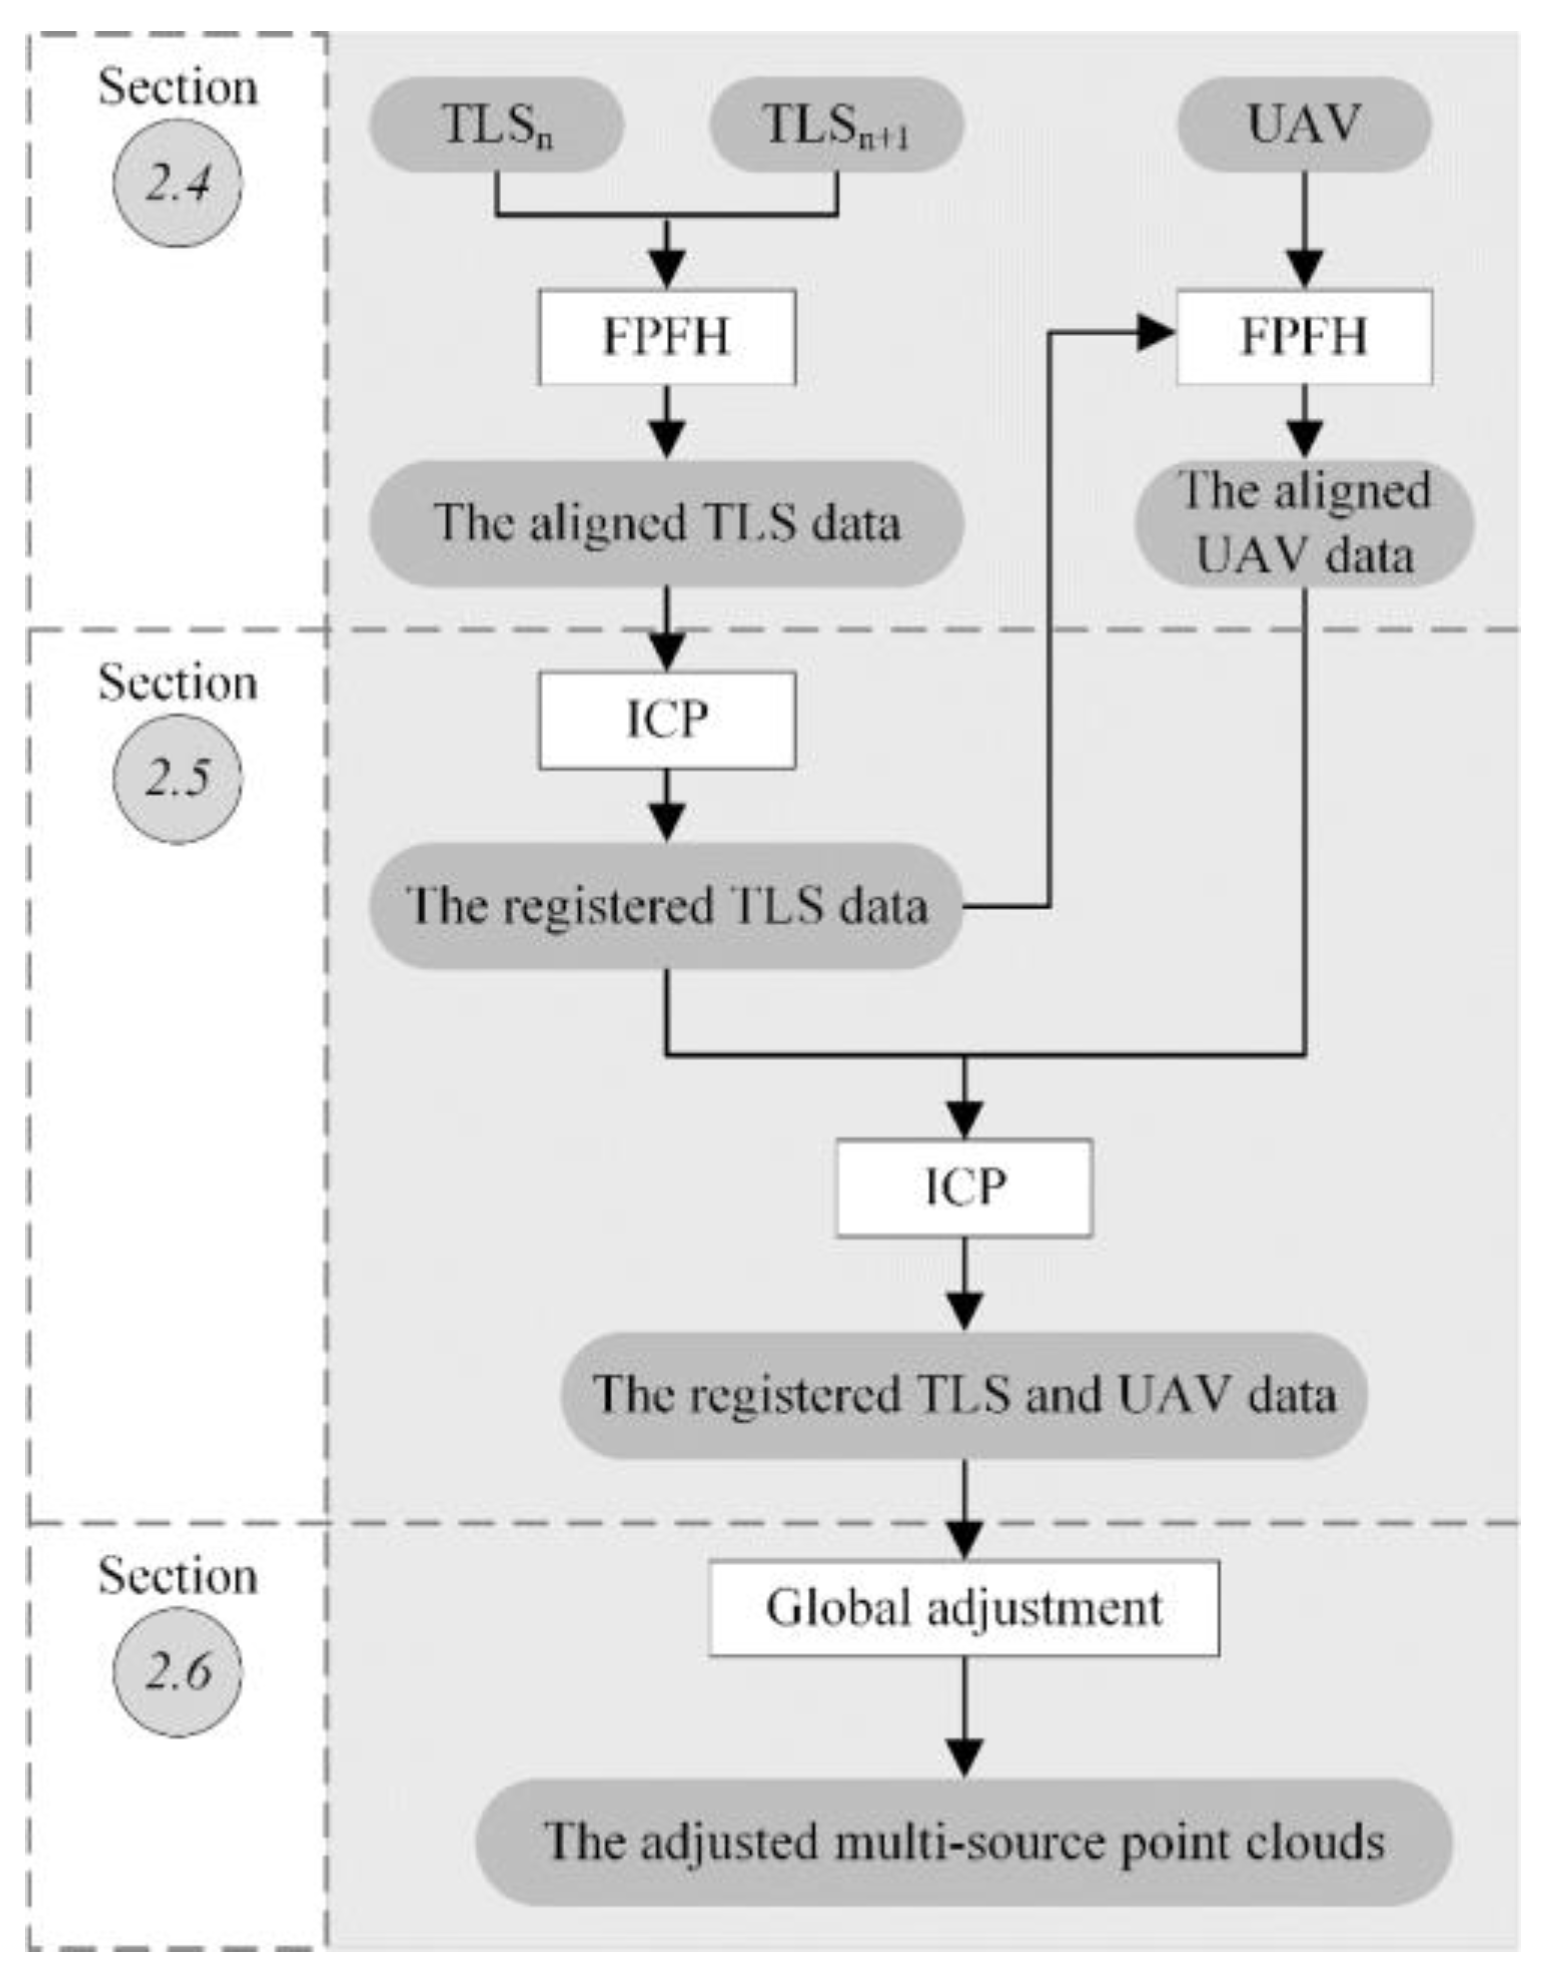
2.3. Overview of the Method

In this study, registration of multiplatform LiDAR point clouds of forests involves the registration of TLS data and the registration of TLS and UAV data, which consists of three aspects: coarse alignment, fine registration, and global adjustment. Figure 2 describes a procedure for the automated, marker-free registration of multisource point clouds. The process includes (1) the coarse alignment of the TLS point clouds and of the UAV data and the registered TLS data, (2) the fine pairwise registration of TLS point clouds and of the UAV data and the registered TLS data, and (3) the global adjustment of multisource point clouds, in which the registered TLS data that have been aligned with the UAV data in steps (1) and (2) are the fused results of multiple TLS point clouds after the fine registration step.

2.4. Coarse Alignment Using the Fast Point FeatureHistogram (FPFH) Method

Coarse alignment is used to obtain relative transformation between related data by extracting the corresponding features. In forests, due to the complexity and similarity of forest objects, some methods based on local features have difficulty extracting effective and reliable features for coarse alignment. However, compared to other scenes, forest scenes have abundant geometric attributes, and individual trees appear to have different geometric characteristics (e.g., tree distributions, tree shapes, tree heights, canopy shapes and sizes) and reveal a significant spatial difference between trees. Of the existing methods, the fast point feature histogram (FPFH) method extracts corresponding pairs of the related data based on the geometric relationship (the angle difference between the normal vectors of two points) between a point and its neighboring points within a specified range, which has the potential to identify the geometric difference between individual trees. Thus, we use the FPFH algorithm to achieve automatic coarse alignment of multisource point clouds and avoid artificial targets.
The FPFH method is an improvement over the point feature histogram (PFH) algorithm. The PFH is based on pose-invariant local features, which describe the surface properties at a point, and combines the geometric relations between the nearest neighbors of each point to align point clouds [43]. Due to the large computations associated with the PFH method, the improved FPFH method is proposed, which can reduce the computational complexity and still retain most of the descriptive power of the PFH method [44]. The FPFH calculates the geometric relations between the query point Pq and its k neighbor points instead of the relationship between each raw point and its neighbor points and estimates the simple point feature histogram (SPFH) values of the query point Pq first, in which the neighboring points are obtained based on the radius search of the Kdtree algorithm; then, the k neighbor points of each query point are redetermined, and the SPFH values of all the neighbor points are calculated for the FPFH value of Pq:
FPFH ( P q ) = SPFH ( P q ) + 1 k i = 1 k 1 w i · SPFH ( P i )
where wi is the weight of neighbor point Pi and represents the spatial distance between Pq and Pi. For the TLS data, we regard the coordinate system of one TLS point cloud as the local reference (e.g., the TLS point cloud in the center of a sample plot) and project the other point clouds into the reference coordinate system. In addition, for the alignment of the registered TLS data and UAV data, we regard the UAV data as the reference.

2.5. Fine Pairwise Registration

To reduce the aligned errors in the coarse alignment step, we implement the fine pairwise registration of TLS point clouds and the registration of the TLS and UAV data. In this step, a standard method, the iterative closest point (ICP) algorithm [45] is used to improve the alignment accuracy. The ICP algorithm is an iterative algorithm that minimizes the distance between correspondences in two point clouds, and it repeats the selection of corresponding pairs to compute an optimal rigid-body transformation. Consequently, the ICP algorithm should be performed on two data points with certain overlapping areas. Despite the different viewpoints between the TLS and UAV data, they share a large portion of points (e.g., the canopy and ground) because of the penetrability. Thus, the ICP algorithm is selected for the fine registration of multisource point clouds. Because the ICP algorithm is considered a mature technique, we implement it using off-the-shelf software (CloudCompare).

2.6. Graph-Based Global Adjustment

Although the fine pairwise registration step improves the registration accuracy of multisource point clouds, it may cause accumulative errors due to the overlap of multiple point clouds in a plot. Therefore, we propose to adjust multisource point clouds using a graph-based adjustment framework (Figure 3).
In general, each point cloud can cover the entire sample plot, so there is a certain overlap and approximate cover scope between each pairwise point cloud. Consequently, in Figure 3, the UAV data and each TLS point cloud T i are regarded as a vertex in the graph, and any two vertices can be connected by an edge e i j ( i j ). In the graph, we set the UAV data as the reference and all the other vertices are marked as movable. Finally, all the point clouds transformed by the previous step and their corresponding pose information are input into the graph-based adjustment framework, and we calculate the unknowns using the least squares method. In this paper, this step is implemented based on the work of Glira et al. [46].

3. Results

3.1. Evaluation of the Coarse Alignment Results

For the coarse alignment of the multi-scan TLS point clouds in the four datasets, we set the point cloud from the center of a plot as the reference (i.e., T1 in Figure 3) and aligned all the other TLS point clouds to the reference. To reduce the computational complexity, we subsampled each TLS point cloud with a spatial interval of 2.0 m. Additionally, the normal vector of the point and the neighbor radius of the query point were required by the FPFH algorithm. In this paper, the radius for computing the normal vector of a point and searching the neighbor points of the query point were set to 3.0 m. Then, the alignment results of multiple TLS point clouds are shown in Figure 4.
In Figure 4, all the TLS point clouds scanned at the plot corners are transformed into the coordinates of each reference. Although inaccurate results are obtained, the position and orientation of each TLS point cloud are consistent with those of the reference, which provides the foundation for fine registration of all the TLS point clouds. In addition, we implement the coarse alignment of the registered TLS data and UAV data using the FPFH algorithm (Figure 5). Similarly, to extract effective corresponding feature points, we subsampled all the point clouds with a spatial interval of 2.0 m and set the search radius to 3.0 m.
From the coarse alignment results, the attitudes of the registered TLS data were basically consistent with that of the corresponding UAV data, which indicates a potential for correct fine registration of the registered TLS data and the UAV data. To quantitatively assess the quality of coarse alignment, we calculated the distance between the corresponding tree stems in the two related point clouds and summarized the average distance in Table 1.
From Table 1, the average distances for each corresponding dataset were instable and varied between 0.3 m and 2.5 m. The total average distances for all the datasets were more than 1.0 m, in which the total average distance for Dataset 1 was the lowest of the four datasets. In Dataset 2, the average distances showed a large difference between the related data. In Dataset 3, the average distances between the corresponding tree stems varied between 0.9 m and 2.4 m, and the total average distance was the largest in the four datasets. The average distances between the related data showed a large change in Dataset 4 and varied between 0.6 m and 2.5 m, and the total average distance was 1.221 m. In the results, there were differences in the coarse alignment of different data pairs. Overall, the alignment quality was affected by the data source and the type of forest plot, and the FPFH algorithm had difficulty obtaining consistent alignment results in the forest environments.

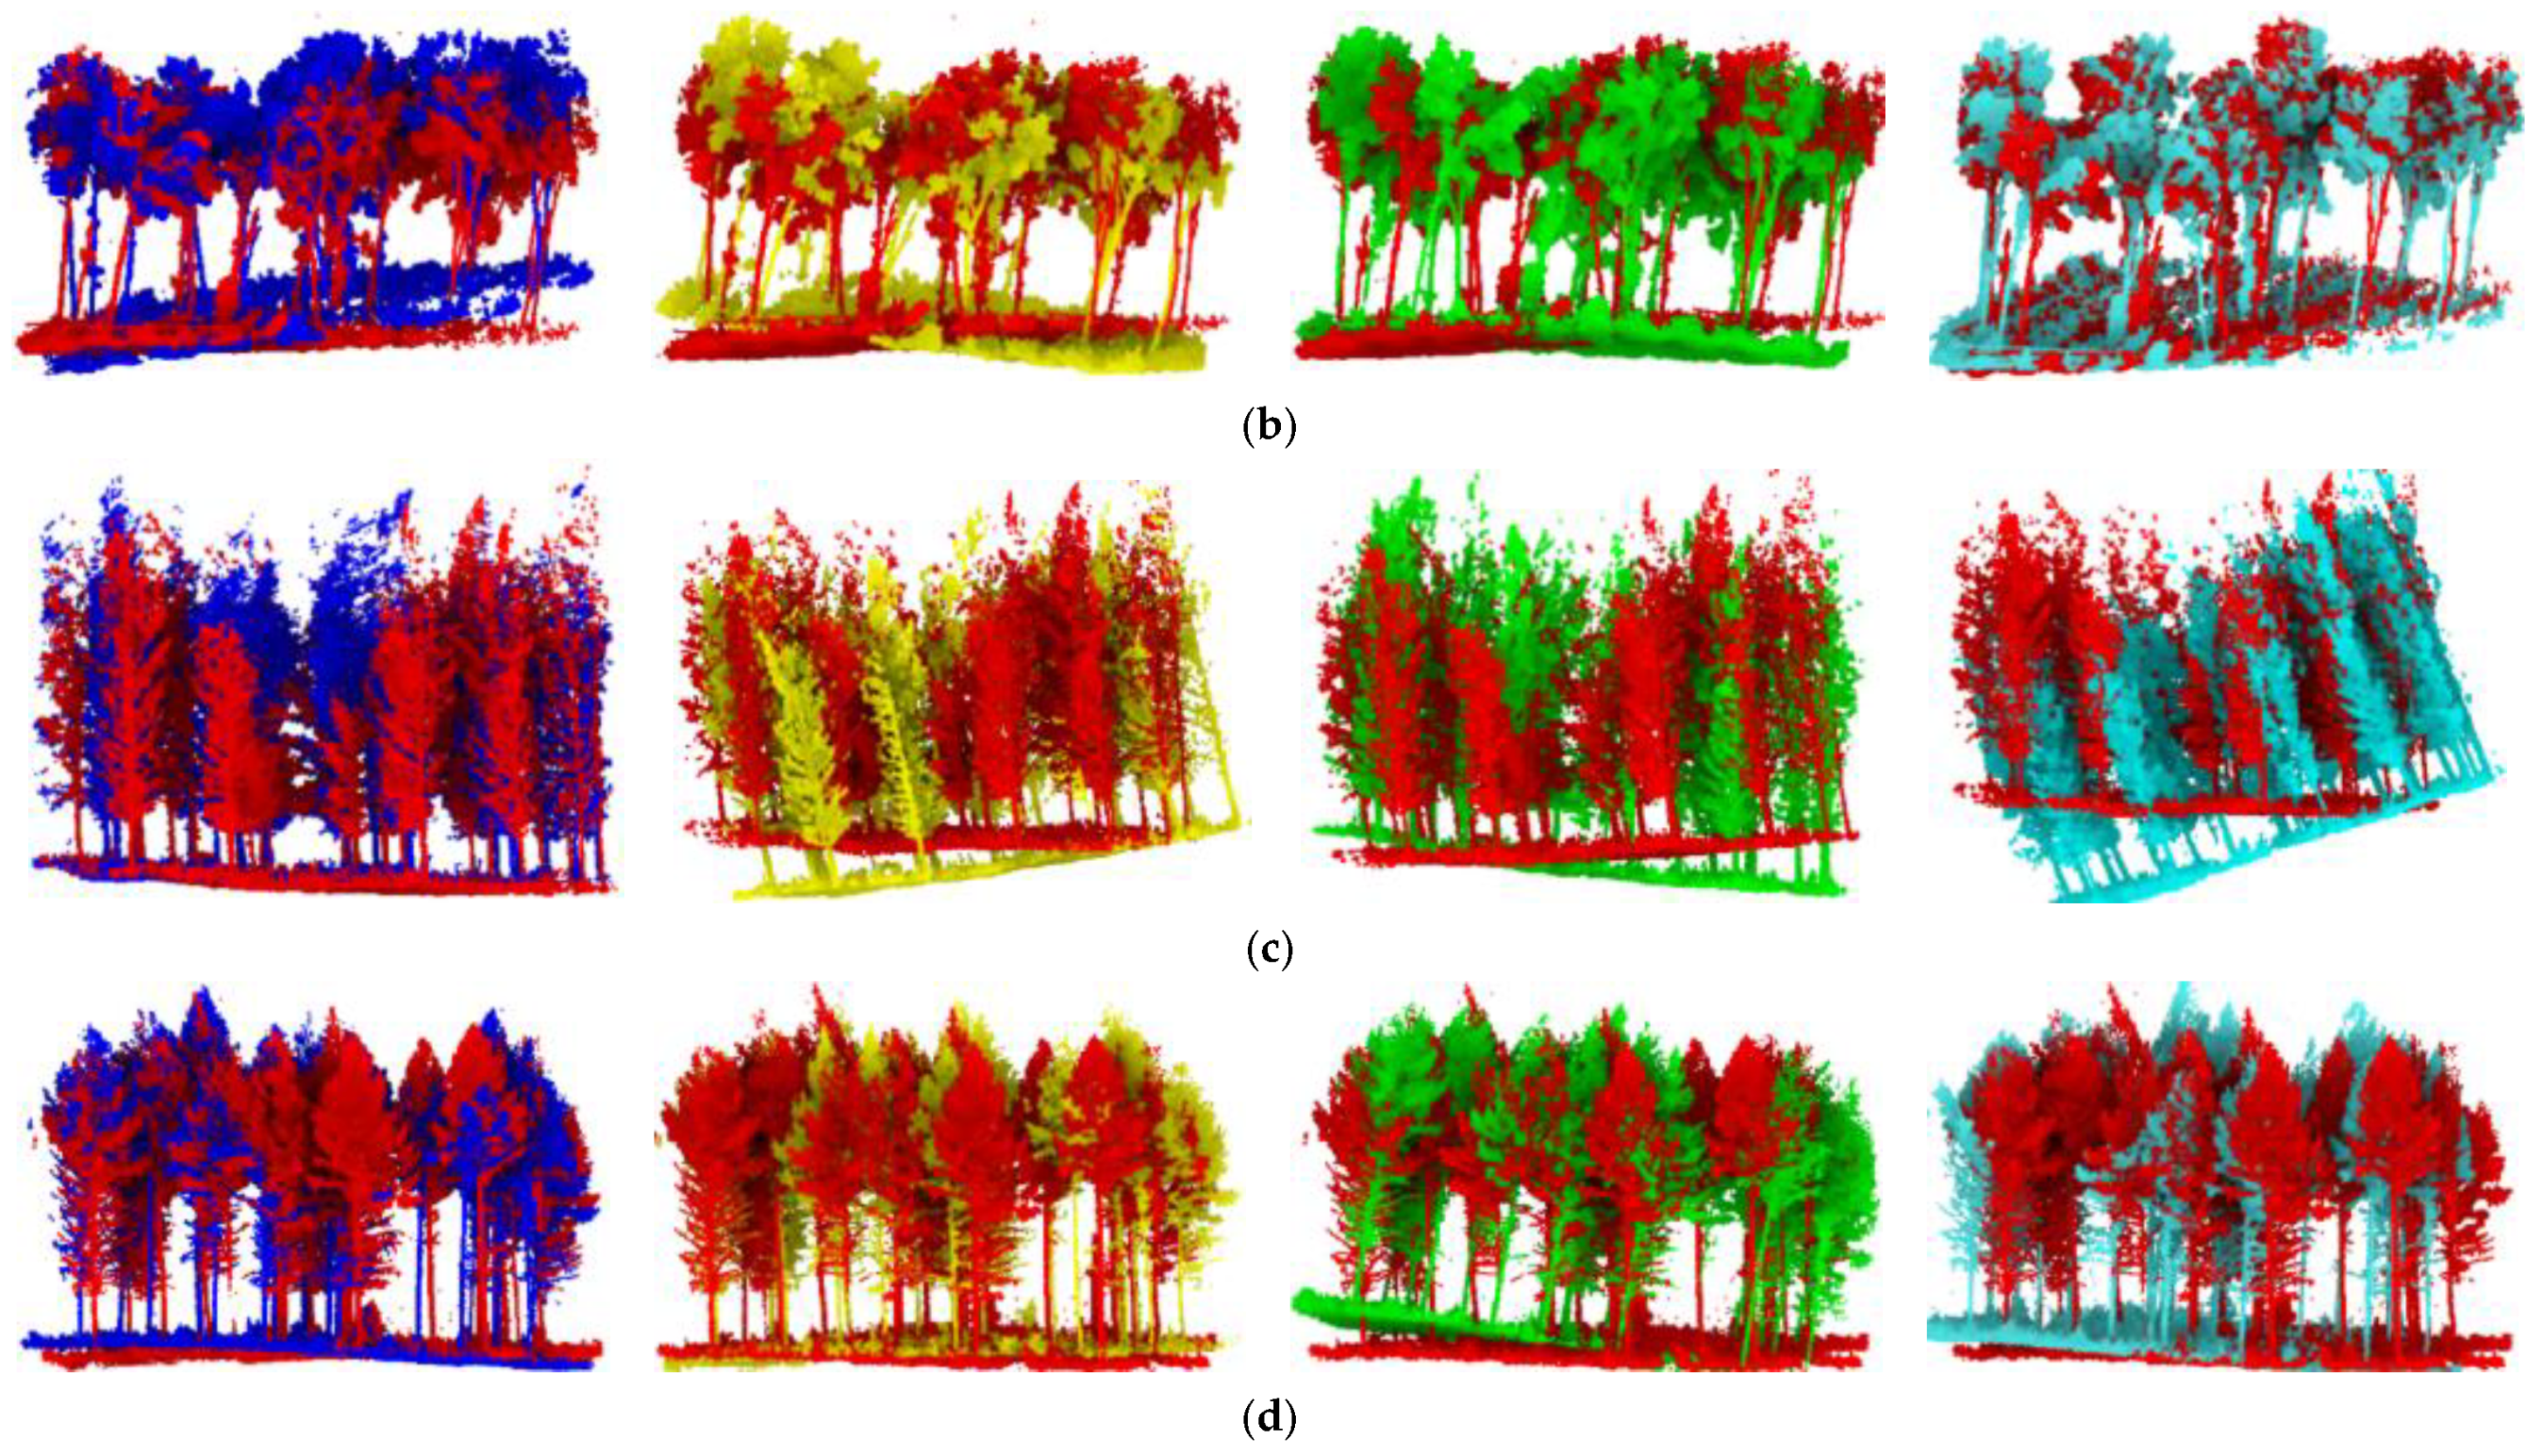
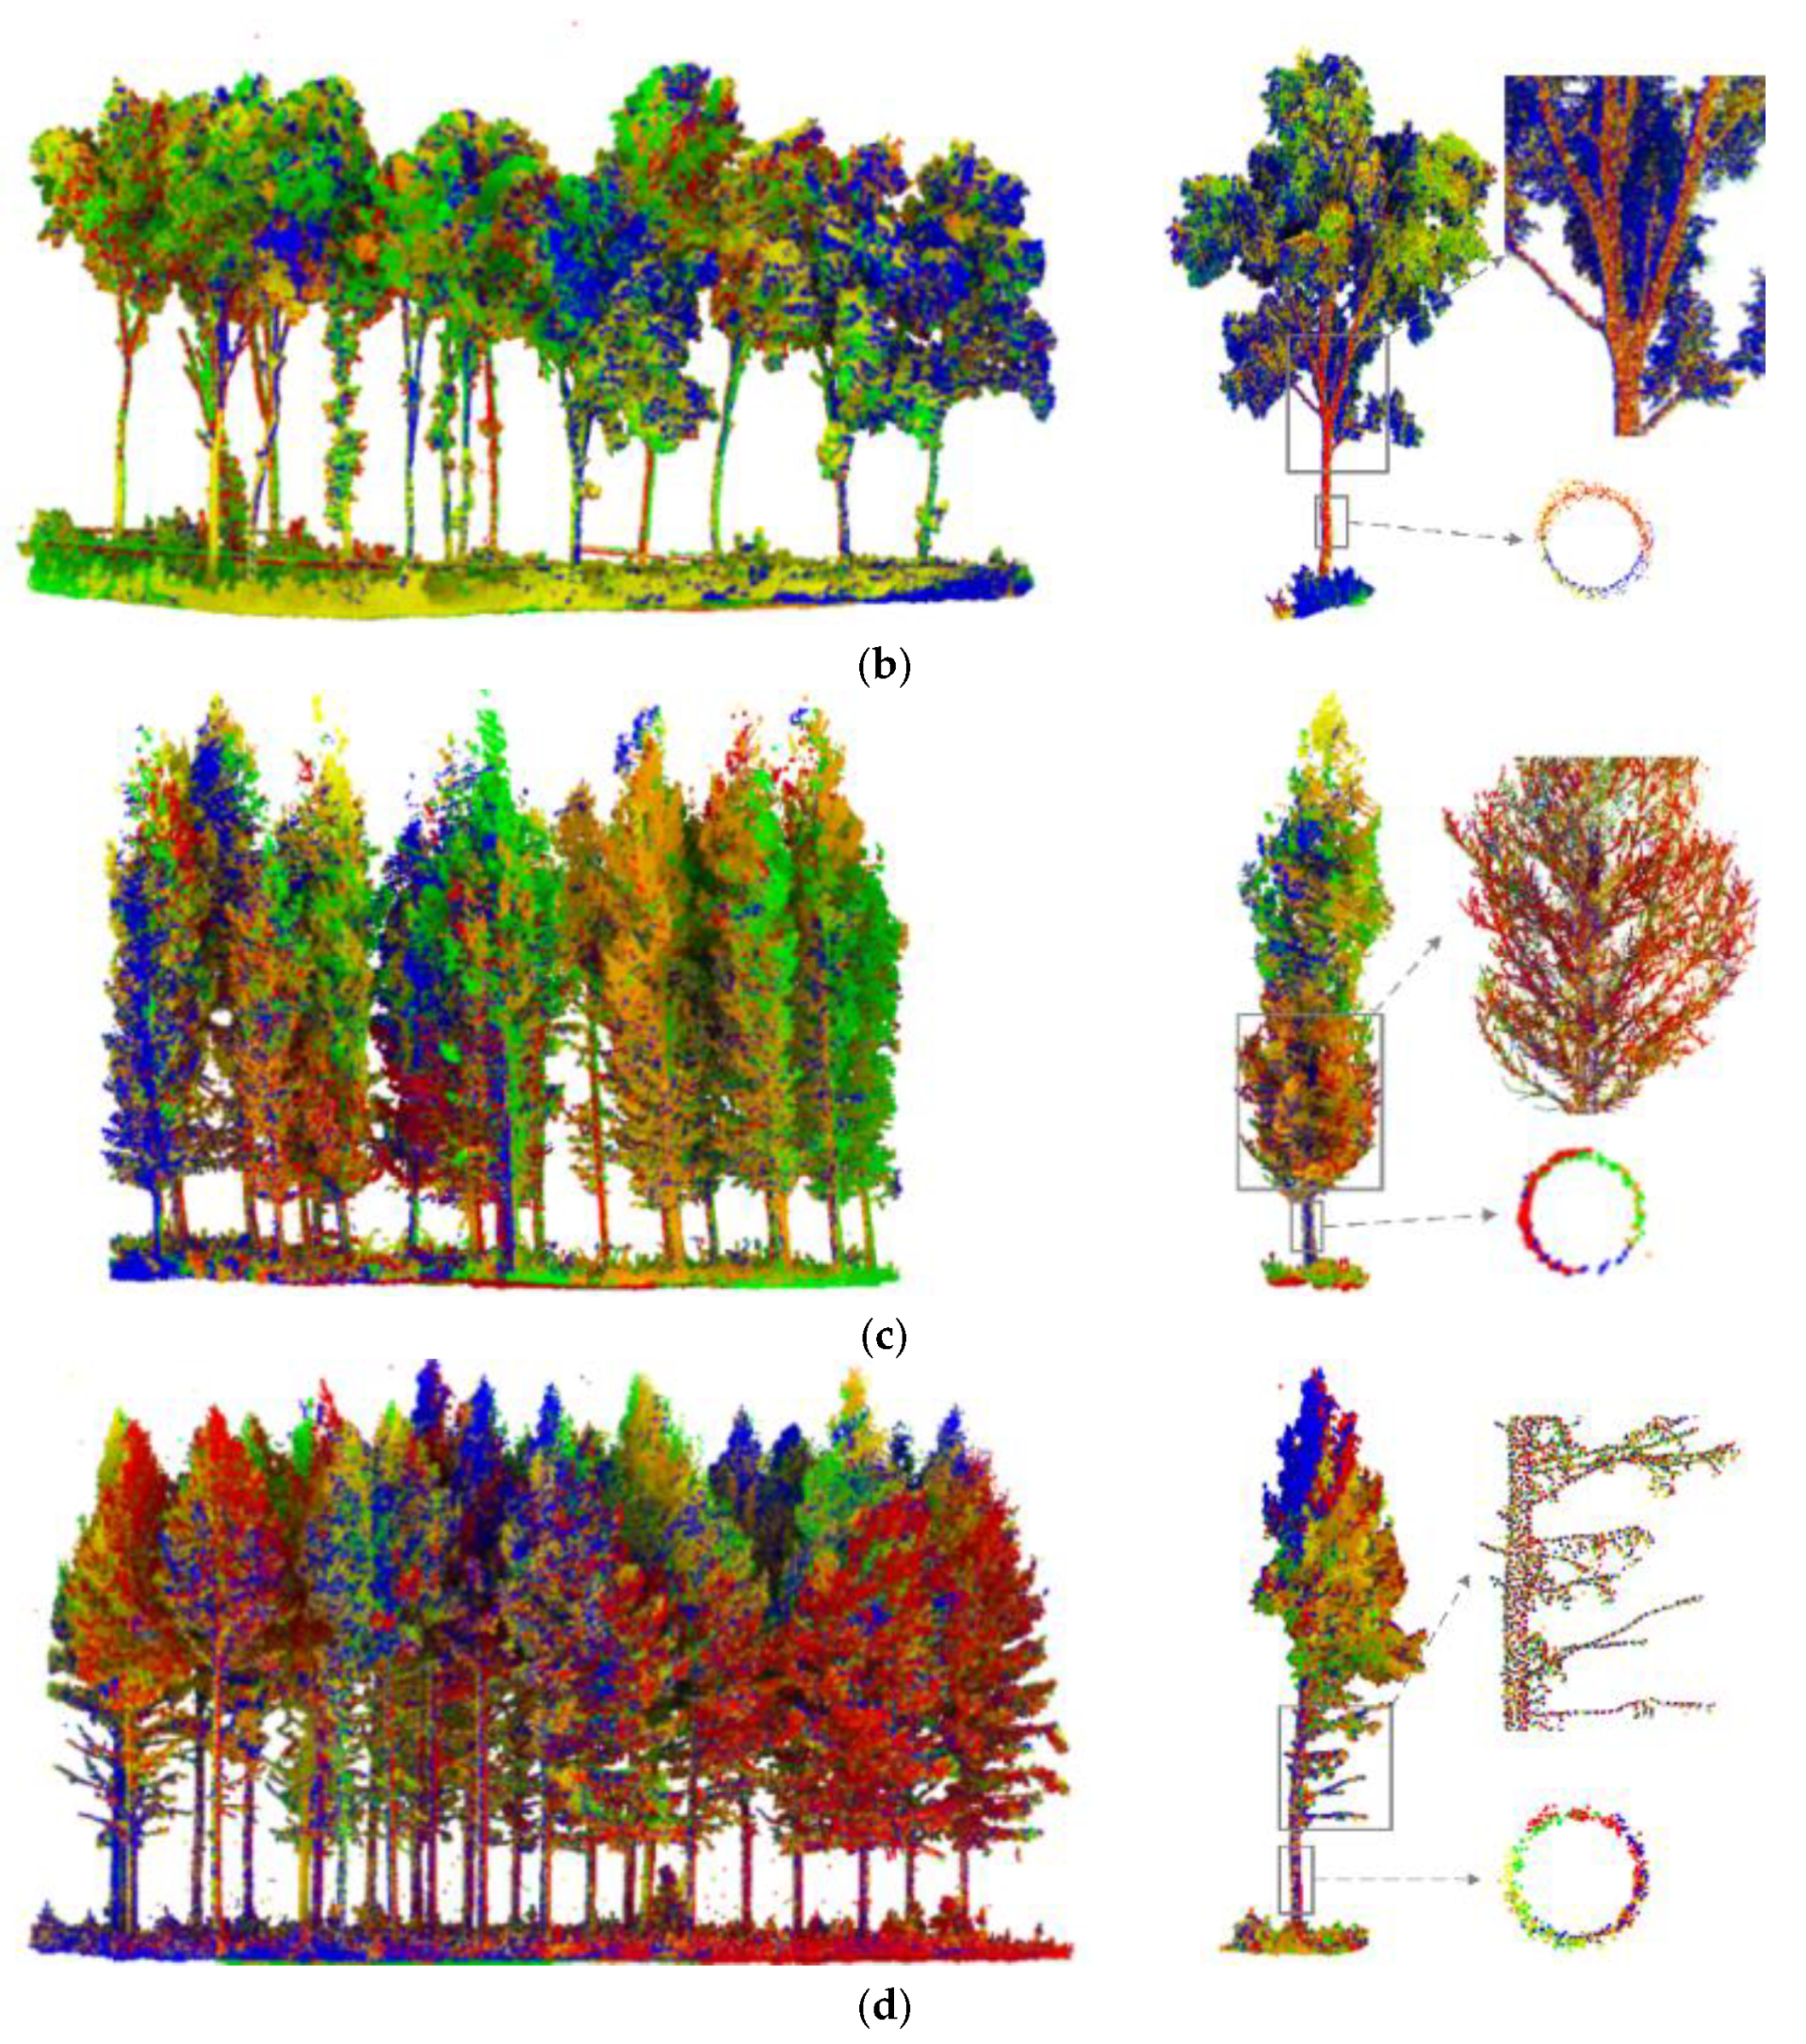
3.2. Registration of the Multisource Point Clouds

In the global adjustment step, the UAV data were set as the reference and all the TLS point clouds were adjusted and projected into the coordinate system of the reference. To improve the convergence rate and reduce the computational complexity, we first subsampled all the point clouds with a spatial interval of 0.03 m. Then, the multiple processed point clouds were input into the graph-based adjustment framework. Due to the different measurement precisions between the TLS and UAV data, we assessed the registration results of the multiple TLS point clouds and the registration results of the TLS and UAV data. Figure 6 shows the adjustment results of multi-scan TLS point clouds.
From Figure 6, all the TLS point clouds were converted correctly into the reference coordinate system and the errors were reduced by the global adjustment step. The adjustment results of a tree suggest that the proposed method achieves a highly accurate registration of multiple TLS point clouds. In particular, the tree branch points are registered well without deviations, which indicates highly accurate results in the vertical direction. In addition, the cross section of a tree stem can be fitted to a full circle, and a gapless connection between stem point clouds is achieved, which indicates high accuracy in the horizontal direction. Furthermore, to quantitatively assess the registration results, we selected some remarkable corner features from each TLS point cloud and computed an average spatial distance between the corresponding features to calculate deviations, including the mean deviation (MD), root mean square error (RMSE), standard deviation (STD), and the maximum deviation (Max). The results are summarized in Table 2.
From Table 2, the mean deviations, RMSE values, and the maximum deviations were at the centimeter level: the mean deviations and RMSE values were approximately 0.01 m, and the maximum deviations were lower than 0.02 m. The standard deviations were at the millimeter level, which indicates a certain stability of the results. In practice, to reduce the computational complexity, we subsampled the row point clouds with a spatial interval of 0.03 m, so there was a certain accidental error in the process of feature point selection.
Compared to the work of Calders et al. [30], the proposed method can achieve accurate global adjustment without the use of artificial markers. Compared to the work of [31], the proposed method can obtain higher accurate registration results of multiple TLS point clouds. Therefore, the results suggest the effectiveness of the graph-based method for the accurate registration of multiple TLS point clouds in forest environments. In addition, the registration results of the TLS and UAV data are shown in Figure 7.
In this study, the proposed adjustment framework performs well even if it has to solve a relatively large deviation between the UAV and TLS data. The UAV data are consistent with the TLS data in the four datasets, and there are few deviations in both the horizontal and vertical directions. In addition, we selected some corresponding feature points and computed the distance between the correspondences to quantitatively evaluate the registration accuracies in the horizontal and vertical directions (see Table 3 and Table 4, respectively).
The mean deviations, RMSE, and the standard deviations in the horizontal direction were at the centimeter level in the four datasets: the mean deviations and RMSE values varied between 0.02 m and 0.03 m, the STD values were approximately 0.01 m, and the maximum deviations were less than 0.045 m. In the vertical direction (Table 4), the mean deviations and RMSE values were varied between 0.010 m and 0.015 m, and the standard deviations were at the millimeter level which indicated a higher registration accuracy than that in the horizontal direction. In this study, because the plot terrains are relatively flat, the constraints in the horizontal direction are mainly from the canopy, and the ground provides strong constraints for registration in the vertical direction. However, due to the lack of stable features in the canopies, the overall accuracies in the horizontal direction were lower than those in the vertical direction. Overall, to obtain accurate tree attributes in forests, especially tree heights, we achieved mutual complementation between the TLS and UAV data using registration.
We implemented the proposed method in three plots, including a larch plot, a white birch plot, and a mixed forest plot of both larch with Pinus sylvestris. The stem densities of the three plots are different. In addition, the UAV data involve two types: one is derived from digital images and another is derived from LiDAR system. From the results, the proposed method is effective and robust for the automated registration of multisource point clouds of the plots with different tree species and stem densities. This shows the effectiveness of the proposed method in the coarse alignment and the global adjustment.

4. Discussion

4.1. Runtime Performance Analysis

The proposed method was implemented on a computer with an Intel (R) Core (TM) i7-3520M CPU @ 2.90 GHz and with 8.00 GB RAM. The runtime performance of the proposed method for the coarse alignment of multisource point clouds is summarized in Table 5.
In general, the larger the number of points, the longer the execution time. From Table 5, the numbers of points in almost all the TLS point clouds in Dataset 2 were greater than those in the other datasets, so the execution times were basically longer than those of the other datasets. Similarly, the numbers of points in almost all the TLS point clouds in Dataset 4 were less than those in the other datasets, so the execution times were basically shorter than those of all the other datasets; moreover, the execution time for the coarse alignment of UAV data and the registered data was the shortest in the four datasets because of the least number of points. For Dataset 1, due to the largest number of point in the UAV data and a larger number of points in the TLS data, the execution time for coarse alignment of the UAV data and the registered TLS data was the longest in all datasets. For Dataset 2, although the number of points in the TLS data was the largest, the UAV data had the least number of points, so that the execution time fell between the shortest time and the longest time.
Overall, the average execution time for coarse alignment of the TLS data was 20.61 s, and the average execution time for coarse alignment of the UAV data and the registered TLS data was 53.23 s. In the literature, Kelbe et al. [28] and Liu et al. [29] implemented the automated marker-free registration of TLS data based on the tree stem attributes. Polewski et al. [15] registered the multiplatform LiDAR point clouds by implementing individual tree segmentation first. However, the processes of tree segmentation and stem detection are generally complex and time consuming. In addition, Dai et al. [42] fused forest airborne and terrestrial point clouds, in which the numbers of point were in the millions and the average execution time for coarse alignment was 10.8 min in four datasets. Thus, the execution time of this paper is shorter, which suggests a higher efficiency.

4.2. Data Performance Analysis

The main purpose of this paper is to obtain complete 3D structural information of forests and to accurately detect the structural parameters in the forest measurements. In particular, the goal of the registration of multiple TLS data is to completely cover the below-canopy scene, and the goal of the registration of TLS and UAV data is to obtain complete vertical structural information. Therefore, to assess the effectiveness of the proposed method, we analyze the performance of the registration results on the detection of forest structural parameters, including the DBH and tree height.
The DBH is determined by extracting a cross section of the point cloud that falls between 1.2 m and 1.4 m above the ground level. Therefore, we extracted points that represented the tree stem hull at breast height and used the least squares method to fit a circle to these points. To evaluate the performance of the fitted DBH, we regarded the DBH fitted by multiple TLS data as the reference and compared the DBH fitted by a single TLS point cloud with the reference. The results are summarized in Table 6.
In general, the more complete the data are, the higher the accuracy in the detection of structural parameters in the forest. Therefore, there are deviations in the DBH values between a single TLS point cloud and multiple TLS data. As seen in Table 6, the mean absolute deviations varied between 0.012 m and 0.026 m, where the mean DBH value is 0.291 m in Dataset 1. In Dataset 2, the mean absolute deviations varied between 0.014 m and 0.026 m, and the RMSE values varied between 0.017 m and 0.032 m, where the mean DBH value was 0.217 m. In Dataset 3, the mean absolute deviations of all the TLS point clouds varied between 0.006 m and 0.014 m, where the mean DBH was 0.183 m. In Dataset 4, the mean absolute deviations of all the TLS point clouds varied between 0.022 m and 0.033 m and the RMSE values were more than 0.029 m, where the mean DBH was 0.272 m. In general, the overall accuracies could reach more than 90%. Although highly accurate DBH values were derived from the single TLS point cloud, there are some deviations, and when the completeness of the tree stem is low, the deviation is large. In addition, there are some tree stems that cannot be scanned in a single TLS point cloud. Therefore, multi-scan TLS point clouds are necessary for the accurate detection of the DBH in forest measurements.
To evaluate the performance of the registered data in the vertical direction, we analyzed the differences between tree heights measured from different data, including the TLS data, UAV data, and the registered data of the TLS and UAV data, in which the registered data were considered the reference because of their completeness, and the tree height was calculated by the distance between the lowest point and the highest point of a tree. In this study, we selected some trees from each dataset and computed the difference in tree heights between these corresponding trees. The mean absolute deviation (MD) and RMSE values are summarized in Table 7.
Due to occlusion of the trees, tree heights measured from UAV data are generally and theoretically more accurate than those from TLS data. However, there are some errors in the process of generating UAV data from digital images, which results in large deviations for the UAV data. For example, the mean absolute deviation was 0.577 m, and the RMSE value was 0.677 m for the UAV data, which are greater than those for the TLS data in Dataset 4. In contrast, the mean absolute deviations and RMSE values from the UAV LiDAR point clouds were less than those from the TLS data (Dataset 1, Dataset 2, and Dataset 3), which were consistent with the theoretical assumptions. In particular, due to the similar tree shape, both the mean absolute deviation and RMSE values were small in Dataset 1 and Dataset 3; the small deviations were generally caused by the sparsity of the UAV data, for which the sparsity may lead to the omission of the highest point of a tree. In addition, although the accuracies of tree heights measured from the UAV LiDAR point clouds were greater than those from the TLS data in Dataset 2, the results indicated approximate deviation values, of which the mean absolute deviations and RMSE values were approximately 0.6 m and 1.0 m, respectively. The main reason for the results in Dataset 2 was the tree species. Compared to larch and Pinus sylvestris crowns, birch crowns are oval, and the position of the highest point is unstable and prone to large changes. Consequently, the deviations in Dataset 2 were greater than those in Dataset 1 and Dataset 3. Overall, registration of the TLS and UAV LiDAR point clouds is necessary for measuring the tree height accurately.

5. Conclusions

Registration of point clouds from the same or different platforms is important for accurate forest measurements (e.g., DBHs or tree heights) and large-scale forest inventories. To achieve the automated registration of multisource point clouds in forest scenes, which involves multi-scan TLS point clouds, UAV data from digital images and LiDAR, we propose a practical pipeline that consists of coarse alignment, fine registration, and global adjustment. In particular, the FPFH algorithm is used for the automatic coarse alignment of multisource point clouds, and the method considers the spatial distribution and geometric structure differences of individual trees and avoids the use of artificial markers. In addition, the graph-based adjustment framework method eliminates the accumulative errors and achieves a gapless registration of multi-scan TLS point clouds and UAV data. From the experimental results, the proposed method performs well and achieves highly accurate registration on the field data with different tree species and stem densities, which suggests a robust and reliable solution for the registration of multisource point clouds. Although an effective initial registration can be obtained, the FPFH algorithm is sensitive to the input parameters. Therefore, further work will focus on the determination of the input parameters and the reduction in the sensitivity of the parameters, thus improving the success rate and accuracy of coarse alignment. In addition, we will release the tool introduced in this paper to the community for forest point cloud registration.

Author Contributions

Conceptualization, W.Z. and J.S.; methodology, W.Z. and J.S.; software, S.J.; validation, L.L., J.G. and X.P.; formal analysis, S.J.; investigation, W.Z. and J.S.; resources, W.Z. and J.S.; data curation, L.L. and J.G.; writing—original draft preparation, W.Z. and J.S.; writing—review and editing, W.Z., J.S., S.J. and L.L.; visualization, J.S.; supervision, W.Z. and G.Z.; project administration, W.Z. and G.Z.; funding acquisition, W.Z. All authors have read and agreed to the published version of the manuscript.

Funding

This work was supported in part by the National Natural Science Foundation of China under Grant 41671414 and Grant 41971380, in part by the Guangxi Natural Science Fund for Innovation Research Team under Grant 2019GXNSFGA245001, and in part by the Open Fund of State Key Laboratory of Remote Sensing Science under Grant OFSLRSS201920.

Acknowledgments

We thank the support of Saihanba National Forest Park, Hebei Province, China for the experiments.

Conflicts of Interest

The authors declare no conflict of interest.

References

  1. Chambers, J.Q.; Asner, G.P.; Morton, D.C.; Anderson, L.O.; Saatchi, S.S.; Espírito-Santo, F.D.B.; Palace, M.; Carlos, S., Jr. Regional ecosystem structure and function: Ecological insights from remote sensing of tropical forests. Trends Ecol. Evol. 2007, 22, 414–423. [Google Scholar] [CrossRef]
  2. Nelson, R.; Krabill, W.; MacLean, G. Determining forest canopy characteristics using airborne laser data. Remote Sens. Environ. 1984, 15, 201–212. [Google Scholar] [CrossRef]
  3. Hackenberg, J.; Wassenberg, M.; Spiecker, H.; Sun, D. Non destructive method for biomass prediction combining TLS derived tree volume and wood density. Forests 2015, 6, 1274–1300. [Google Scholar] [CrossRef]
  4. Zhang, W.; Wan, P.; Wang, T.; Cai, S.; Chen, Y.; Jin, X.; Yan, G. A novel approach for the detection of standing tree stems from plot-level terrestrial laser scanning data. Remote Sens. 2019, 11, 211. [Google Scholar] [CrossRef] [Green Version]
  5. Lu, J.B.; Wang, H.; Qin, S.H.; Cao, L.; Pu, R.L.; Li, G.L.; Sun, J. Estimation of aboveground biomass of Robinia pseudoacacia forest in the Yellow River Delta based on UAV and Backpack LiDAR point clouds. Int. J. Appl. Earth Obs. Geoinf. 2020, 86, 102014. [Google Scholar] [CrossRef]
  6. Liang, X.; Hyyppä, J.; Kaartinen, H.; Lehtomäki, M.; Pyörälä, J.; Pfeifer, N.; Holopainen, M.; Brolly, G.; Francesco, P.; Hackenberg, J.; et al. International benchmarking of terrestrial laser scanning approaches for forest inventories. ISPRS J. Photogramm. Remote Sens. 2018, 144, 137–179. [Google Scholar] [CrossRef]
  7. Wallace, L.; Lucieer, A.; Watson, C.; Turner, D. Development of a uav-lidar system with application to forest inventory. Remote Sens. 2012, 4, 1519–1543. [Google Scholar] [CrossRef] [Green Version]
  8. Liang, X.; Kankare, V.; Hyyppä, J.; Wang, Y.; Kukko, A.; Haggrén, H.; Yu, X.; Kaartinen, H.; Jaakkola, A.; Guan, F.; et al. Terrestrial laser scanning in forest inventories. ISPRS J. Photogramm. Remote Sens. 2016, 115, 63–77. [Google Scholar] [CrossRef]
  9. Xia, S.; Wang, C.; Pan, F.; Xi, X.; Zeng, H.; Liu, H. Detecting stems in dense and homogeneous forest using single-scan TLS. Forests 2015, 6, 3923–3945. [Google Scholar] [CrossRef] [Green Version]
  10. Lovell, J.L.; Jupp, D.L.B.; Newnham, G.J.; Culvenor, D.S. Measuring tree stem diameters using intensity profiles from ground-based scanning lidar from a fixed viewpoint. ISPRS J. Photogramm. Remote Sens. 2011, 66, 46–55. [Google Scholar] [CrossRef]
  11. Shao, J.; Zhang, W.; Mellado, N.; Wang, N.; Jin, S.; Cai, S.; Luo, L.; Lejemble, T.; Yan, G. SLAM-aided forest plot mapping combining terrestrial and mobile laser scanning. ISPRS J. Photogramm. Remote Sens. 2020, 163, 214–230. [Google Scholar]
  12. Kelbe, D.; Van Adrdt, J.; Romanczyk, P.; Van Leeuwen, M.; Cawse-Nicholson, K. Single-scan stem reconstruction using low-resolution terrestrial laser scanner data. IEEE J. Sel. Top. Appl. Remote Sens. 2015, 8, 3414–3427. [Google Scholar] [CrossRef]
  13. Hyyppä, J.; Holopainen, M.; Olsson, H. Laser scanning in forests. Remote Sens. 2012, 4, 2919–2922. [Google Scholar] [CrossRef] [Green Version]
  14. Luo, L.; Wang, X.; Guo, Q.; Lasaponara, R.; Zong, X.; Masini, N.; Wang, G.; Shi, P.; Khatteli, H.; Chen, F.; et al. Airborne and spaceborne remote sensing for archaeological and cultural heritage application: A review of the century (1907–2017). Remote Sens. Environ. 2019, 232, 111280. [Google Scholar] [CrossRef]
  15. Polewski, P.; Ericksonc, A.; Yao, W.; Coopsc, N.; Krzysteka, P.; Stillab, U. Object-based coregistration of terrestrial photogrammetric and ALS point clouds in forested areas. ISPRS Ann. Photogramm. Remote Sens. Spat. Inf. Sci. 2016, 3, 347. [Google Scholar]
  16. Wang, Y.; Lehtomäki, M.; Liang, X.; Pyörälä, J.; Kukko, A.; Jaakkola, A.; Liu, J.; Feng, Z.; Chen, R.; Hyyppä, J. Is field-measured tree height as reliable as believed—A comparison study of tree height estimates from field measurement, airborne laser scanning and terrestrial laser scanning in a boreal forest. ISPRS J. Photogramm. Remote Sens. 2019, 147, 132–145. [Google Scholar] [CrossRef]
  17. Hilker, T.; Coops, N.C.; Culvenor, D.S.; Newnham, G.; Wulder, M.A.; Bater, C.W.; Siggins, A. A simple technique for co-registration of terrestrial lidar observations for forestry applications. Remote Sens. Lett. 2012, 3, 239–247. [Google Scholar] [CrossRef]
  18. Watt, P.; Donoghue, D. Measuring forest structure with terrestrial laser scanning. Int. J. Remote Sens. 2005, 26, 1437–1446. [Google Scholar] [CrossRef]
  19. Tansey, K.; Selmes, N.; Anstee, A.; Tate, N.; Denniss, A. Estimating tree and stand variables in a Corsican Pine woodland from terrestrial laser scanner data. Int. J. Remote Sens. 2009, 30, 5195–5209. [Google Scholar] [CrossRef]
  20. Pueschel, P. The influence of scanner parameters on the extraction of tree metrics from faro photo 120 terrestrial laser scans. ISPRS J. Photogramm. Remote Sens. 2013, 78, 58–68. [Google Scholar] [CrossRef]
  21. Zhang, W.; Chen, Y.; Wang, H.; Chen, M.; Wang, X.; Yan, G. Efficient registration of terrestrial lidar scans using a coarse-to-fine strategy for forestry applications. Agric. For. Meteorol. 2016, 225, 8–23. [Google Scholar] [CrossRef]
  22. Aiger, D.; Mitra, N.J.; Cohen-Or, D. 4-points congruent sets for robust pairwise surface registration. ACM Trans. Graph. 2008, 27, 1–10. [Google Scholar] [CrossRef] [Green Version]
  23. Mellado, N.; Aiger, D.; Mitra, N.J. SUPER 4PCS fast global pointcloud registration via smart indexing. Comput. Graph. Forum 2014, 33, 205–215. [Google Scholar] [CrossRef] [Green Version]
  24. Lowe, D.G. Distinctive image features from scale-invariant keypoints. Int. J. Comput. Vis. 2004, 60, 91–110. [Google Scholar] [CrossRef]
  25. Weinmann, M.; Weinmann, M.; Hinz, S.; Jutzi, B. Fast and automatic image-based registration of TLS data. ISPRS J. Photogramm. Remote Sens. 2011, 66, S62–S70. [Google Scholar] [CrossRef]
  26. Theiler, P.W.; Wegner, J.D.; Schindler, K. Keypoint-based 4-points congruent sets—Automated marker-less registration of laser scans. ISPRS J. Photogramm. Remote Sens. 2009, 96, 149–163. [Google Scholar] [CrossRef]
  27. Shao, J.; Zhang, W.; Mellado, N.; Grussenmeyer, P.; Li, R.; Chen, Y.; Wan, P.; Zhang, X.; Cai, S. Automated markerless registration of point clouds from TLS and structured light scanner for heritage documentation. J. Cult. Herit. 2019, 35, 16–24. [Google Scholar] [CrossRef] [Green Version]
  28. Kelbe, D.; Van Aardt, J.; Romanczyk, P.; Leeuwen, M.V.; Cawse-Nicholson, K. Marker-free registration of forest terrestrial laser scanner data pairs with embedded confidence metrics. IEEE Trans. Geosci. Remote Sens. 2016, 54, 4314–4330. [Google Scholar] [CrossRef]
  29. Liu, J.; Liang, X.; Hyyppä, J.; Yu, X.; Lehtomäki, M.; Pyörälä, J.; Zhu, L.; Wang, Y.; Chen, R. Automated matching of multiple terrestrial laser scans for stem mapping without the use of artificial references. Int. J. Appl. Earth Obs. Geoinf. 2017, 56, 13–23. [Google Scholar] [CrossRef] [Green Version]
  30. Calders, K.; Armston, J.; Newnham, G.; Herold, M.; Goodwin, N. Implications of sensor configuration and topography on vertical plant profiles derived from terrestrial lidar. Agric. For. Meteorol. 2014, 194, 104–117. [Google Scholar] [CrossRef]
  31. Kelbe, D.; Van Aardt, J.; Romanczyk, P.; Leeuwen, M.V.; Cawse-Nicholson, K. Multiview marker-free registration of forest terrestrial laser scanner data with embedded confidence metrics. IEEE Trans. Geosci. Remote Sens. 2017, 55, 729–741. [Google Scholar] [CrossRef]
  32. Böhm, J.; Haala, N. Efficient integration of aerial and terrestrial laser data for virtual city modeling using LASERMAPs. In Proceedings of the ISPRS Workshop Laser Scanning, Enschede, The Netherlands, 12–14 September 2015. [Google Scholar]
  33. Hauglin, M.; Lien, V.; Næsset, E.; Gobakken, T. Geo-referencing forest field plots by co-registration of terrestrial and airborne laser scanning data. Int. J. Remote Sens. 2014, 35, 3135–3149. [Google Scholar] [CrossRef]
  34. Shao, J.; Zhang, W.; Mellado, N.; Jin, S.; Cai, S.; Luo, L.; Yang, L.; Yan, G.; Zhou, G. Single scanner BLS system for forest plot mapping. IEEE Trans. Geosci. Remote Sens. 2021, 59, 1675–1685. [Google Scholar] [CrossRef]
  35. Yao, J.; Ruggeri, M.R.; Taddei, P.; Sequeira, V. Automatic scan registration using 3d linear and planar features. 3D Res. 2010, 1, 1–18. [Google Scholar] [CrossRef]
  36. Al-Durgham, K.; Habib, A. Association-matrix-based sample consensus approach for automated registration of terrestrial laser scans using linear features. Photogramm. Eng. Remote Sens. 2014, 80, 1029–1039. [Google Scholar] [CrossRef]
  37. Yang, B.; Zang, Y.; Dong, Z.; Huang, R. An automated method to register airborne and terrestrial laser scanning point clouds. ISPRS J. Photogramm. Remote Sens. 2015, 109, 62–76. [Google Scholar] [CrossRef]
  38. Cheng, X.; Cheng, X.; Li, Q.; Ma, L. Automatic registration of terrestrial and airborne point clouds using building outline features. IEEE J. Sel. Top. Appl. Remote Sens. 2018, 11, 628–638. [Google Scholar] [CrossRef]
  39. Polewski, P.; Yao, W.; Cao, L.; Gao, S. Marker-free coregistration of UAV and backpack lidar point clouds in forested areas. ISPRS J. Photogramm. Remote Sens. 2019, 147, 307–318. [Google Scholar] [CrossRef]
  40. Kukko, A.; Kaijaluoto, R.; Kaartinen, H.; Lehtola, V.V.; Jaakkola, A.; Hyyppä, J. Graph SLAM correction for single scanner MLS forest data under boreal forest canopy. ISPRS J. Photogramm. Remote Sens. 2017, 132, 199–209. [Google Scholar] [CrossRef]
  41. Paris, C.; Kelbe, D.; Van Aardt, J.; Bruzzone, L. A novel automatic method for the fusion of ALS and TLS lidar data for robust assessment of tree crown structure. IEEE Trans. Geosci. Remote Sens. 2017, 55, 3679–3693. [Google Scholar] [CrossRef]
  42. Dai, W.; Yang, B.; Liang, X.; Dong, Z.; Huang, R.; Wang, Y.; Li, W. Automated fusion of forest airborne and terrestrial point clouds through canopy density analysis. ISPRS J. Photogramm. Remote Sens. 2019, 156, 94–107. [Google Scholar]
  43. Rusu, R.B.; Blodow, N.; Marton, Z.C.; Beetz, M. Aligning point cloud views using persistent feature histograms. In Proceedings of the IEEE/RSJ International Conference on Intelligent Robots and Systems, Nice, France, 22–26 September 2008; pp. 22–26. [Google Scholar]
  44. Rusu, R.B.; Blodow, N.; Beetz, M. Fast point feature histograms (FPFH) for 3d registration. In Proceedings of the IEEE International Conference on Robotics and Automation, Kobe, Japan, 12–17 May 2009; pp. 12–17. [Google Scholar]
  45. Besl, P.J.; Mckay, N.D. A method for registration of 3-D shapes. IEEE Trans. Pattern Anal. 1992, 14, 239–256. [Google Scholar] [CrossRef]
  46. Glira, P.; Pfeifer, N.; Ressl, C.; Briese, C. A correspondence framework for ALS strip adjustment based on variants of the ICP algorithm. J. Photogram. Remote Sens. Geoinf. Sci. 2015, 4, 275–289. [Google Scholar]
Figure 1. Various platforms and examples of one tree point cloud, (a) represents the terrestrial laser scanning(TLS) platform, (b) represents the unmanned aerial vehicle(UAV) LiDAR platform, and (c) represents the unmanned aerial vehicle(UAV) platform carrying with a digital camera, (d,e) represent the TLS point cloud and UAV LiDAR point cloud of one tree, respectively.
Forests 12 00269 g001
Figure 2. Workflow of this paper. ‘Section 2.4’ describes the process of coarse alignment, ‘Section 2.5’ describes the process of fine registration, and ‘Section 2.6’ describes the process of global adjustment. ‘TLSn’ and ‘TLSn+1’ describe the point clouds of terrestrial laser scanning (TLS) in different scan locations, ‘UAV’ describes the point cloud data obtained by unmanned aerial vehicle (UAV). ICP is the acronym of the iterative closest point algorithm and FPFH is the acronym of the fast point feature histogram algorithm.
Forests 12 00269 g002
Figure 3. Graph of the global adjustment framework. Five scans (T1–T5) in a 30 m × 30 m sample plot are illustrated as an example, in which T1 is placed at the center of the plot and T2–T5 are placed at the four corners.
Forests 12 00269 g003
Figure 4. Coarse alignment of the TLS point clouds (non-red points) scanned at the four corners and the reference (red points). (ad) represent the alignment results in Datasets 1, 2, 3, and 4, respectively.
Forests 12 00269 g004aForests 12 00269 g004b
Figure 5. Coarse alignment of the registered TLS data (red points) and UAV data (gray points). The UAV data in (ac) were obtained from the LiDAR system and the UAV data in (d) were generated from digital images.
Forests 12 00269 g005
Figure 6. Global adjustment results. Different colors represent different TLS point clouds. (ad) represent the adjustment results of the TLS point clouds in Datasets 1, 2, 3, and 4, respectively.
Forests 12 00269 g006aForests 12 00269 g006b
Figure 7. Registration results of the multiplatform point clouds. The gray points are the UAV data, and the red points are the TLS data. (ad) represent the results of Dataset 1, 2, 3, and 4, respectively.
Forests 12 00269 g007
Table 1. Coarse alignment results. ‘Avg. distance’ represents the average distance between the two related point clouds. ‘T. Avg.’ column represents the total average distance of each dataset. ‘T1’ represents the TLS point cloud by scanning in the plot center, ‘T2’, ‘T3’, ‘T4’, and ‘T5’ represent the TLS data by scanning in the four corners of the plot. ‘TLS’ represents all registered TLS point clouds and ‘UAV’ represents UAV data.
DatasetAvg. Distance (m)T. Avg. (m)
T2–T1T3–T1T4–T1T5–T1UAV-TLS
10.5380.7480.5401.4941.7831.021
20.3852.2072.0050.8681.4021.373
30.9631.7521.4742.3711.6051.633
40.6571.5020.8622.4180.9481.277
Table 2. Adjustment accuracy. The ‘Dataset’ column represents the dataset index. The ‘Features’ column gives the number NT of the detected points in each dataset. The deviation is calculated as the spatial distance between the corresponding features in the overall data.
Dataset Features
NT
Deviations (m)
MDRMSESTDMax
1150.0120.0120.0020.014
2150.0120.0120.0020.016
3150.0110.0110.0020.013
4150.0110.0120.0030.015
Table 3. Horizontal accuracy. The ‘Dataset’ column represents the dataset index. The ‘Features’ column gives the number NT of the detected points in each dataset. The deviation is calculated as the horizontal distance between the corresponding features from the TLS and UAV data.
DatasetFeatures
NT
Deviations (m)
MDRMSESTDMax
1150.0220.0240.0110.040
2150.0220.0260.0130.045
3150.0210.0230.0090.033
4150.0210.0240.0110.041
Table 4. Vertical accuracy. The ‘Dataset’ column represents the dataset index. The ‘Features’ column gives the number NT of the detected points in each dataset. The deviation is calculated as the vertical distance between the corresponding features from the TLS and UAV data.
DatasetFeatures
NT
Deviations (m)
MDRMSESTDMax
1150.0120.0130.0060.021
2150.0110.0120.0030.016
3150.0100.0110.0040.017
4150.0130.0140.0060.021
Table 5. Runtime performance of the coarse alignment step. ‘UAV-TLS’ represents the coarse alignment of the UAV data and the registered TLS data, for which the registered TLS data were merged by with all the single TLS point clouds, and the corresponding number of points is equal to the sum of the number of point in all the single TLS point clouds.
DatasetNumber of Points (#)Runtime (s)
T1T2T3T4T5UAVT2–T1T3–T1T4–T1T5–T1UAV-TLS
1954,882602,360809,091721,898814,046698,57717.0819.3519.2418.7072.29
2777,368933,5021,437,3891,063,8551,002,022252,77922.6126.4926.4122.7858.11
3228,411183,293369,747479,223340,90889,3727.409.2210.279.9425.43
4398,351322,748191,401197,549278,773612,35323.9116.9716.5217.2329.29
Avg. of T2,3,4,5-T1: 17.76Avg.: 46.28
Table 6. The deviations in the diameter at breast height (DBH) values. ‘Ti’ represents a single TLS point cloud, ‘MD’ represents the mean absolute deviation, and ‘RMSE’ is the root mean square error of the DBH deviations.
DatasetDeviations (m)
T1T2T3T4T5
MDRMSEMDRMSEMDRMSEMDRMSEMDRMSE
10.0150.0170.0240.0310.0140.0160.0130.0150.0250.031
20.0250.0320.0140.0170.0170.0210.0180.0220.0190.022
30.0130.0160.0110.0150.0130.0150.0060.0050.0120.013
40.0330.0370.0320.0380.0290.0310.0220.0300.0320.039
Table 7. Deviations in the tree heights. ‘# Nt’ represents the number of sample trees. The deviation was calculated as the distance between a tree height measured from the reference and the correspondence measured from the TLS data or UAV data.
DatasetNumber of Trees
# Nt
Deviations (m)
TLSUAV
MDRMSEMDRMSE
1110.2390.4220.0450.096
2110.6161.0750.5450.919
3110.1660.2410.0180.060
4150.0410.1580.5770.677
Publisher’s Note: MDPI stays neutral with regard to jurisdictional claims in published maps and institutional affiliations.

