Article

Interactions between Different Organosilicons and Archaeological Waterlogged Wood Evaluated by Infrared Spectroscopy

by
Carmen-Mihaela Popescu
1,2 and
Magdalena Broda
3,4,*
1
Petru Poni Institute of Macromolecular Chemistry of Romanian Academy, 700487 Iasi, Romania
2
Centre of Wood Science and Technology, Edinburgh Napier University, Edinburgh EH11 4BN, UK
3
Department of Wood Science and Thermal Techniques, Faculty of Forestry and Wood Technology, Poznań University of Life Sciences, Wojska Polskiego 38/42, 60-637 Poznań, Poland
4
BioComposites Centre, Bangor University, Deiniol Road, Bangor, Gwynedd LL57 2UW, UK
*
Author to whom correspondence should be addressed.
Forests 2021, 12(3), 268; https://doi.org/10.3390/f12030268
Submission received: 2 February 2021 / Revised: 19 February 2021 / Accepted: 22 February 2021 / Published: 26 February 2021
(This article belongs to the Special Issue Historical Wood: Structure, Properties and Conservation)

Abstract

:
The goal of the study was to characterise chemical interactions between waterlogged archaeological wood and organosilicon compounds applied for its conservation to shed lights on the mechanism of wood dimensional stabilisation by the chemicals. Two alkoxysilanes (methyltrimethoxysilane and (3-mercaptopropyl) trimethoxysilane) and a siloxane (1,3-bis(diethylamino)-3-propoxypropanol)-1,1,3,3-tetramethyldisiloxane) were selected for the research since they already have been proven to effectively stabilise waterlogged wood upon drying. Fourier transform infrared spectroscopy was used for structural characterisation of the degraded wood and evaluation of reactivity of the applied chemicals with polymers in the wooden cell wall. The results obtained clearly show much stronger interactions in the case of alkoxysilanes than the siloxane, suggesting a different mechanism of wood stabilisation by these compounds. The results of this study together with other data obtained in our previous research on stabilisation of waterlogged archaeological wood with organosilicon compounds allow the conclusion that the mechanism of waterlogged wood stabilisation by the used alkoxysilanes is based on bulking the cell wall by silane molecules and wood chemical modification, while in the case of the applied siloxane, it builds upon filling the cell lumina.

Graphical Abstract

1. Introduction

Organosilicon compounds are chemicals containing a silicon atom and carbon–silicon bonds. Differing in the molecular weight, size and shape of molecules as well as the type of the side chain, they have found numerous applications in a broad range of industries, including the pharmaceutical, cosmetic, medical, chemical, food, agricultural, building, automobile, textile or paper industries. Most common are binding agents and adhesives, sealants, adjuvants, coatings or surface modifiers produced from organosilicons [1,2,3,4,5,6].
Due to the specific chemical structure and the resulting properties, the alkoxysilanes (particularly trialkoxysilanes) are the most frequently used organosilicon compounds. They are bifunctional chemicals containing alkoxy groups and organic groups (i.e., alkyl, fluoroalkyl, aminoalkyl, phenyl, thiol, hydroxyl, hydrogen, vinyl) which provide the specific functionality [3,7]. Alkoxy groups are easily hydrolysed in the presence of water. The resulting silanols are very reactive and condense readily, forming new covalent Si–O–Si bonds between silane monomers. A series of subsequent hydrolysis and condensation reactions, called the sol-gel process, leads to the formation of linear or spatial polymers [8,9]. Silanols can not only crosslink with the neighbouring molecules, but also react with hydroxyl groups of wood components by establishing siloxy bonds (Si–O–C) [10,11]. All the above features make alkoxysilanes very useful for modification of wood and wood-based products. They have so far been applied to increase wood durability against fungi and termites, limit leachability of other wood preservatives, improve wood weathering performance, reduce its flammability and hydrophilicity, or as coupling agents to improve bonding strength in various composites [12,13,14,15,16,17]. They have also proved to penetrate and bulk the cell wall, forming a three-dimensional network of polysiloxane and wood polymers which improves dimensional wood stability [8,13,18]. Therefore, they were also tried for archaeological waterlogged wood conservation, and some of them proved effective in stabilisation of wood dimensions upon drying, which is one of the most crucial issues related to conservation of this type of wood [19,20,21,22]. However, the method still requires further study, e.g., on the mechanical properties of the treated wood, the influence of the chemicals on wood colour, gloss and texture, or their long-term effect on wood before it could be proposed as a reliable conservation method.
The results of the research by Broda et al. [21,22] clearly showed that the stabilisation effect on waterlogged wood depends mainly on the type of an organic group attached to a silicon atom in organosilicons. Great dimensional stabilisation of waterlogged wood was obtained among other things due to methyltrimethoxysilane (MTMS), (3-mercaptopropyl) trimethoxysilane (MPTES) and 1,3-bis(diethylamino)-3-propoxypropanol)-1,1,3,3-tetramethyldisiloxane (DEAPTMDS) treatment, reaching anti-shrink efficiency values of about 81%, 98% and 90%, respectively. The chemicals applied vary in the effectiveness of wood stabilisation, as well as in the chemical structure. But in general, they represent two groups of organosilicons tested in our research on waterlogged wood stabilisation: alkoxysilanes (MTMS and MPTES) and siloxanes (DEAPTMDS). Therefore, as representative and the most effective ones, they were selected for further study on their reactivity with wood as this is considered one of the factors presumably affecting their stabilisation efficiency. Gaining this knowledge is the first step towards understanding the full mechanism of waterlogged wood stabilisation by organosilicon compounds, and it will be necessary to explain the results of different ongoing and future mechanical tests performed on untreated and treated wood.
Fourier transform infrared spectroscopy (FT-IR) is a fast, simple and sensitive method for the structural characterisation of many different materials, including wood. It has already been used for qualitative and quantitative evaluation of main wood components [23] or to study chemical and structural changes in wood polymers during biodegradation and weathering [24,25,26]. As the method requires only a small amount of the studied material, the technique proved to be useful for research on historical wooden objects. It allows, i.e., the evaluation of the extent of archaeological wood deterioration, the effectiveness of penetration and potential reactivity of conservation agents with wood or the monitoring of the impregnation agent polymerisation during the conservation process [27,28,29,30,31].
The aim of the present study is to characterise the reactivity of three organosilicon compounds differing in the chemical structure and type of the organic groups (methyltrimethoxysilane, (3-mercaptopropyl) trimethoxysilane and 1,3-bis(diethylamino)-3-propoxypropanol)-1,1,3,3-tetramethyldisiloxane) with archaeological waterlogged elm wood by using the infrared spectroscopy method in order to understand better their ability to stabilise dimensions of waterlogged wood upon drying. Moreover, the evaluation of the chemical composition of the waterlogged elm was performed to assess the extent of its degradation.

2. Materials and Methods

2.1. Materials

Waterlogged archaeological elm (Ulmus spp.) wood, dated back to the 10–11th centuries (Figure 1), along with fresh-cut elm wood as a reference, were used in this study. The archaeological elm log was excavated from the Lednica Lake (Greater Poland Voivodeship, Poland), where it was buried in the bottom sediments near the remains of the medieval bridge named “Poznań” connecting the medieval stronghold on the Ostrów Lednicki island with a road leading to Poznań city. The degree of wood degradation was severe, with maximum wood moisture content (MCmax) of 425%, the wood basic density of 160 kg/m3, loss of wood substance calculated to be 70%, and cellulose content reduced to about 5% (calculated as a percentage of the oven-dried mass of wood before degradation) [20].
For the present study, small cuboid samples with dimensions of 20 × 20 × 10 mm3 (in the tangential, radial and longitudinal direction, respectively) were cut out from the log, dehydrated in 96% ethanol for four weeks and divided into four sets (five specimens for each set). One set remained untreated, while the other three were treated with different organosilicon compounds: methyltrimethoxysilane (MTMS-1), (3-mercaptopropyl)trimethoxy silane (MPTES-2) and 1,3-bis(diethylamino)-3-propoxypropanol)-1,1,3,3-tetramethyldisiloxane (DEAPTMDS-3) (Figure 2), using the oscillated vacuum–pressure method as described before [20].
All the samples (treated and untreated) were air-dried for two weeks, then powdered and sieved, and the fraction with an average diameter less than 0.2 mm was retained for further analyses.

2.2. Methods

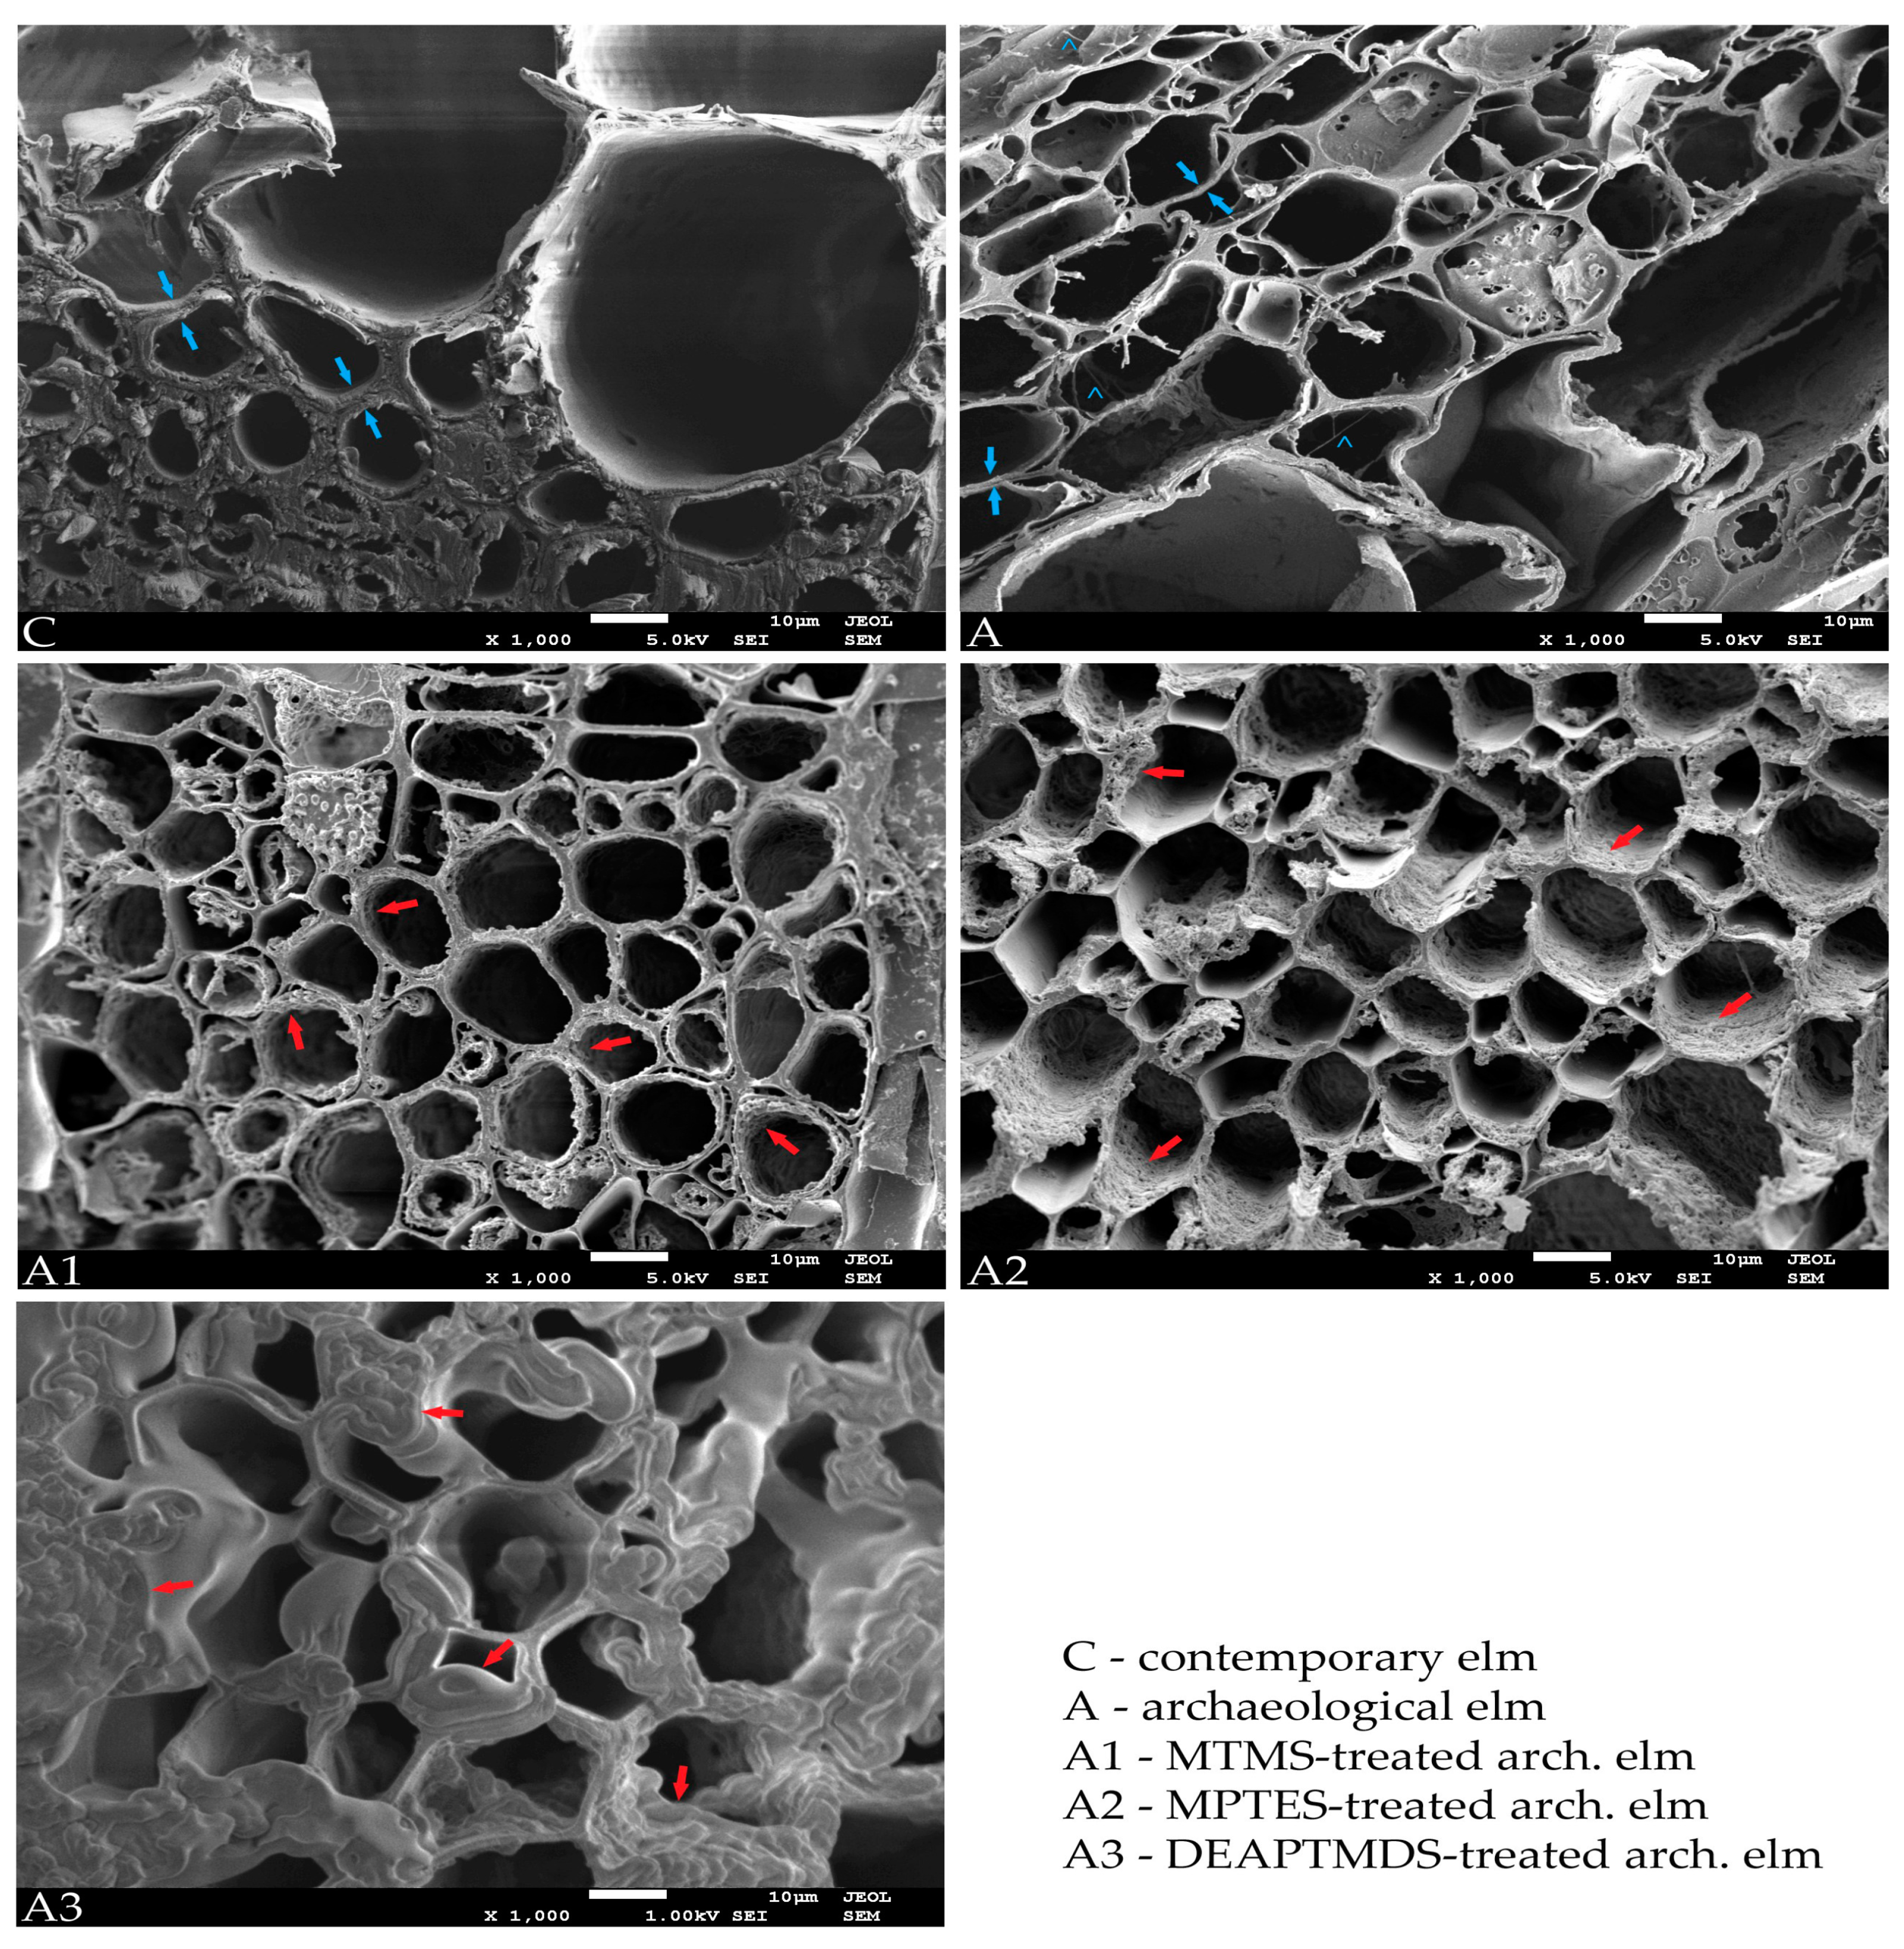
2.2.1. Scanning Electron Microscopy

The microstructure of untreated and treated wood was analysed using a scanning electron microscope (SEM) JEOL 7001F (Tokyo, Japan) with a Secondary Electron Imaging (SEI) detector (JEOL, Tokyo, Japan). The samples were air-dried, cut into smaller pieces and thoroughly cleaned from remaining dust and wooden particles by purging with nitrogen. Such prepared specimens were then coated for 240 s with a thin layer of chromium, mounted in the specimen holder and analysed. Imaging was performed at 1 kV or 5 kV accelerating voltage, depending on a wood sample.

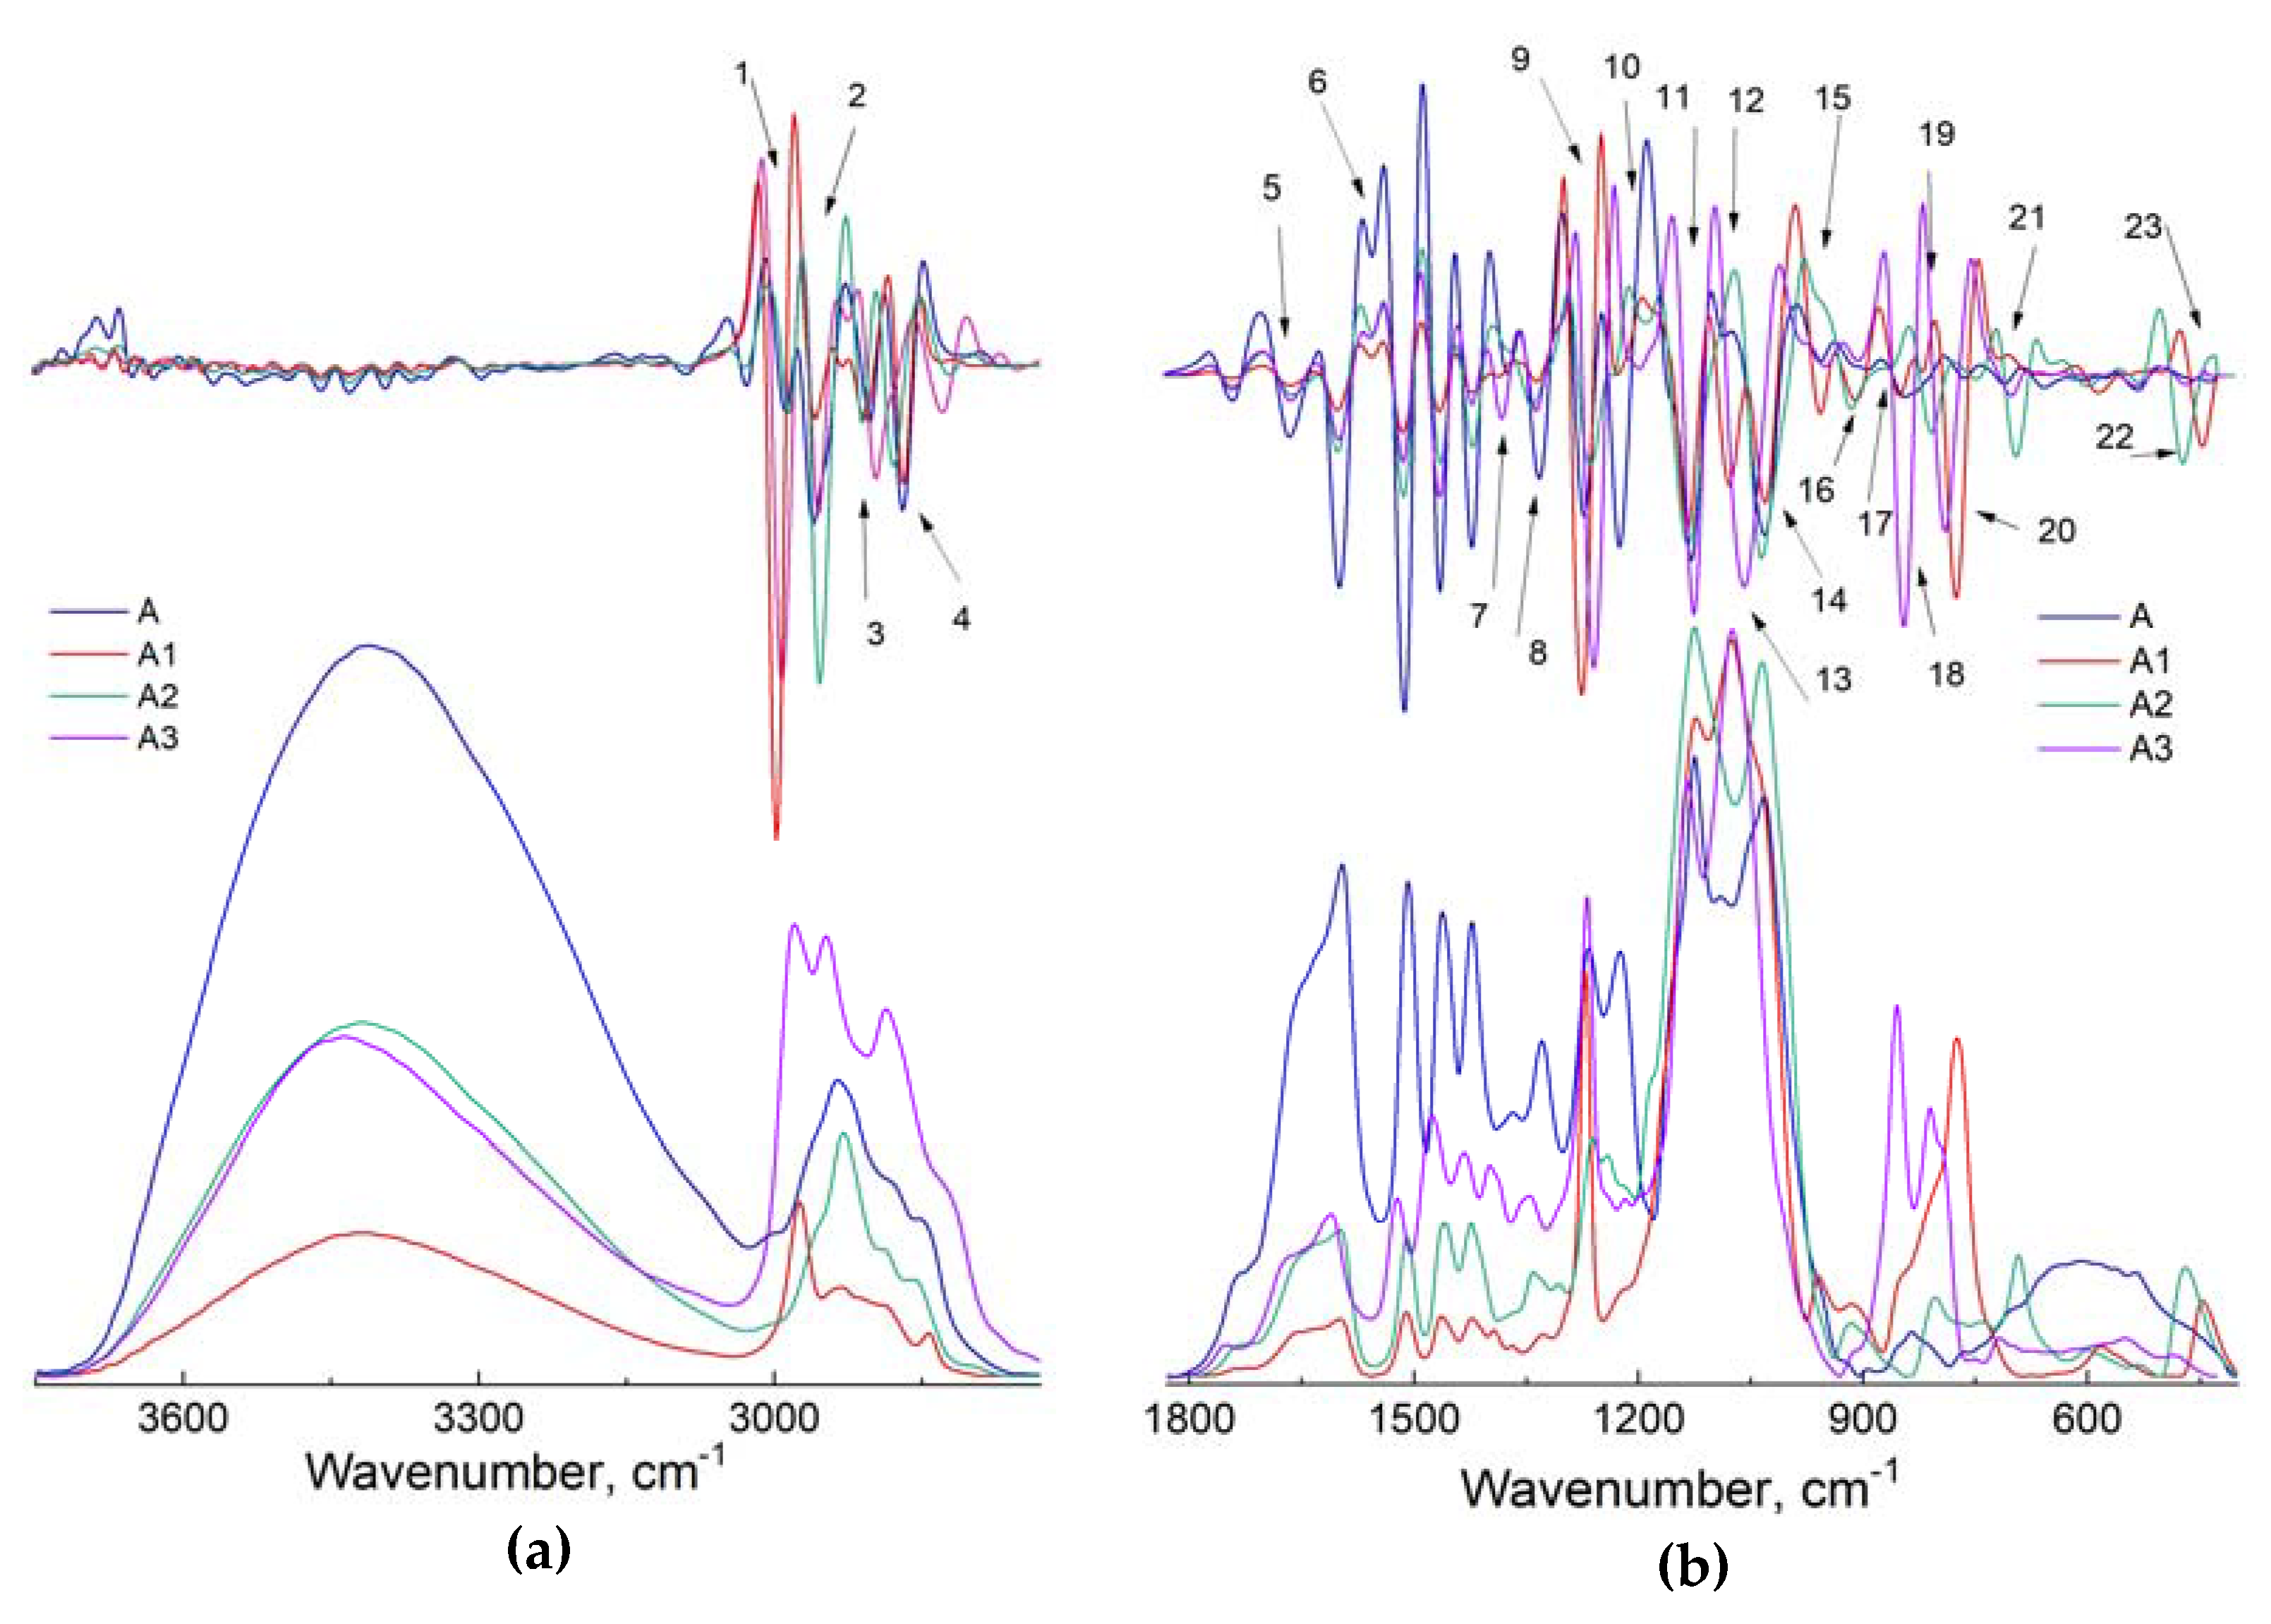
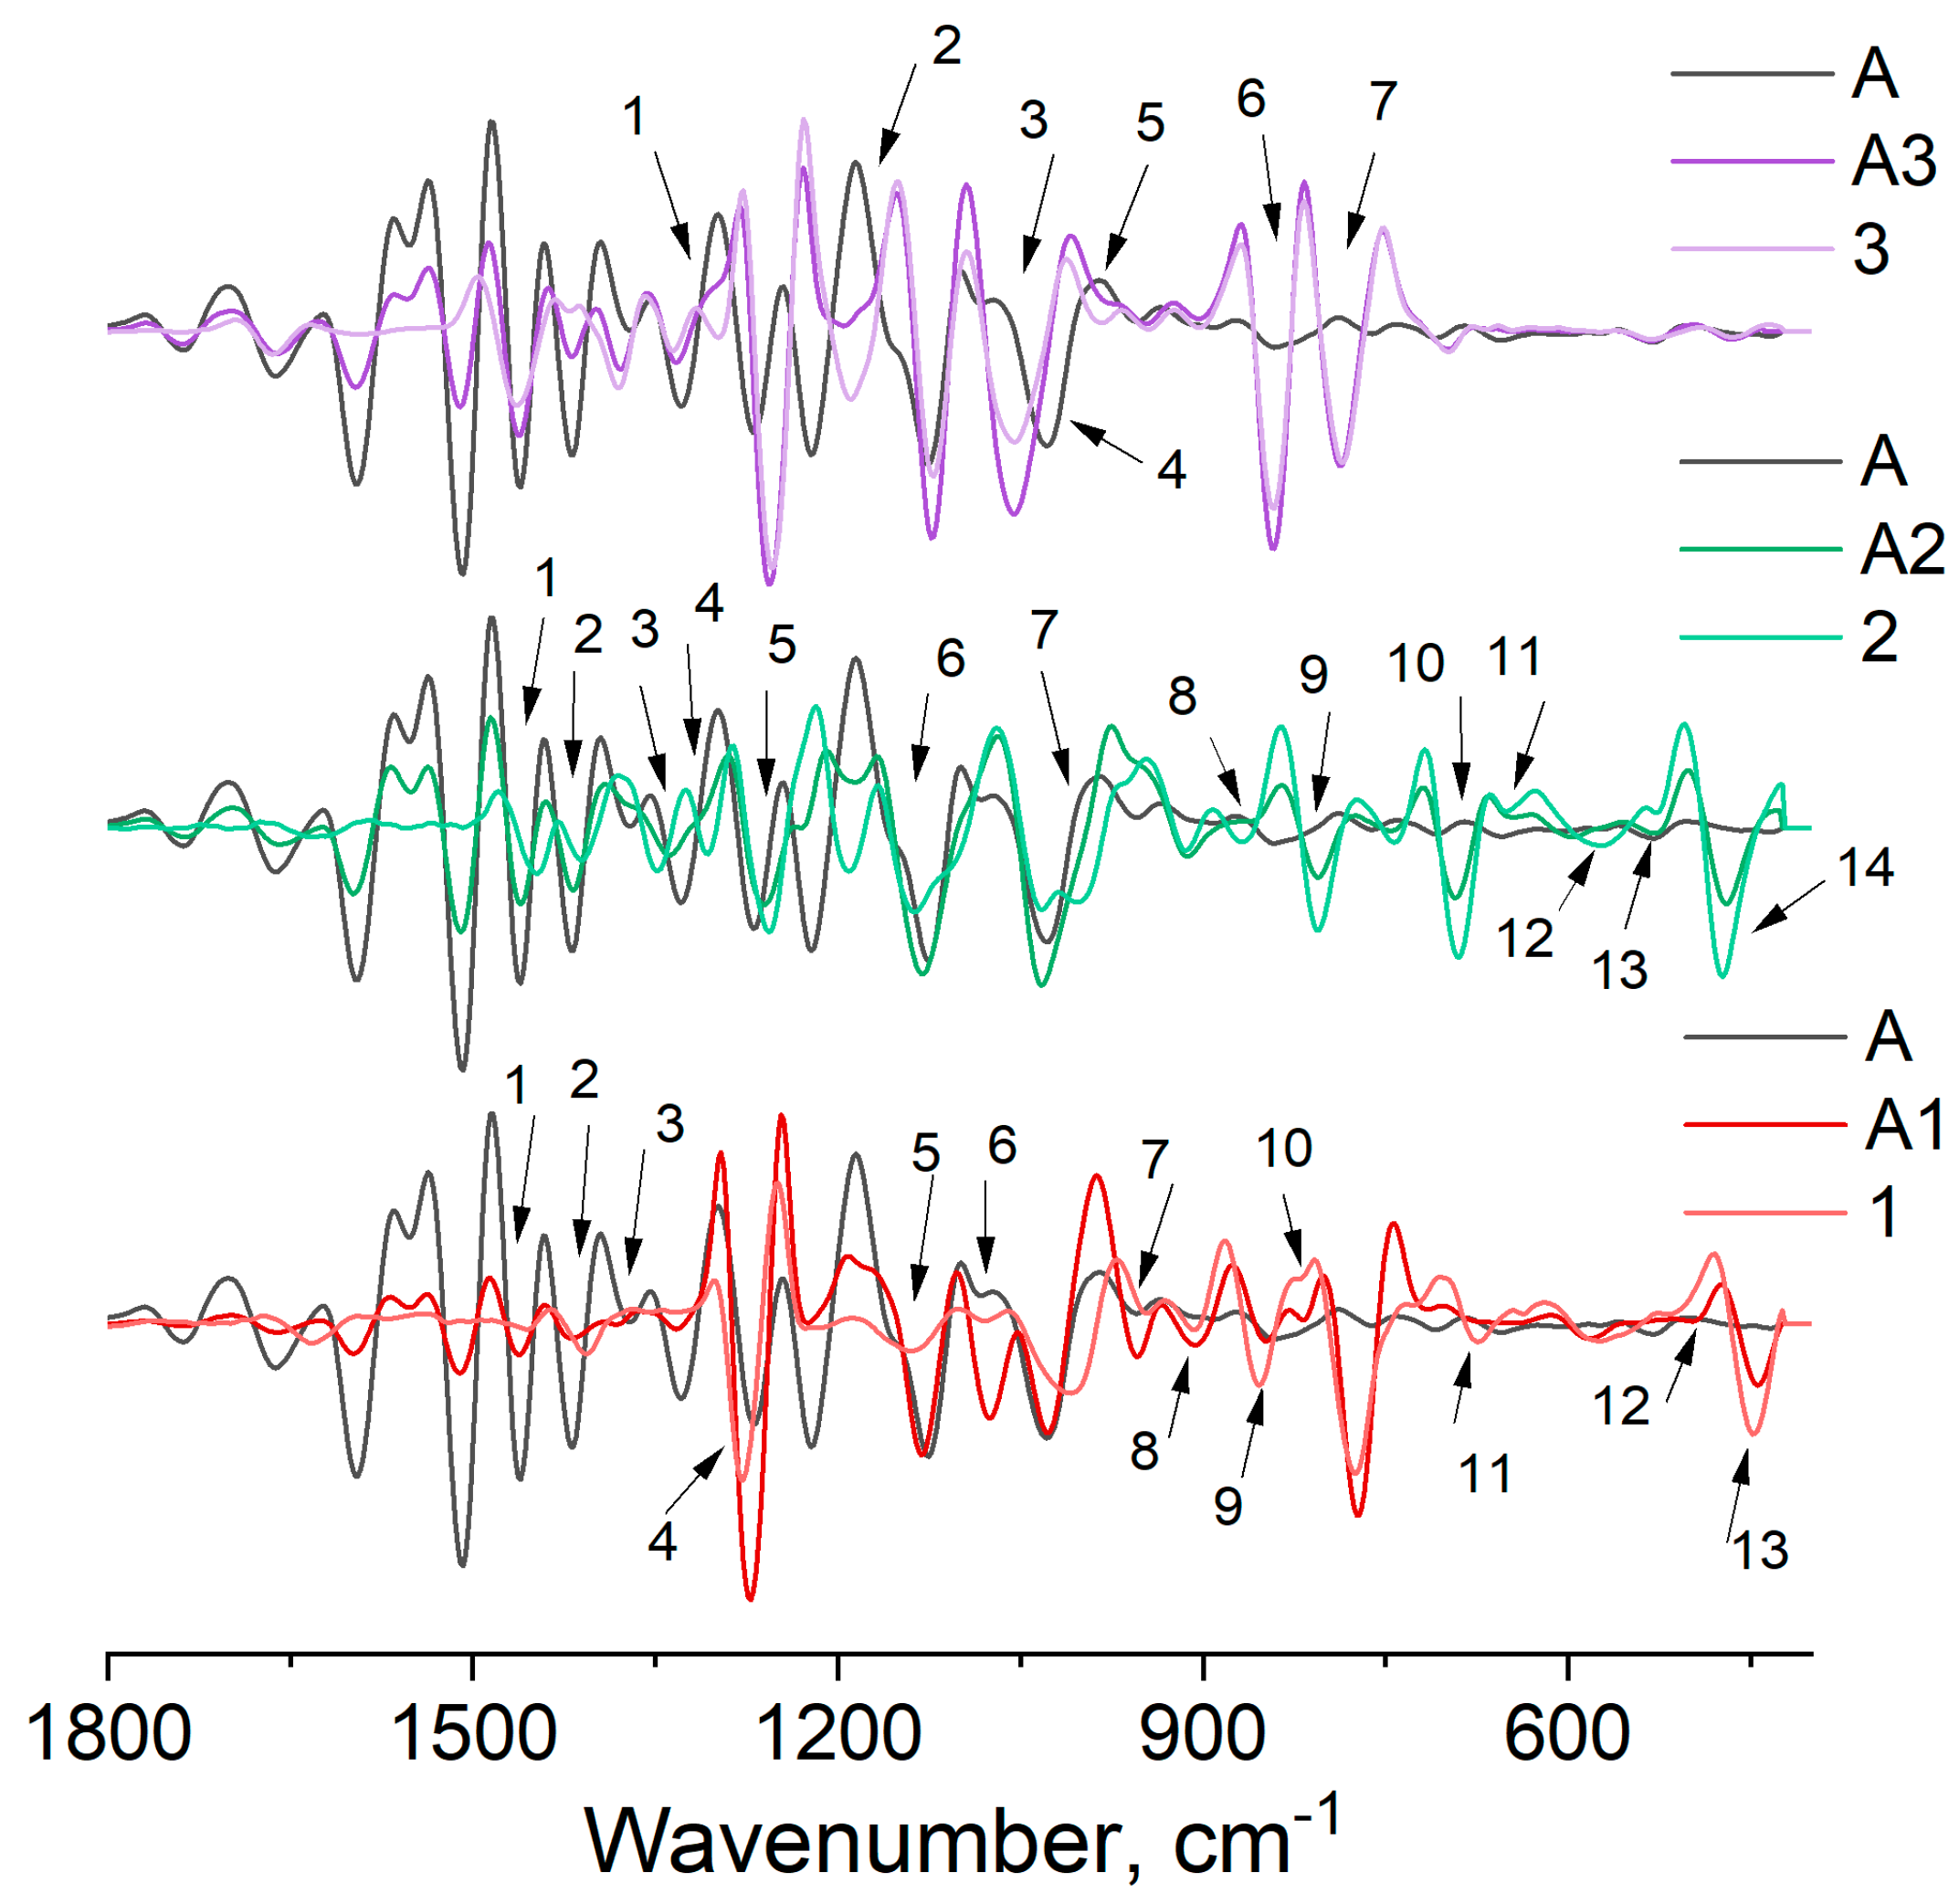
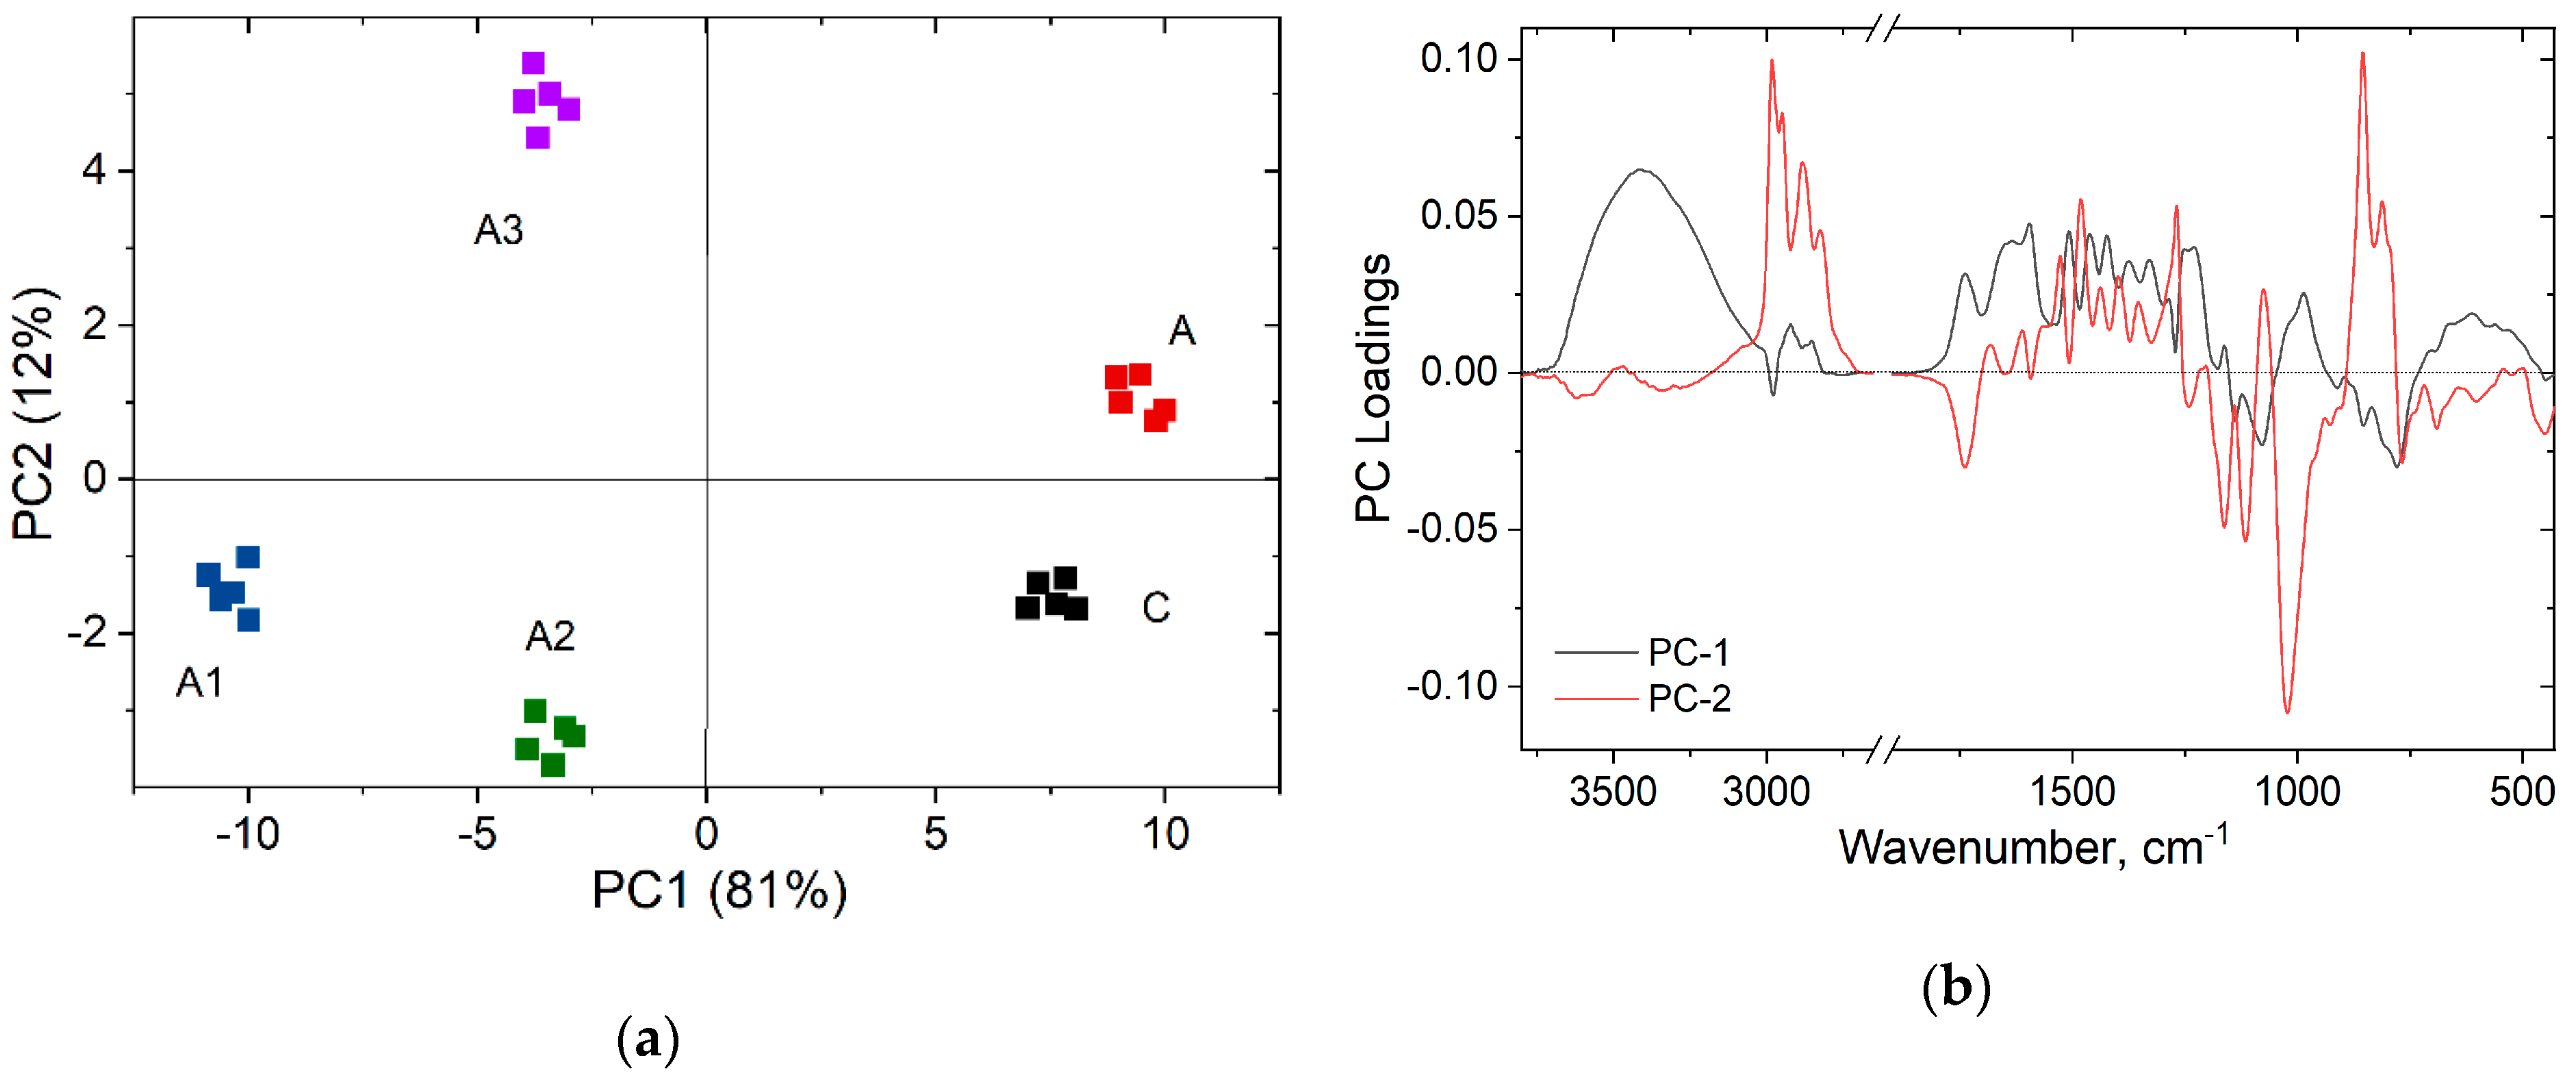
2.2.2. Fourier Transform Infrared Spectroscopy

The infrared spectra of fresh-cut elm, untreated and treated archaeological elm wood samples, as well as for pure silanes were recorded in KBr tablets on a Bruker ALPHA FT-IR spectrometer (Bruker, Billerica, MA, USA), with a resolution of 4 cm−1 using the 4000–400 cm−1 spectral range. The concentration in the tablets was constant: 2 mg of powdered sample and 200 mg KBr. For spectral processing, the Grams 9.1 software (Thermo Fisher Scientific, Waltham, MA, USA) was used. Five recordings were performed for each analysed sample, and the average spectrum obtained was used for the evaluation.
Principal component analysis (PCA) is a multivariate statistical technique which is usually used to extract the systematic variance in a data set. The outputs are represented by the PC scores and PC loadings. To perform PCA the pre-processed infrared spectra of the untreated contemporary and archaeological as well as treated wood were used.

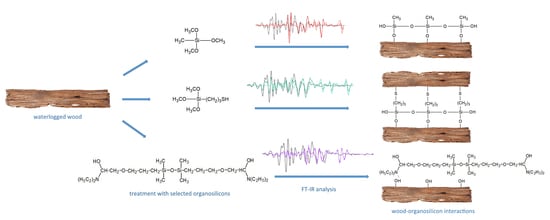
3. Results and Discussion

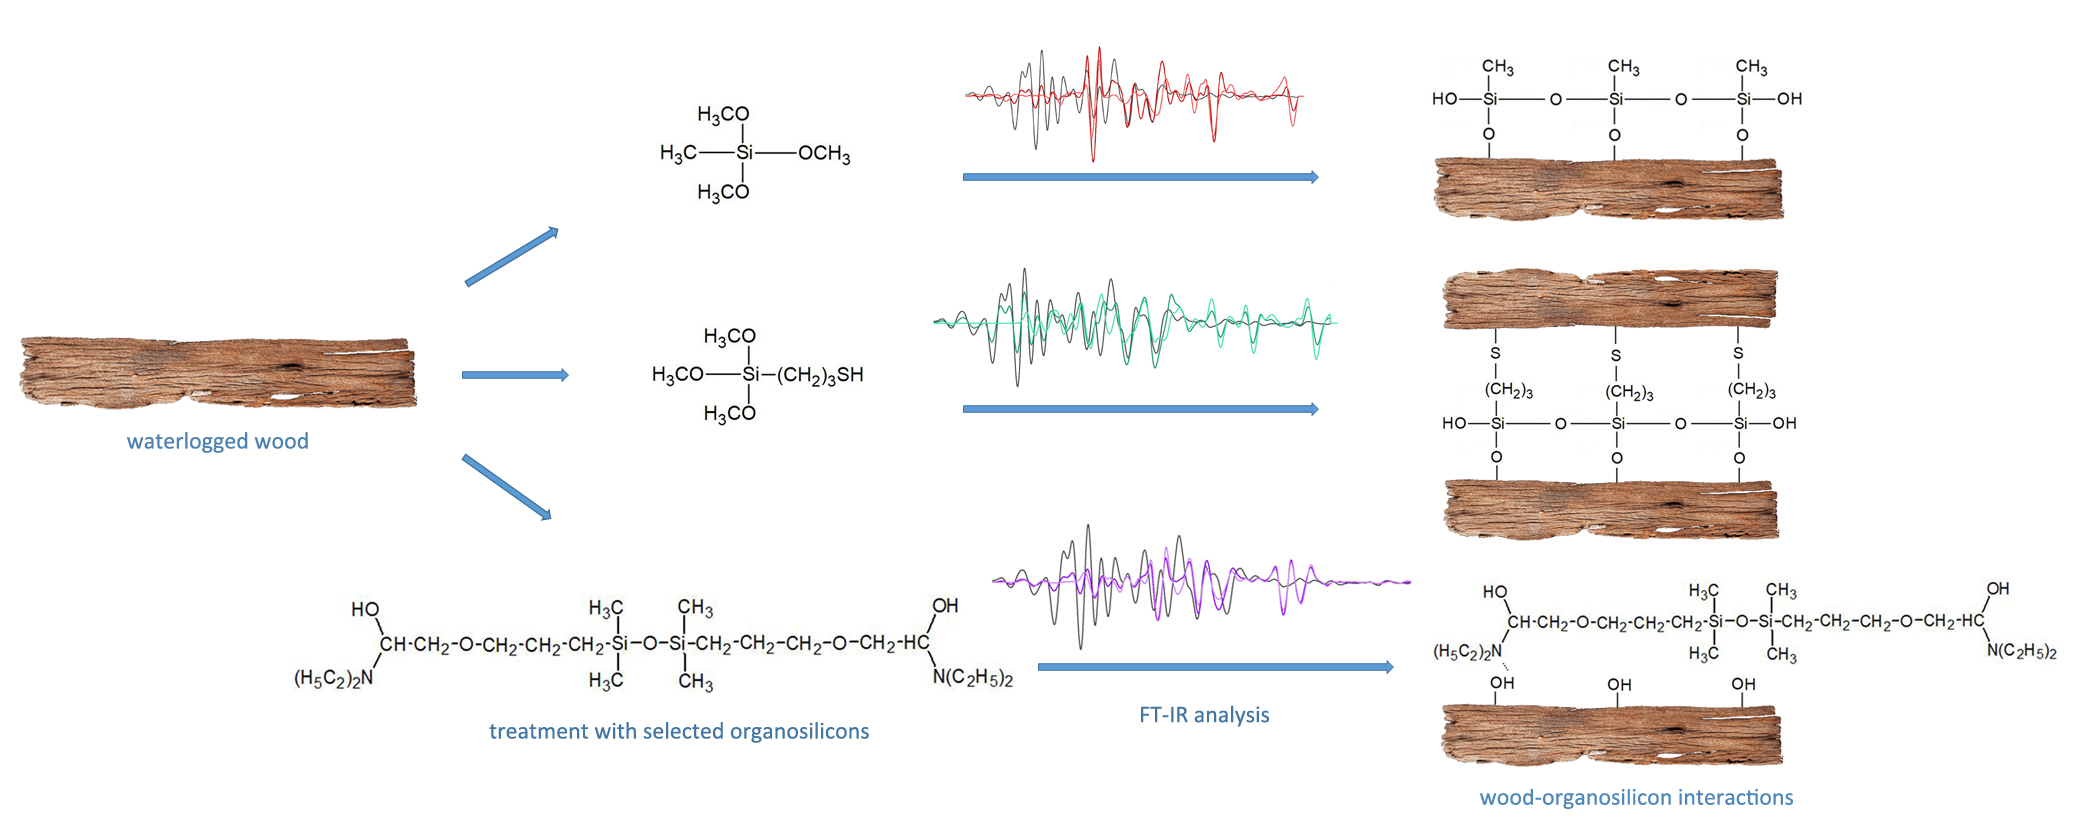
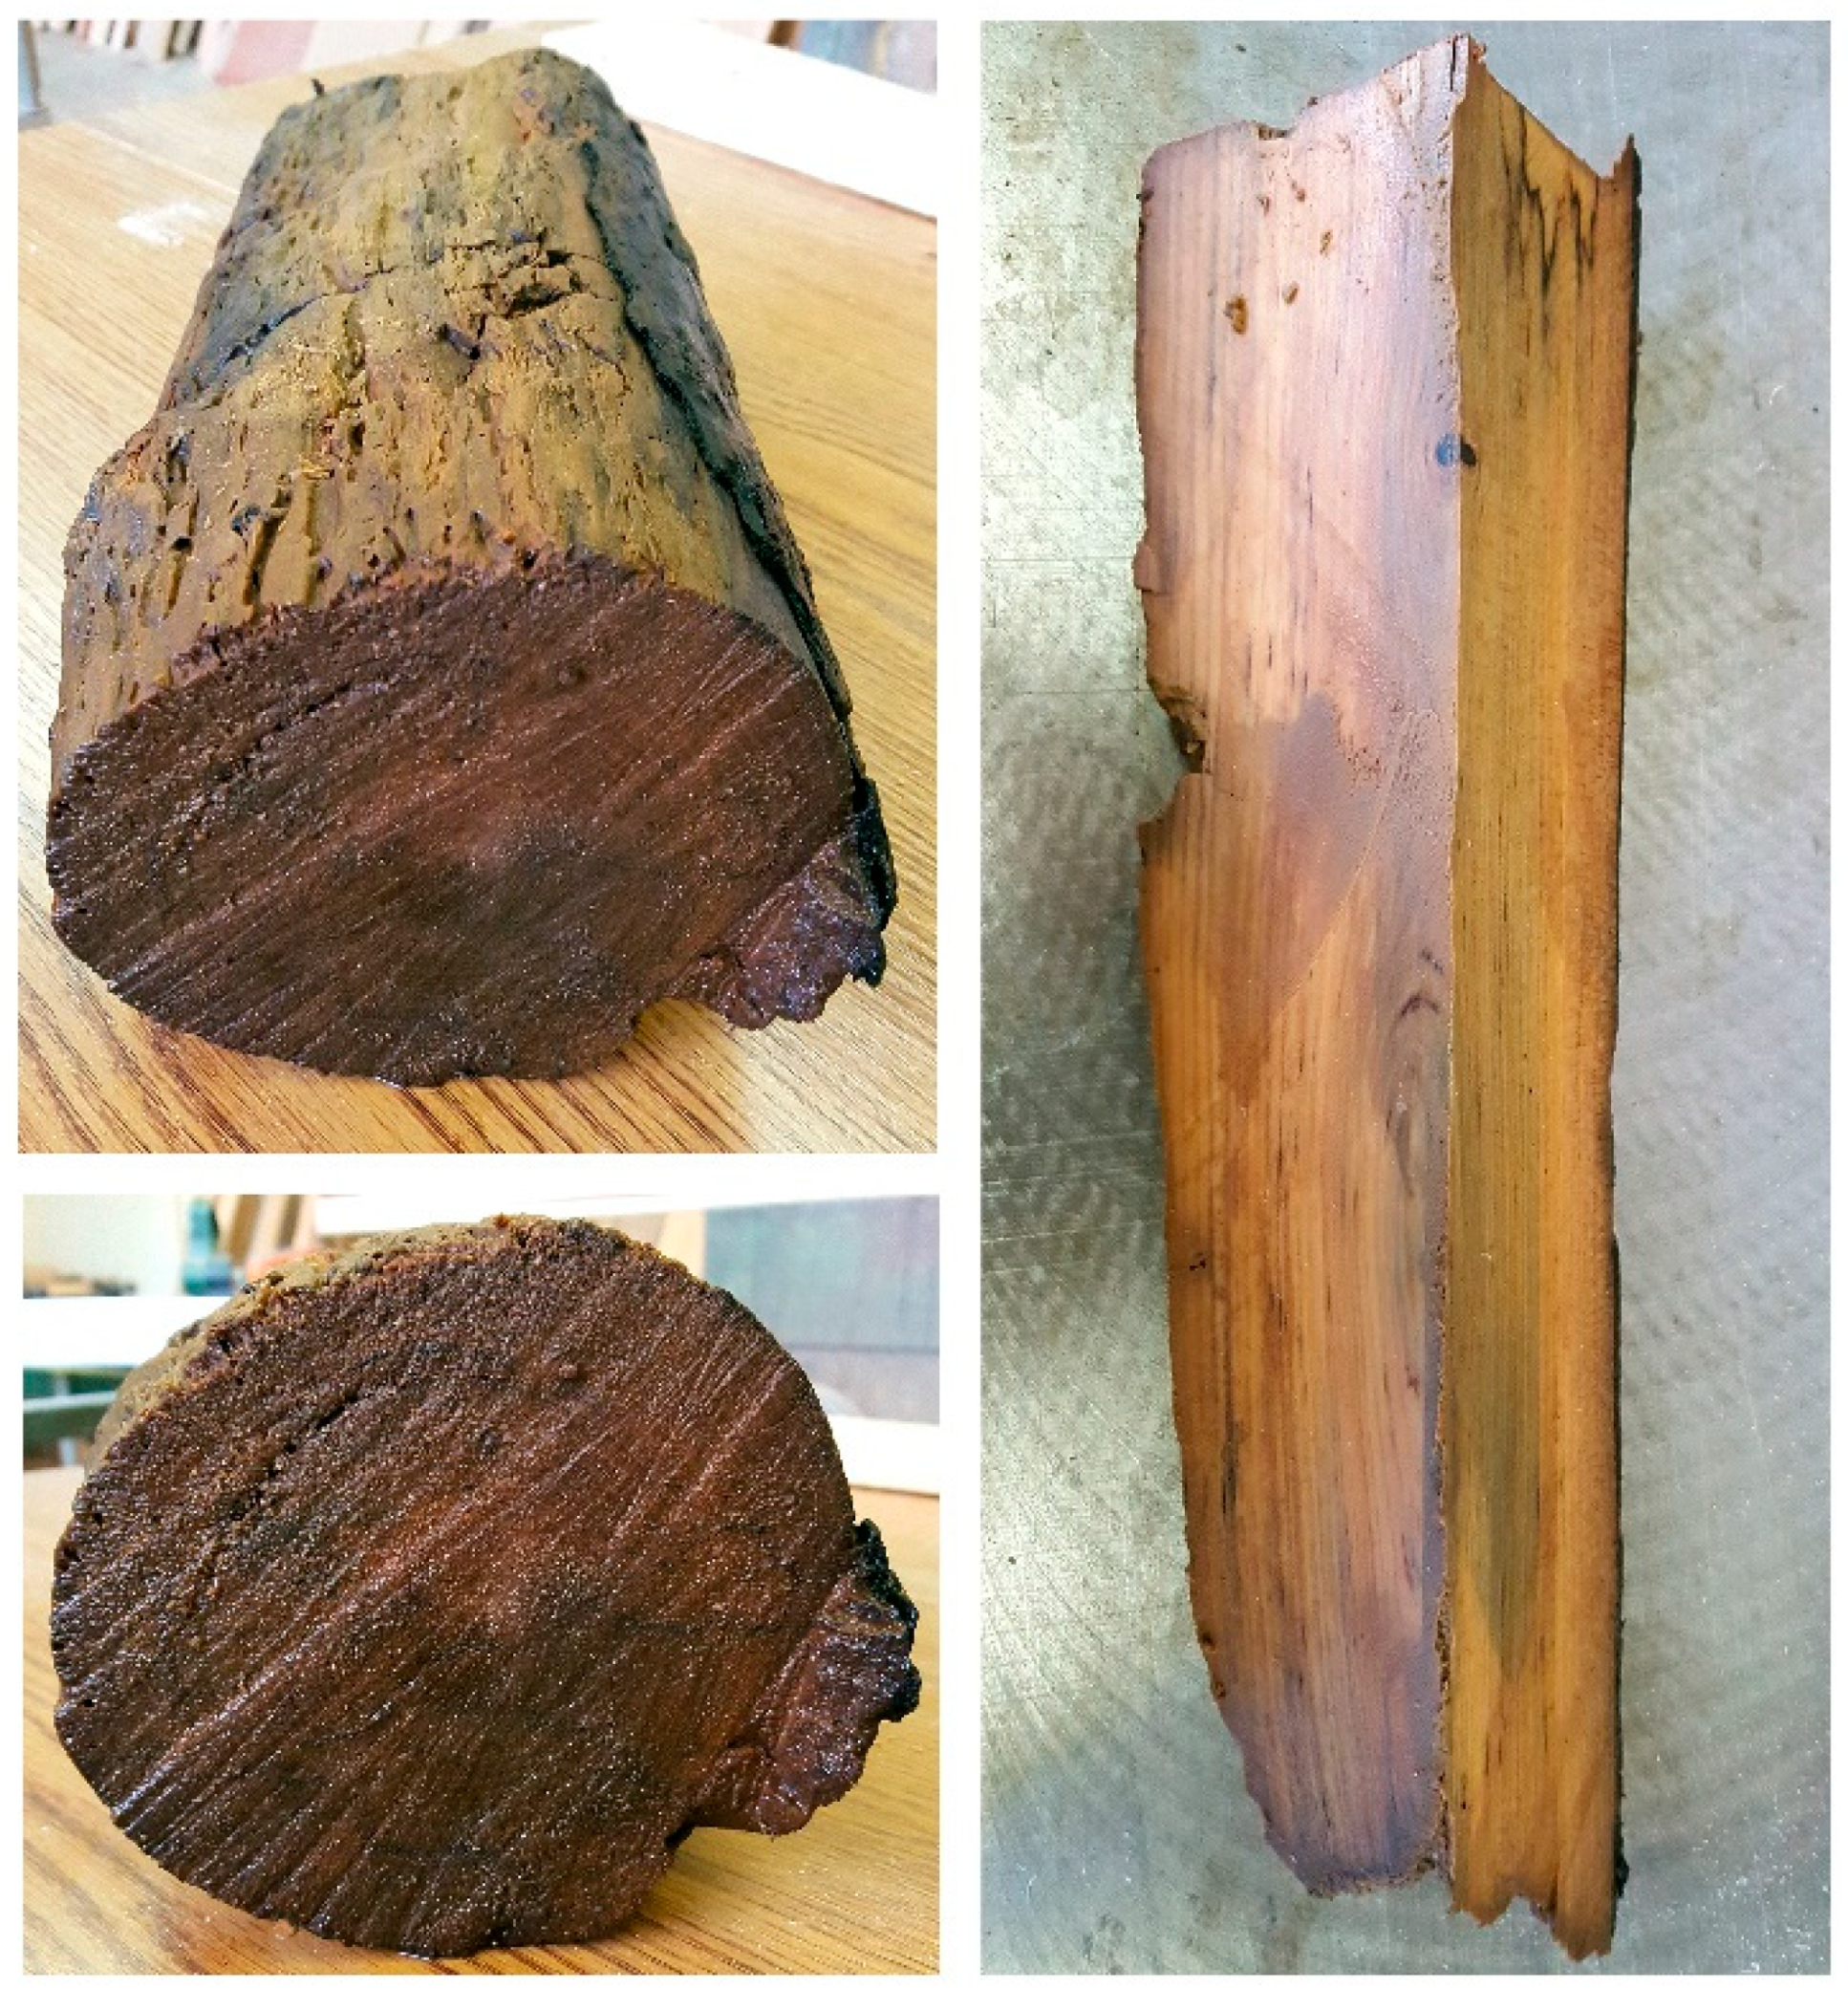
3.1. Structural Evaluation of Archaeological Elm Wood

Infrared spectra and their second derivatives for the reference (fresh cut elm wood) and archaeological elm samples are presented in Figure 3. The spectra generally present two main regions: 3800–2700 cm−1 (Figure 3a) assigned to –OH groups involved in inter- and intramolecular hydrogen bonds, as well as free –OH groups and methyl, methylene groups stretching vibrations, and 1830–800 cm−1 (Figure 3b), assigned to different stretching and deformation vibrations of the groups related to the main wood components, also called the fingerprint region.
From Figure 3a, the differences between the control and archaeological wood are observable, especially in the second derivative spectra. The bands from 3522/3520 (1) cm−1, 3070 (2) cm−1, 3017/3010 (3) cm−1, 2926/2932 (4) cm−1, 2884/2881 (5) cm−1 and 2853/2844 (6) cm−1 increase in intensity in the spectrum of the archaeological sample. These bands are assigned to free OH(6) and OH(2) in cellulose, weakly absorbed water, but also to the intramolecular hydrogen bond in a phenolic group (in lignin), to the multiple formation of an intermolecular hydrogen bond between biphenol and other phenolic groups in lignin, and to the symmetric and antisymmetric stretching vibration of methyl and methylene groups. There is also a strong shifting of the band from 3431 to 3419 cm−1 assigned to the O(2)H…O(6) intramolecular hydrogen bonds and this comes from the crystalline regions in cellulose.
In Figure 3b, there is a strong decrease of the intensity of the band from 1742/1740 (7) cm−1, 1377/1369 (12) cm−1 and 987/984 (17) cm−1 assigned to C=O stretching vibrations in acetyl, carbonyl and carboxyl groups (of carbohydrate origin), C–H deformation vibration in carbohydrates, and C–O stretching vibration in carbohydrates, and increase of the intensity of the bands from 1593 (8) cm−1, 1510 (9) cm−1, 1464 (10) cm−1, 1426/1421 (11) cm−1, 1332/1328 (13) cm−1, 1268 (14) cm−1, 1125 (15) cm−1 and 1031/1029 (16) cm−1 assigned to C=C stretching of the aromatic ring of lignin, C–H deformation in lignin and carbohydrates, C–H vibration in cellulose and Cl–O vibration in syringyl derivatives—condensed structures in lignin, C–O stretching in lignin, C−O ester stretching vibrations in methoxyl and β–O–4 linkages in lignin, and C–O–C and C–O stretching vibration in crystalline regions in cellulose. A new band was observed in archaeological wood at 1188 cm−1 which is assigned to C–O bonds in lignin.
The strong reduction in the intensity of the bands associated to carbohydrates (especially the amorphous ones), as well as an increase in intensity and shifting of the maxima for the bands associated to lignin and crystalline regions in cellulose, indicate the degradation of amorphous carbohydrates during the time of burial in the lake sediments. It is known that under severe environmental conditions (i.e., biodegradation or moisture), the most susceptible to degradation are the hemicelluloses and amorphous cellulose, the degradation taking place via hydrolysis reactions followed by breakdown of the components in lower molecular compounds. These results are in line with the information mentioned before that the excavated elm wood showed a significant degree of degradation and a high percent of mass loss.
The SEM image of archaeological elm (A), presented in Figure 4, confirms its bad state of preservation. The wood cells are flattened, of irregular shape, which indicates a high degree of shrinkage during drying, characteristic for degraded wood. In comparison with sound, contemporary elm (C in Figure 4), the cell walls of archaeological wood are significantly thinner, full of smaller and bigger holes, which result from microbial attack. Their layers are peeled-off from middle lamellae in some places. Additionally, fungal hyphae can be visible in some cells (marked with “^”), which suggests fungal decay and explains the degradation of amorphous carbohydrates showed by FT-IR measurements.

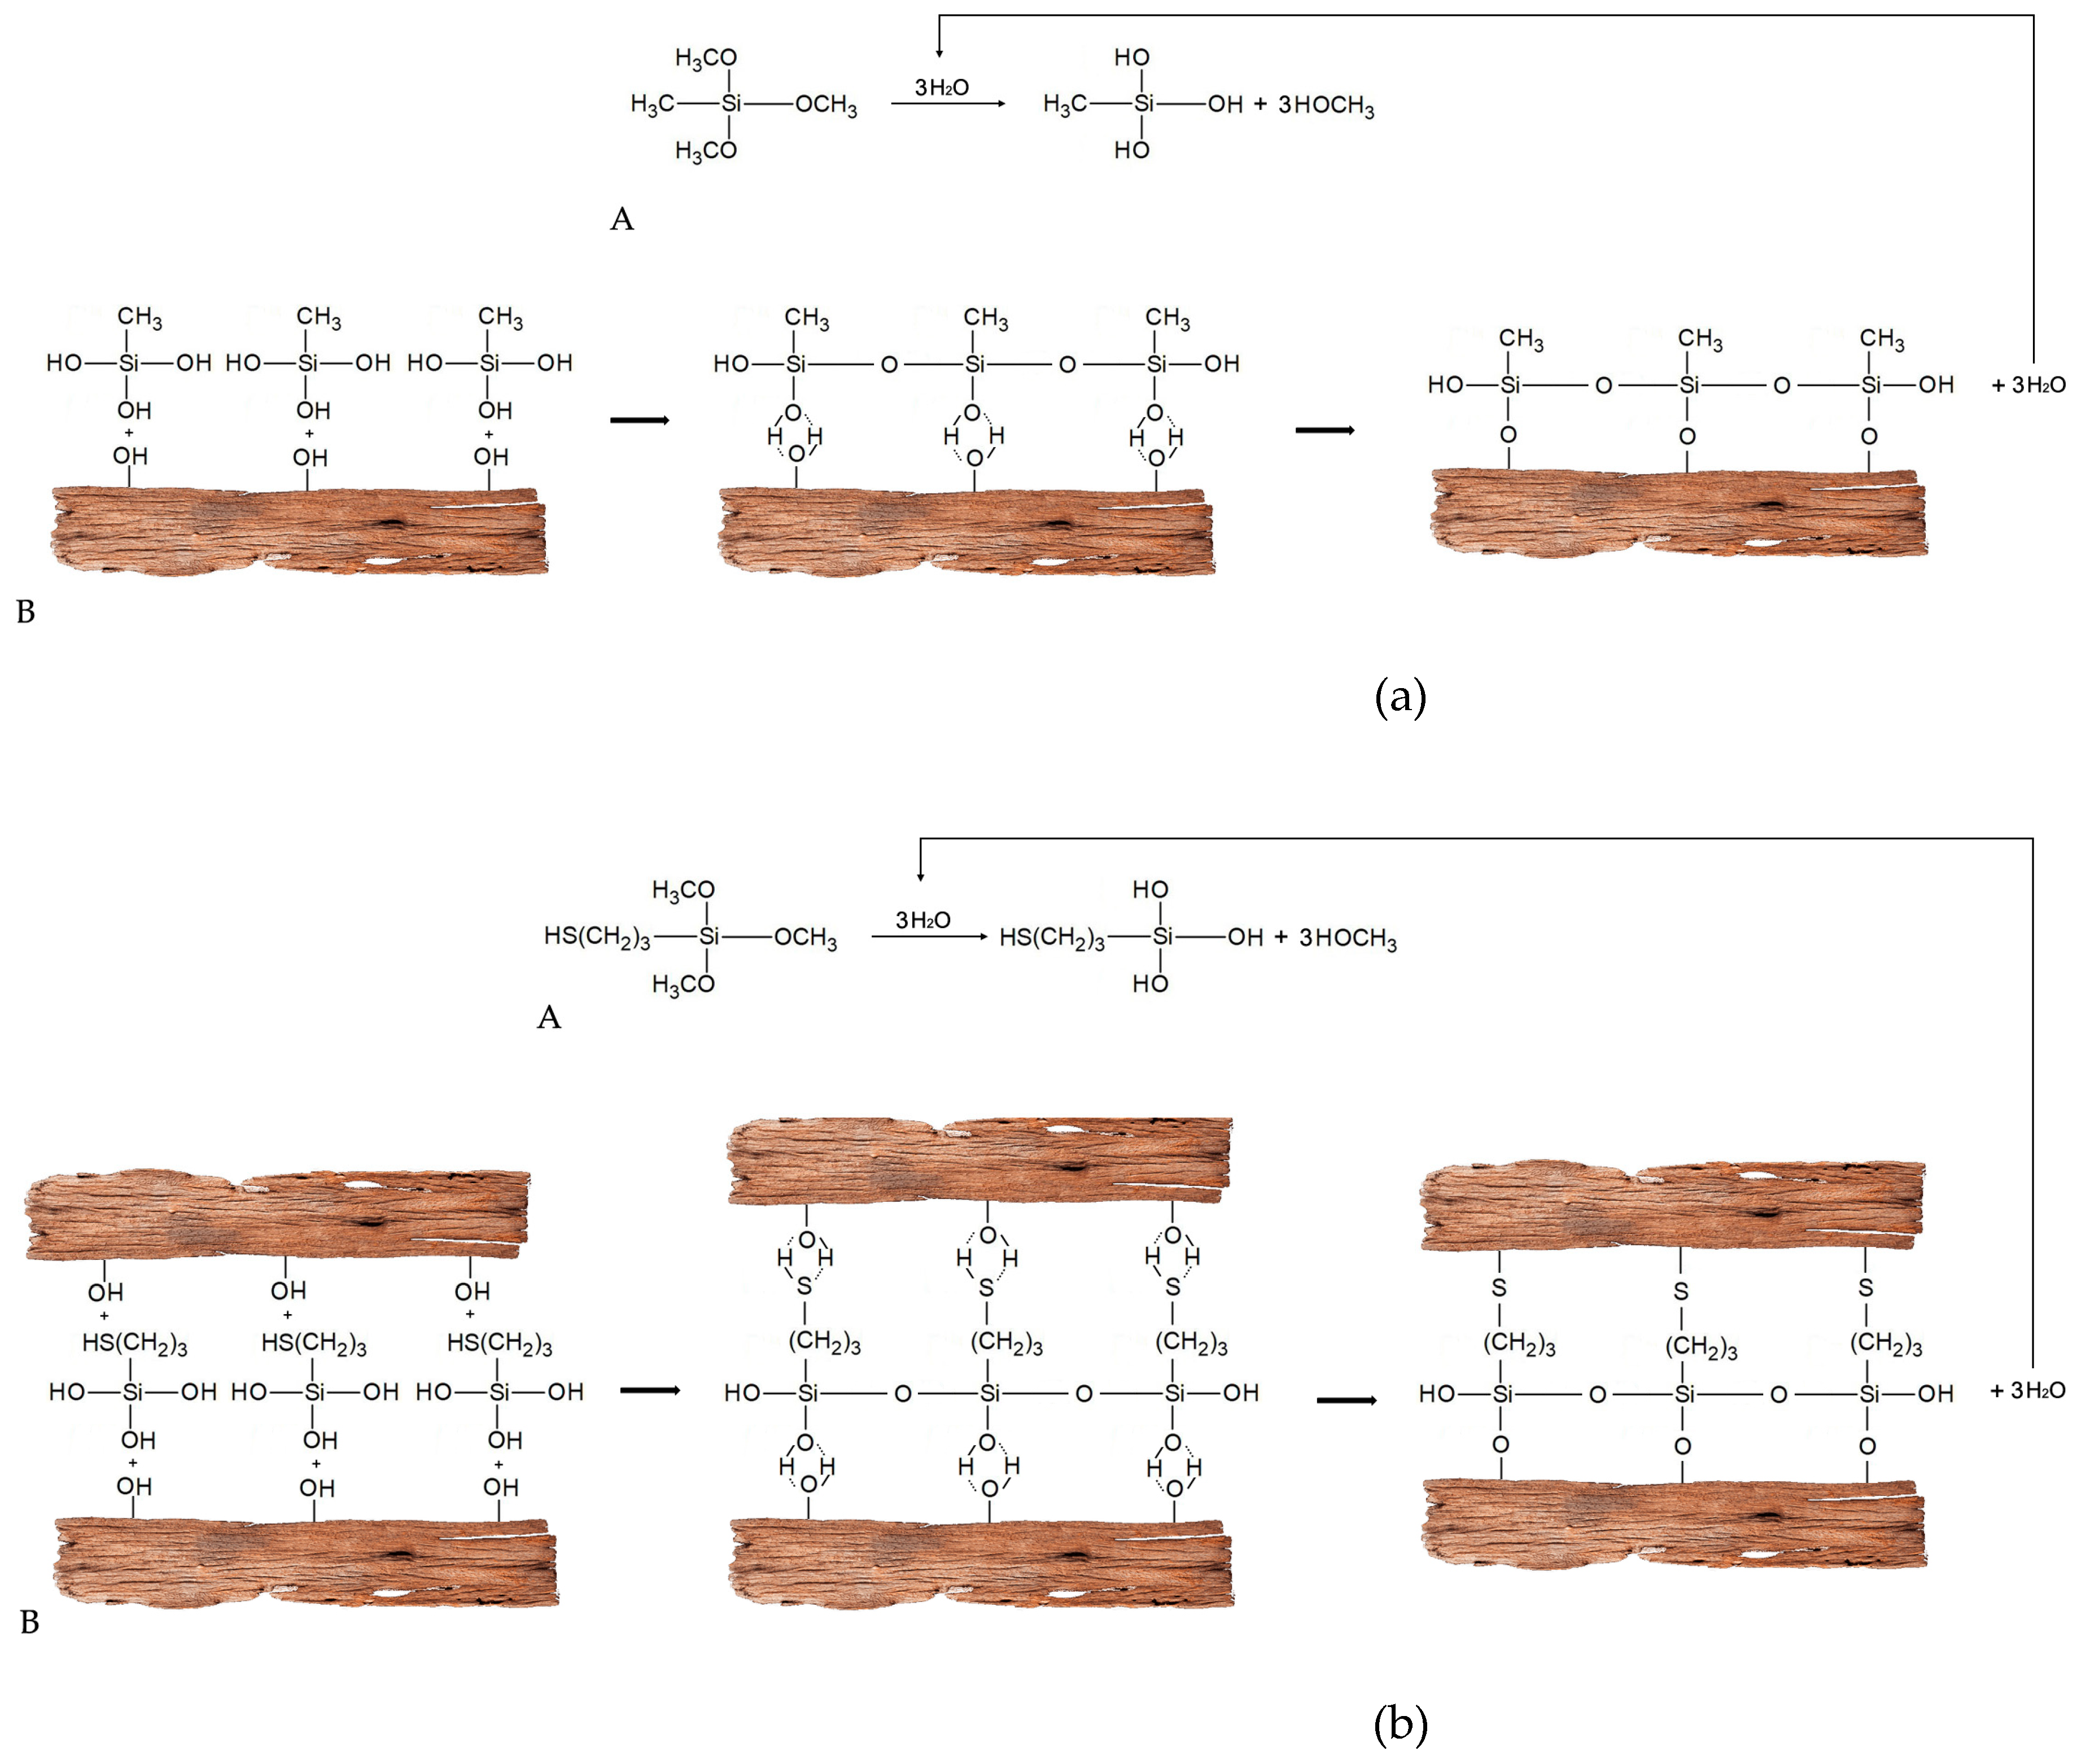
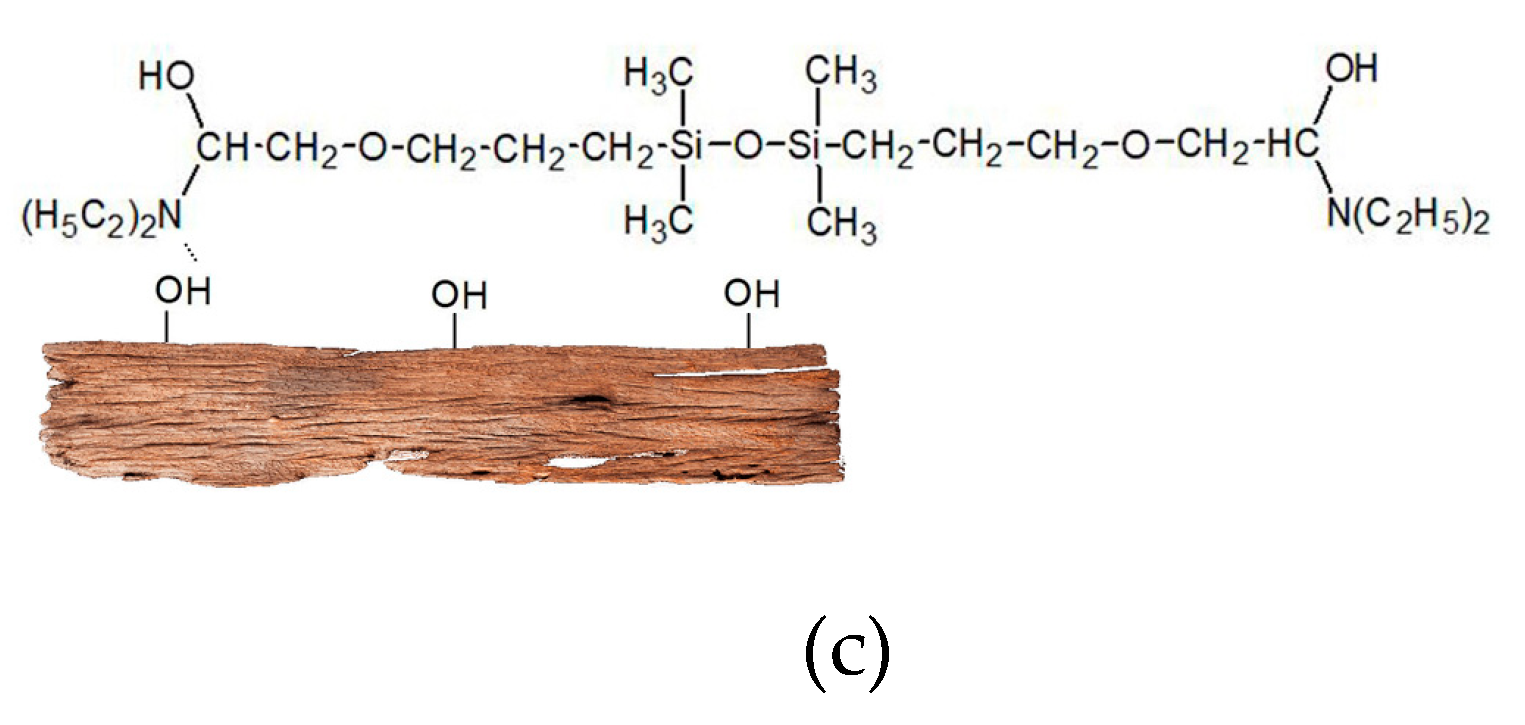
3.2. Interactions between Organosilicons and Archaeological Elm

In order to preserve waterlogged archaeological elm and stabilise its dimensions upon drying, treatment with the use of three different organosilicons (MTMS, MPTES and DEAPTMDS) was applied. After the wood impregnation, the weight percent gain (WPG) for the samples treated with MTMS (A1), MPTES (A2) and DEAPTMDS (A3) was about 242 ± 6.6%, 148 ± 12.0% and 230 ± 8.4%, respectively [22]. Reduction in the shrinkage of the treated wood in comparison with the untreated control, expressed as anti-shrink efficiency (ASE), was 81 ± 2.6% for A1, 98 ± 1.3% for A2 and 90 ± 7.8% for A3, which indicates high stabilising effectiveness of the applied chemicals [22]. However, comparison of SEM images of the treated wood revealed significant differences in the deposition of particular compounds in the wood structure. In the case of MTMS-treated wood (A1 in Figure 4), the cells have a more regular shape in comparison with untreated wood, the cell lumina are empty, and a cobweb-like polymer network is visible on the cell wall surface (red arrows). The structure of MPTES-treated wood (A2 in Figure 4) looks similar. However, for the DEAPTMDS-treated elm (A3 in Figure 4), the image is different. The layers of siloxane look different. They are thicker and not only cover the cell walls, but also fill the cell lumina. The observation suggests then that alkoxysilanes applied can incrust or coat the cell walls, while the siloxane is present not only as a coating on the cell walls but also inside the cell lumina.
The aforementioned results indicate a different mechanism of wood stabilisation by various organosilicons, hence the decision to conduct the infrared spectroscopy study to shed some light on the issue.
The spectrum of untreated archaeological elm wood sample was compared with the spectra of the treated samples, as well as their derivatives. As in the previous case, the spectra were divided into two regions, presented in Figure 5a,b, respectively.
Compared to the control (A) sample spectrum, the spectra of treated samples with organosilicons (A1–A3) present (aside from the bands present in the wood material) bands that are expected to appear due to the presence of chemical bonds from silanes and the bands that appear after the interactions between the wood and organosilicon compounds. A detailed list of the bands’ position and their assignments according to the literature [24,32,33,34,35,36,37,38] is presented in Table 1.
From Figure 5a, it can be observed that the band assigned to hydroxyl groups from 3600 to 3100 cm−1 tend to decrease in intensity for the treated wood compared to the untreated one, indicating that these groups are less available due to their reaction with silanol groups from the organosilicons. The decrease of the available hydroxyl groups was also evidenced by dynamic water sorption experiments [41,42] showing that wood treatment caused a reduction in the equilibrium moisture content and the sorption hysteresis and limited access of water molecules to primary sorption sites in comparison with untreated wood.
Higher differences can be observed appearing in the 3100–2700 cm−1 region (Figure 5a), assigned to antisymmetric and symmetric stretching vibration of C–H bonds in –CH3, and –CH2 groups from wood and silanes structure. Both band intensities and their maxima vary for each spectrum. This is due to the position of the methyl or methylene groups in the silane/siloxane structure, as well as due to the surrounding groups which allow or hinder their free vibration. The A1 spectrum present higher intensity of the band from 2974 cm−1 (1). At the same time, the maximum is shifted to higher wavenumber, compared to the same band in the A spectrum (at 2966 (1) cm−1). The A2 spectrum present higher intensity for the band from 2934 (2) cm−1 compared to similar bands from the other spectra, while in A3 both 2969 (1) and 2931 (2) cm−1 have higher intensities comparing to other spectra. Because A1 has in its structure only –CH3 groups, the bands from 2883 (3) and 2842 (4) cm−1 are mostly due to the groups from the wood structure (A). By contrast, A2 and A3 have in their structure –CH2 groups, and in consequence, we observe higher intensities and also shifting of the maxima to higher/lower wavenumber values.
The fingerprint region (Figure 5b) is more sensitive; in this region, stretching and bending vibrations of all groups from the wood and organosilicons structures can be observed, presenting unique features specific to each component. Therefore, here the presence of several new bands as well as increased intensity or shifting of the bands which may be assigned to silane/siloxane structures could be identified.
The wood sample treated with silane 1 (A1) shows the presence of strong absorption bands at 1271 (9), 1169 (10), 1128 (11), 1075 (12), 959 (15), 811 (19), 772 (20) and 449 (23) cm−1 (see assignments in Table 1).
The samples of wood treated with silane 2 (A2) present most informative bands at 1340 (8) and 1308 (8) cm−1 assigned to deformation of –CH2 groups present in the spectra due to existence of a larger number of these groups in the solid network. Furthermore, similarly to A1, were observed bands at 1187 (10), 1130 (11), 1030 (14), 1004 (14), 918 (16), 861 (17), 807 (19), 768 (20), 692 (21), and 474 (22) cm−1 (see assignments in Table 1).
The A3 treated wood sample shows new bands at 1662 (5), 1552 (6), 1371 (7), 1329 (8), and at 1056 (13) cm−1. All these bands are overlapped with the bands present in the wood spectrum (A), but for the treated wood, compared to the reference one, they present higher intensities.
In order to identify the possible interactions between the organosilicons and the wood substrate, spectra of the pure chemicals were recorded, and their second derivatives were plotted against the second derivatives of the archaeological wood and the treated wood (see Figure 6).
Analysing the first set of spectra (A, A1 and 1) for the MTMS silane, differences can be observed as follows: the bands from the 1444 (1) and 1406 (2) cm−1 in spectrum of the silane are not observable in the spectrum of treated wood, due to the overlapping of these bands with the bands from the wood structure at 1462 (1) and 1417 (2) cm−1. The same behaviours show bands from 1278 (4), 1139 (5), 945 (7), and 854 (9) cm−1 in the silane spectrum, which are overlapped with the bands from the 1268 (4), 1126 (5), 955 (7) and 840 (9) cm−1 in the wood spectrum and are shifted towards each other in the spectrum of the A1 (1272 (4), 1131 (5), 954 (7) and 848 (9) cm−1). The bands from 1357 (3) and 674 (11) cm−1 (observable in the silane spectrum) are not observable in the treated wood spectrum (A1), while the band from 448 (13) cm−1 decreases in intensity in the spectrum of the treated wood sample. These bands are assigned to C–H asymmetric deformation and Si–O stretching vibration in silanes and to deformation vibration of the O–Si–O bonds. At the same time, new bands at 1382 (3) and 497 (12) cm−1 are observed in the spectrum of the silane treated wood sample. They are assigned to C–H asymmetric deformation in Si–R groups, as well as to Si–O–C stretching vibration. The observed differences in the analysed spectra indicate changes in the silane monomers due to their condensation with other monomers or wood polymers.
Other differences can be observed for the band from 1080 (6) cm−1 (in the spectrum of silane) and from 1083 cm−1 (in the spectrum of wood), which are of low intensity, but increase drastically in the spectrum of the treated wood (A1) and is shifted to 1076 (6) cm−1. This band is assigned to asymmetric stretching vibration of Si–O–Si groups, indicating the presence of condensation reactions between silane monomers via alkoxy groups.
The bands from 947 (7) and 907 (8) cm−1 (from the silane spectrum) increase in the spectrum of the treated wood and are shifted to 955 (7) and 909 (8) cm−1. Furthermore, the band from 821 (10) cm−1 which is observable as a small shoulder in the silane spectrum, appear as a well-defined band at 818 (10) cm−1 in silane treated wood sample (A1). These three bands are assigned to in-plane stretching vibration of the Si–O in silanol Si–OH groups, bending vibration of Si–O–C groups, and stretching vibration of the Si–O–Si bonds.
The aforementioned increase in the intensity of the bands assigned to Si–O in silanol, Si–O–C and Si–O–Si bonds confirms that the sol-gel process took place between the silane and wood polymers, in which through a series of hydrolysis and condensation reactions, silane monomers can not only polymerise into a spatial polymer network (observed by Si–O–Si bonds), but can also react with –OH groups present on all the main wood components, forming a wood–silane composite and establishing siloxy bonds (Si–O–C) [7]. Moreover, the disappearance or decrease in intensity of the bands assigned to C–H asymmetric deformation and Si–O stretching vibration in silanes and to deformation vibration of the O–Si–O bonds, indicate the reduction of the Si–O and O–Si–O bonds, confirming the effectiveness of the sol-gel process.
Furthermore, analysing the second series of spectra (A, A2, 2), belonging to archaeological wood, treated wood with MPTES and the pure silane spectra, differences mainly in the fingerprint region can be observed as in the previous case. Thus, the bands from 1448 (1), 1410 (2), 1256 (5) and 1138 (6) cm−1 (in the spectrum of pure silane) are overlapped with the bands from the wood from 1462 (1), 1418 (2), 1269 (5) and 1127 (6) cm−1. These bands are assigned to C–H deformation in lignin and carbohydrates and in –CH2–CH3 in silane, C–O stretching in lignin and Si–C stretching vibration in Si–CH3 in silane and to C–O stretching in wood and Si–O–C asymmetric stretching vibration in silane.
The band from 1348 (3) cm−1 in the spectrum of silane (2) is shifted to 1338 (3) cm−1 in the spectrum of the silane treated wood (A2) and is merged with the band from 1329 (3) cm−1 from the wood spectrum (A). This band is assigned to C–H vibration in cellulose and Cl–O vibration in syringyl derivatives, condensed structures in lignin, and to –CH2 deformation vibration in silane. The bands from 1306 (4), 1002 (7), and 869 (8) cm−1 seen in the spectrum of the silane are not identified in the spectrum of the wood treated with silane. These bands are assigned to –CH2 groups twisting vibration, Si–O–Si stretching vibration, and Si–O stretching vibration in silane and indicate changes in silane structure due to its reactivity with other silane monomers or wood hydroxyls.
The bands from 573 (12) and 530 (13) cm−1 from the silane spectrum increase in intensity in the spectrum of the treated wood samples, while the bands from 805 (9) and 473 (14) cm−1 decrease in intensity. They are assigned to stretching vibration of the Si–O–C and Si–O bonds.
The bands from 692 (10) and 645 (11) cm−1 (assigned to C–S stretching vibration) in the spectrum of pure silane are shifted to higher wavenumber and decrease in intensity in the spectrum of treated wood, indicating that these bands participate to interactions with wood.
As in the previous case, the modifications observed in the spectra of the silane-treated wood compared to pure silane and wood spectra indicate interactions taking place between the silane and the wood substrate, as well as the formation of bonds after the condensation of the silane on the surface of the wood.
The last series of spectra (A, A3, and 3), belonging to archaeological wood, DEAPTMDS-treated wood as well as pure siloxane are also presented in Figure 6. In this case, smaller differences were observed; thus, the bands from 1299 (1) and 985 (5) cm−1 from the pure siloxane spectrum are not observed in the siloxane-treated wood spectrum. These bands are assigned to –CH2 groups twisting vibration and stretching vibration of the Si–O in silanol groups. The band from 1055 (3) cm−1 can be identified in the siloxane-treated wood spectrum, and the band from 1028 (4) cm−1 from the wood spectrum is not identified in the A3 spectrum. The band from the wood spectrum is assigned to stretching vibration of the C–O in methoxyl groups in lignin, indicating a possible contribution of these groups to the interactions with siloxane. The band from 1055 (3) cm−1 is assigned to the asymmetric stretching vibration of Si–O–Si in siloxane structure and confirms the presence of the siloxane in the treated wood.
Furthermore, the band from 1190 (2) cm−1 from the siloxane spectrum is shifted to higher wavenumber, at 1195 (2) cm−1 in the A3 spectrum. This band also presents the lower intensity and higher width in the spectrum of treated wood, and it is assigned to the asymmetric stretching vibration of Si–O–C groups. The band from 843 (6) cm−1 observed in the siloxane spectrum decreases in intensity in the spectrum of treated wood, while the band from 787 (7) cm−1 presents similar intensities in both spectra. Both bands could not be identified in the wood spectrum. The modification of intensity, band width and wavenumber maximum may indicate interactions taking place between the siloxane and wood structure.
The PCA analysis (Figure 7) illustrated by PC scores (Figure 7a) and PC loadings (Figure 7b) clearly show the differences appearing between the analysed spectra.
The principal component factor 1 (PC1) describes 81% and principal component factor 2 (PC2) describes 12% of data variance, so 93% of the variances were captured using these two dimensions instead of the initial data (see Figure 7a). Therefore, the PC1 presents positive values for both untreated wood samples (C and A) and negative ones for the treated samples (A1, A2 and A3). At the same time, PC2 differentiates the samples according to control and archaeological, as well as the samples treated with the two silanes and the sample treated with the siloxane. Both PCs are indicative to indicate modifications in the wood structure according to state of preservation and type of treatment.
The PC loading plot (see Figure 7b) gives information about the chemical features which are responsible for grouping the samples along the PC1 and PC2. The PC1 loading presents positive bands mainly assigned to wood structure and negative ones assigned to the polymers used, while PC2 loading presents positive bands mainly assigned to the siloxane compound and negative ones assigned mainly to wood and silane compounds.
The modifications observed in all three series of samples indicate the interactions between the silane/siloxane and wood substrate (primarily via hydroxyl groups) through silylation or condensation reactions (as mentioned above). In Figure 8 are represented the possible interactions taking place between the wood structure and the organosilicon compounds structure as observed through infrared spectroscopy.
Comparing the three organosilicons, higher interactions with wood were observed in the case of silanes 1 and 2, i.e., MTMS and MPTES, which have relatively short alkyl chain and reactive alkoxy groups than for DEAPTMDS (3) with a much longer chain and amino groups of different reactivity. Alkoxysilanes can react not only with wood hydroxyls, but also condense with their own molecules. As a result, a potential spatial network can be formed on the surface or inside the cell wall which would bind together wood polymers and thus stabilise the structure of wood. Moreover, a reactive thiol group in the MPTES molecule enables an extra bond with wood hydroxyls, additionally strengthening interactions between the chemical and wood polymers.
Although Figure 8 is just a schematic drawing, it captures the idea of the interactions between organosilicons and the cell wall polymers. It shows clearly that the number and the strength of the possible interactions are different. Therefore, although all the three chemicals are effective in stabilisation of wood dimensions upon drying, the stabilising mechanism must involve much more than only the chemical structure and reactivity of a conservation agent applied.

4. Conclusions

The presence of chemical interactions between organosilicons and the cell wall polymers of waterlogged archaeological wood were clearly shown through infrared spectroscopy. The reactivity depends on the chemical structure and varies between the applied chemicals, indicating a higher number of interactions between the alkoxysilanes (MTMS and MPTES) and wood, than in the case of the tested siloxane (DEAPTMDS). In the case of alkoxysilanes, the highly reactive alkoxy groups (3 per a silane molecule) are involved in interactions with hydroxyls present on wood polymers. For MPTES, an additional chemical reaction between the thiol group and wood hydroxyls occurs, which strengthens silane–wood interactions and can be involved in auxiliary stabilisation of wood dimensions. The chemical structure of the tested siloxane allows it only to react with wood polymers via hydrogen or ionic bonds, in which amino groups are involved. SEM images of the treated wood also revealed a different pattern of organosilicons deposition on wood microstructure. Alkoxysilanes seem to form coatings on the cell walls and, perhaps, also encrust them, while the siloxane covers the cell walls, but also fills the cell lumina. Different deposition of organosilicons in the wood structure may result from the differences in their chemical composition (the presence of particular reactive groups) and molecular weight—the biggest DEAPTMDS is probably too large to encrust the cell wall. All these results and observations suggest a different mechanism of wood stabilisation by various organosilicon compounds.
The results of our previous research on dimensional stabilisation of waterlogged archaeological wood with organosilicon compounds showed the reduction in EMC of wood treated with MTMS and MPTES in comparison with untreated wood and lower MC of wood treated with MPTES and MTMS (2.6% and 5%, respectively) in comparison with DEAPTMDS-treated or untreated (7.9% and 6.6%, respectively). Additionally, the cell wall bulking by MTMS was shown by porosity measurements. The results of this study together with all the aforementioned data allow the conclusion that the mechanism of waterlogged wood stabilisation by the used alkoxysilanes can involve bulking the cell wall by silane molecules and wood chemical modification, while in the case of the applied siloxane, it builds upon filling the cell lumina. However, the topic is not closed yet and some more structural and mechanical experiments performed in the nano-scale could reveal more details about the stabilisation mechanism.

Author Contributions

Conceptualisation, M.B. and C.-M.P.; methodology, C.-M.P. and M.B.; investigation, C.-M.P. and M.B.; writing—original draft preparation, C.-M.P. and M.B.; writing—review and editing, M.B. and C.-M.P.; visualisation, M.B. and C.-M.P. All authors have read and agreed to the published version of the manuscript.

Funding

This research was funded by the Polish Ministry of Science and Higher Education through National Grant 2bH 15 0037 83 and by the COST Action FP1303 (COST-STSM-FP1303-37557).

Institutional Review Board Statement

Not applicable.

Informed Consent Statement

Not applicable.

Data Availability Statement

The data presented in this study are available on request from the corresponding author. The data are not publicly available due to the ongoing study in this field.

Acknowledgments

The authors would like to express their thanks to the Directorate of the Museum of the First Piasts at Lednica for sharing the research material—waterlogged elm, and to Mikołaj Grzeszkowiak and Roksana Markiewicz from Adam Mickiewicz University in Poznań, NanoBioMedical Centre for their help in SEM imaging.

Conflicts of Interest

The authors declare no conflict of interest. The funders had no role in the design of the study; in the collection, analyses, or interpretation of data; in the writing of the manuscript, or in the decision to publish the results.

References

  1. Cai, Y.; Hou, P.; Duan, C.; Zhang, R.; Zhou, Z.; Cheng, X.; Shah, S. The use of tetraethyl orthosilicate silane (TEOS) for surface-treatment of hardened cement-based materials: A comparison study with normal treatment agents. Constr. Build. Mater. 2016, 117, 144–151. [Google Scholar] [CrossRef]
  2. Kregiel, D. Advances in biofilm control for food and beverage industry using organo-silane technology: A review. Food Control 2014, 40, 32–40. [Google Scholar] [CrossRef]
  3. Mojsiewicz-Pieńkowska, K.; Jamrógiewicz, M.; Szymkowska, K.; Krenczkowska, D. Direct Human Contact with Siloxanes (Silicones)–Safety or Risk Part 1. Characteristics of Siloxanes (Silicones). Front. Pharmacol. 2016, 7, 132. [Google Scholar] [CrossRef]
  4. Onar, N.; Mete, G.; Aksit, A.; Kutlu, B.; Celik, E. Water-and oil-repellency properties of cotton fabric treated with Silane, Zr, Ti based nanosols. Int. J. Text. Sci. 2015, 4, 84–96. [Google Scholar]
  5. Szymanowski, H.; Olesko, K.; Kowalski, J.; Fijalkowski, M.; Gazicki-Lipman, M.; Sobczyk-Guzenda, A. Thin SiNC/SiOC Coatings with a Gradient of Refractive Index Deposited from Organosilicon Precursor. Coatings 2020, 10, 794. [Google Scholar] [CrossRef]
  6. Wang, M.; Hao, X.; Wang, W. Reinforcing Behaviors of Sulfur-Containing Silane Coupling Agent in Natural Rubber-Based Magnetorheological Elastomers with Various Vulcanization Systems. Materials 2020, 13, 5163. [Google Scholar] [CrossRef]
  7. Donath, S.; Militz, H.; Mai, C. Wood modification with alkoxysilanes. Wood Sci. Technol. 2004, 38, 555–566. [Google Scholar] [CrossRef]
  8. Mai, C.; Militz, H. Modification of wood with silicon compounds. Inorganic silicon compounds and sol-gel systems: A review. Wood Sci. Technol. 2004, 37, 339–348. [Google Scholar] [CrossRef]
  9. Levy, D.; Zayat, M. (Eds.) The Sol-Gel Handbook: Synthesis, Characterization and Applications; 3-Volume Set; John Wiley & Sons Inc.: Hoboken, NJ, USA, 2015. [Google Scholar]
  10. Panov, D.; Terziev, N. Study on some alkoxysilanes used for hydrophobation and protection of wood against decay. Int. Biodeter. Biodegr. 2009, 63, 456–461. [Google Scholar] [CrossRef]
  11. Xie, Y.; Hill, C.A.S.; Xiao, Z.; Militz, H.; Mai, C. Silane coupling agents used for natural fiber/polymer composites: A review. Compos. Part A Appl. Sci. Manuf. 2010, 41, 806–819. [Google Scholar] [CrossRef]
  12. Hill, C.A.S.; Farahani, M.M.; Hale, M.D. The use of organo alkoxysilane coupling agents for wood preservation. Holzforschung 2004, 58, 316–325. [Google Scholar] [CrossRef]
  13. De Vetter, L.; Van den Bulcke, J.; Van Acker, J. Impact of organosilicon treatments on the wood-water relationship of solid wood. Holzforschung 2010, 64, 463–468. [Google Scholar] [CrossRef]
  14. Kartal, S.N.; Yoshimura, T.; Imamura, Y. Modification of wood with Si compounds to limit boron leaching from treated wood and to increase termite and decay resistance. Int. Biodeter. Biodegr. 2009, 63, 187–190. [Google Scholar] [CrossRef]
  15. Giudice, C.A.; Alfieri, P.V.; Canosa, G. Decay resistance and dimensional stability of Araucaria angustifolia using siloxanes synthesized by sol–gel process. Int. Biodeter. Biodegr. 2013, 83, 166–170. [Google Scholar] [CrossRef]
  16. Liu, Y.; Guo, L.; Wang, W.; Sun, Y.; Wang, H. Modifying wood veneer with silane coupling agent for decorating wood fiber/high-density polyethylene composite. Constr. Build. Mater. 2019, 224, 691–699. [Google Scholar] [CrossRef]
  17. Dodangeh, F.; Dorraji, M.S.; Rasoulifard, M.H.; Ashjari, H.R. Synthesis and characterization of alkoxy silane modified polyurethane wood adhesive based on epoxidized soybean oil polyester polyol. Compos. B Eng. 2020, 187, 107857. [Google Scholar] [CrossRef]
  18. Canosa, G.; Alfieri, P.V.; Giudice, C.A. Low Density Wood Impregnation with Water-Repellent Organosilicic Compounds. MSCE 2018, 6, 39. [Google Scholar] [CrossRef] [Green Version]
  19. Smith, C.W.; Hamilton, D.L. Treatment of Waterlogged Wood Using Hydrolyzable, Multi-Functional Alkoxysilane Polymers. In Proceedings of the 8th ICOM Group on Wet Organic Archaeological Materials Conference, Stockholm, Sweden, 11–15 June 2001; pp. 614–615. [Google Scholar]
  20. Broda, M.; Mazela, B. Application of methyltrimethoxysilane to increase dimensional stability of waterlogged wood. J. Cult. Herit. 2017, 25, 149–156. [Google Scholar] [CrossRef]
  21. Broda, M.; Dąbek, I.; Dutkiewicz, A.; Dutkiewicz, M.; Popescu, C.-M.; Mazela, B.; Maciejewski, H. Organosilicons of different molecular size and chemical structure as consolidants for waterlogged archaeological wood–a new reversible and retreatable method. Sci. Rep. 2020, 10, 2188. [Google Scholar] [CrossRef] [Green Version]
  22. Broda, M.; Mazela, B.; Dutkiewicz, A. Organosilicon compounds with various active groups as consolidants for the preservation of waterlogged archaeological wood. J. Cult. Herit. 2019, 35, 123–128. [Google Scholar] [CrossRef]
  23. Popescu, M.-C.; Popescu, C.-M.; Lisa, G.; Sakata, Y. Evaluation of morphological and chemical aspects of different wood species by spectroscopy and thermal methods. J. Mol. Struct. 2011, 988, 65–72. [Google Scholar] [CrossRef]
  24. Popescu, C.-M.; Popescu, M.-C.; Vasile, C. Characterization of fungal degraded lime wood by FT-IR and 2D IR correlation spectroscopy. Microchem. J. 2010, 95, 377–387. [Google Scholar] [CrossRef]
  25. Gelbrich, J.; Mai, C.; Militz, H. Evaluation of bacterial wood degradation by Fourier Transform Infrared (FTIR) measurements. J. Cult. Herit. 2012, 13, S135–S138. [Google Scholar] [CrossRef]
  26. Tolvaj, L.; Popescu, C.-M.; Molnar, Z.; Preklet, E. Dependence of the Air Relative Humidity and Temperature on the Photodegradation Processes of Beech and Spruce Wood Species. BioResourses 2016, 11, 296–305. [Google Scholar]
  27. Łucejko, J.J.; Modugno, F.; Ribechini, E.; Tamburini, D.; Colombini, M.P. Analytical instrumental techniques to study archaeological wood degradation. Appl. Spectrosc. Rev. 2015, 50, 584–625. [Google Scholar] [CrossRef]
  28. Traoré, M.; Kaal, J.; Cortizas, A.M. Application of FTIR spectroscopy to the characterization of archeological wood. Spectrochim. Acta A Mol. Biomol. Spectrosc. 2016, 153, 63–70. [Google Scholar] [CrossRef]
  29. Cesar, T.; Danevčič, T.; Kavkler, K.; Stopar, D. Melamine polymerization in organic solutions and waterlogged archaeological wood studied by FTIR spectroscopy. J. Cult. Herit. 2017, 23, 106–110. [Google Scholar] [CrossRef]
  30. McHale, E.; Steindal, C.C.; Kutzke, H.; Benneche, T.; Harding, S.E. In situ polymerisation of isoeugenol as a green consolidation method for waterlogged archaeological wood. Sci. Rep. 2017, 7, 46481. [Google Scholar] [CrossRef] [PubMed] [Green Version]
  31. Kiliç, N.; Kiliç, A.G. An attenuated total reflection Fourier transform infrared (ATR-FTIR) spectroscopic study of waterlogged woods treated with melamine formaldehyde. Vib. Spectrosc. 2019, 105, 102985. [Google Scholar] [CrossRef]
  32. Popescu, M.-C.; Froidevaux, J.; Navi, P.; Popescu, C.-M. Structural modifications of Tilia cordata wood during heat treatment investigated by FT-IR and 2D IR correlation spectroscopy. J. Mol. Struct. 2013, 1033, 176–186. [Google Scholar] [CrossRef]
  33. Al-Oweini, R.; El-Rassy, H. Synthesis and characterization by FTIR spectroscopy of silica aerogels prepared using several Si (OR) 4 and R′′ Si (OR′) 3 precursors. J. Mol. Struct. 2009, 919, 140–145. [Google Scholar] [CrossRef]
  34. Benmouhoub, C.; Gauthier-Manuel, B.; Zegadi, A.; Robert, L. A Quantitative Fourier Transform Infrared Study of the Grafting of Aminosilane Layers on Lithium Niobate Surface. Appl. Spectrosc. 2017, 71, 1568–1577. [Google Scholar] [CrossRef] [PubMed]
  35. Pasteur, G.A.; Schonhorn, H. Interaction of Silanes with Antimony Oxide to Facilitate Particulate Dispersion in Organic Media and to Enhance Flame Retardance. Appl. Spectrosc. 1975, 29, 512–517. [Google Scholar] [CrossRef]
  36. Kavale, M.S.; Mahadik, D.B.; Parale, V.G.; Wagh, P.B.; Gupta, S.C.; Rao, A.V.; Barshilia, H.C. Optically transparent, superhydrophobic methyltrimethoxysilane based silica coatings without silylating reagent. Appl. Surf. Sci. 2011, 258, 158–162. [Google Scholar] [CrossRef]
  37. Latthe, S.S.; Imai, H.; Ganesan, V.; Rao, A.V. Porous superhydrophobic silica films by sol–gel process. Microporous Mesoporous Mater. 2010, 130, 115–121. [Google Scholar] [CrossRef]
  38. Lin, J.; Chen, H.; Fei, T.; Zhang, J. Highly transparent superhydrophobic organic–inorganic nanocoating from the aggregation of silica nanoparticles. Colloids Surf. 2013, 421, 51–62. [Google Scholar] [CrossRef]
  39. Robles, E.; Csóka, L.; Labidi, J. Effect of reaction conditions on the surface modification of cellulose nanofibrils with aminopropyl triethoxysilane. Coatings 2018, 8, 139. [Google Scholar] [CrossRef] [Green Version]
  40. Pacaphol, K.; Aht-Ong, D. The influences of silanes on interfacial adhesion and surface properties of nanocellulose film coating on glass and aluminum substrates. Surf. Coat. Technol. 2017, 320, 70–81. [Google Scholar] [CrossRef]
  41. Broda, M.; Majka, J.; Olek, W.; Mazela, B. Dimensional stability and hygroscopic properties of waterlogged archaeological wood treated with alkoxysilanes. Int. Biodeter. Biodegr. 2018, 133, 34–41. [Google Scholar] [CrossRef]
  42. Broda, M.; Curling, S.F.; Spear, M.J.; Hill, C.A.S. Effect of methyltrimethoxysilane impregnation on the cell wall porosity and water vapour sorption of archaeological waterlogged oak. Wood Sci. Technol. 2019, 53, 703–726. [Google Scholar] [CrossRef] [Green Version]
Figure 1. Waterlogged elm (Ulmus spp.) wood excavated from the Lednica Lake (dated back to the 10–11th centuries).
Forests 12 00268 g001
Figure 2. Chemical structure of organosilicons selected for the research.
Forests 12 00268 g002
Figure 3. Infrared spectra and their derivatives for the control (C) and the archaeological (A) elm wood samples in 3750–2750 cm−1 (a) and 1850–800 cm−1 (b) regions.
Forests 12 00268 g003
Figure 4. Scanning electron microscope (SEM) images of untreated (C, A) and treated (A1, A2, A3) elm; blue arrows point to the thickness of the cell walls of non-degraded (C) and degraded (A) wood, red arrows indicate organosilicon layers on the cell wall of treated archaeological elm (A1, A2, A3), ^ indicate fungal hyphae.
Forests 12 00268 g004
Figure 5. Infrared spectra and their derivatives for the untreated archaeological elm wood (A) and silane-treated samples (A1, A2, A3, respectively) in 3750–2750 cm−1 (a) and 1800–400 cm−1 (b) regions.
Forests 12 00268 g005
Figure 6. Second derivative spectra in the 1800–400 cm−1 region for the untreated archaeological elm wood (A), wood samples treated with particular organosilicons (A1, A2, A3) and pure silanes and siloxane (1, 2, 3).
Forests 12 00268 g006
Figure 7. Principal component (PC) scores (a) and principal component (PC) loadings (b) calculated for the studied samples.
Forests 12 00268 g007
Figure 8. Schematic illustration of possible interactions taking place between the wood structure (hydroxyl groups present in the cell wall polymers) and the organosilicon compounds used (ac); (A) hydrolysis of silane, (B) a set of consecutive steps of a condensation reaction.
Forests 12 00268 g008aForests 12 00268 g008b
Table 1. Band assignments and their position [24,32,33,34,35,36,37,38,39,40].
Bands AssignmentBands Position, cm−1
AA1A2A3
symmetric stretching vibration of C–H bonds in CH3 groups in wood and silanes/siloxanes2966297429612968
asymmetric stretching vibration of C–H bonds in CH3 groups in wood and silanes/siloxanes2935293329292932
symmetric stretching vibration of C–H bonds in CH2 groups in wood and silanes/siloxanes2877288328852882
asymmetric stretching vibration of C–H bonds in CH2 groups in wood and silanes/siloxanes2842284128532843
C=O stretching vibration of carbonyl, carboxyl and acetyl groups1738173817361738
conjugated C–O in quinines coupled with C=O stretching of various groups; N-H bending vibration1663166116591660
C=C stretching of aromatic skeletal (lignin)1595159815981594
conjugated C–O; C-N stretching vibration in secondary amines1552155215511554
C=C stretching of aromatic skeletal (lignin)1509151015091511
C–H deformation in lignin and carbohydrates
C–H deformation in -CH2-CH3
1462146214601462
C–H deformation in lignin and carbohydrates; C–H deformation in -CH2-CH31417141914181419
C–H deformation in cellulose and hemicellulose; C–H asymmetric deformation in Si-R13711382----1380
C–H vibration in cellulose and Cl–O vibration in syringyl derivatives—condensed structures in lignin; CH2 deformation vibration and C-N stretching vibration in primary amines1329133313381333
-CH2 groups twisting--------13071299
C–O stretching in lignin; Si-C stretching vibration in Si-CH31268127212601256
C−O−C stretching mode of the pyranose ring; 122212241229----
asymmetric stretching vibration of Si-O-C 11871189
C–O stretching; Si-O-C asymmetric stretching vibration1126113111311123
glucose ring stretching vibration; asymmetric stretching vibration of Si-O-Si10821075----1056
C−O ester stretching vibrations in methoxyl and β–O–4 linkages in lignin; Si-O-C asymmetric stretching vibration102710271031----
Si-O in-plane stretching vibration of the silanol Si-OH groups955954----974
946
Si-O-C bending vibration----906913904
Si-C and Si-O-C symmetric stretching vibration840848865842
Si-O-Si bonds stretching vibration----818806
-Si-C rocking in -SiCH3----773745787
Si-O-Si bonds symmetric stretching vibration
C-S- stretching vibration
----715700
645
700
Si-O stretching vibration----582597----
O-Si-O deformation vibration----497
444
470467
Publisher’s Note: MDPI stays neutral with regard to jurisdictional claims in published maps and institutional affiliations.

