Article

The Biogeography of Forest Soil Microbial Functional Diversity Responds to Forest Types across Guangxi, Southwest China

1
Key Laboratory of Agro-Ecological Processes in Subtropical Region, Institute of Subtropical Agriculture, Chinese Academy of Sciences, Changsha 410125, China
2
Huanjiang Observation and Research Station for Karst Ecosystems, Institute of Subtropical Agriculture, Chinese Academy of Sciences, Changsha 410125, China
3
Guangxi Key Laboratory of Karst Ecological Processes and Services, Hechi 547100, China
4
Guangxi South Subtropical Agricultural Science Research Institute, Chongzuo 532415, China
*
Author to whom correspondence should be addressed.
Contributed equally to this work.
Forests 2021, 12(11), 1578; https://doi.org/10.3390/f12111578
Submission received: 28 July 2021 / Revised: 12 November 2021 / Accepted: 13 November 2021 / Published: 17 November 2021
(This article belongs to the Section Forest Soil)

Abstract

:
Vegetation and soil have spatial distributions at different scales, while the spatial distribution of soil microorganisms and factors driving their distribution are still unclear. We aimed to reveal the spatial pattern of microbial functional diversity and to identify its drivers in forest soils at a regional scale. Here, we performed an investigation of microbes across several forest types covering an area of 236,700 km2 in Guangxi, southwest China. We examined a total of 185 samples for soil microbial functional diversity using Biolog EcoPlates. The soil microbial functional diversity had strong spatial heterogeneity across the Guangxi region. The distribution of microorganisms in forest soils was mainly determined by total nitrogen, available N, and C:N ratio, and stand age. We found that coniferous forests, especially pine forest, exhibited lower functional diversity, but the reverse was true for deciduous broadleaf forest/mixed evergreen and deciduous broadleaf forest. Our findings suggested that a heterogeneous distribution of microbial functional diversity in forest soils is related to forest types in Guangxi, China. In conclusion, high soil microbial functional diversity is favored in subtropical forests with looser soil structure, lower soil C:N ratio, greater total soil nitrogen and available nitrogen concentration, and broad-leaved tree species.

1. Introduction

Soil microbes play an essential role in driving and regulating global cycling of biogeochemical nutrients (carbon, C; nitrogen, N; phosphorus, P), and the interactions among these nutrients have important feedbacks to Earth’s landscapes, climate, and ecosystems [1,2,3]. Many researchers have interpreted the spatial heterogeneity of soil nutrient interactions among climate, vegetation, and land uses [3,4]. Meanwhile, the spatial distribution of plants has also been widely studied [5,6]. However, as a bridge between plants and soil, the spatial distribution of soil microbes has gained little attention due to the high spatial and temporal heterogeneities of soil properties and microbes and the limitations of their sampling and measuring methods [7,8]. Thus, the spatial patterns of the functional diversity of soil microorganisms remain largely unknown.
The driving factors of soil microbial spatial patterns vary at different scales. For example, at the national and continental scales, it has been found that soil pH dominates soil bacterial diversity [9,10], while soil texture, pH, total organic carbon, and land use has been shown to control soil molecular microbial biomass [11]. At the regional scale, soil sampling depth and longitude are determinants of the soil archaeal community [12] and exchangeable Ca2+ concentration dominates soil bacterial diversity [13]. At the ecosystem scale, temperature affects ammonia-oxidizing bacteria [14], microbial biomass, and community profiles [15], and dispersal limitation and habitat heterogeneity affect soil microbial taxa [16] and microbial diversity [17], respectively. At the plot scale, soil chemical properties are important determinants of bacterial communities [18]. Therefore, the differences in the spatial patterns of vegetation, soil, and soil microorganisms are well understood, while how microbes feedback to the distribution of the vegetation–soil system remains unclear.
Forests are an essential component of terrestrial ecosystems [19], and forest types in combination with soil properties and climate play a major role in the global cycling of carbon, nitrogen, and phosphorus [20]. According to the China Eighth National Forest Resource Inventory, Guangxi contains rich forest resources with 220 million ha area (62.2% coverage) and 740 million cubic meters forest stock volume, ranking third and seventh in China, respectively. However, the subtropical monsoon climate, long-term production management, and serious soil erosion have resulted in diverse forest types in Guangxi [21]. Therefore, we used soil samples from different forest types in Guangxi to analyze soil microbial functional diversity, the results of which are important for guiding forest management.
Despite a well-constructed concept and evidence for the strong coupling of plant and soil properties [22,23], the effects of soil microorganisms on them and their feedback on plant and soil properties remain elusive due to the frequent covariation of biotic and abiotic variables [24]. Targeting these current knowledge gaps and research needs, we conducted a comprehensive analysis of soil microbial functional diversity at a regional scale in different forest types in Guangxi, China, using Biolog EcoPlates technology, which could generate the metabolic functional information based on the source of C the microorganisms use [25]. Our objectives for this study were to (1) test the hypotheses that the biogeographical distribution of the functional diversity of soil microbial communities would resemble the patterns of soil variables related to plant diversity, and would also be good predictors of soil microbial communities; (2) to determine if there were relationships between the functional diversity of soil microbial communities and environmental factors; (3) to ascertain the ecological drivers of the spatial patterns of microbial biodiversity.

2. Materials and Methods

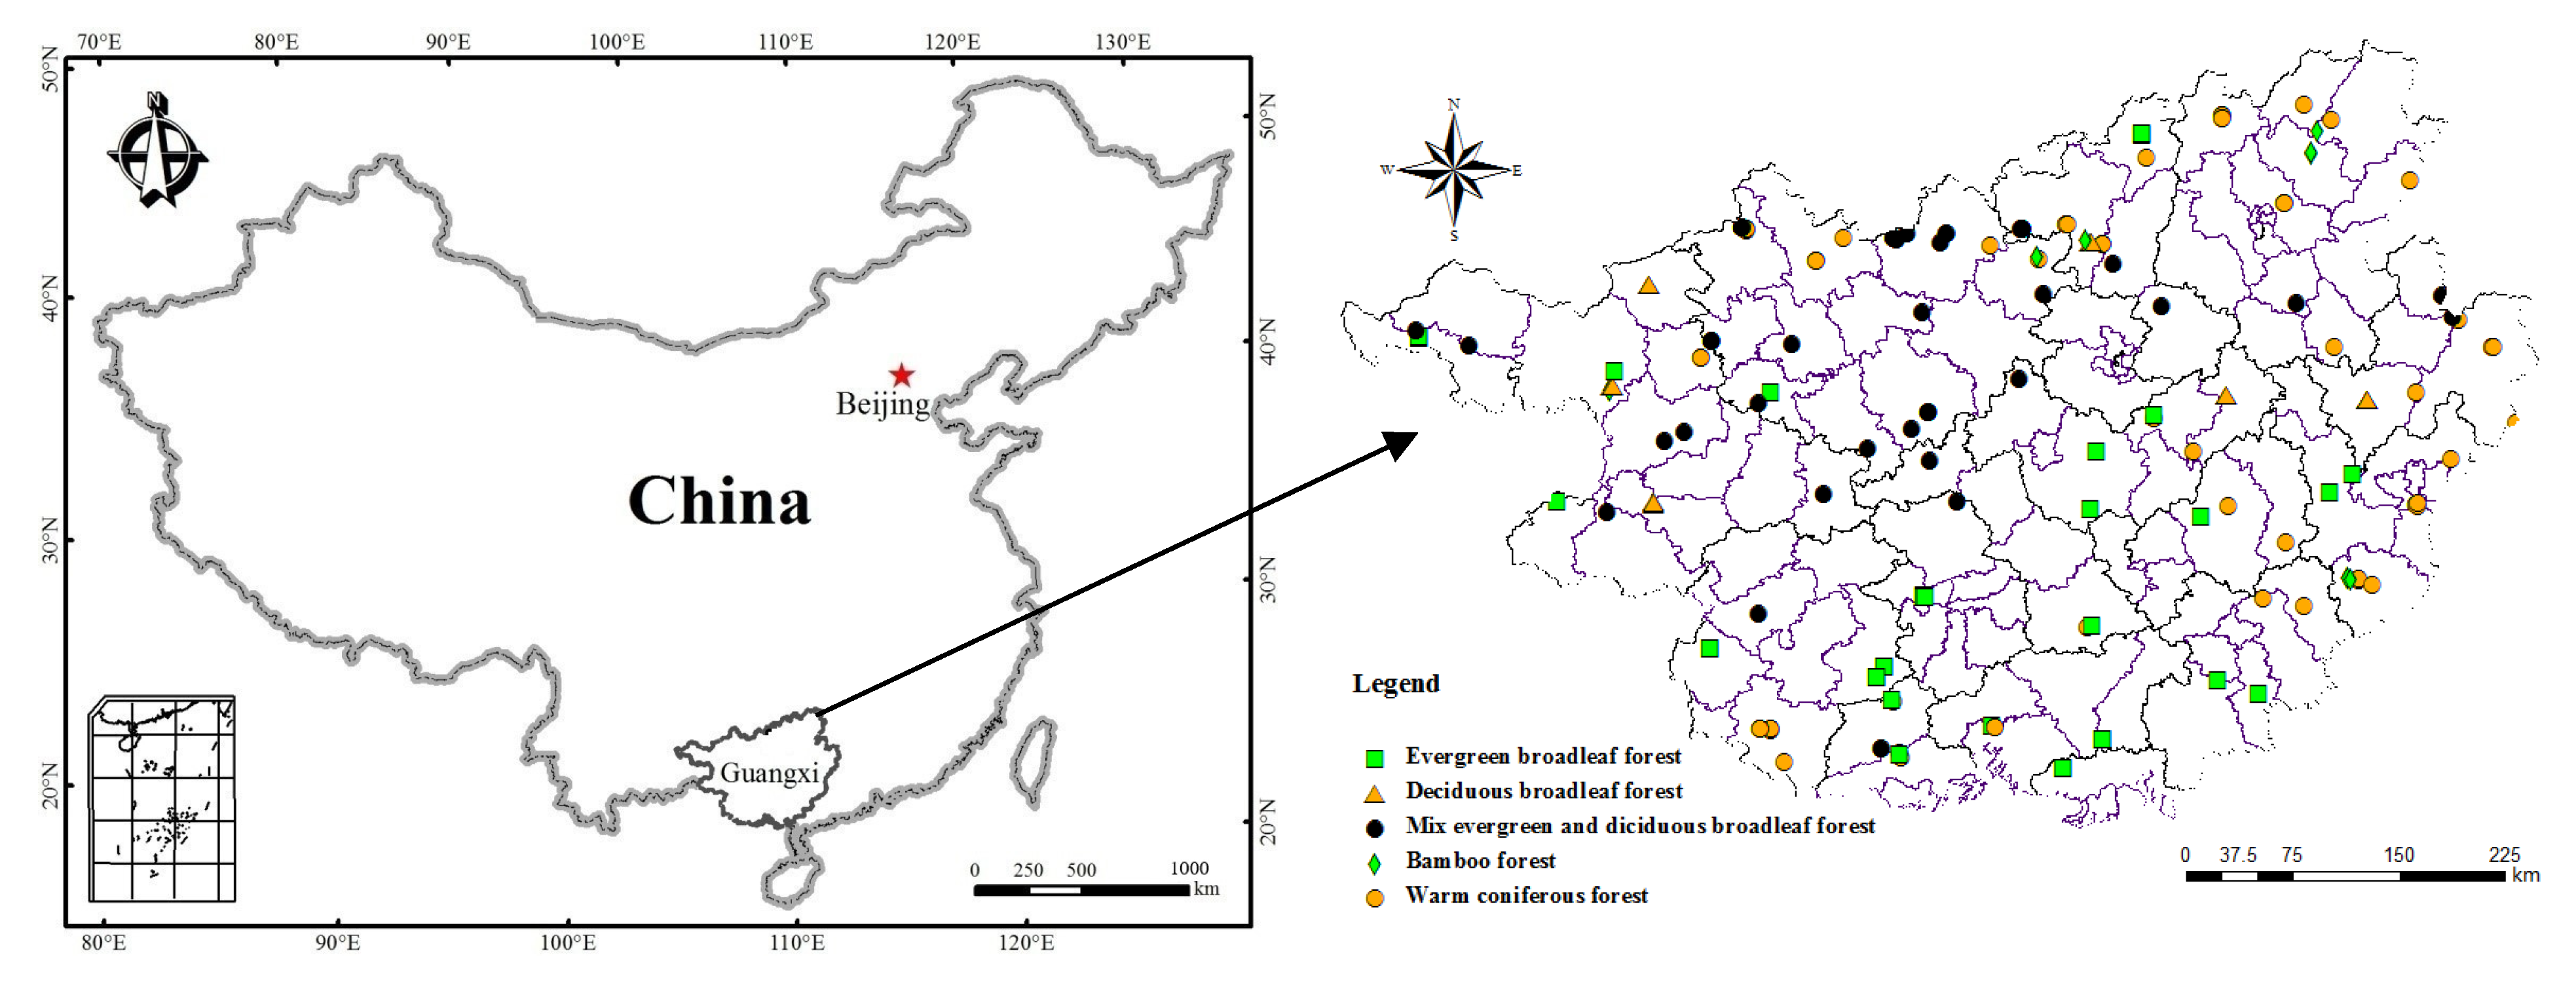
2.1. Site Description

Our study was conducted in Guangxi Zhuang Autonomous Region (104°28′ to 112°04′ E, 20°54′ to 26°23′ N), which has one of the largest forest areas in China. The region has a subtropical monsoon climate. The mean annual temperature (MAT) is 21.1 °C, and the mean annual precipitation (MAP) is 1835 mm. The annual sunshine duration is 1600–1800 h, and the relative humidity is 74.8%. This region has a wide distribution of low mountains and hills with elevation ranging from 20 to 500 m. The main soil types include Ferrallitic soil, Argosols, and Primosols [26].

2.2. Field Survey and Soil Collection

Five forest types were selected based on the distribution area and volume of each forest type, and the sample plots of each forest type were established according to young, middle, near-mature, mature, and overmature sequence (Figure 1 and Figure S1). In total, 185 plots, with an area of 20 m × 50 m each, were established across Guangxi. Each plot was divided into ten 10 m × 10 m quadrats. The number of woody plant species (DBH (diameter at breast height) ≥ 2 cm), stand density, DBH, and tree age were recorded in each 10 m × 10 m quadrat. Tree age was determined by increment cores at about 10 cm above tree DBH when in natural forests and investigated when in planted forest. The above data were used to calculate plant community parameters, such as tree age, tree density, and tree average DBH. Five soil cores (5 cm in diameter and 0–20 cm in depth) were taken from four corners and the center of each 20 m × 50 m plot after removing the litter and pooled to form a composite sample per plot. The composite soil samples were sieved and homogenized and then separated into two subsamples. One subsample was air-dried at room temperature for determination of soil physicochemical properties. Soil samples for soil bulk density determination were also collected alongside the five soil cores.

2.3. Analyses of Soil Chemical and Physical Properties and Collection of the Climate Data

Soil bulk density was calculated from the oven-dried core cutter samples (105 °C, 48 h) to constant weight. Soil pH, organic carbon (SOC), total nitrogen (TN), total phosphorus (TP), total potassium (TK), and available nitrogen (AN) were determined according to [27].
Temperature and precipitation are two important variables of climate data. We obtained the mean annual temperature (MAT) and mean average precipitation (MAP) of the nearest city (district) to each plot in Guangxi. In the study, the values of MAT and MAP represent the past 10 years for analysis.

2.4. Microbial Metabolic Activity Analysis

Microbial metabolic activity was measured using 96-well Biolog EcoPlatesTM (Biolog Inc., Hayward, CA, USA), which comprised 31 sole carbon substrates and a negative control (water) with three replications. The assay was based on the capacity of microorganisms to utilize different substrates and thus generated a metabolic fingerprint providing information on functional diversity in the soil [25]. Out of the 31 carbon substrates, seven were carbohydrates, two amines/amides, six amino acids, nine carboxylic acids, three miscellaneous, and four polymers. Briefly, 5 g of fresh soil was suspended in 45 mL 0.87% NaCl solution, shaken for 30 min, and left to settle for a further 30 min. Then, a 100-fold serial dilution was made, 150 μL of the suspension was transferred to the wells, and the plates were incubated at 25 °C under dark conditions. The color development was followed over time by measuring the absorbance at 590 nm every 24 h during an incubation period of 240 h. The optical density (OD) for each well was calculated as substrate well OD minus control well OD at 96 h [28]. Due to detection limitation, wells with an average OD ≤ 0.2 were set to zero. Microbial metabolic activity was represented by average well color development (AWCD) [29], which was calculated for each soil as the mean absorbance values of all 31 substrates and for the different substrate categories (carbohydrates, amines/amides, amino acids, carboxylic acids, miscellaneous, and polymers) [30].
AWCD = i 31 C i R / n i
where Ci represents the absorbance of each medium-containing well, R represents the absorbance of the blank control well, and n is the number of carbon source types (n = 31). The functional diversity was assessed by the Shannon–Wiener diversity index (H′) [31], calculated for each soil sample using the following formula:
H = p i l n p i
where pi is the proportional color development of the ith well relative to the total color development of all wells.

2.5. Statistical Analyses

A geostatistical method was used to model the spatial structure of soil microbial metabolic diversity (i.e., Shannon–Wiener index) in the forests at the regional scale for Guangxi. First, soil microbial metabolic diversity in the Guangxi forests was analyzed using descriptive statistics. A Kolmogorov–Smirnov test revealed the microbial functional diversity followed a normal distribution after Box–Cox transformation (K-S value > 0.05) (Table S1). Second, semivariogram models were calculated from GS+ 9.0 software (Gamma Design Software, LLC., Canifolia, RL, USA) based on the transformed variables. Moran’s I index was used to measure whether a variable had a spatial dependency and whether the variable itself had a strong association in the nearest space [32]. Semivariance is a statistic measuring the spatial autocorrelation between samples at different lag distances. A larger value of the determination coefficient (R2) of the best fitting model indicates that the spatial structure of soil microbial metabolic diversity can be better reflected (Table S2). Third, ordinary kriging was used to make spatial prediction for points over the entire Guangxi Autonomous Region. The kriging maps were generated through ArcGIS 10.3 software (Environmental Systems Research Institute Inc., Canifolia, RL, USA).
The statistical analyses of microbial functional diversity (i.e., Shannon index) and use efficiency of carbon sources were conducted in the software of SPSS 18.0 software (SPSS Inc., Chicago, IL, USA). The one-way analysis of variation (ANOVA) with Tukey’s post hoc test, the Kolmogrorov–Smirnov test, and the Kruskal–Willis test were also conducted in SPSS 18.0. The principal components analysis (PCA) on the correlation matrix of physico-chemical characteristics, climatic conditions, and vegetation data for soil microbial metabolic diversity data from each forest type was conducted in SPSS 18.0. Stepwise regression analysis was performed in R software (University of Auckland, Auckland, New Zealand) [33], and “MASS” package [34] was used to find the most important predictors of soil microbial metabolic diversity in Guangxi forest soils. Basically, the stepwise regression conducts multiple regression several times and each time removes the weakest related variables (p ≤ 0.05). The variables including forest types, MAT, MAP, elevation, soil bulk density, pH, SOC, TN, C:N ratio, AN, average stand age, stand density, and average DBH were chosen in the stepwise regression analysis. Forest types of evergreen broadleaved forests, deciduous broadleaved forests, mixed evergreen and deciduous broadleaved forests, bamboo forests, and warm coniferous forests were quantified as 1, 2, 3, 4, and 5, respectively. Then, we could identify the variables that significantly explain the soil microbial functional diversity. Redundancy analysis was conducted using the Conoco 5.0 software (Microcomputer Power, Ithaca, NY, USA).

3. Results

3.1. Stand, Environmental, and Soil Characteristics across Guangxi

The minimum, maximum, and mean of the climate, elevation, and vegetation variables and soil properties in the 185 selected sampling sites are shown in Table 1. Among the tested environmental variables, the soil properties, such as the C:N ratio, and the plant properties, such as stand age, had a greater variation than other variables did.

3.2. Spatial Distribution of Microbial Functional Diversity in Guangxi Forest Soils

Soil microbial diversity (i.e., Shannon index) ranged from 2.03 to 3.38 (Figure S2). The mean value of Shannon index was 3.04 ± 0.02 (mean ± standard error). The distribution of soil microbial functional diversity in Guangxi forests was neither normal nor lognormal, but transformation with a Box–Cox resulted in a more normal distribution (Table S1).
Most of the forest sampling soils (86.5%) yielded soil microbial functional diversity between 2.88 and 3.38, with 0.5% of the soils having soil microbial functional diversity larger than 3.38 and 13.0% having less than 2.88 (Figure S2). The robust variogram of the transformed Shannon index is shown in Figure S3 with the fitted exponential model (nugget = 49.2, sill = 312.1, range = 0.32°, and R2 = 0.69) (Table S2). The nugget/(sill + nugget) ratio was substantial (0.16) and indicated the variance that cannot be explained by the model. The value of this ratio showed a strong spatial correlation, and the spatial heterogeneity was mainly due to systematic variability of soil microbes. The fitted model gave an effective range of 0.32° and showed a large autocorrelation distance.
The Shannon index map revealed a heterogeneous distribution of microbial functional diversity, which was, to a large extent, spatially structured in geographical patterns (Figure 2). The middle part of the region exhibited low microbial functional diversity. In contrast, the northwest part of the region exhibited large values of microbial functional diversity. The rest of the region exhibited a medium and rather homogeneous microbial functional diversity, although some outliers of high and low soil microbial metabolic diversity were also observed throughout Guangxi (Figure 2).

3.3. Relationships between Soil Microbial Functional Diversity and Environmental Factors

Principal component analysis yielded three components, and their component cumulative percentage was 57.91% (Figure 3a). The first, second, and third components represent soil factors, plant factors, and the climate factors, respectively. The results indicated that soil total nitrogen, available nitrogen, soil organic carbon, and average stand age were most correlated with the first component, average stand DBH for the second component, and mean annual precipitation for the third component (Figure 3b).
The differences in microbial metabolic diversity was not obvious among the forest types by either biomes or tree species (Figure 4). When categorized by biomes, the Shannon diversity index for warm coniferous forest was significantly lower than those of deciduous broadleaf forest/mixed evergreen and deciduous broadleaf forest (p < 0.05), and other biome types were not statistically different from each other (Figure 4a). When categorized by tree species, the Shannon diversity index for pine forest was significantly lower than those of Alangium platanifolium plantation, soft broadleaf forest (p < 0.05), and bamboo forest, but other species were not statistically different from each other (Figure 4b).
A PCA correlation matrix of climatic characteristics, soil physico-chemical properties, and vegetation characteristics was used to compile a component map for soil microbial functional diversity in forest types at the biome level (Figure 5a–e). For evergreen broadleaf forest, soil microbial functional diversity was preferentially associated with alkaline soils with high organic C, total nitrogen, and available nitrogen concentration, and with old trees (Figure 5a). For deciduous broadleaf forests, mixed evergreen and deciduous broadleaf forests, bamboo forests, and warm coniferous forests, soil microbial metabolism was prone to be active under soils with large organic carbon concentration, total nitrogen, and available nitrogen (Figure 5b–e). For deciduous broadleaf forests, mixed evergreen and deciduous broadleaf forests, and warm coniferous forests, plant factors (i.e., average stand age and average stand DBH) also influenced soil microbial diversity (Figure 5b,c,e). Soil C:N ratio was negatively related with the soil microbial diversity in the evergreen broadleaf forest, bamboo forest, and warm coniferous forest, and positively with deciduous broadleaf forest and mixed evergreen and deciduous broadleaf forest (Figure 5a–e).

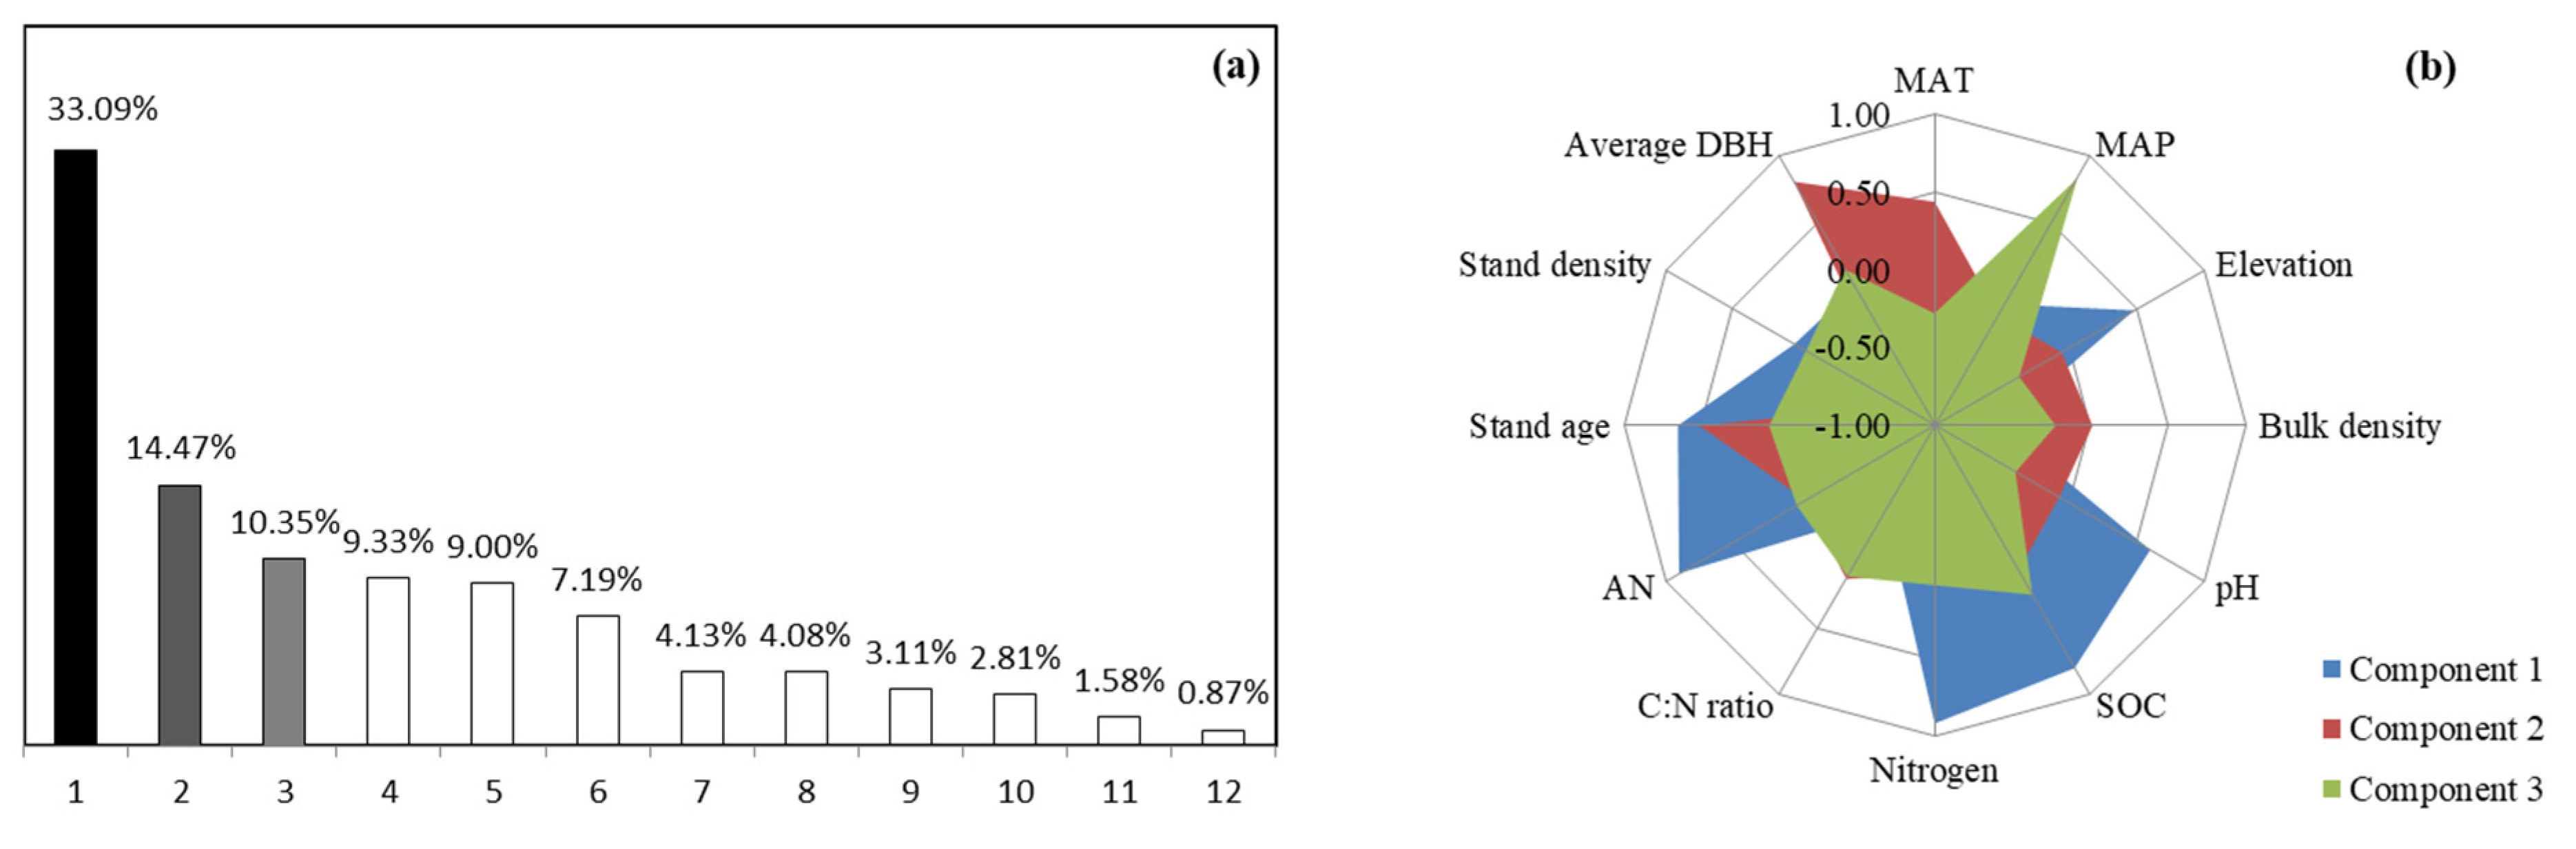
3.4. Drivers of Soil Microbial Functional Diversity

We conducted multiple linear regressions for soil microbial functional diversity as dependent variable and climate factors, elevation, soil physical properties, and woody plant factors as independent variables using the stepwise regression method. Only vegetation types explained 7% of the variability in soil microbial metabolic diversity (Shannon = −0.12 × Types + 0.3761 (p = 0.012)). No significant multiple linear regressions were found between soil microbial metabolic diversity and climate factors, elevation, soil physical properties, and other vegetation factors.

4. Discussion

We used the Biolog EcoPlates system to measure the rate of carbon utilization, and used this data to quantify the functional diversity of forest soils in Guangxi, as previously demonstrated [35,36]. The Shannon index has been the most widely employed index in studies of microbial functional diversity [37,38], and for most Guangxi forest soils (about 87%), the functional diversity ranged from 2.88 to 3.38 (Figure S2). The demonstration that soil functional diversity did not follow a normal or lognormal distribution implied that its distribution between Guangxi forest soils (Table S1) was nonstochastic, and consequently that functional diversity could be under the dependence of environmental conditions. In addition, we found a large range of variation (from 0.99 to 3.38) for soil microbial functional diversity, which might be attributed either to the large sampling scale across various forest types and soil types, or to the greater sensitivity of the Biolog approach to detect differences in microbial diversity. As suggested by the parameters of the semivariogram function (Table S2), the nugget/(sill + nugget) ratio was small (0.16), which indicated that a small proportion of the variance was unexplained, perhaps due to the systematic variability of soil microorganisms. In addition, the autocorrelation distance of about 0.32° longitude (Figure S3) revealed that the soil microbial functional diversity was spatially organized in biogeographic patches scaling dozens of kilometers. This scale of spatial variation suggested that climatic conditions, soil properties, and vegetation would strongly influence the spatial distribution of soil microbial diversity. The map of Guangxi forest soil microbial functional diversity revealed a heterogeneous spatial distribution with hot/high and cold/low spots at the regional scale (Figure 2). Therefore, we rejected the null hypothesis of microbial biogeography implying a random distribution of microorganisms over space [11,39].
The component scores of the PCA correlation matrix confirmed that there were strong relationships between microbial functional diversity and soil properties (Figure 3). Soil pH has been demonstrated as the main factor driving the distribution of soil microbes, such as bacteria, at both large and fine scales [10,40]. However, in our study, soil pH was not the most dominant factor predicting variation in soil microbial functional diversity at the regional scale, a finding that agreed with Singh et al. [13]. Soil total nitrogen and available nitrogen accounted for the most important variation for the soil microbial functional diversity (Figure 3b), which has also been documented for the structural diversity by Lan et al. [40]. Soil C:N ratio was negatively correlated with the functional diversity of soil microorganism in evergreen broadleaf forest, bamboo forest, and warm coniferous forest in the study (Figure 5a–e), which has also been seen in subtropical natural secondary forest [41]. Soil microorganisms must take up nitrogen from the soil to meet their own carbon and nitrogen requirements (soil microorganisms need a C:N ratio of about 24:1 to complete their body composition) and to decompose litter from plants in forests [42]. This is also partly demonstrated by the soil C:N ratio and available nitrogen explaining much of the positive correlation with soil microbial metabolic function in the study (Figure 5a–e).
The main factor of soil microbial metabolic diversity differed for individual forest types (Figure 5). Soil pH was an important factor for microbial functional diversity only in evergreen broadleaf forest (Figure 5a), while total nitrogen, available nitrogen, and soil organic carbon were the most common factors in the other four forest types (Figure 5b–e). Among vegetation properties, stand age was more important than stand density and average DBH in influencing soil microbial metabolic diversity (Figure 5), which indicated that older forests could provide more carbon resources and better quality of carbon input for utilization by soil microorganisms. Based on this, it is easily found that plantations are more prominent than natural forests, which indicates that the pattern of vegetation is more likely to reflect land use change and afforestation policies. Significant differences were observed between warm coniferous forests and deciduous broadleaf forests/bamboo forests (Figure 4a and Figure 5), which could partly be explained by differences in litter quality and quantity [11] and varied influences on soil microbial metabolic activity from different plant species [43]. In addition, our data highlighted that Illicium verum, oil-tea camellia, and bamboo forests soils exhibited high microbial metabolic diversity (Figure 4b), which was consistent with the distribution map in that the high zone in the northwest of Guangxi was dominated by bamboo and some evergreen broadleaf forest (i.e., Illicium verum and oil-tea camellia) soils (Figure 1 and Figure 2). This finding indicates that soil microbial diversity of function might be favored by an environment under medium quantity of litter and/or plant exudates [43]. The lower microbial functional diversity observed at warm coniferous forests, especially pine forests, confirmed the strong effects of the lower availability and/or ability of decomposition of organic substrates provided by this litter for microorganisms [44,45]. Another explanation is the complementary effect of plant diversity, i.e., more plant species diversify the resource pool, for example, deciduous broadleaf forests vs. warm coniferous forests, and apply more niches that accommodate more soil microorganisms [46,47]. However, Chen et al. [48] found that tree species surpassed richness in affecting soil microbial richness and community composition in subtropical forest. Therefore, there are still some uncertain relationships between vegetation and soil microbial functional diversity during forest development and plantation establishment.
There were 31 types of carbon sources in the Biolog EcoPlate: 12 carbohydrates, four polymers, five carboxylic acids, two phenolic acids, six amino acids, and two amines [40]. Generally, the carbon source utilization rates in the five forest types followed a descending order of carbohydrates, amino acids, carboxylic acids, polymers, and phenolic acids (Figure S4), which indicated that carbohydrates were the major carbon source utilized by forest rhizospheric microbiota. Elevation, mean annual precipitation, and soil organic carbon were found to significantly influence soil organic carbon resource utilization by microbes as indicated by redundancy analysis (Figure S5), which suggested that climate factors and soil organic carbon might be important factors determining carbon source use in forest soils. Low variation (<10% in total for both axes) for carbon source use (Figure S5) indicated that some important factors may be neglected in the study. Bending et al. [49], Springob et al. [50], and Lan et al. [40] also found that soil organic carbon concentration markedly correlated with the metabolic activity of soil microbes, which resulted in soil microbial functional diversity.
However, stepwise regression analysis at the regional scale showed that the climate factors (MAP and MAT) were not the pronounced determinants of the spatial distribution of forest soil microbial functional diversity (p > 0.05). This finding might be explained by the small differences in the climate factors at the experimental sites in the study. Only vegetation type was the driver of soil microbial metabolic diversity in the Guangxi forest (p = 0.012 < 0.05). These results indicated that the spatial distribution of soil microbial functional diversity would reflect the forest types at the regional scale to some degree, with different responses of soil microorganisms to changing soil carbon/nitrogen concentrations during forest development and plantation establishment [51]. The different responses of soil microbial functional diversity to forest types can be due to the changes in soil factors (Figure 5) [52], while soil type is also the major factor affecting the diversity of microorganisms [53,54]. Forest ecosystems are complex with respect to the age of plant community [55], site-specific variability [56], and species composition [6], and are paralleled by shifts in soil properties [55] and microbial community [57]. Collectively, the spatial distribution of soil microbial functional diversity depended on the forest types.

5. Conclusions

Here, we investigated forest soil microbial functional diversity at a large regional scale across Guangxi Autonomous Region, China. Our study indicated that microbial functional diversity can show spatial variation at large scales with biogeographic patterns. Among all tested environmental factors, total nitrogen, available nitrogen, and soil C:N ratio collectively drove the spatial pattern of soil microbial functional diversity in Guangxi forests. Meanwhile, the composition of forest also greatly influenced the soil microbial functional diversity. Moreover, for subtropical forests in Guangxi, a lower soil C:N ratio, larger soil total nitrogen and available nitrogen concentrations, and more broad-leaved tree species were beneficial to improve soil microbial carbon source metabolism. However, our study neglected the effects of prior land use history and agricultural practices in plantations such as fertilizer inputs on the patterns of microbial diversity. Collectively, our study highlighted the differential response patterns of microbial functional diversity to different forest types and provided a scientific view for use in the evaluation of the microbial function diversity during forest development.

Supplementary Materials

The following are available online at https://www.mdpi.com/article/10.3390/f12111578/s1, Table S1. Results of soil microbial functional diversity (Shannon index) for descriptive statistics and Kolmogorov-Smirnov test. Table S2. Semivariance analysis of spatial structure of soil microbial functional diversity. Figure S1. Photos of sampling plots. Figure S2. Frequency distribution of Shannon-Wiener diversity index for the investigated forest soils. Figure S3. Robust variograms (□) of microbial functional diversity for the investigated forest soils. Figure S4. Use efficiency of carbon sources by the soil microbial communities from the different forest types. Figure S5. Redundancy analysis (RDA) of carbon resources utilization and environmental factors in forest plots.

Author Contributions

T.S., F.Z. and K.W. conceived and designed the experiments; W.P., H.D., Q.T., H.Z., Z.Z. and F.W. performed the experiments; H.D. and F.W. analyzed the data; H.D. contributed analysis tools; W.P. and F.W. wrote the paper. All authors have read and agreed to the published version of the manuscript.

Funding

This research received no external funding.

Institutional Review Board Statement

Not applicable for studies not involving humans or animals.

Informed Consent Statement

Informed consent was obtained from all subjects involved in the study.

Acknowledgments

This work was funded by the National Key Research and Development Plan of China (2016YFC0502405), National Natural Science Foundation of China (31770495, 31971487, 42071073).

Conflicts of Interest

The authors declare no conflict of interest.

References

  1. Chapin, F.S.; Randerson, J.T.; McGuire, A.D.; Foley, J.A.; Field, C.B. Changing feedbacks in the climate–Biosphere system. Front. Ecol. Environ. 2008, 6, 313–320. [Google Scholar] [CrossRef]
  2. Singh, B.K.; Bardgett, R.D.; Smith, P.; Reay, D.S. Microorganisms and climate change: Terrestrial feedbacks and mitigation options. Nat. Rev. Microbiol. 2010, 8, 779–790. [Google Scholar] [CrossRef] [PubMed]
  3. Xu, X.; Thornton, P.E.; Post, W.M. A global analysis of soil microbial biomass carbon, nitrogen and phosphorus in terrestrial ecosystems. Glob. Ecol. Biogeogr. 2013, 22, 737–749. [Google Scholar] [CrossRef]
  4. Paul, E.A. Soil Microbiology, Ecology, and Biochemistry, 3rd ed.; Academic Press: Burlington, MA, USA, 2007. [Google Scholar]
  5. Song, H.; Xu, Y.; Hao, J.; Zhao, B.; Guo, D.; Shao, H. Investigating distribution pattern of species in a warm-temperate conifer-broadleaved-mixed forest in China for sustainably utilizing forest and soils. Sci. Total Environ. 2017, 578, 81–89. [Google Scholar] [CrossRef] [PubMed]
  6. Du, H.; Hu, F.; Zeng, F.P.; Wang, K.L.; Peng, W.X.; Zhang, H.; Zeng, Z.; Zhang, F.; Song, T. Spatial distribution of tree species in evergreen-deciduous broadleaf karst forests in southwest China. Sci. Rep. 2017, 7, e15664. [Google Scholar] [CrossRef] [Green Version]
  7. Cleveland, C.C.; Liptzin, D. C:N:P stoichiometry in soil: Is there a ‘Redfield ratio’ for the microbial biomass? Biogeochemistry 2007, 85, 235–252. [Google Scholar] [CrossRef]
  8. Joergensen, R.G.; Wu, J.; Brookes, P.C. Measuring soil microbial biomass using an automated procedure. Soil Biol. Biochem. 2011, 43, 873–876. [Google Scholar] [CrossRef]
  9. Fierer, N.; Jackson, R.B. The diversity and biogeography of soil bacterial communities. Proc. Natl. Acad. Sci. USA 2006, 103, 626–631. [Google Scholar] [CrossRef] [Green Version]
  10. Griffiths, R.I.; Thomson, B.C.; James, P.; Bell, T.; Bailey, M.; Whiteley, A.S. The bacterial biogeography of British soils. Environ. Microbiol. 2011, 13, 1642–1654. [Google Scholar] [CrossRef]
  11. Dequiedt, S.; Saby, N.P.A.; Lelievre, M.; Jolivet, C.; Thioulouse, J.; Toutain, B.; Arrouays, D.; Bispo, A.; Lemanceau, P.; Ranjard, L. Biogeographical patterns of soil molecular microbial biomass as influenced by soil characteristics and management. Glob. Ecol. Biogeog. 2011, 20, 641–652. [Google Scholar] [CrossRef]
  12. Zheng, Y.M.; Cao, P.; Fu, B.J.; Hughes, J.M.; He, J.Z. Ecological drivers of biogeographic patterns of soil archaeal community. PLoS ONE 2013, 8, e63375. [Google Scholar] [CrossRef] [Green Version]
  13. Singh, D.; Shi, L.L.; Adams, J.M. Bacterial diversity in the mountains of south-west China: Climate dominates over soil parameters. J. Microbiol. 2013, 51, 439–447. [Google Scholar] [CrossRef]
  14. Fierer, N.; Carney, K.M.; Horner-Devine, M.C.; Megonigal, J.P. The Biogeography of Ammonia-oxidizing bacterial communities in soil. Microb. Ecol. 2009, 58, 435–445. [Google Scholar] [CrossRef]
  15. Hu, Y.J.; Xiang, D.; Veresoglou, S.D.; Chen, F.L.; Chen, Y.L.; Hao, Z.; Zhang, X.; Chen, B. Soil organic carbon and soil structure are driving microbial abundance and community composition across the arid and semi-arid grasslands in northern China. Soil Biol. Biochem. 2014, 77, 51–57. [Google Scholar] [CrossRef]
  16. Song, M.; Peng, W.X.; Zeng, F.P.; Du, H.; Peng, Q.; Xu, Q.; Chen, L.; Zhang, F. Spatial patterns and drivers of microbial taxa in a karst broadleaf forest. Front. Microbiol. 2018, 9, 1691. [Google Scholar] [CrossRef]
  17. Peng, W.X.; Zhu, Y.F.; Song, M.; Du, H.; Song, T.Q.; Zeng, F.P.; Zhang, F.; Wang, K.; Luo, Y.; Lan, X.; et al. The spatial distribution and drivers of soil microbial richness and diversity in a karst forest. For. Ecol. Manag. 2019, 499, e117241. [Google Scholar] [CrossRef]
  18. Regan, K.M.; Nunan, N.; Boeddinghaus, R.S.; Baumgartner, V.; Berner, D.; Boch, S.; Oelmann, Y.; Overmann, J.; Prati, D.; Schloter, M.; et al. Seasonal controls on grassland microbial biogeography: Are they governed by plants, abiotic properties or both? Soil Biol. Biochem. 2014, 71, 21–30. [Google Scholar] [CrossRef]
  19. Dixon, R.K.; Brown, S.; Houghton, R.A.; Solomon, A.M.; Trexler, M.C.; Wisniewski, J. Carbon pools and flux of global forest ecosystems. Science 1994, 263, 185–190. [Google Scholar] [CrossRef]
  20. Lorenz, K.; Lal, R. Carbon Sequestration in Forest Ecosystems; Springer: Berlin, Germany, 2010. [Google Scholar]
  21. Song, T.Q.; Wang, K.L.; Zeng, F.P.; Peng, W.X.; Du, H. Plants and Environment in Karst Areas of Southwest China; China Science Press: Beijing, China, 2015. (In Chinese) [Google Scholar]
  22. Wang, C.; Fu, B.J.; Zhang, L.; Xu, Z.H. Soil moisture-plant interactions: An ecohydrological review. J. Soil Sediment 2019, 19, 1–9. [Google Scholar] [CrossRef]
  23. Wen, Z.; Zheng, H.; Smith, J.R.; Ouyang, Z.W. Plant functional diversity mediated indirect effects of land-use intensity on soil water conservation in the dry season of tropical areas. For. Ecol. Manag. 2019, 480, 118646. [Google Scholar] [CrossRef]
  24. Qiu, H.; Ge, T.; Liu, J.; Chen, X.; Hu, Y.; Wu, J.; Su, Y.; Kuzyakov, Y. Effects of biotic and abiotic factors of soil organic matter mineralization: Experiment and structural modeling analysis. Eur. J. Soil Biol. 2018, 84, 27–34. [Google Scholar] [CrossRef]
  25. Insam, H. A New Set of Substrates Proposed for Community Characterization in Environmental Samples. In Microbial Communities. Functional Versus Structural Approaches; Insam, H., Rangger, A., Eds.; Springer: Berlin/Heidelberg, Germany, 1997; pp. 260–261. [Google Scholar]
  26. State Soil Survey Service of China. China Soil; China Agricultural Press: Beijing, China, 1998. (In Chinese) [Google Scholar]
  27. Bao, S.D. Soil and Agricultural Chemistry Analysis, 3rd ed.; China Agriculture Press: Beijing, China, 2000. [Google Scholar]
  28. Garland, J.L.; Mills, A.L. Classification and characterization of heterotrophic microbial communities on the basis of patterns of community-level sole-carbon-source utilization. Appl. Environ. Microb. 1991, 57, 2351–2359. [Google Scholar] [CrossRef] [Green Version]
  29. Lagerlöf, J.; Adolfsson, L.; Börjesson, G.; Ehlers, K.; Vinyoles, G.P.; Sundh, I. Land-use intensification and agroforestry in the Kenyan Highland: Impacts on soil microbial community composition and functional capacity. Appl. Soil Ecol. 2014, 82, 93–99. [Google Scholar] [CrossRef] [Green Version]
  30. Shannon, C.E.; Weaver, W. The Mathematical Theory of Communication; University of Illinois Press: Champaign, IL, USA, 1949. [Google Scholar]
  31. Fortin, M.J.; Dale, M.R.T. Spatial Analysis: A Guide for Ecologists; Cambridge University Press: Cambridge, UK; New York, NY, USA; Melbourne, Australia, 2005. [Google Scholar]
  32. Li, F.; Liu, M.; Li, Z.; Jiang, C.; Han, F.; Che, Y. Changes in soil microbial biomass and functional diversity with a nitrogen gradient in soil columns. Appl. Soil Ecol. 2013, 64, 1–6. [Google Scholar] [CrossRef]
  33. The R Development Core Team. R: A Language and Environment for Statistical computing. R Foundation for Statistical Computing, Vienna, Austria. Available online: https://www.R-project.org/ (accessed on 1 March 2018).
  34. Ripley, B. Support Functions and Datasets for Venables and Ripley’s MASS [R Package MASS Version 7.3-53]; R Package Version. 2015. Available online: https://www.semanticscholar.org/paper/Support-Functions-and-Datasets-for-Venables-and-Ripley/53690bf36f2aa0d982dcabb181886c458aa7e26f (accessed on 1 March 2018).
  35. Stefanowicz, A.M.; Niklińska, M.; Kapusta, P.; Szarek-Lukaszewska, G. Pine forest and grassland differently influence the response of soil microbial communities to metal contamination. Sci. Total Environ. 2010, 408, 6134–6141. [Google Scholar] [CrossRef]
  36. Saul-Tcherkas, V.; Steinberger, Y. Substrate utilization patterns of desert soil microbial communities in response to xeric and mesic conditions. Soil Biol. Biochem. 2009, 41, 1882–1893. [Google Scholar] [CrossRef]
  37. Pignataro, A.; Moscatelli, M.C.; Mocali, S.; Grego, S.; Benedetti, A. Assessment of soil microbial functional diversity in a coppiced forest system. Appl. Soil Ecol. 2012, 62, 115–123. [Google Scholar] [CrossRef]
  38. Martiny, J.B.H.; Bohannan, B.J.M.; Brown, J.H.; Colwell, F.K.; Fuhrman, J.A.; Green, J.L.; Horner-Devine, M.C.; Kane, M.; Krumins, J.A.; Kuske, C.R.; et al. Microbial biogeography: Putting microorganisms on the map. Nat. Rev. Microbiol. 2006, 4, 102–112. [Google Scholar] [CrossRef] [PubMed]
  39. Rousk, J.; Brookes, P.C.; Bååth, E. The microbial PLFA composition as affected by pH in an arable soil. Soil Biol. Biochem. 2010, 42, 183–520. [Google Scholar] [CrossRef]
  40. Lan, X.; Du, H.; Peng, W.X.; Liu, Y.X.; Fang, Z.L.; Song, T.Q. Functional diversity of the soil culturable microbial community in Eucalytus plantations of different ages in Guangxi, South China. Forests 2019, 10, 1083. [Google Scholar] [CrossRef] [Green Version]
  41. Wang, Y.; Ouyang, Z.Y.; Zheng, H.; Wang, X.K.; Chen, F.L.; Zeng, J.; Chen, S.B. Relationships between carbon source utilization of soil microbial communities and environmental factors in natural secondary forest in subtropical area, China. Acta Ecol. Sin. 2012, 32, 1839–1845, (In Chinese with English Abstract). [Google Scholar] [CrossRef]
  42. Chen, L.; Xiang, W.H.; Wu, H.L.; Ouyang, S.; Zhou, B.; Zeng, Y.; Chen, Y.; Kuzyakov, Y. Tree species identity surpasses richness in affecting soil microbial richness and community composition in subtropical forest. Soil Biol. Biochem. 2019, 130, 113–121. [Google Scholar] [CrossRef]
  43. Yang, C.M.; Wang, Y.L.; Wang, M.M.; Chen, H.Y. Plant species influence metabolic activity and butachlor biodegradation in a riparian soil from Chongmin Island, China. Geoderma 2013, 193–194, 165–171. [Google Scholar] [CrossRef]
  44. Leckie, S.E.; Prescott, C.E.; Grayston, S.J.; Neufeld, J.D.; Mohn, W.W. Comparison of chloroform fumigation-extraction, phospholipid fatty acid, and DNA methods to determine microbial biomass in forest humus. Soil Biol. Biochem. 2004, 36, 529–532. [Google Scholar] [CrossRef]
  45. De Boer, W.; Folman, L.B.; Summerbell, R.C.; Boddy, L. Living in a fungal world: Impact of fungi on soil bacterial niche development. FEMS Microb. Rev. 2005, 29, 795–811. [Google Scholar] [CrossRef] [Green Version]
  46. Hooper, D.U.; Chapin, F.S.; Ewel, A.; Hector, P.; Inchausti, S.; Lavorel, J.H.; Lawton, D.M.; Lodge, M.; Loreau, S.; Naeem, B.; et al. Effects of biodiversity on ecosystem functioning: A consensus of current knowledge. Ecol. Monogr. 2005, 75, 3–35. [Google Scholar] [CrossRef]
  47. Waldrop, M.P.; Zak, D.R.; Blackwood, C.B.; Curtis, C.D.; Tilman, D. Resource availability controls fungal diversity across a plant diversity gradient. Ecol. Lett. 2006, 9, 1127–1135. [Google Scholar] [CrossRef] [Green Version]
  48. Chen, F.L.; Zheng, H.; Ouyang, Z.Y.; Zhang, K.; Tu, N.M. Responses of microbial community structure to the leaf litter composition. Acta Pedol. Sin. 2011, 48, 603–611. [Google Scholar]
  49. Bending, G.D.; Turner, M.K.; Jones, E.J. Interactions between crop residue and soil organic matter quality and the functional diversity of soil microbial communities. Soil Biol. Biochem. 2002, 34, 1073–1082. [Google Scholar] [CrossRef]
  50. Springob, G.; Kirchmann, H. Bulk soil C to N ratio as a simple measure of net N mineralization from stabilized soil organic matter in sandy arable soils. Soil Biol. Biochem. 2003, 35, 629–632. [Google Scholar] [CrossRef]
  51. Ren, C.J.; Liu, W.C.; Zhan, F.Z.; Zhong, Z.K.; Deng, J.; Han, X.; Yang, G.; Feng, Y.; Ren, G. Soil bacterial and fungal diversity and compositions respond differently to forest development. Catena 2019, 181, 104071. [Google Scholar] [CrossRef]
  52. Stephanie, A.; Mona, N. Soil bacteria and archaea change rapidly in the first century of fennoscandian boreal forest development. Soil Biol. Biochem. 2017, 114, 160–167. [Google Scholar]
  53. Grządziel, J.; Gałązka, A. Microplot long-term experiment reveals strong soil type influence on bacteria composition and its functional diversity. Appl. Soil Ecol. 2018, 124, 117–123. [Google Scholar] [CrossRef]
  54. Grządziel, J.; Furtak, K.; Gałązka, A. Community-level physiological profiles of microorganisms from different types of soil that are characteristic to Poland—A long-term microplot experiment. Sustainability 2019, 11, 56. [Google Scholar] [CrossRef] [Green Version]
  55. Chanthorn, W.; Hartig, F.; Brockelman, W.Y. Structure and community composition in a tropical forest suggest a change of ecological processes during stand development. For. Ecol. Manag. 2017, 404, 100–107. [Google Scholar] [CrossRef]
  56. Hume, A.; Chen, H.Y.H.; Taylor, A.R.; Kayahara, G.J.; Man, R. Soil C:N:P dynamics during secondary succession following fire in the boreal forest of Central Canada. For. Ecol. Manag. 2016, 369, 1–9. [Google Scholar] [CrossRef]
  57. Baldrian, P. Microbial activity and the dynamics of ecosystem processes in forest soils. Curr. Opin. Microbiol. 2017, 37, 128–134. [Google Scholar] [CrossRef] [PubMed]
Figure 1. Schematic map showing distribution of the sampling sites across Guangxi Autonomous Region, China. Different symbols represent different types of forests.
Forests 12 01578 g001
Figure 2. Map of forest soil microbial functional diversity on the scale of the Guangxi territory.
Forests 12 01578 g002
Figure 3. Scores of the principal components analysis (PCA) for soil microbial functional diversity on the correlation matrix of soil physico-chemical characteristics, climatic conditions, and vegetation data (a), and the principal factors contributing to distinction between soil samples (b). MAT, mean annual temperature; MAP, mean annual precipitation; SOC, soil organic carbon; Nitrogen, total nitrogen; AN, available nitrogen; Stand age, average stand age; Stand density, average stand density; Average DBH, average stand DBH.
Forests 12 01578 g003
Figure 4. Distribution of the average value of soil microbial metabolic diversity according to (a) the biome and (b) tree species levels. Numbers in parentheses indicate the number of soil samples. Different letters indicate significant differences between forest types (p < 0.05). The bars that are above and below the boxes represent the positive and negative standard error, respectively. The line segment at the median inside the rectangular box is treated as the median line. The circles represent mild outliers, and the whiskers represent the extreme outliers.
Forests 12 01578 g004
Figure 5. The principal components analysis (PCA) on the correlation matrix of soil physico-chemical characteristics, climatic conditions, and vegetation for soil microbial metabolic diversity data from five forest types in Guangxi, China, showing the dominant factors contributing to distinction between soil samples. (ae) Represent evergreen broadleaf forest, deciduous broadleaf forest, mixed evergreen and deciduous broadleaf forest, bamboo forest, and warm coniferous forest, respectively. MAT, mean annual temperature; MAP, mean annual precipitation; SOC, soil organic carbon; Available_N, available nitrogen; Bulk_density, soil bulk density; Nitrogen, total nitrogen; pH, soil pH; Stand_DBH, average stand DBH; Stand_age, average stand age; Stand_density, average density of stands.
Forests 12 01578 g005
Table 1. Minima, maxima, means, and coefficient variation (CV) of environmental variables in the forests across Guangxi, China (n = 185).
VariablesMinimumMaximumMeanStandard ErrorCoefficient of Variation (%)
Climate factorsMAT (°C)19.523.121.60.74.5
MAP (mm)1059.1247.31413.724.423.1
ElevationElevation (m)24.21441.0441.825.075.7
Soil factorsBulk density0.41.6671.00.022.1
pH3.38.04.80.121.7
SOC (g·kg−1)4.885.831.11.146.7
TN (g·kg−1)0.38.62.30.160.2
TP (g·kg−1)0.11.70.50.360.6
TK (g·kg−1)0.432.111.20.556.6
C:N ratio8.6137.716.60.971.7
AN (mg·kg−1)34.7634.7212.08.754.6
Plant factorsStand age (a)1.0120.029.81.984.9
Stand density
(stems·ha−1)
1700.046,400.013,749.06.259.8
DBH (cm)1.131.913.20.444.7
MAT, mean annual temperature; MAP, mean annual precipitation; Bulk density, soil bulk density; SOC, soil organic carbon; TN, soil total nitrogen; TP, soil total phosphorus; TK, soil total potassium; C:N ratio, ratio of soil carbon to soil nitrogen; AN, soil available nitrogen; Stand age, average stand age; Stand density, average stand density; DBH, diameter at breast height.
Publisher’s Note: MDPI stays neutral with regard to jurisdictional claims in published maps and institutional affiliations.

