Article

Predicting the Potential Distribution of Perennial Plant Coptis chinensis Franch. in China under Multiple Climate Change Scenarios

1
National Engineering Laboratory for Resource Development of Endangered Chinese Crude Drugs in Northwest of China, Key Laboratory of Medicinal Resources and Natural Pharmaceutical Chemistry, Shaanxi Normal University, The Ministry of Education, Xi’an 710119, China
2
College of Life Sciences, Shaanxi Normal University, Xi’an 710119, China
3
Zhenping County Agricultural Science and Technology Research Institute, Ankang 725600, China
*
Authors to whom correspondence should be addressed.
Forests 2021, 12(11), 1464; https://doi.org/10.3390/f12111464
Submission received: 14 September 2021 / Revised: 12 October 2021 / Accepted: 21 October 2021 / Published: 27 October 2021
(This article belongs to the Section Forest Economics, Policy, and Social Science)

Abstract

:
Coptis chinensis Franch. (Ranales: Ranunculaceae) is a perennial species with high medicinal value. Predicting the potentially geographical distribution patterns of C. chinensis against the background of climate change can facilitate its protection and sustainable utilization. This study employed the optimized maximum entropy model to predict the distribution patterns and changes in potentially suitable C. chinensis’ regions in China under multiple climate change scenarios (SSP1-2.6, SSP2-4.5, SSP3-7.0 and SSP5-8.5) across different time periods (1970–2000, 2050s, 2070s, and 2090s). The results revealed that the currently potentially suitable regions of C. chinensis span an area of 120.47 × 10⁴ km2, which accounts for 12.54% of China’s territory. Among these areas, the low, moderate, and highly suitable regions are 80.10 × 10⁴ km2, 37.16 × 10⁴ km2, and 3.21 × 10⁴ km2, respectively. The highly suitable regions are primarily distributed in Chongqing, Guizhou, Zhejiang, Hubei, and Hunan Provinces. Over time, the potentially suitable regions of C. chinensis are predicted to shrink. Furthermore, our study revealed that the relatively low impact areas of C. chinensis were mainly distributed in Yunnan, Guizhou, Hubei, Chongqing, and other Provinces. Centroid transfer analysis indicated that except for SSP1-2.6, the center of the potentially suitable region of C. chinensis showed a trend of gradual transfer to the northwest and high-altitude areas.

1. Introduction

Over the last 3.5 billion years, approximately 4 billion species have evolved on Earth. Subsequent to five mass extinction, 99% of these species have disappeared [1,2,3]. Due to climate change caused by anthropogenic activities, we may be witnessing a sixth mass extinction as species continue to vanish [4]. Numerous studies have shown that climate change is an important driving factor for biodiversity loss, habitat fragmentation, and changes in species spatial patterns, which may increase the risk of extinction of endangered species [3,5]. The Fifth Assessment Report (AR5) of the Intergovernmental Panel on Climate Change (IPCC) revealed that the gradual increase in greenhouse gases (e.g., CO2) is leading to global warming [6].
From 1880 to 2012, the global temperature increased by 0.85 °C, which is anticipated to continue to rise by a further 0.3–4.8 °C by the end of the 21st Century [7]. Meanwhile, China’s Third National Climate Change Assessment Report revealed that the average temperature of China’s terrestrial areas increased by 0.9–1.5 °C from 1909 to 2011, and would further increase by 1.3–5.0 °C by the end of the 21st Century [8]. Climate warming is expected to change the frequency and intensity of extreme climate events (e.g., high temperatures, heat waves, drought, wildfires, storms, and floods) [4,8,9]. In response, many species may shift their ranges to cope with the increasing changes in environmental conditions (e.g., by migrating to high-altitude/-latitude areas) [10,11]. Numerous studies have investigated the effects of climate change on a wide range of species, and have shown that changes in climate conditions would profoundly affect species’ distribution ranges [12], which may lead to changes in species dominance, survival, replacement and community structure [13]. Thus, it is of long-term significance to elucidate the impacts of climate change on the geographic distribution, germplasm, resource protection, and sustainable utilization of plant species.
With the emergence of novel computational statistics technologies and the development of the global information system (GIS), direct correlations between environmental factors (e.g., climate, topography, meteorological data) and species data have become possible, and such correlations have been extensively used in ecological studies [14]. Over the last decade, ecological niche modeling (ENM) has been frequently and extensively employed to simulate the spatial distribution of species, evaluate their potential responses to climate change, and determine their niche based on environmental variables [15]. This method has been used in various disciplines (e.g., global change biology, biogeography) to predict the potentially suitable habitats by analyzing the known environmental conditions of species occurrence [16]. ENM is a modeling tool that combines observations of species occurrence or abundance with environmental estimates [17,18,19]. They are used to gain ecological and evolutionary insights and to predict distributions across landscapes [20]. Previous comparisons of different ENM approaches have suggested that maximum entropy modeling (MAXENT) has a relatively better prediction ability; thus, it has become one of the most widely used modeling approaches [3,21,22]. MAXENT also utilizes species presence and climate data to estimate the potential past and future distribution of species, to facilitate the identification of relatively low impact areas for species, as well as the trajectories of their migration and diffusion [10,23].
Coptis chinensis Franch. (Ranales: Ranunculaceae) is a perennial species with high economic and medicinal values [24,25], which is primarily distributed across the Sichuan, Chongqing, Guizhou, Hunan, Hubei, Zhejiang, and Shaanxi Provinces in China. This species favors cold, humid, and shady environments, and typically thrives in mountain forests or valleys at altitudes of from 500–2000 m [26]. It starts to bloom in the third or fourth year after sowing or the second year after transplanting. Differentiation of flower buds usually occurs between mid-August and mid-October. Both sexual and asexual reproductions occur in C. chinensis, while asexual reproduction via developed underground vegetative propagule prevails under natural conditions [27]. In traditional Chinese medicine, C. chinensis is commonly used for the treatment of nausea and vomiting, diarrhea due to spleen deficiencies, toothaches, sore mouth, and other diseases [28,29,30,31]. Due to climate change and anthropogenic activities, the distribution areas of C. chinensis are gradually shrinking across China, to the extent that it has been listed as a Grade-II state-protected plant by the central government [24,25,32].
In the past decades, due to the excessive exploitation and habitat destruction, the wild resources of C. chinensis have been rapidly shrinking. However, it is difficult to develop a conservation and management strategy without understanding its climate preferences and potentially geographical distribution [33]. Moreover, climate change has been reported to have significant implications for the habitat requirements of various species [34]. Hence, determining whether climate change would affect the habitat suitability of the target species is another critical issue related to its economic value and ecological significance [9]. Nonetheless, the ecological requirements of C. chinensis have rarely been investigated in previous studies. Little is known about the priority areas where C. chinensis should be cultivated under climate change scenarios.
Based on optimized maximum entropy models, this study aimed to predict and analyze the distribution patterns of potentially suitable regions for C. chinensis under multiple climate scenarios (SSP1-2.6, SSP2-4.5, SSP3-7.0 and SSP5-8.5) over various time periods (1970–2000, 2050s, 2070s and 2090s). The purposes of this study were to (1) predict the potentially geographical distribution of C. chinensis under different climate scenarios; (2) determine the environmental factors affecting the distribution of C. chinensis; (3) predict the relatively stable suitable areas of C. chinensis under the background of climate change; and (4) locate priority areas for effective conservation. The findings of this study would provide important references for the investigation and protection of germplasm resources for this medicinal herb, as well as the promotion of artificial planting.

2. Materials and Methods
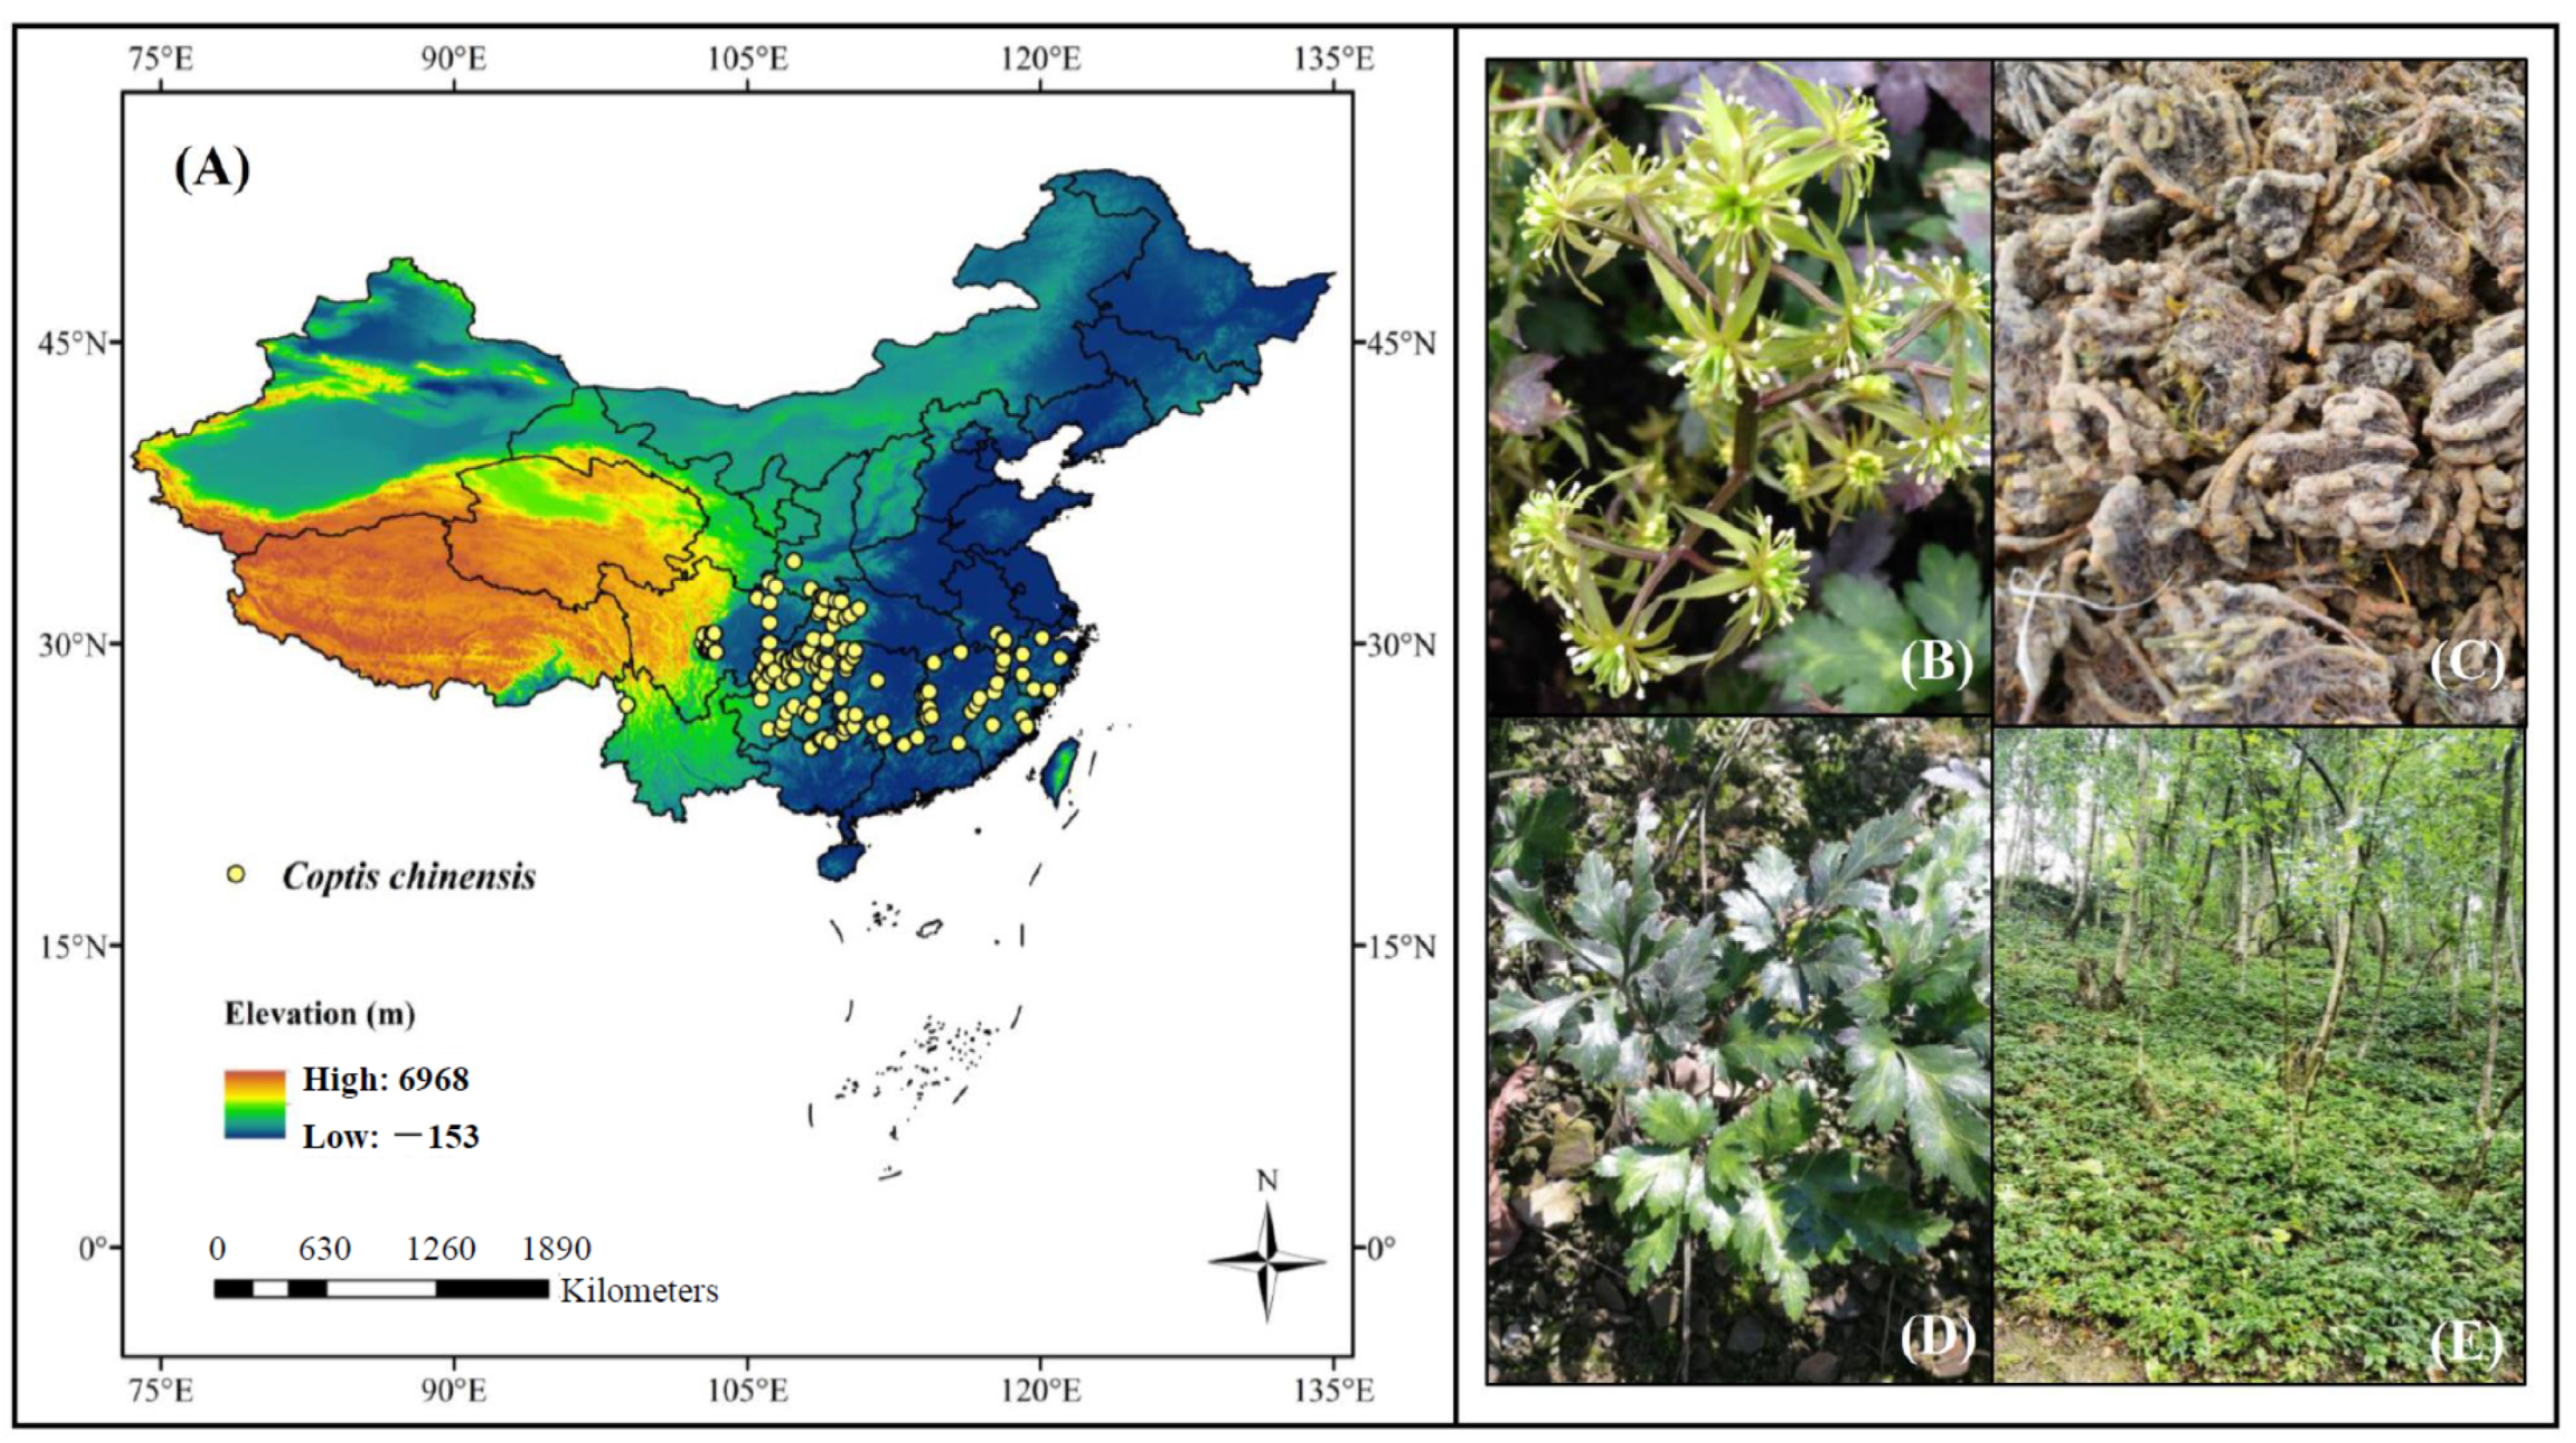
2.1. Study Area

The boundaries of C. chinensis’ distribution range includes Baoji City, Shaanxi Province to the north; Taizhou City, Zhejiang Province to the east, Nujiang Autonomous Prefecture, Yunnan Province to the west; and Hechi City, Guangxi Province to the south. The geographic coordinates of the natural distribution areas of C. chinensis are 24°49′56″–34°3′28″ N and 98°52′15″–121°2′16″ E.

2.2. Species Occurrence Data

Based on an extensive literature review, we determined a total of 31 occurrence localities of C. chinensis across its main production area in Shaanxi, Sichuan, Chongqing and Yunnan Provinces of China, and conducted field surveys from 2019 to 2020. These 31 occurrence points were included in the dataset for the model development in this study. Furthermore, an additional 195 occurrence points were retrieved from the previously published literature and publicly accessible databases [China National Knowledge Infrastructure/CNKI (https://www.cnki.net; accessed on 15 July 2021), China Digital Plant Herbarium/CVH (https://www.cvh.ac.cn; accessed on 15 July 2021), and Global Biodiversity Information Facility/GBIF (https://www.gbif.org; accessed on 15 July 2021)]. The resulting dataset was then quality-controlled following the protocol of Ye et al. [2]. To minimize errors caused by clustering effects, each grid (2.5 arc-minutes) retained only one occurrence point; thus, a final dataset of 136 occurrence points was employed for MAXENT modeling (Figure 1; Table S1).

2.3. Screening of Environmental Variables

Climate change is the most crucial environmental factor that affects the distribution of species across suitable regions, where bioclimatic factors are frequently used for plant niche modeling [21,35]. The bioclimatic factors used in this study were downloaded from the WorldClim website (https://www.worldclim.org; accessed on 23 June 2021), which encompassed one recent (1970–2000) and three future periods (2050s, 2070s and 2090s). The selection of various climate change scenarios clearly affected the accuracy of the developed models [36].
To minimize this effect, four shared socioeconomic pathways (SSPs; SSP1-2.6, SSP2-4.5, SSP3-7.0, and SSP5-8.5) for three general circulation models (GCMs; BCC-CSM2-MR, CNRM-CM6-1, and MIROC-ES2L) were selected for future bioclimatic data. Consequently, a total of 37 sets of bioclimatic data were integrated into this study, including one recent and 36 future sets. The spatial resolution of the above data was 2.5 arc-minutes.
The screening of climatic factors has an important impact on the accuracy of the results of model prediction. Based on the data of species occurrence points and 19 bioclimatic factors, the Pearson correlation coefficient and Jackknife method were used to evaluate the most important bioclimatic factors that influenced the potential distribution of C. chinensis [37]. Firstly, the Jackknife method was employed to evaluate the importance of each variable of the model. Secondly, Pearson correlation coefficients among the 19 bioclimatic factors were calculated, and |R| ≥ 0.8 was used as the threshold to judge the significant correlation between climatic factors. Finally, for each pair of significantly correlated variables, only one with the greater contribution was retained [1,38].

2.4. Model Optimization and Establishment

For this study, MaxEnt v3.4.1 software [39] was used to construct the maximum entropy model of C. chinensis. To ensure that the distribution of C. chinensis was close to normal probability, we selected 70% of the data for model training, and the remaining data for model testing. Further, to reduce the occurrence of errors, the maximum number of parameters was set to 5000, where each process was repeated 10 times; the other settings were selected by default [40,41].
We used the <kuenm> package in R v3.4.1 [42] to optimize the feature class (FC) and regularization multiplier (RM) of the model. Initially, the RM was set to 0.1–4 at 0.1 intervals, which resulted in a total of 40 RM values. Next, four FCs (Linear (L), Quadratic (Q), Hinge (H), and Product (P)) in the MAXENT model were arranged and combined to create 15 FC combinations [L, P, Q, H, LP, LQ, LH, LPQ, LPH, LQH, LPQH, PQH, PQ, PH and QH]. Thus, a total of 600 parameter combinations were multiplied by FC and RM. Based on the optimal model, we selected the model (OR_AICc) that was statistically significant, where the omission rate was lower than the threshold (0.05), and the delta AICc value was not higher than 2 [43,44].

2.5. Model Reliability Test and Classification of Suitable Regions

Following model construction, the area under the receiver operating characteristic curve (AUC) is typically used to evaluate the accuracy of the model prediction, where the AUC range was (0,1). The higher the AUC value, the higher the credibility of distinguishing between suitable and unsuitable habitats, where AUC ≥ 0.9 indicated a very accurate model prediction [45,46].
The suitability of a given area for species is generally expressed by the value of 0–1, where the higher the value, the more adaptive the species that grows in this area. According to Tang et al. [47], the maximum test sensitivity plus specificity (MTSPS) threshold is superior to other threshold options for the classification of suitable regions. In this study, MTSPS was used as the threshold, and those regions with suitability values below the threshold were considered unsuitable. The suitability range between the MTSPS and 1 was partitioned into three equal sections, which corresponded to low, moderate, and high suitability regions, respectively [38,48].

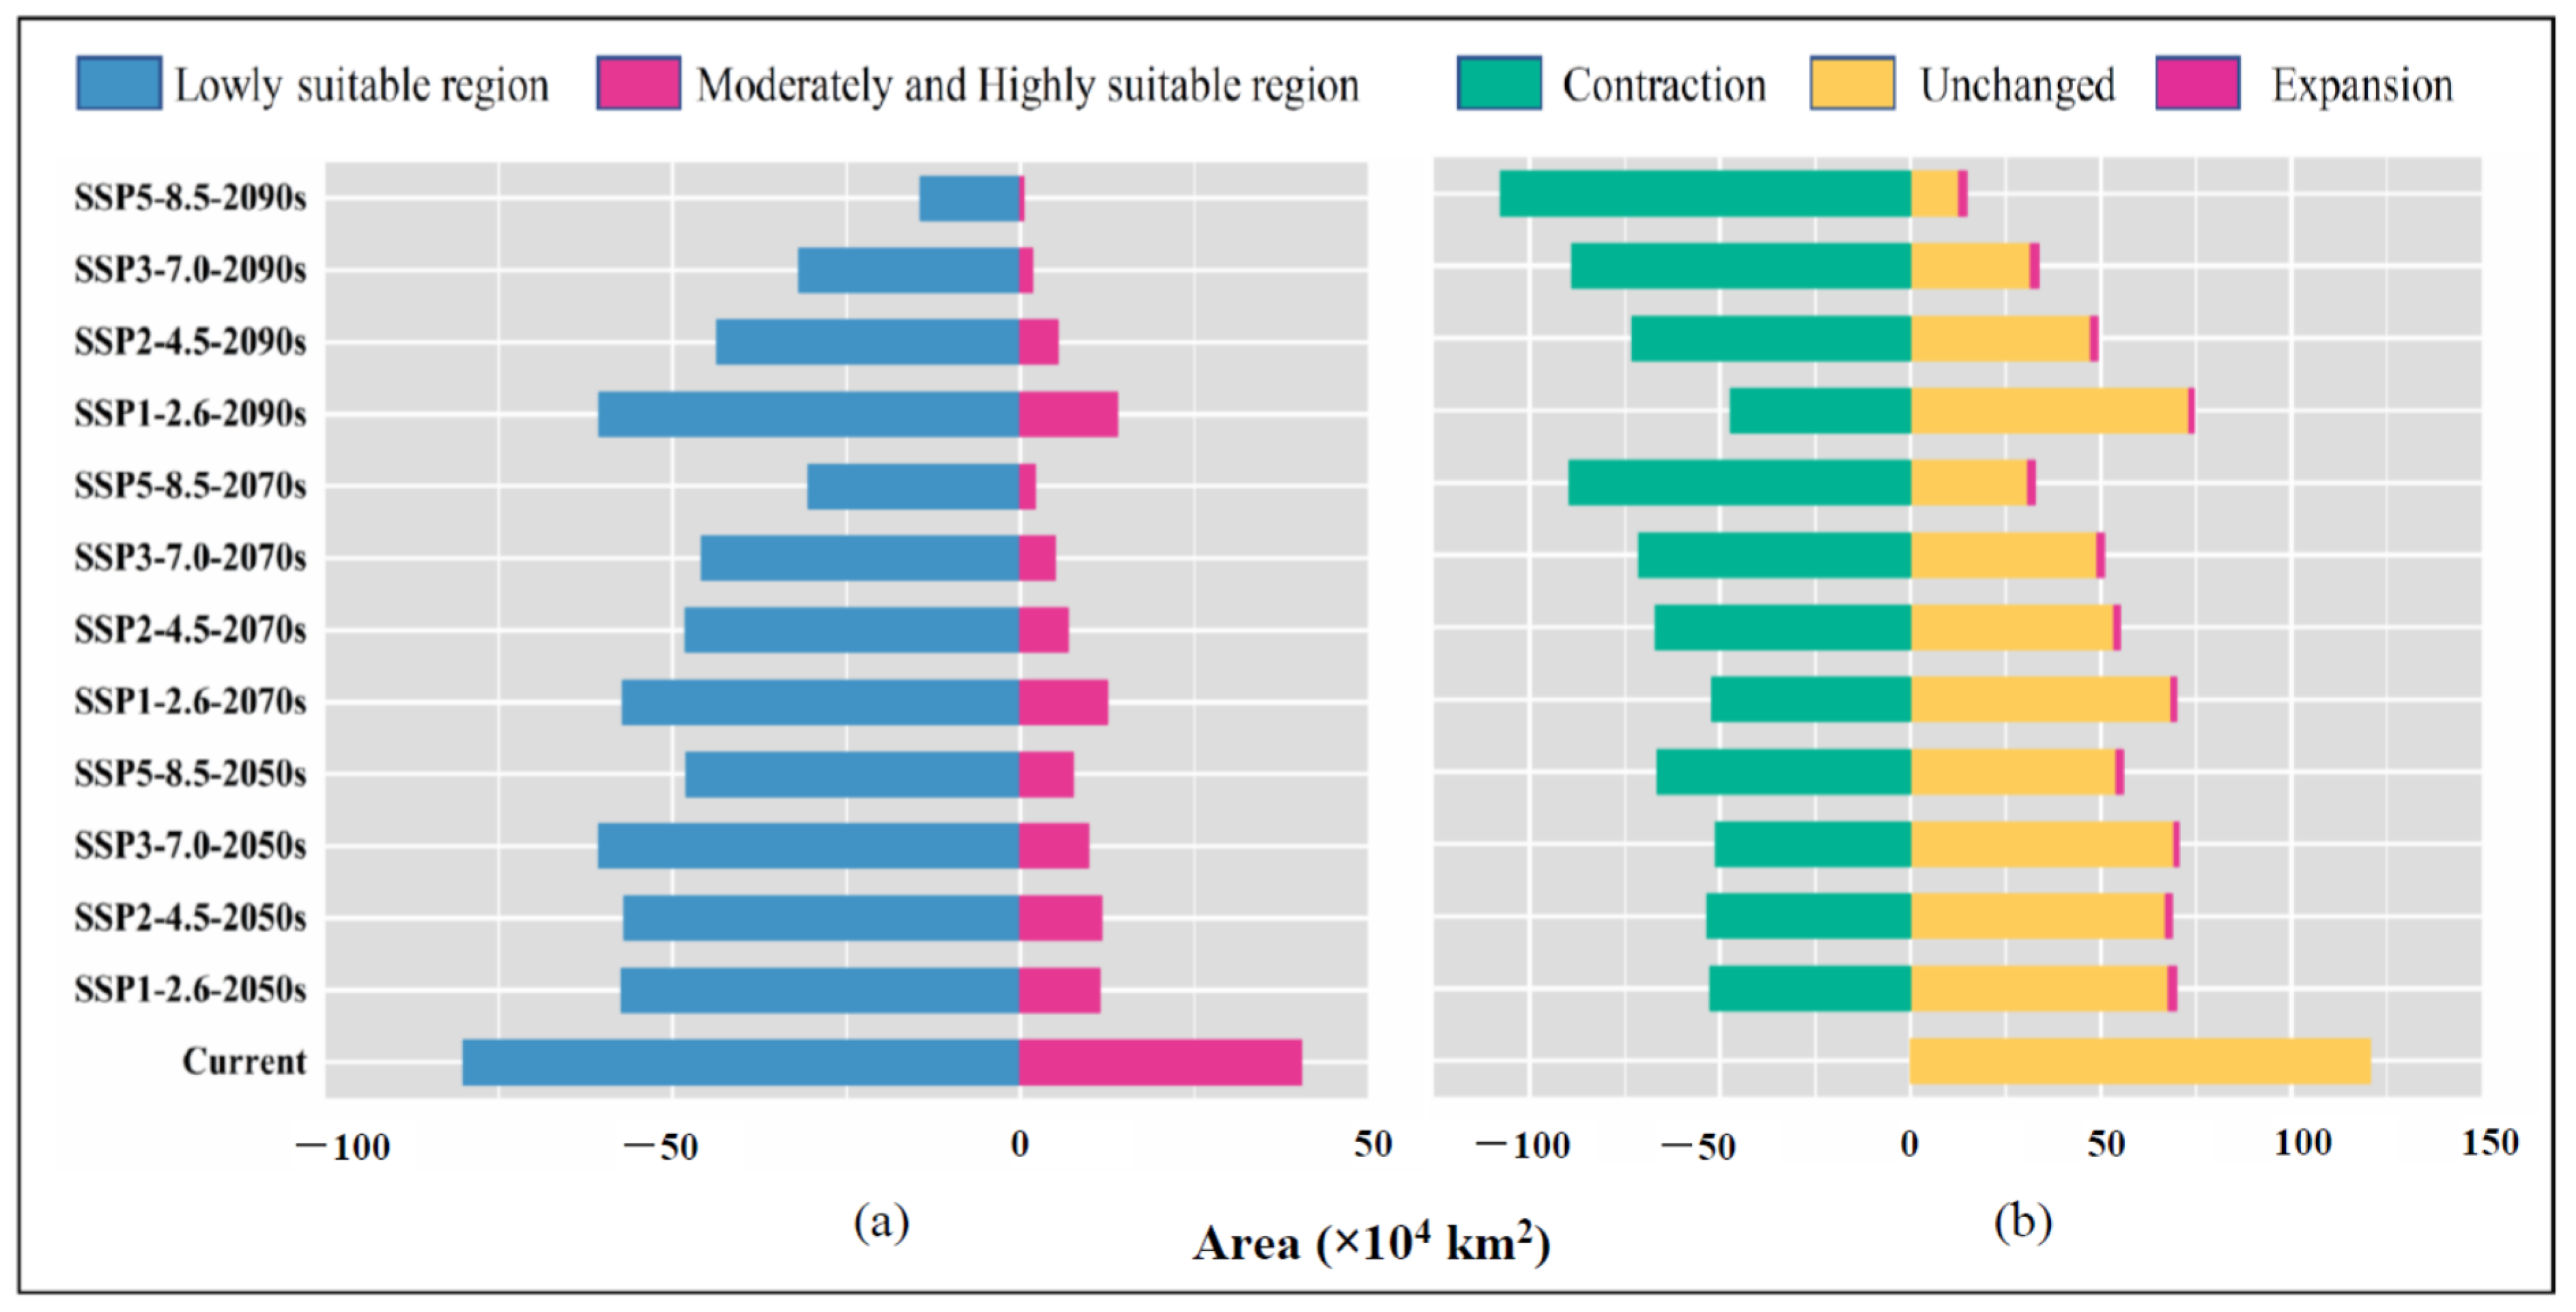
2.6. Analysis of Low Impact Area and Spatial Pattern Change

Low impact areas refer to those where species were less affected by climate change [49], which were identified by overlaying the binary prediction maps of suitable regions for different periods and isolating the completely overlapping portions. Using DIVA-GIS v7.5 software (http://www.diva-gis.org; accessed on 12 May 2021), the distribution maps of potentially suitable regions for different years were initially superimposed. The spatial units with probability values greater than the MTSPS threshold were redefined as suitable regions for the species, while the spatial units with probability values less than the threshold were redefined as non-suitable regions. Thus, the unsuitable and suitable matrices of C. chinensis were established, and the fully overlapping portions in the overlay layer were selected. This study predicted the relatively low impact areas of four different shared socioeconomic paths (SSP1-2.6, SSP2-4.5, SSP3-7.0 and SSP5-8.5) for recent and future periods of C. chinensis propagation (2050s, 2070s and 2090s).
Spatial pattern changes refer to the modification of potentially suitable regions of species for different time periods, which can be obtained via the superposition of binary prediction maps of suitable regions for different time periods [4,8,50]. Using DIVA-GIS v7.5 software, the distribution maps of potentially suitable regions for different time periods were superimposed to establish the suitable and unsuitable matrices of C. chinensis. Based on the matrix table, changes in the spatial patterns of suitable distribution areas of C. chinensis under current and future climate change scenarios were further analyzed. For this study, we generated a total of 12 spatial pattern change prediction maps, which were employed to analyze the change patterns of potentially suitable regions across different time periods for C. chinensis under current and differently shared socioeconomic pathways.

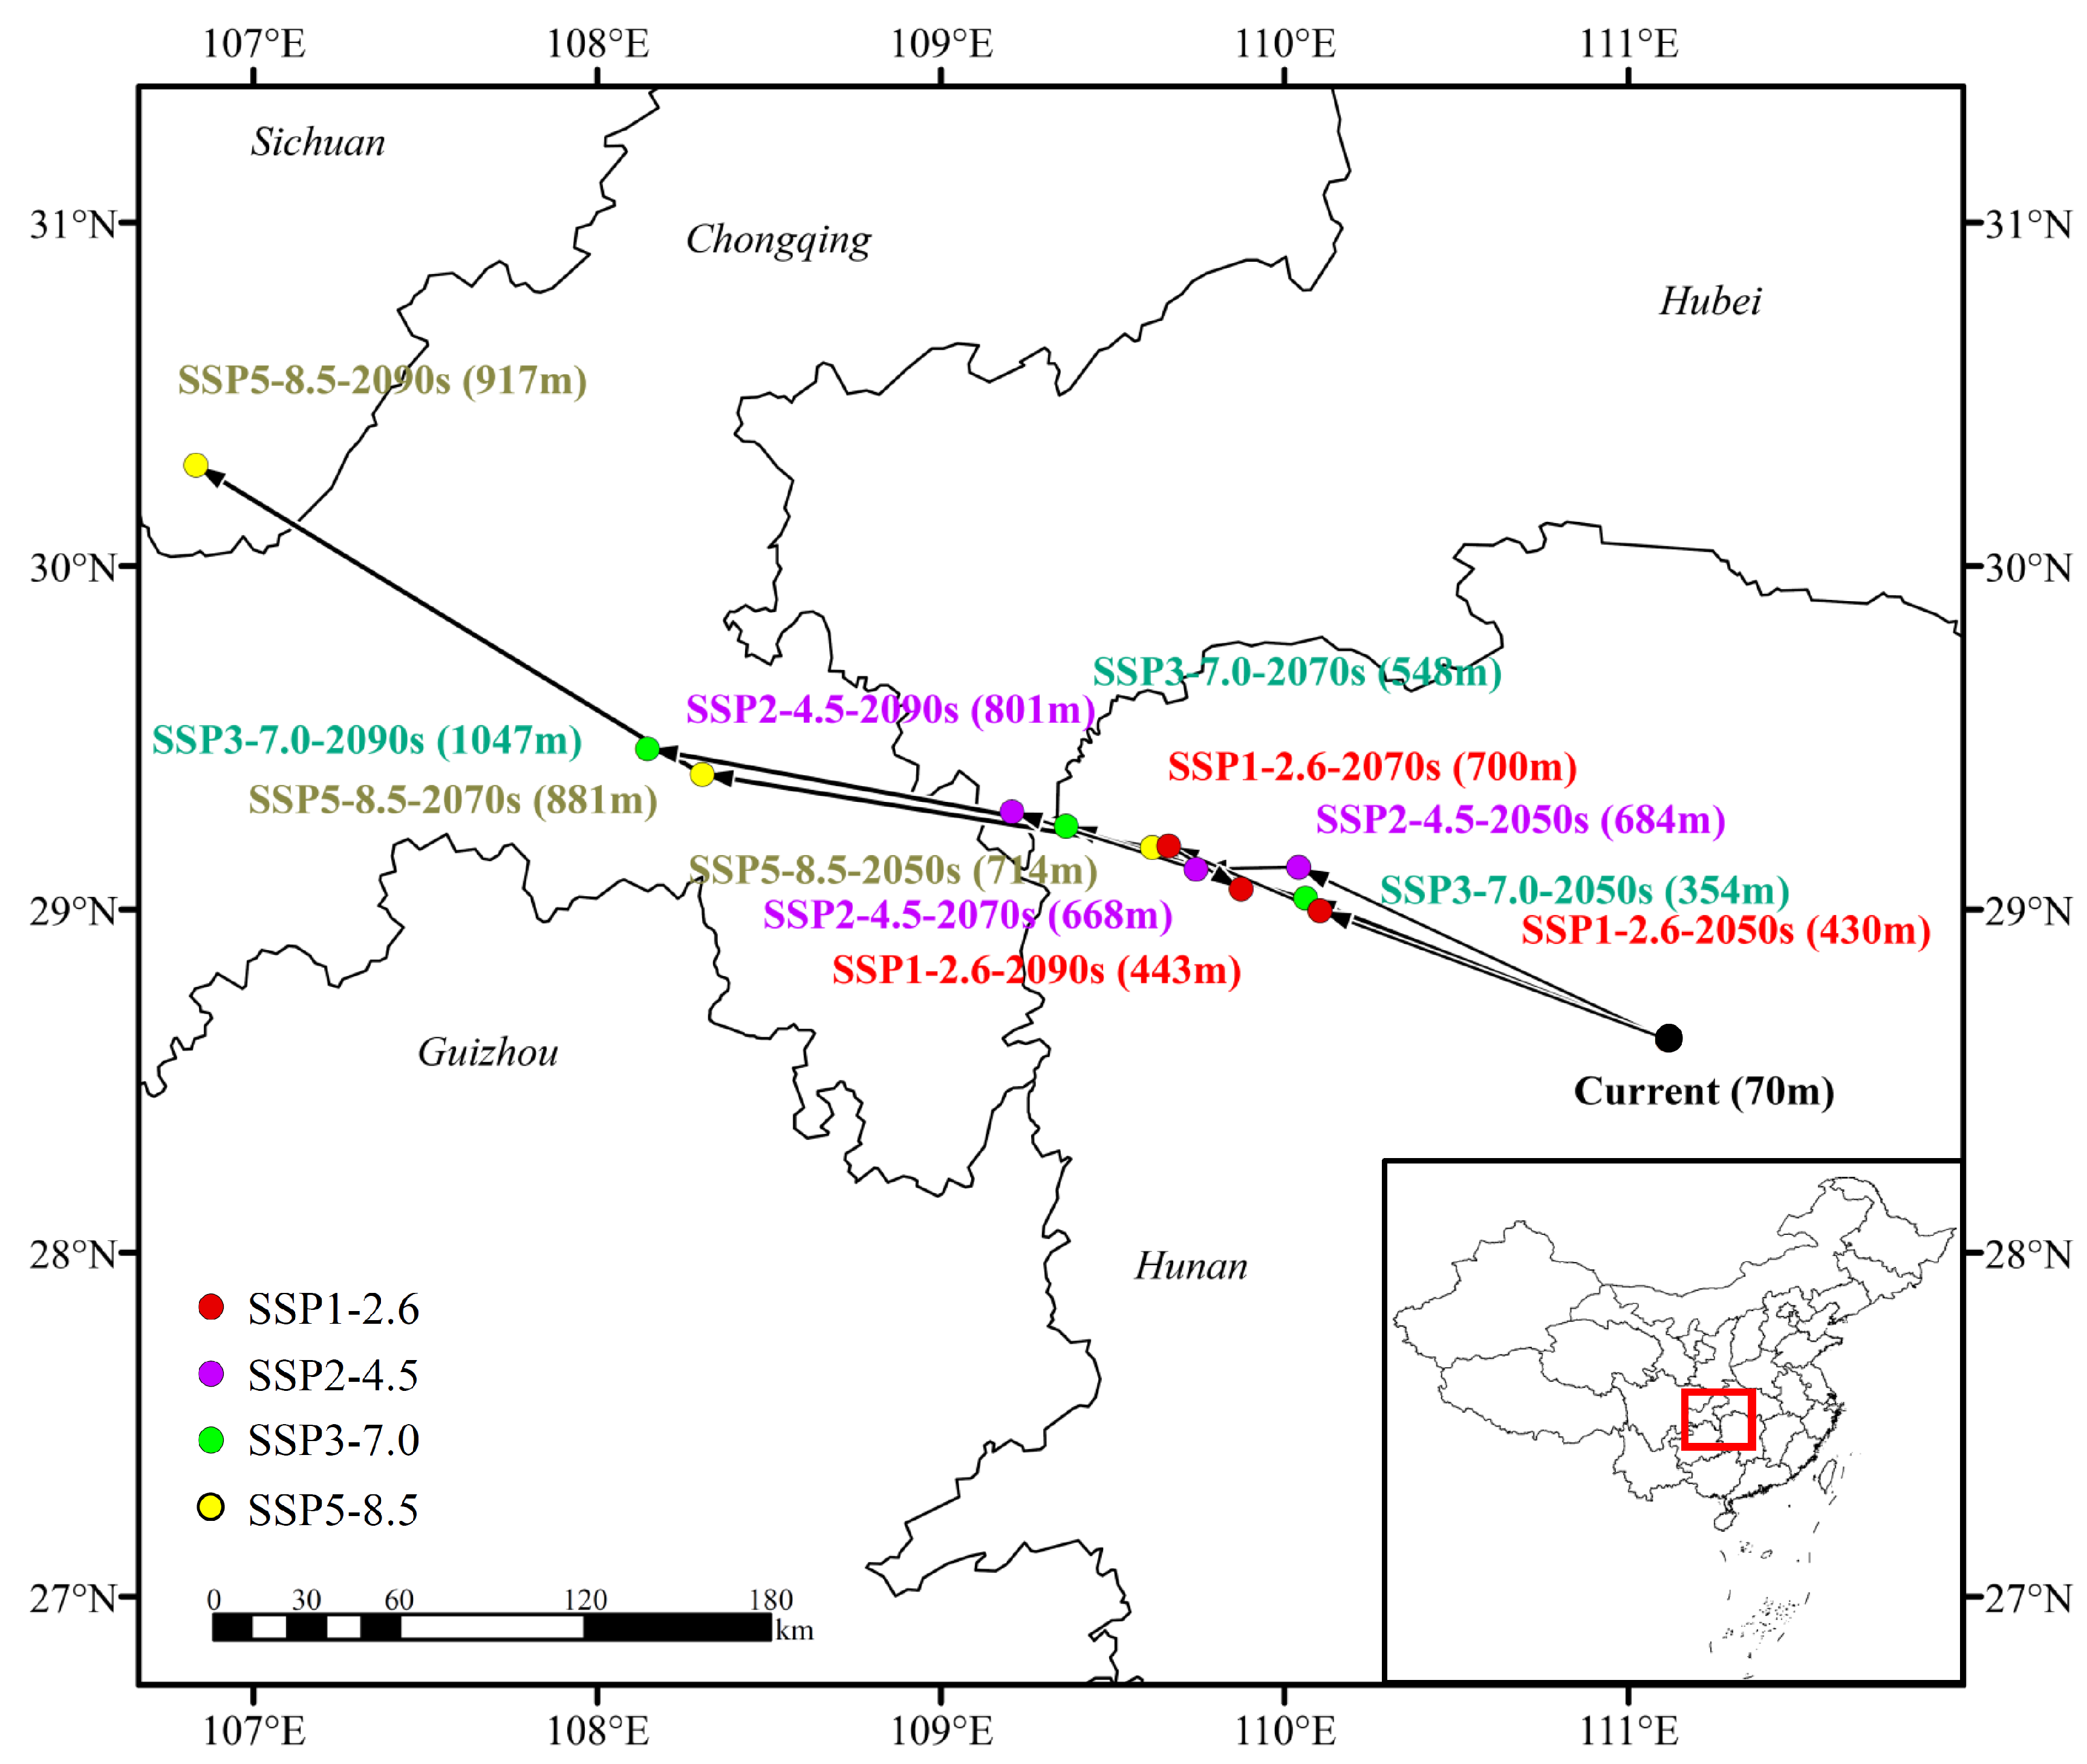
2.7. Core Distributional Shifts

Using the SDMtoolbox v2.4 toolkit as in ArcGIS v10.2 [51,52,53], we calculated the change trend of different regions for C. chinensis and compared the central points of different regions. We considered the suitable regions for C. chinensis as a whole and simplified them as a vector particle using the change of the centroid position to reflect their sizes and directions. Finally, the SDMtoolbox toolkit was utilized to track the centroid of C. chinensis to investigate its distribution for different time periods under various climatic conditions, to evaluate the migration distances and altitude changes for suitable C. chinensis regions, including longitude and latitude coordinates [50,54].

3. Results

3.1. Model Parameter Optimization and Accuracy Analysis

For this study, six environmental variables were ultimately selected and used to construct the prediction model. These included the mean diurnal range (max temp-min temp) (BIO02), temperature seasonality (BIO04), minimum temperature of the coldest month (BIO06), mean temperature of warmest quarter (BIO10), mean temperature of coldest quarter (BIO11), and precipitation of driest month (BIO14). The contribution percentages of these six variables for model construction were BIO06 (41.4%) > BIO02 (36.2%) > BIO11 (12.2%) > BIO04 (5.1%) > BIO14 (3.0%). (Table 1; Figures S1 and S2).
Based on the 136 distribution points and six bioclimatic variables for C. chinensis, MAXENT modeling was employed to predict the distribution of potentially suitable regions for C. chinensis in China. Following model optimization, the ideal FC and RM were LQ and 0.1, respectively. The mean values of the training AUC (AUCTRAIN) and test AUC (AUCTEST) for the model were 0.9755 ± 0.0012 and 0.9734 ± 0.0013, respectively. The absolute value of the difference between the training AUC and test AUC (|AUCDIFF|) was 0.0021, which indicated that the model had excellent prediction accuracy (Figure S3).
Based on the MTSPS threshold (0.1217), the spatial units were divided as follows: 0–0.1217 unsuitable; 0.1218–0.4138 low suitability; 0.4139–0.7069 moderate suitability; 0.7070–1 high suitability.

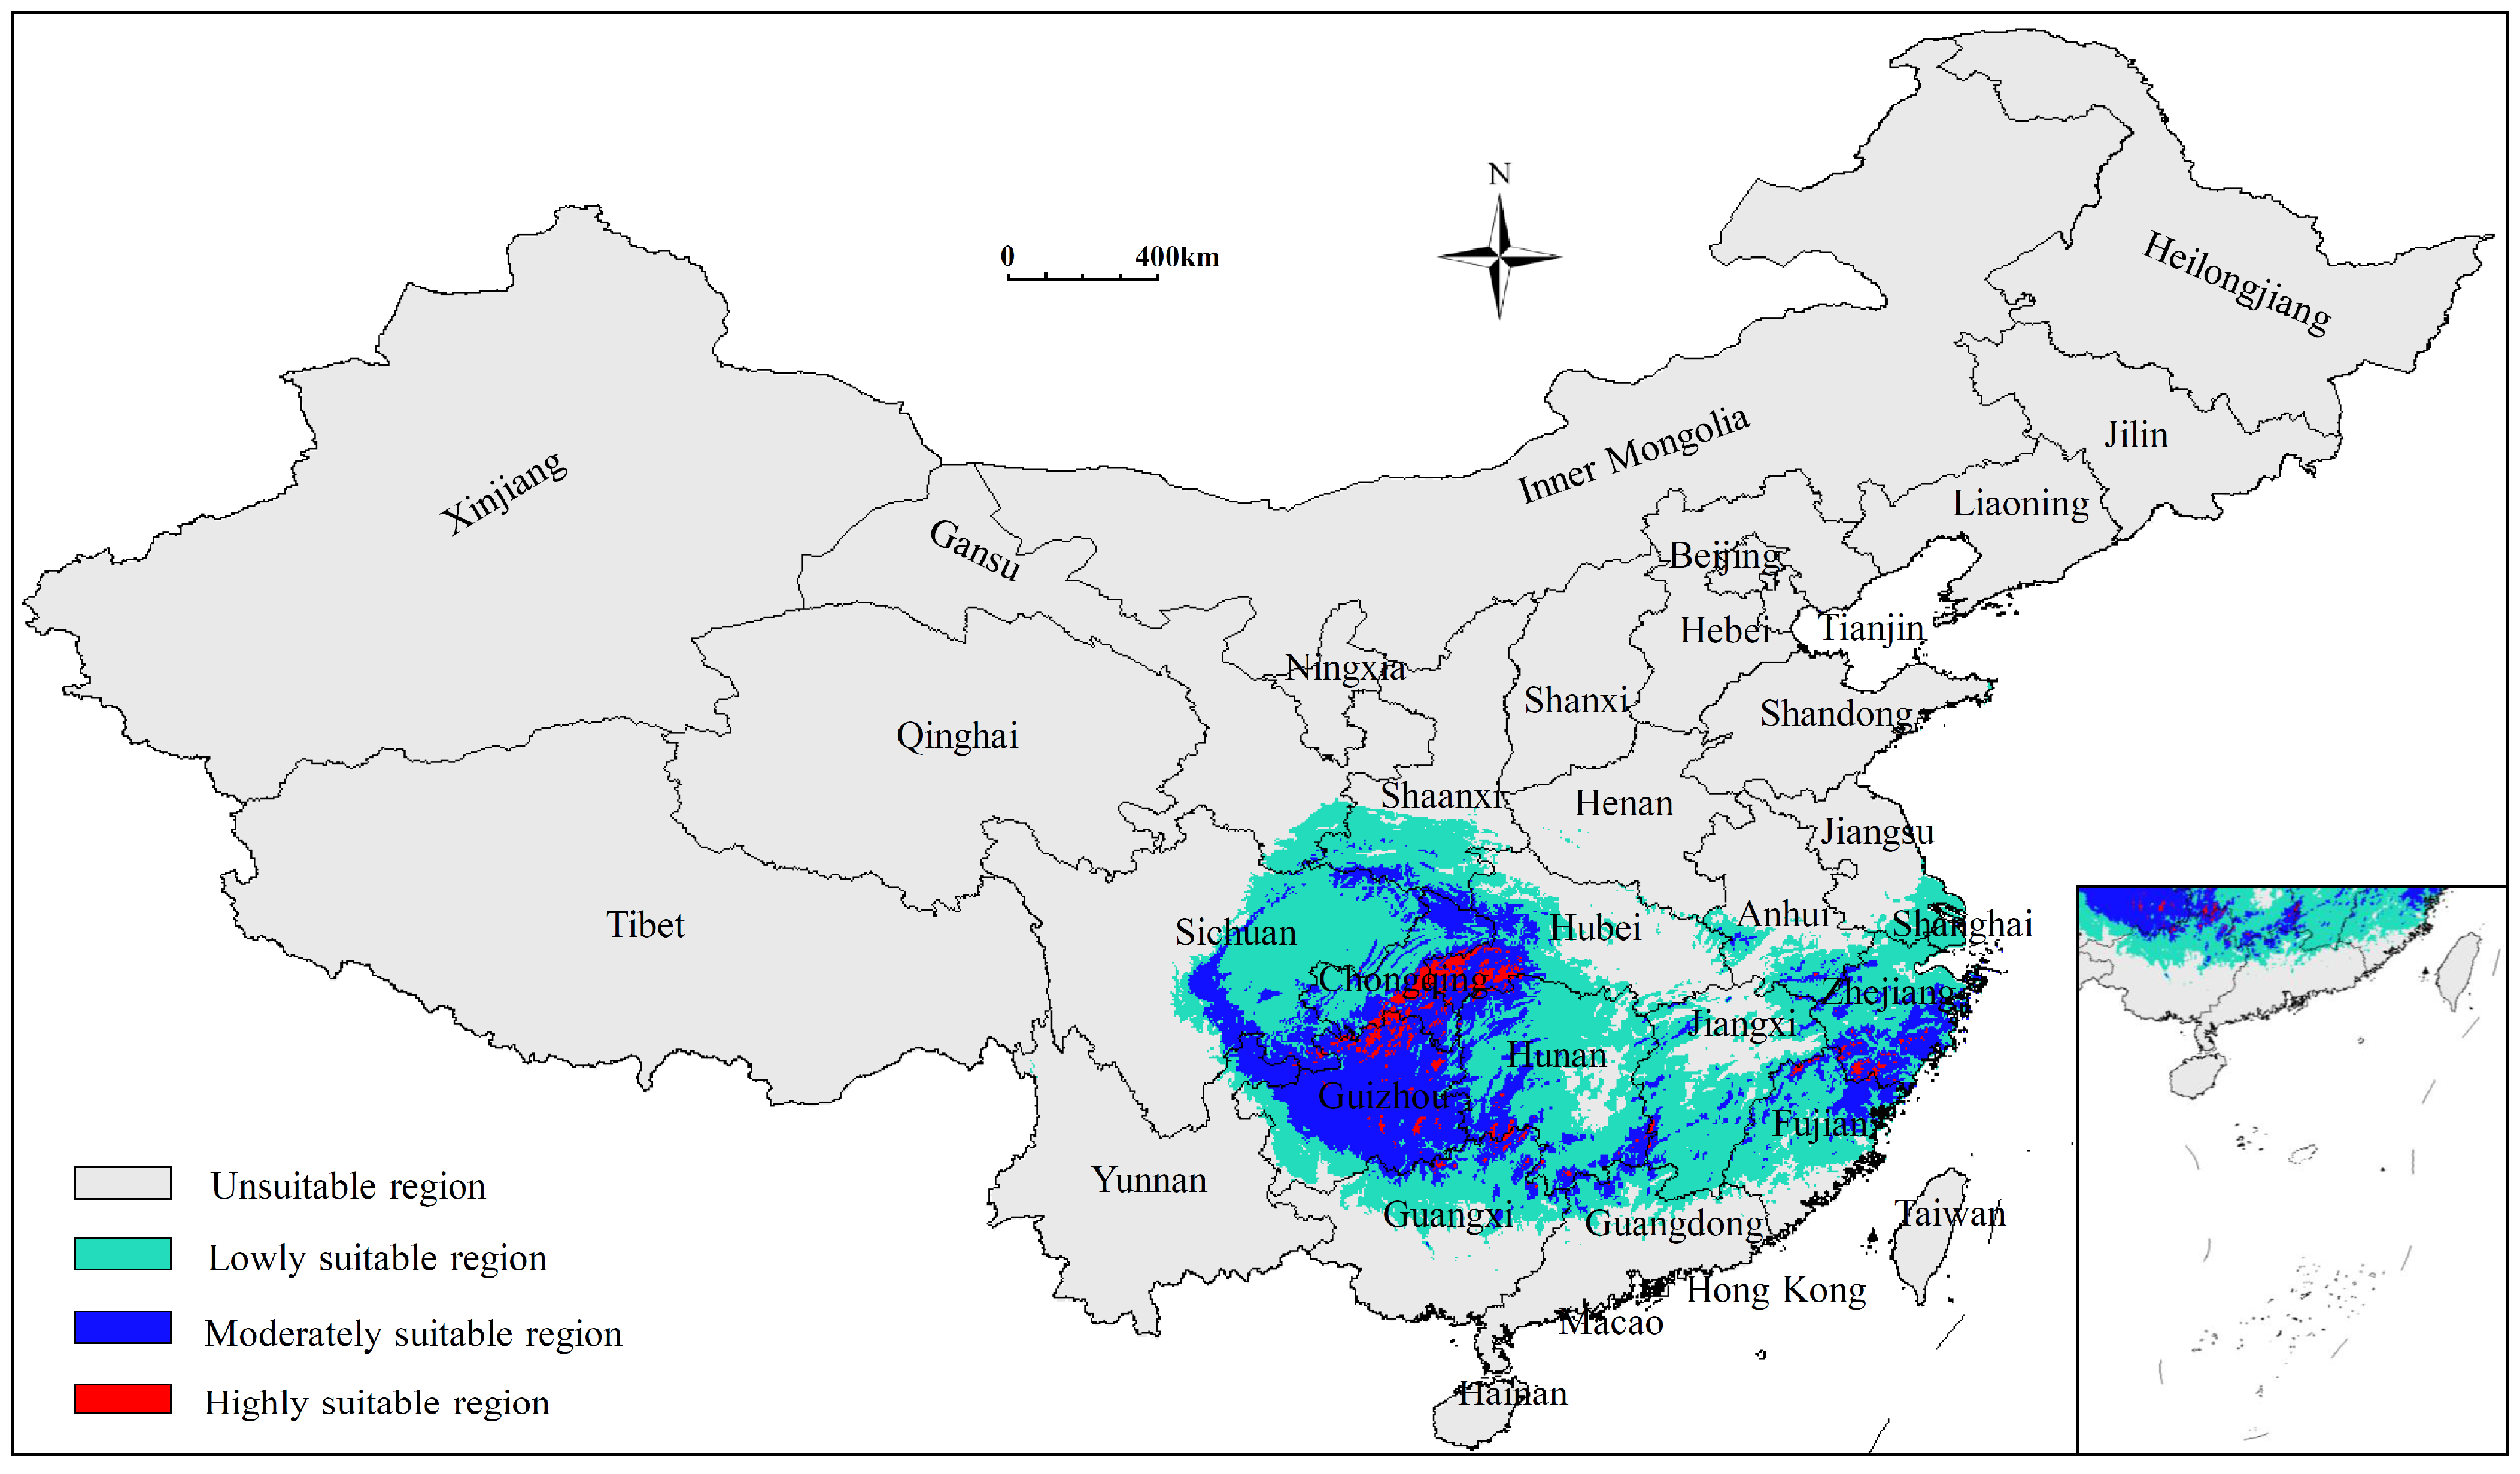
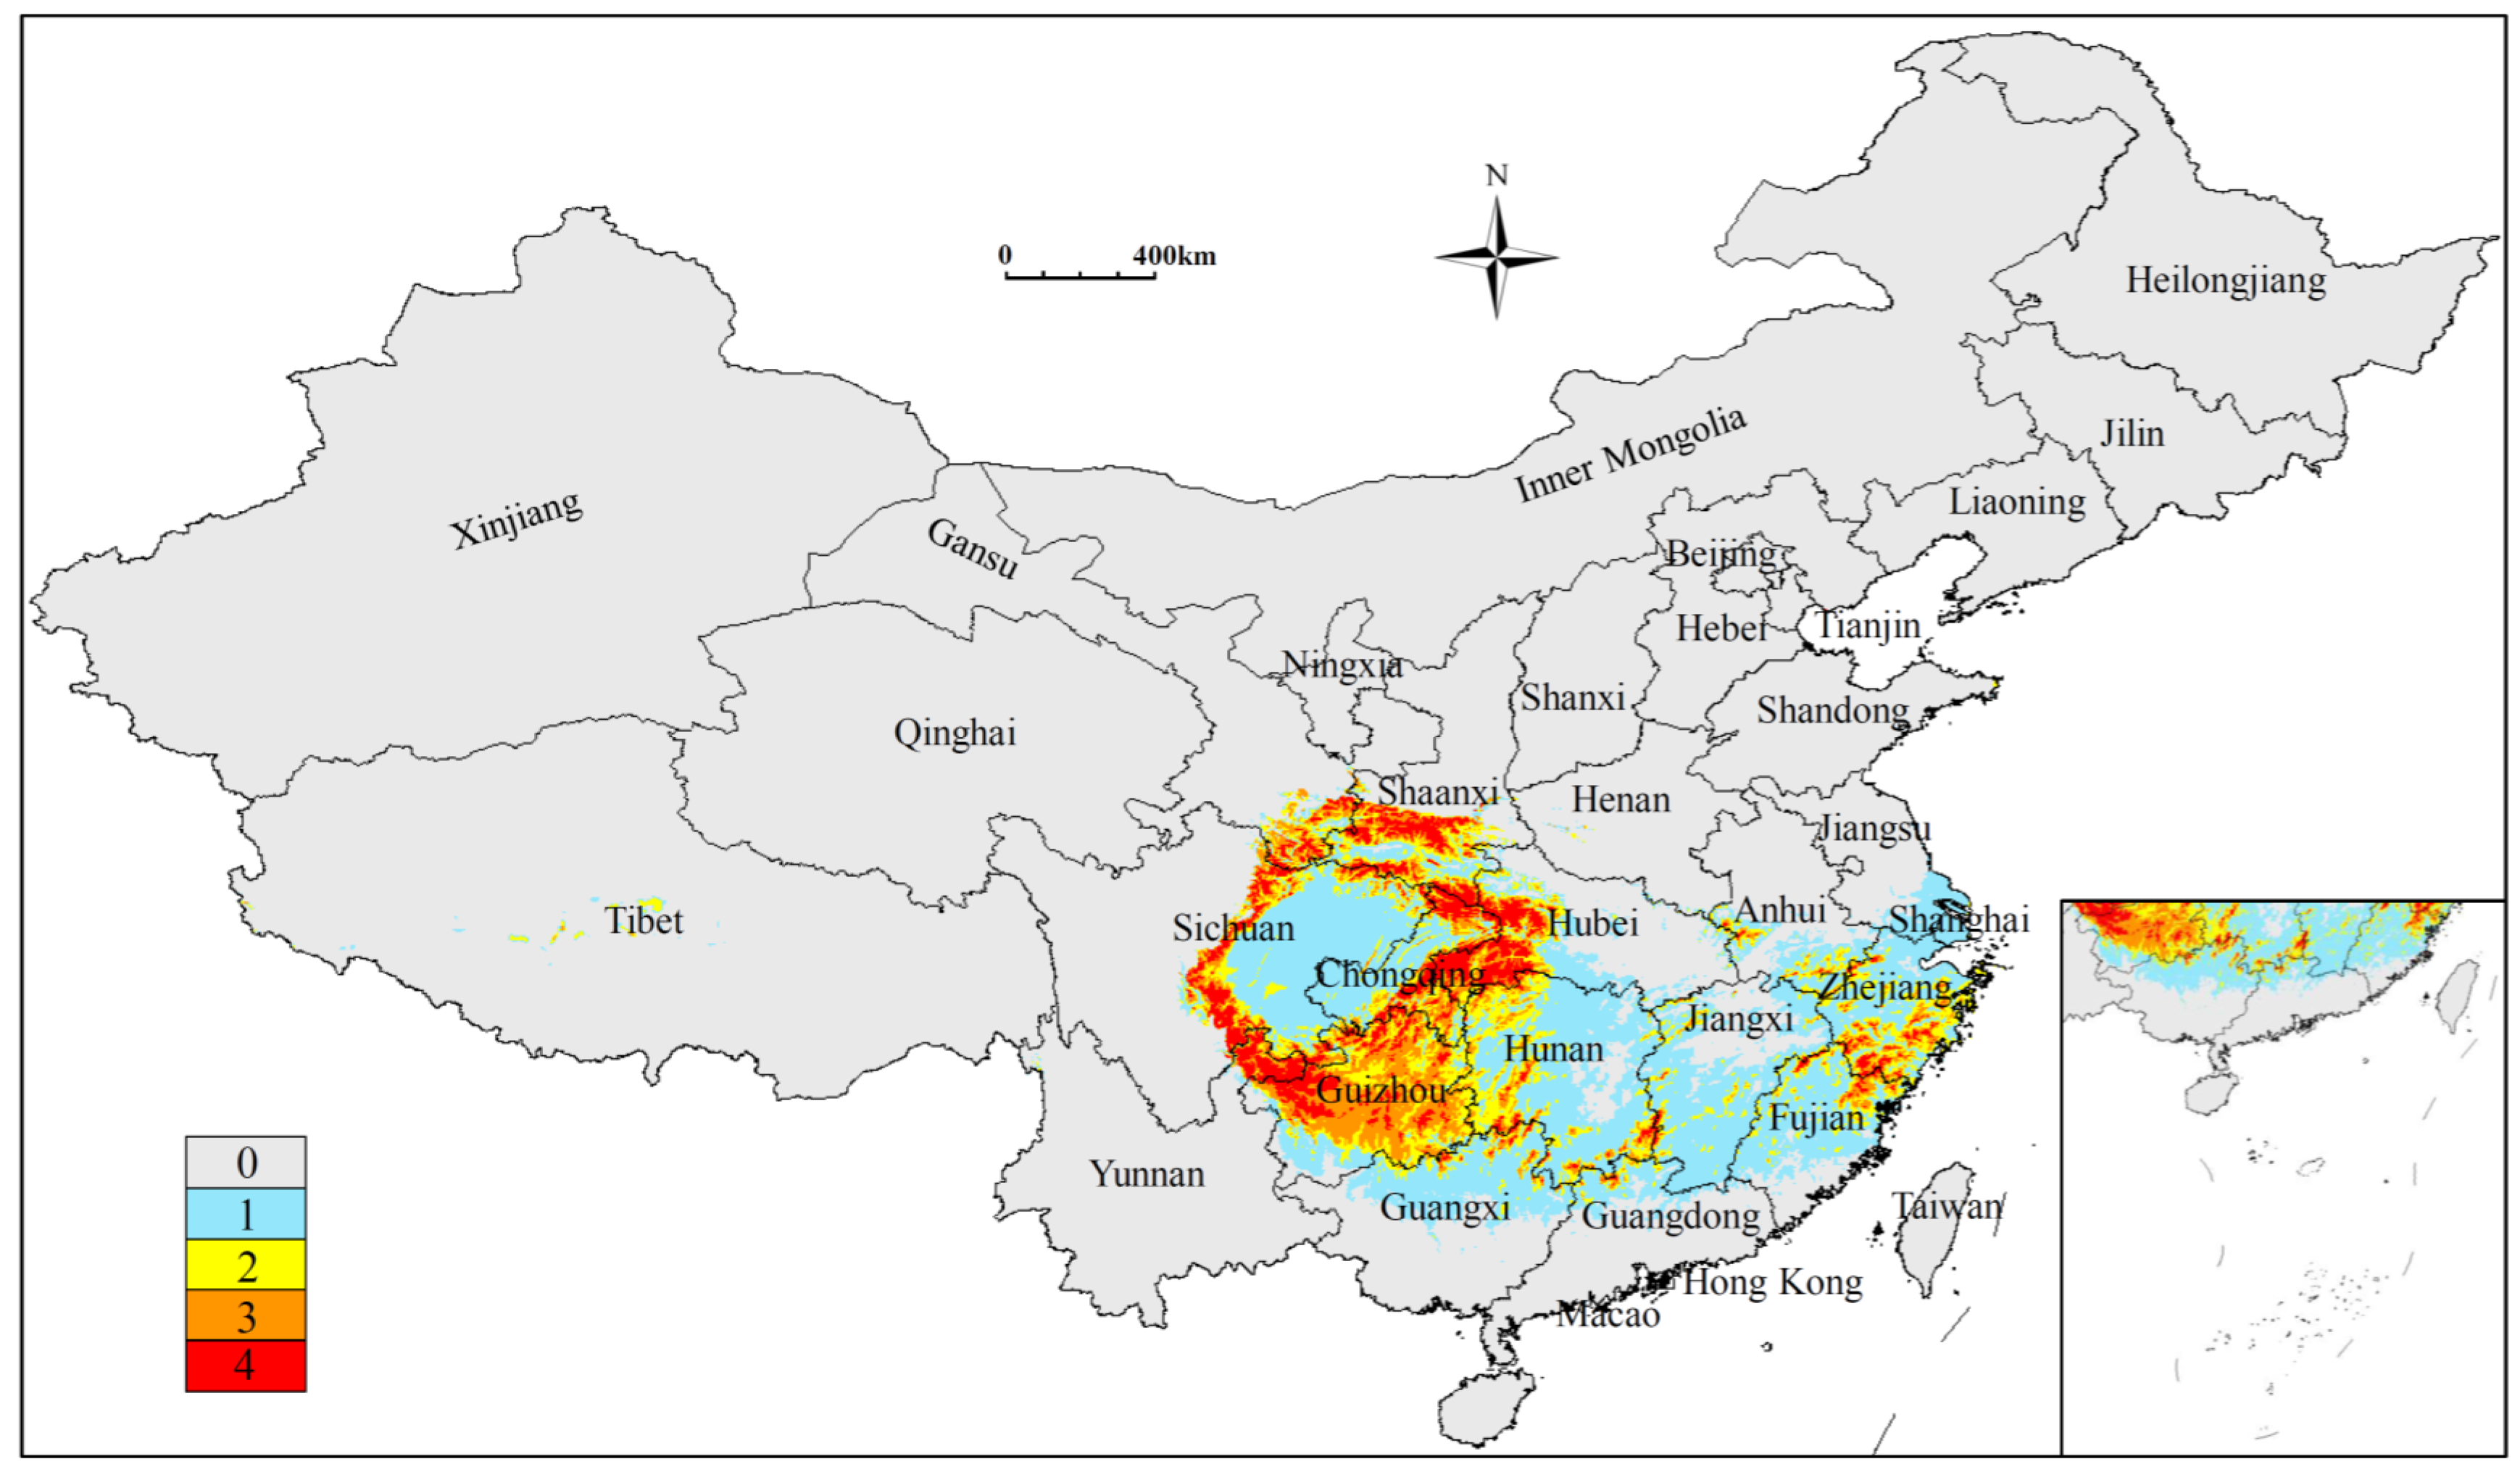
3.2. Current Potentially Suitable Region

The current potentially suitable regions of C. chinensis were predicted to be 120.47 × 10⁴ km2 in area, which were primarily distributed across Chongqing, Guizhou, Zhejiang, Sichuan, Hunan, Jiangxi, Fujian, Shanghai, and Guangxi Provinces (Figure 2). The high, moderate, and low suitability regions were 3.21 × 10⁴ km2, 37.16 × 10⁴ km2, and 80.10 × 10⁴ km2, respectively. The highly suitable regions are mainly distributed across Chongqing, northern Guizhou, southern Zhejiang, southwestern Hubei, and southern Hunan Provinces (Table 2).

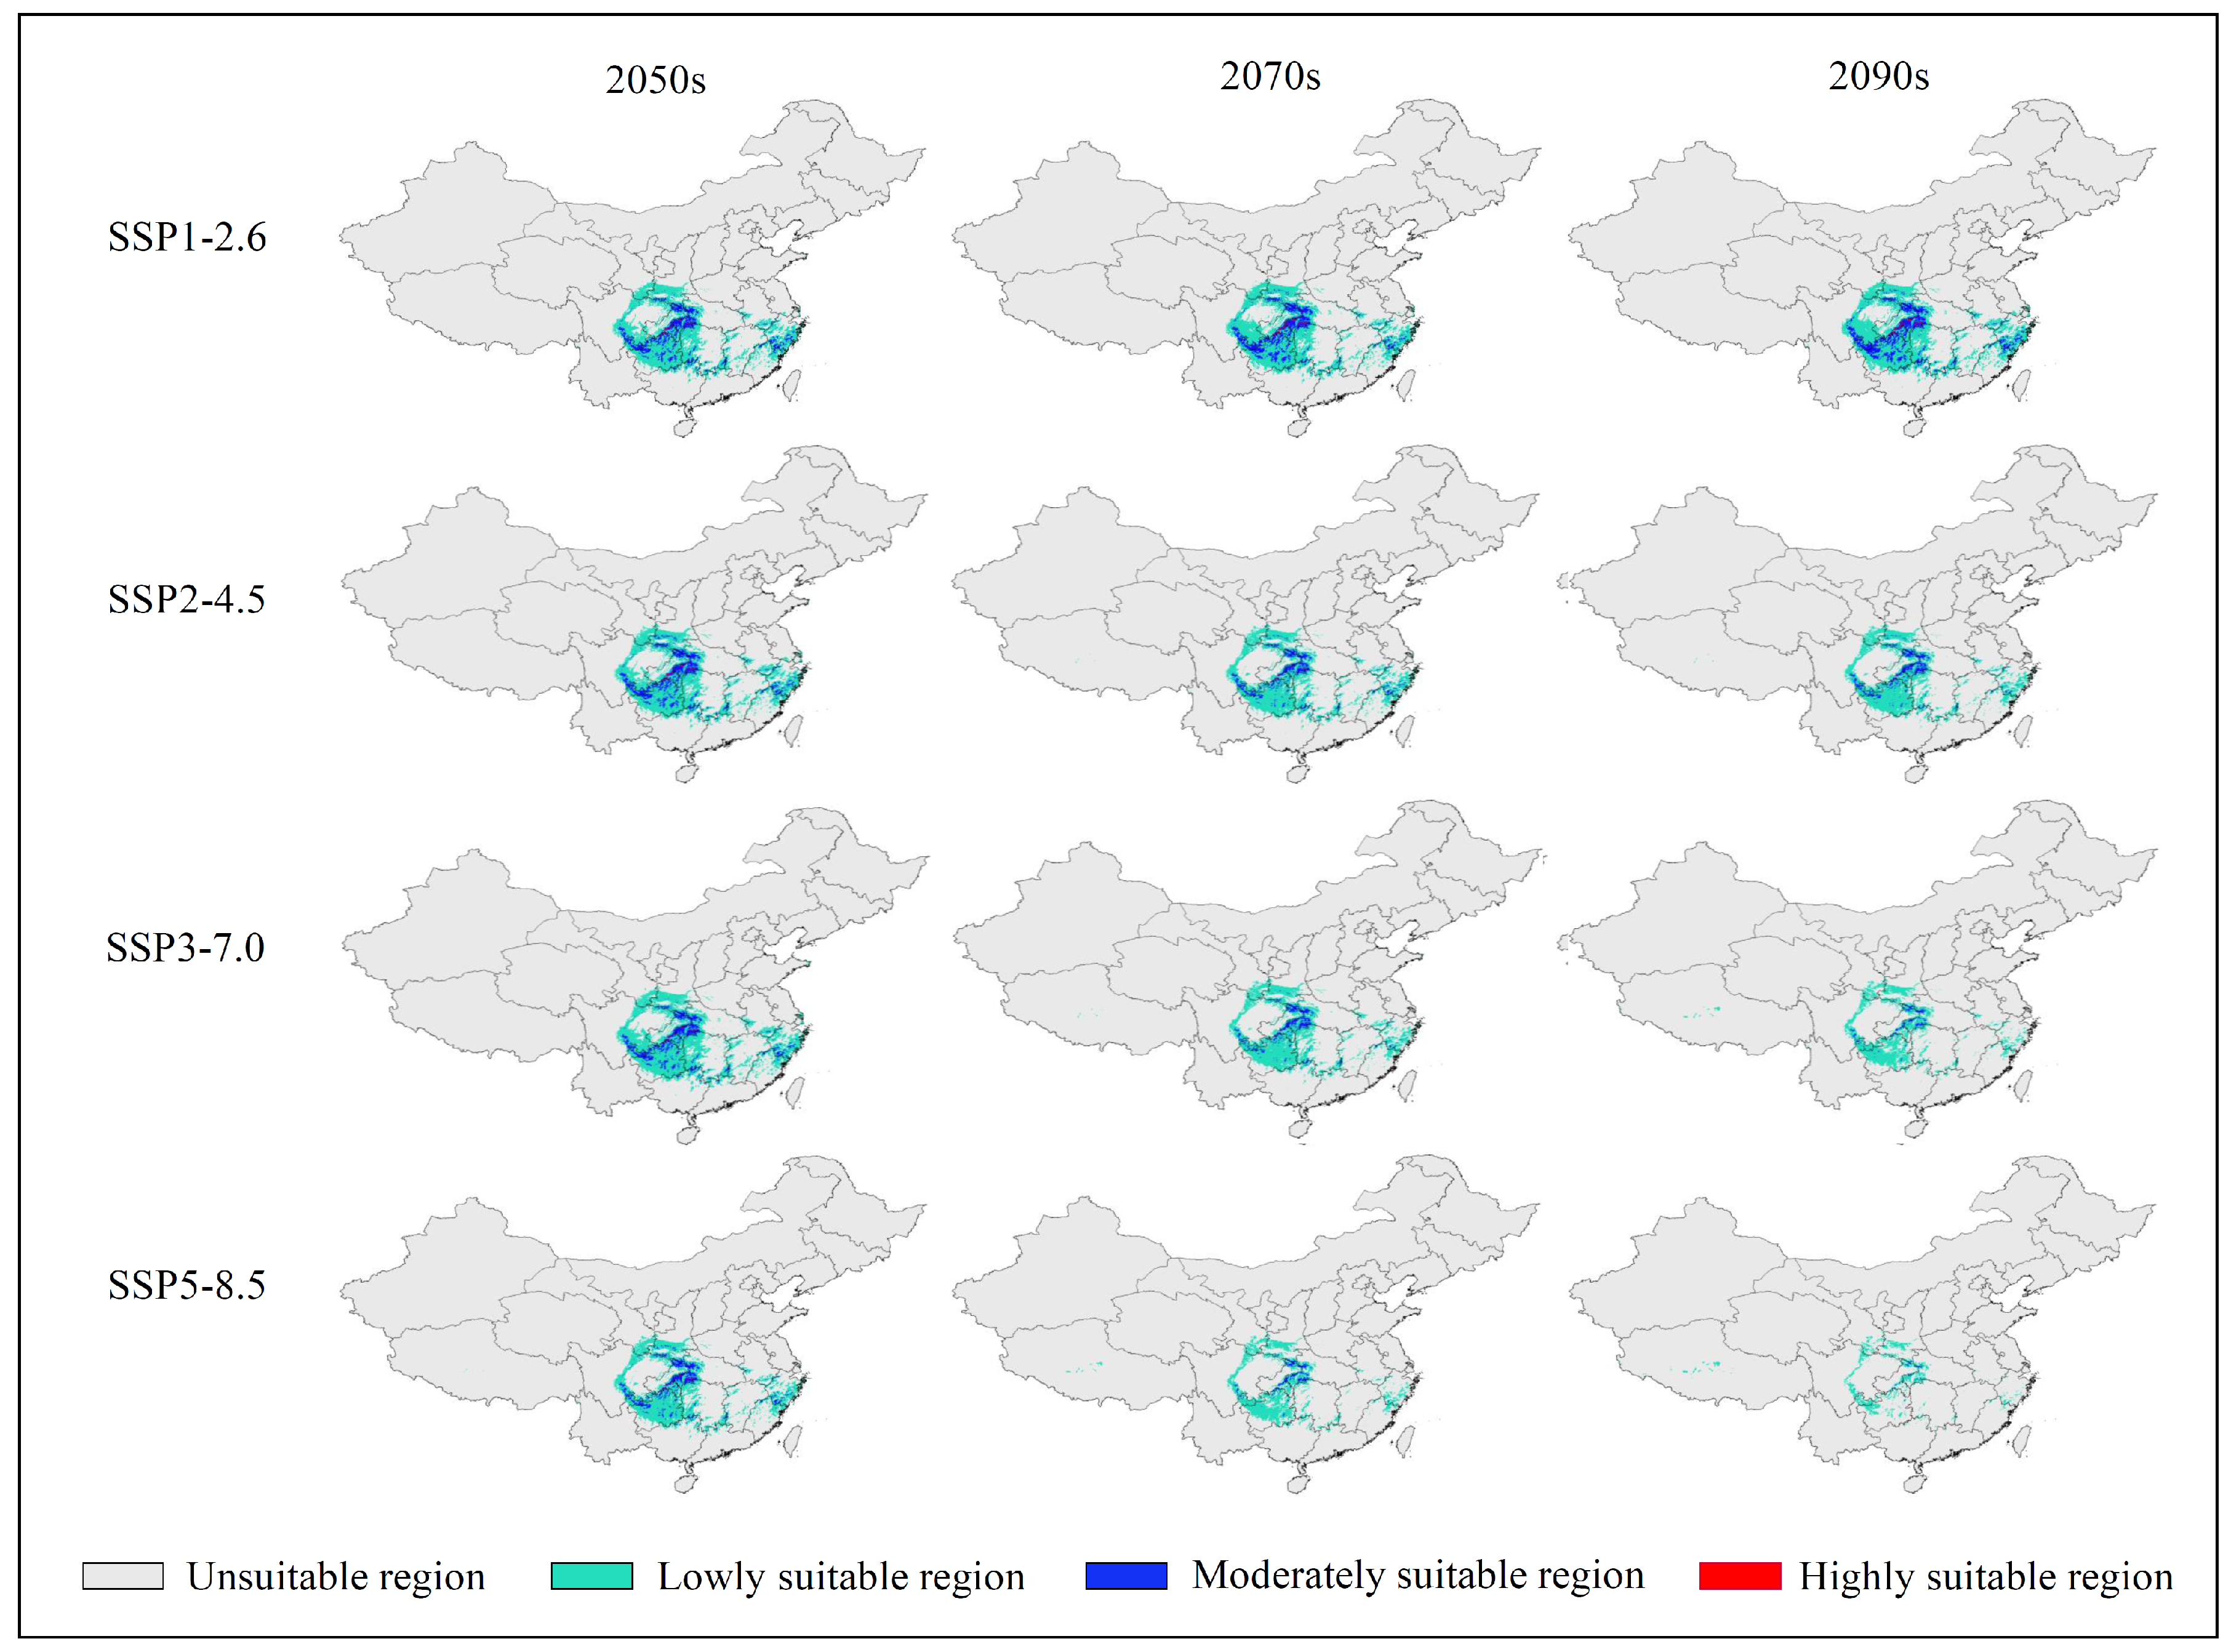
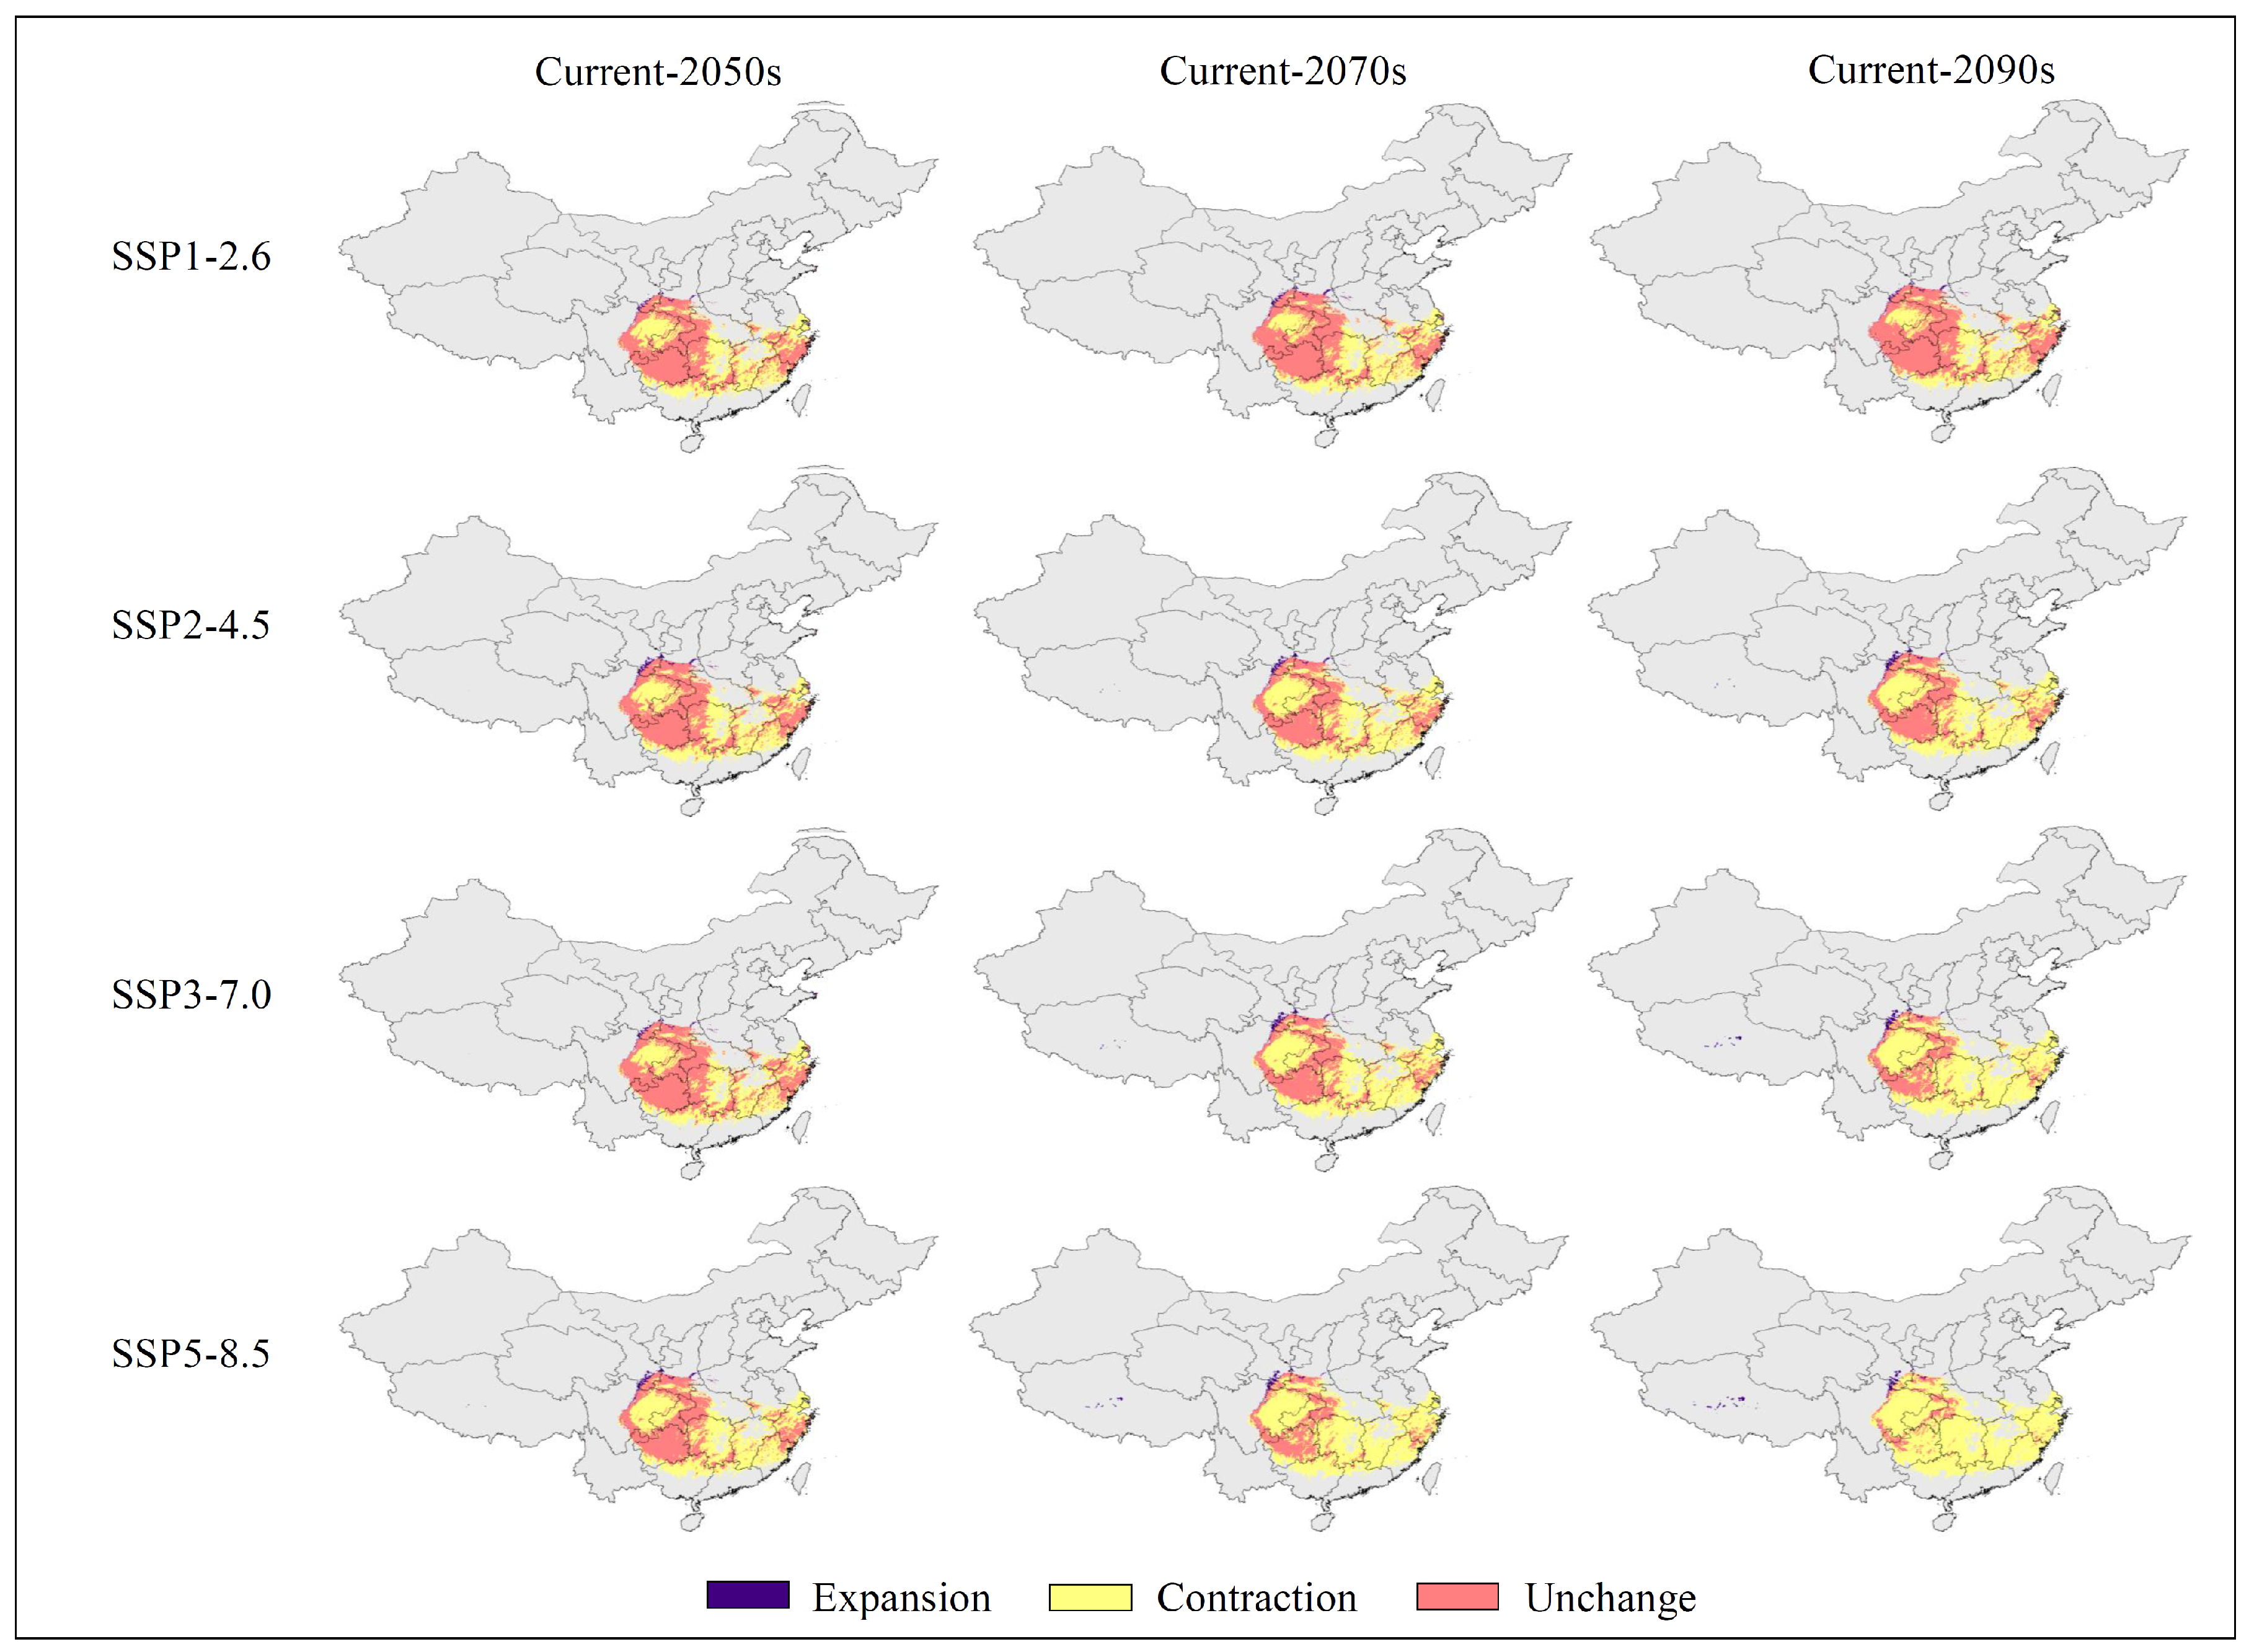
3.3. Future Potentially Suitable Regions

The potentially suitable regions of C. chinensis for the three future time periods were observed to diminish by varying degrees. With the exception of the 2050s under the increased severity of climate change (SSP1-2.6 → SSP5-8.5), the potentially suitable regions of C. chinensis gradually decreased (Figure 3, Figure 4 and Figure 5; Table 2).
Under the SSP1-2.6 scenario, the total area of potentially suitable regions for C. chinensis showed an initially shrinking, and then expanding trend which accounted for 56.99% (2050s), 57.81% (2070s) and 61.82% (2090s) of the areas of currently suitable regions. Spanning the 2050s to the 2090s, the central and western Hunan, Jiangxi, Northeastern Fujian, Eastern Sichuan, and Southeastern Jiangsu Provinces gradually changed from an original low suitability region to an unsuitable region for C. chinensis, whereas the low suitability region of southern Gansu Province expanded. The currently highly suitable regions exhibited significant contraction, which accounted for 9.51% (2050s), 14.00% (2070s), and 13.78% (2090s) of the current corresponding values, respectively. The highly suitable regions of southern Zhejiang, northern Guizhou, and Hunan Provinces gradually become moderate or low suitability regions.
Under the SSP2-4.5 scenario, the total area of the potentially suitable regions for C. chinensis gradually shrank over time. In the 2090s, the total potentially suitable region was only 49.08 × 10⁴ km2, which accounted for only 40.74% of the total currently suitable region. The moderately and highly suitable regions showed a significant shrinking trend, and the potentially highly suitable region of C. chinensis in the 2090s was only 0.07 × 10⁴ km2, which accounted for 2.27% of the current corresponding value. The original highly suitable habitat had low suitability or was even unsuitable, whereas the highly suitable region remained only in central Sichuan Province.
Under the SSP3-7.0 scenario, the total area of potentially suitable regions for C. chinensis for all three future time periods showed varying degrees of contraction, which accounted for 58.44% (2050s), 42.17% (2070s), and 27.83% (2090s) of the current corresponding values. The shrinking of the moderately and highly suitable regions was the most obvious, with the moderately suitable region in the 2090s of 1.73 × 10⁴ km2, which was 95.35% smaller than the current value, while the highly suitable region almost disappeared.
Under the SSP5-8.5 scenario, the potentially suitable region for C. chinensis showed a decreasing trend. The total suitable region (14.69 × 10⁴ km2) contracted most significantly for the 2090s, which accounted for only 12.19% of the current area. The moderately suitable region in the three future time periods was 7.38 × 10⁴ km2 (2050s), 2.12 × 10⁴ km2 (2070s) and 0.41 × 10⁴ km2 (2090s), which accounted for 19.86%, 5.69%, and 1.10% of the current corresponding areas, respectively. The currently highly suitable regions almost disappeared, with only 0.20 × 10⁴ km2 and 0.02 × 10⁴ km2 remaining in the 2050s and 2070s, respectively.

3.4. Low Impact Areas

Relatively low impact areas refer to those where species are less influenced by climate change; thus, predictions may also differ under different climate scenarios (Figure 6 and Figure S1, Table 3). With the increased severity of climate change (SSP1-2.6 → SSP5-8.5), the total of relatively low impact areas for C. chinensis was observed to decrease (64.22 × 10⁴ → 12.86 × 10⁴ km2), where their proportion of the total currently potentially suitable region was also reduced, from 53.31% to 10.67%. However, our analysis also revealed that regardless of climate scenarios, southeastern Sichuan, northeastern Yunnan, northwestern Guizhou, eastern Chongqing, and southwestern Hubei Provinces have always been suitably stable for the growth of C. chinensis. Furthermore, the classification of southeastern Gansu, southern Shaanxi, southern Hunan, central and southern Zhejiang, and northeastern Fujian Provinces (as relatively low impact areas) were also supported by the three climate scenarios (Figure 6).

3.5. Shift in the Distribution Center of the Suitable Region

Our model simulation revealed that under all climate scenarios except for SSP1-2.6, the center of the potentially suitable region for C. chinensis tended to shift to the northwest (Figure 7). Under the SSP5-8.5 scenario, the center of the potentially suitable region was transferred from Taoyuan County (Changde City, Hunan Province) to Longshan County (Xiangxi Autonomous Prefecture, Hunan Province; 2050s), Pengshui County (Chongqing Municipality; 2070s), and Linshui County (Guang’an City, Sichuan Province; 2090s). The migration distances were 157.65 km, 128.54 km, and 173.78 km, respectively. Under the SSP1-2.6 scenario, the center of the potentially suitable region shifted by 106.26 km (2050s) and 47.55 km (2070s) to the northwest, and 24.82 km (2090s) to the southeast over time. The center of the potentially suitable region shifted from Taoyuan County (1970–2000) to Yongshun County (Xiangxi Autonomous Prefecture, Hunan Province) (2090s).
From the analysis of altitude changes, the center of the potentially suitable region for C. chinensis shifted to high altitudes under all climate scenarios except for SSP1-2.6 (Figure 7). For example, under the SSP3-7.0 scenario, the elevation of the central point of the potentially suitable region gradually increased from 70 m (1970–2000) to 1047 m (2090s). However, under the SSP1-2.6 scenario, the elevation of the central point showed an initial increase, which then decreased over time. The elevation increased from 70 m to 430 m (2050s) and 700 m (2070s), respectively, and then decreased to 443 m (2090s).

4. Discussion

4.1. Effects of Climate Change on Species Distribution and Migration Trends

In response to global warming, some species may remain in place through physiological adaptations; however, others may migrate to higher latitudes or higher altitudes to escape warming [38,55,56]. Generally, with the passage of time, the potentially suitable regions for C. chinensis gradually shifted to the northwest (Figure 4 and Figure 7). For example, under the SSP1-2.6 scenario, the suitable regions in Jiangsu, Zhejiang and Fujian Provinces gradually decreased, while those in southern Gansu Province increased. Under the SSP5-8.5 scenario, by the 2090s, the potentially suitable region shifted to the northwest. With the intensification of the greenhouse effect, Jiangxi, Hubei, and Guangxi Provinces would become almost unsuitable for the growth of C. chinensis, whereas a new potentially suitable region would appear in southeastern Gansu Province.
Using unoptimized maximum entropy models, Li et al. [57] predicted suitable areas for three Coptis herbs under the background of climate change, and showed that the total suitable area of C. chinensis would shrink in the 2070s as compared to the current area under RCP8.5. Our study confirmed this trend. Besides, we also predicted the distribution of suitable areas of C. chinensis in the 2050s and 2090s and the displacement of the central point in different periods. A similar distribution pattern of suitable area was predicted for the 2050s and the 2070s, suggesting that the predicted change of C. chinensis in the 2070s would already be visible in the 2050s. This finding corroborates a previous study of Robinia pseudoacacia L. in Europe [58], and means it would take about 20 fewer years to develop reasonable measures to mitigate the effects of climate change.
During our field surveys, we observed that C. chinensis usually occurs as small populations in narrow and fragmented habitats, has an extremely narrow ecological niche, and is basically confined to the steep slope under humid evergreen broad-leaved forests. Soil and microclimatic factors play important roles in its natural distribution. Under climate change scenarios, with the increase in global temperature and rainfall caused by the greenhouse effect, the suitable area of C. chinensis may be further reduced. C. chinensis reproduces both sexually and asexually [28]. However, under natural conditions, the prevalence of asexual reproduction of C. chinensis via developed underground vegetative propagule would further increase the difficulty of natural migration from the perspective of species migration [59]. Over time, the distribution of C. chinensis in southeastern Provinces of China would gradually decrease, while new suitable areas may emerge in southern Gansu Province. However, considering its ecological requirement and reproductive mode, C. chinensis would possibly be unable to cross the north of the Qinling Mountains and the west of the Guanshan Mountain under natural conditions.

4.2. Effects of Environmental Variables on Species Distribution

Temperature and precipitation are two main environmental factors that influence plant distribution, as exemplified by the cold tolerance, growing seasonal temperatures, and the availability of water for alpine vegetation [4,60,61,62]. The main bioclimatic factors that affected the potential distribution of C. chinensis were the lowest temperature during the coldest month (BIO06), the monthly mean temperature difference between day and night (BIO02), and the mean temperature during the coldest quarter (BIO11) (Figures S1 and S2; Table 1).
The minimum temperature during the coldest month which was suitable for the growth of C. chinensis was −7.2–6.5 °C, which was likely because lower temperatures in January would not be conducive to its growth. The suitable temperature difference between day and night ranged from 4.3–9.2 °C, which indicated that the growth of C. chinensis was moderately sensitive to daily temperature changes. The coldest seasonal temperature suitable for the growth of C. chinensis ranged from −1.2–11.6 °C, where lower temperatures may affect its vernalization [24]. This corroborated the findings of our field investigation: As a shade plant, C. chinensis favors shady environments, is cold-resistant, often appears in sandy loam, and has strict temperature requirements [25,27].

4.3. Protection of Genetic Resources

C. chinensis typically grows in sandy loam with a deep soil layer in loose and fertile soil, which is rich in humus. It has a certain cold resistance and is suitable for planting in the mountainous regions of southern China [24]. Normally, plant habitats on mountains are surrounded by forests, which leads to their isolation and fragmentation, while constraining the migration of pollen and fruit, thereby preventing long-range transmission [4,63,64]. Thus, it is urgent to formulate effective protection strategies and long-term protection actions for C. chinensis. According to our prediction model (Figure 6 and Figure S4), C. chinensis might be less impacted by climate change in southeastern Sichuan, northeastern Yunnan, northwestern Guizhou, eastern Chongqing, and southwestern Hubei Provinces; thus, these regions may be suitable for planting.
As a medicinal herb, C. chinensis has a long history of exploitation in traditional Chinese medicine for clearing heat and drying dampness, as well as discharging fire and detoxification [28,30,31,65,66,67]. The prediction model revealed that the potentially highly suitable regions were mainly distributed across Chongqing, Northern Guizhou, Southern Zhejiang, Southwestern Hubei, and the junction of Hunan, Guangdong, and Guangxi Provinces. Previous studies have indicated that Shizhu County in Chongqing Municipality and Lichuan City in Hubei Province are typically considered as the traditional producing areas of C. chinensis [24]. However, the quality of C. chinensis habitats in these regions may be affected by future climate change [68,69]. Therefore, the investigation, collection, and sorting of high-quality germplasm, and the establishment of a core germplasm resources database may play key roles for the protection of C. chinensis genetic resources under intensifying global warming.

4.4. Rationality and Prediction Model Defects

The use of the MAXENT model to predict the potential distribution of species in suitable habitats has become common in the disciplines of global change biology and biogeography [70,71,72]. However, previous studies often ignored optimization, or involved only the insufficient optimization of model parameters, which can affect the accuracy of prediction models [36,40,57]. Earlier studies have indicated that the quality control of species occurrence points, the selection of bioclimatic factors, atmospheric circulation models, and shared socioeconomic pathways, the classification of suitable regions, the optimization of regularization multipliers, and feature classes may all have significant impacts on the predictive results of models. For this study, these parameters were systematically and comprehensively optimized, such that the scientific accuracy of the prediction results could be guaranteed to the maximum extent [1,3,38,73].
It was assumed that under the background of climate change, C. chinensis had sufficient dispersal capacities to migrate to any climatically suitable region. Factors such as species migration rate and geographical and ecological isolation were not reflected in the modeling analysis. Obviously, all these factors may influence the prediction results to some extent to be different from the actual distribution pattern. Another limitation is that we only considered the impacts of bioclimatic variables on species distribution. In practice, however, species distribution is also affected by biotic factors (e.g., competition, predation, and disease) and abiotic factors (e.g., soil, topography, and anthropogenic activities). If we comprehensively consider the influence of multiple factors, we need to simulate a more comprehensive niche model, which constitutes one of the most important directions for future model development.

5. Conclusions

For this study, an optimized maximum entropy model was employed to predict the distribution patterns and changes in potentially suitable regions for the growth of C. chinensis in China under multiple climate scenarios (SSP1-2.6, SSP2-4.5, SSP3-7.0 and SSP5-8.5) across multiple time periods (1970–2000, 2050s, 2070s and 2090s). The predicted suitable area of C. chinensis would be reduced to varying degrees in the future. Except for SSP1-2.6, the potentially suitable area of C. chinensis shifted to the northwest and high-altitude areas, and the southeast of Gansu Province would become suitable for the growth of C. chinensis. Considering the distribution of C. chinensis in different periods and under different climate scenarios, the relatively stable suitable areas of C. chinensis were mainly distributed in Yunnan, Guizhou, Hubei and Chongqing, and these regions should be given priority when establishing conservation sites for C. chinensis. In addition, the shift trend of potentially suitable areas of C. chinensis in the 2070s could already be visible in the 2050s. Therefore, early implementation of reasonable in situ or ex situ conservation measures for C. chinensis could reduce the impact of climate change by about 20 years. Our findings would provide a theoretical basis for the protection of genetic resources and artificial planting promotion of this valuable medicinal herb.

Supplementary Materials

The following are available online at https://www.mdpi.com/article/10.3390/f12111464/s1, Figure S1: Jackknife test of the importance of variables. Blue, green, and red bars represent running the MaxEnt model with the variable alone, without the variable, and with all variables, respectively. (A): regularization training gain; (B): test gain; (C): AUC, Figure S2: Response curves of six environmental predictors used in the ecological niche model for Coptis chinensis, Figure S3: Prediction validation with receiver operator characteristic (ROC) curves using the MaxEnt model. AUC: the area under curve, Figure S4: Low impact area of Coptis chinensis under four shared socio-economic pathways (SSP1-2.6, SSP2-4.5, SSP3-7.0 and SSP5-8.5), Table S1: The rarefying data points (136) of Coptis chinensis in China.

Author Contributions

Conceptualization, Q.Z.; Data curation, W.-N.L.; Formal analysis, Y.Z.; Funding acquisition, Z.-Z.W. and J.-F.N.; Investigation. J.-B.Z.; Methodology, Q.Z.; Project administration, J.-F.N.; Resources, B.-W.H.; Software, Q.Z.; Supervision, S.-Q.W.; Validation, W.-N.L.; Visualization, Y.Z.; Writing—original draft, Q.Z.; Writing—review and editing, Z.-Z.W. All authors have read and agreed to the published version of the manuscript.

Funding

This work was supported by the National Natural Science Foundation of China [grant numbers 82104323 and 32170378]; National Key Technologies R & D Program for Modernization of Traditional Chinese Medicine [grant numbers 2017YFC1701300 and 2017YFC1700706]; Xi’an Science and Technology Project (20NYYF0057); Fundamental Research Funds for the Central Universities [grant numbers GK202103065 and GK201806006]; Shaanxi Provincial Key R & D Program (2021SF-383, 2020LSFP2-21 and 2018FP2-26); Research Project on Postgraduate Education and Teaching Reform of Shaanxi Normal University (GERP-20-41); and Youth Innovation Team Construction Scientific Research Project of Shaanxi Education Department (21JP027).

Institutional Review Board Statement

Not applicable.

Informed Consent Statement

Not applicable.

Data Availability Statement

The bioclimatic variables are available from the WorldClim-Global Climate Database (http://worldclim.org/ (accessed on 13 September 2021)).

Conflicts of Interest

The authors declare no competing interests.

References

  1. Yang, Z.; Bai, Y.; Alatalo, J.M.; Huang, Z.; Yang, F.; Pu, X.; Wang, R.; Yang, W.; Guo, X. Spatio-temporal variation in potential habitats for rare and endangered plants and habitat conservation based on the maximum entropy model. Sci. Total Environ. 2021, 784, 147080. [Google Scholar] [CrossRef] [PubMed]
  2. Ye, X.-Z.; Zhao, G.-H.; Zhang, M.-Z.; Cui, X.-Y.; Fan, H.-H.; Liu, B. Distribution pattern of endangered plant Semiliquidambar cathayensis (Hamamelidaceae) in response to climate change after the last interglacial period. Forests 2020, 11, 434. [Google Scholar] [CrossRef]
  3. Qin, A.; Liu, B.; Guo, Q.; Bussmann, R.W.; Ma, F.; Jian, Z.; Xu, G.; Pei, S. Maxent modeling for predicting impacts of climate change on the potential distribution of Thuja sutchuenensis Franch., an extremely endangered conifer from southwestern China. Glob. Ecol. Conserv. 2017, 10, 139–146. [Google Scholar] [CrossRef]
  4. Wu, Y.-M.; Shen, X.-L.; Tong, L.; Lei, F.-W.; Mu, X.-Y.; Zhang, Z.-X. Impact of past and future climate change on the potential distribution of an endangered montane shrub Lonicera oblata and its conservation implications. Forests 2021, 12, 125. [Google Scholar] [CrossRef]
  5. Hu, J.; Jiang, Z. Predicting the potential distribution of the endangered Przewalski’s gazelle. J. Zool. 2010, 282, 54–63. [Google Scholar] [CrossRef]
  6. Xu, W.; Sun, H.; Jin, J.; Cheng, J. Predicting the potential distribution of apple canker pathogen (Valsa mali) in China under climate change. Forests 2020, 11, 1126. [Google Scholar] [CrossRef]
  7. Feng, L.; Sun, J.; Shi, Y.; Wang, G.; Wang, T. Predicting suitable habitats of Camptotheca acuminata considering both climatic and soil variables. Forests 2020, 11, 891. [Google Scholar] [CrossRef]
  8. Santos-Hernández, A.F.; Monterroso-Rivas, A.I.; Granados-Sánchez, D.; Villanueva-Morales, A.; Santacruz-Carrillo, M. Projections for Mexico’s tropical rainforests considering ecological niche and climate change. Forests 2021, 12, 119. [Google Scholar] [CrossRef]
  9. Zhang, K.; Sun, L.; Tao, J. Impact of climate change on the distribution of Euscaphis japonica (Staphyleaceae) trees. Forests 2020, 11, 525. [Google Scholar] [CrossRef]
  10. Xu, D.; Zhuo, Z.; Wang, R.; Ye, M.; Pu, B. Modeling the distribution of Zanthoxylum armatum in China with MaxEnt modeling. Glob. Ecol. Conserv. 2019, 19, e00691. [Google Scholar] [CrossRef]
  11. Wei, J.; Li, X.; Lu, Y.; Zhao, L.; Zhang, H.; Zhao, Q. Modeling the potential global distribution of Phenacoccus madeirensis Green under various climate change scenarios. Forests 2019, 10, 773. [Google Scholar] [CrossRef] [Green Version]
  12. Solhjouy-Fard, S.; Sarafrazi, A.; Moeini, M.M.; Ahadiyat, A. Predicting habitat distribution of five heteropteran pest species in Iran. J. Insect Sci. 2013, 13, 116. [Google Scholar] [CrossRef] [Green Version]
  13. Peterman, W.E.; Crawford, J.A.; Kuhns, A.R. Using species distribution and occupancy modeling to guide survey efforts and assess species status. J. Nat. Conserv. 2013, 21, 114–121. [Google Scholar] [CrossRef]
  14. Guisan, A.; Thuiller, W. Predicting species distribution: Offering more than simple habitat models. Ecol. Lett. 2005, 8, 993–1009. [Google Scholar] [CrossRef]
  15. Zhao, P.; Zhou, H.-J.; Potter, D.; Hu, Y.-H.; Feng, X.-J.; Dang, M.; Feng, L.; Zulfiqar, S.; Liu, W.-Z.; Zhao, G.-F.; et al. Population genetics, phylogenomics and hybrid speciation of Juglans in China determined from whole chloroplast genomes, transcriptomes, and genotyping-by-sequencing (GBS). Mol. Phylogenet. Evol. 2018, 126, 250–265. [Google Scholar] [CrossRef]
  16. Pecchi, M.; Marchi, M.; Burton, V.; Giannetti, F.; Moriondo, M.; Bernetti, I.; Bindi, M.; Chirici, G. Species distribution modelling to support forest management. A literature review. Ecol. Model. 2019, 411, 108817. [Google Scholar] [CrossRef]
  17. Title, P.O.; Bemmels, J.B. ENVIREM: An expanded set of bioclimatic and topographic variables increases flexibility and improves performance of ecological niche modeling. Ecography 2018, 41, 291–307. [Google Scholar] [CrossRef] [Green Version]
  18. Sony, R.K.; Sen, S.; Kumar, S.; Sen, M.; Jayahari, K.M. Niche models inform the effects of climate change on the endangered Nilgiri Tahr (Nilgiritragus hylocrius) populations in the southern Western Ghats, India. Ecol. Eng. 2018, 120, 355–363. [Google Scholar] [CrossRef]
  19. Hoban, S. Integrative conservation genetics: Prioritizing populations using climate predictions, adaptive potential and habitat connectivity. Mol. Ecol. Resour. 2018, 18, 14–17. [Google Scholar] [CrossRef] [PubMed] [Green Version]
  20. Elith, J.; Leathwick, J.R. Species distribution models: Ecological explanation and prediction across space and time. Annu. Rev. Ecol. Evol. Syst. 2009, 40, 677–697. [Google Scholar] [CrossRef]
  21. Zhang, K.; Zhang, Y.; Tao, J. Predicting the potential distribution of Paeonia veitchii (Paeoniaceae) in China by incorporating climate change into a maxent model. Forests 2019, 10, 190. [Google Scholar] [CrossRef] [Green Version]
  22. Yang, X.-Q.; Kushwaha, S.P.S.; Saran, S.; Xu, J.; Roy, P.S. Maxent modeling for predicting the potential distribution of medicinal plant, Justicia adhatoda L. in Lesser Himalayan foothills. Ecol. Eng. 2013, 51, 83–87. [Google Scholar] [CrossRef]
  23. Kumar, S.; Stohlgren, T.J. Maxent modeling for predicting suitable habitat for threatened and endangered tree Canacomyrica monticola in New Caledonia. J. Ecol. Nat. Environ. 2009, 1, 94–98. [Google Scholar] [CrossRef]
  24. Alami, M.M.; Xue, J.; Ma, Y.; Zhu, D.; Abbas, A.; Gong, Z.; Wang, X. Structure, function, diversity, and composition of fungal communities in rhizospheric soil of Coptis chinensis Franch under a successive cropping system. Plants 2020, 9, 244. [Google Scholar] [CrossRef] [Green Version]
  25. Wu, J.; Luo, Y.; Deng, D.; Su, S.; Li, S.; Xiang, L.; Hu, Y.; Wang, P.; Meng, X. Coptisine from Coptis chinensis exerts diverse beneficial properties: A concise review. J. Cell. Mol. Med. 2019, 23, 7946–7960. [Google Scholar] [CrossRef] [Green Version]
  26. He, Y.; Xiao, H.; Deng, C.; Fan, G.; Qin, S.; Peng, C. Complete chloroplast genome sequence of Coptis chinensis Franch. and its evolutionary history. Biomed Res. Int. 2017, 2017, 8201836. [Google Scholar] [CrossRef] [PubMed] [Green Version]
  27. Pei, J.; Fu, B.; Jiang, L.; Sun, T. Biosynthesis, characterization, and anticancer effect of plant-mediated silver nanoparticles using Coptis chinensis. Int. J. Nanomed. 2019, 14, 1969–1978. [Google Scholar] [CrossRef] [Green Version]
  28. Miao, L.; Yun, X.; Yang, X.; Jia, S.; Jiao, C.; Shao, R.; Hao, J.; Chang, Y.; Fan, G.; Zhang, J.; et al. An inhibitory effect of Berberine from herbal Coptis chinensis Franch on rat detrusor contraction in benign prostatic hyperplasia associated with lower urinary tract symptoms. J. Ethnopharmacol. 2021, 268, 113666. [Google Scholar] [CrossRef] [PubMed]
  29. Liu, Y.; Wang, B.; Shu, S.; Li, Z.; Song, C.; Liu, D.; Niu, Y.; Liu, J.; Zhang, J.; Liu, H.; et al. Analysis of the Coptis chinensis genome reveals the diversification of protoberberine-type alkaloids. Nat. Commun. 2021, 12, 3276. [Google Scholar] [CrossRef]
  30. Chen, D.X.; Pan, Y.; Wang, Y.; Cui, Y.Z.; Zhang, Y.J.; Mo, R.Y.; Wu, X.L.; Tan, J.; Zhang, J.; Guo, L.A.; et al. The chromosome-level reference genome of Coptis chinensis provides insights into genomic evolution and berberine biosynthesis. Hortic. Res. 2021, 8, 121. [Google Scholar] [CrossRef]
  31. Li, J.; Meng, X.; Wang, C.; Zhang, H.; Chen, H.; Deng, P.; Liu, J.; Huandike, M.; Wei, J.; Chai, L. Coptidis alkaloids extracted from Coptis chinensis Franch attenuate IFN-gamma-induced destruction of bone marrow cells. PLoS ONE 2020, 15, e0236433. [Google Scholar] [CrossRef]
  32. Yang, S.B.; Kim, E.H.; Kim, S.H.; Kim, Y.H.; Oh, W.; Lee, J.T.; Jang, Y.A.; Sabina, Y.; Ji, B.C.; Yeum, J.H. Electrospinning fabrication of poly(vinyl alcohol)/Coptis chinensis extract nanofibers for antimicrobial exploits. Nanomaterials 2018, 8, 734. [Google Scholar] [CrossRef] [Green Version]
  33. Azareh, A.; Rahmati, O.; Rafiei-Sardooi, E.; Sankey, J.B.; Lee, S.; Shahabi, H.; Ahmad, B.B. Modelling gully-erosion susceptibility in a semi-arid region, Iran: Investigation of applicability of certainty factor and maximum entropy models. Sci. Total Environ. 2019, 655, 684–696. [Google Scholar] [CrossRef] [PubMed]
  34. Wang, D.; Cui, B.; Duan, S.; Chen, J.; Fan, H.; Lu, B.; Zheng, J. Moving north in China: The habitat of Pedicularis kansuensis in the context of climate change. Sci. Total. Environ. 2019, 697, 133979. [Google Scholar] [CrossRef]
  35. Poirazidis, K.; Bontzorlos, V.; Xofis, P.; Zakkak, S.; Xirouchakis, S.; Grigoriadou, E.; Kechagioglou, S.; Gasteratos, I.; Alivizatos, H.; Panagiotopoulou, M. Bioclimatic and environmental suitability models for capercaillie (Tetrao urogallus) conservation: Identification of optimal and marginal areas in Rodopi Mountain-Range National Park (Northern Greece). Glob. Ecol. Conserv. 2019, 17, e00526. [Google Scholar] [CrossRef]
  36. Yan, H.; Feng, L.; Zhao, Y.; Feng, L.; Wu, D.; Zhu, C. Prediction of the spatial distribution of Alternanthera philoxeroides in China based on ArcGIS and MaxEnt. Glob. Ecol. Conserv. 2020, 21, e00856. [Google Scholar] [CrossRef]
  37. Shcheglovitova, M.; Anderson, R.P. Estimating optimal complexity for ecological niche models: A jackknife approach for species with small sample sizes. Ecol. Model. 2013, 269, 9–17. [Google Scholar] [CrossRef]
  38. Wei, Y.; Zhang, L.; Wang, J.; Wang, W.; Niyati, N.; Guo, Y.; Wang, X. Chinese caterpillar fungus (Ophiocordyceps sinensis) in China: Current distribution, trading, and futures under climate change and overexploitation. Sci. Total Environ. 2021, 755, 142548. [Google Scholar] [CrossRef]
  39. Phillips, S.J.; Anderson, R.P.; Dudík, M.; Schapire, R.E.; Blair, M.E. Opening the black box: An open-source release of Maxent. Ecography 2017, 40, 887–893. [Google Scholar] [CrossRef]
  40. Yan, H.; Feng, L.; Zhao, Y.; Feng, L.; Zhu, C.; Qu, Y.; Wang, H. Predicting the potential distribution of an invasive species, Erigeron canadensis L., in China with a maximum entropy model. Glob. Ecol. Conserv. 2020, 21, e00822. [Google Scholar] [CrossRef]
  41. Sun, S.; Zhang, Y.; Huang, D.; Wang, H.; Cao, Q.; Fan, P.; Yang, N.; Zheng, P.; Wang, R. The effect of climate change on the richness distribution pattern of oaks (Quercus L.) in China. Sci. Total Environ. 2020, 744, 140786. [Google Scholar] [CrossRef] [PubMed]
  42. Cobos, M.E.; Peterson, A.T.; Barve, N.; Osorio-Olvera, L. kuenm: An R package for detailed development of ecological niche models using Maxent. PeerJ 2019, 7, e6281. [Google Scholar] [CrossRef] [PubMed] [Green Version]
  43. Arenas-Castro, S.; Goncalves, J.F.; Moreno, M.; Villar, R. Projected climate changes are expected to decrease the suitability and production of olive varieties in southern Spain. Sci. Total Environ. 2020, 709, 136161. [Google Scholar] [CrossRef]
  44. Akpoti, K.; Kabo-Bah, A.T.; Dossou-Yovo, E.R.; Groen, T.A.; Zwart, S.J. Mapping suitability for rice production in inland valley landscapes in Benin and Togo using environmental niche modeling. Sci. Total Environ. 2020, 709, 136165. [Google Scholar] [CrossRef]
  45. Liu, B.; Gao, X.; Ma, J.; Jiao, Z.; Xiao, J.; Hayat, M.A.; Wang, H. Modeling the present and future distribution of arbovirus vectors Aedes aegypti and Aedes albopictus under climate change scenarios in Mainland China. Sci. Total Environ. 2019, 664, 203–214. [Google Scholar] [CrossRef] [PubMed]
  46. Guo, Y.; Li, X.; Zhao, Z.; Nawaz, Z. Predicting the impacts of climate change, soils and vegetation types on the geographic distribution of Polyporus umbellatus in China. Sci. Total Environ. 2019, 648, 1–11. [Google Scholar] [CrossRef] [PubMed]
  47. Tang, C.Q.; Matsui, T.; Ohashi, H.; Dong, Y.F.; Momohara, A.; Herrando-Moraira, S.; Qian, S.; Yang, Y.; Ohsawa, M.; Luu, H.T.; et al. Identifying long-term stable refugia for relict plant species in East Asia. Nat. Commun. 2018, 9, 4488. [Google Scholar] [CrossRef] [Green Version]
  48. Ye, X.; Yu, X.; Yu, C.; Tayibazhaer, A.; Xu, F.; Skidmore, A.K.; Wang, T. Impacts of future climate and land cover changes on threatened mammals in the semi-arid Chinese Altai Mountains. Sci. Total Environ. 2018, 612, 775–787. [Google Scholar] [CrossRef] [PubMed]
  49. Pan, J.; Fan, X.; Luo, S.; Zhang, Y.; Yao, S.; Guo, Q.; Qian, Z. Predicting the potential distribution of two varieties of Litsea coreana (leopard-skin camphor) in China under climate change. Forests 2020, 11, 1159. [Google Scholar] [CrossRef]
  50. Zurell, D.; Franklin, J.; König, C.; Bouchet, P.J.; Dormann, C.F.; Elith, J.; Fandos, G.; Feng, X.; Guillera-Arroita, G.; Guisan, A.; et al. A standard protocol for reporting species distribution models. Ecography 2020, 43, 1261–1277. [Google Scholar] [CrossRef]
  51. Brown, J.L.; Bennett, J.R.; French, C.M. SDMtoolbox 2.0: The next generation Python-based GIS toolkit for landscape genetic, biogeographic and species distribution model analyses. PeerJ 2017, 5, e4095. [Google Scholar] [CrossRef] [Green Version]
  52. Brown, J.L. SDMtoolbox: A python-based GIS toolkit for landscape genetic, biogeographic and species distribution model analyses. Methods Ecol. Evol. 2014, 5, 694–700. [Google Scholar] [CrossRef]
  53. Václavík, T.; Meentemeyer, R.K. Invasive species distribution modeling (iSDM): Are absence data and dispersal constraints needed to predict actual distributions? Ecol. Model. 2009, 220, 3248–3258. [Google Scholar] [CrossRef]
  54. Smith, A.B.; Godsoe, W.; Rodríguez-Sánchez, F.; Wang, H.-H.; Warren, D. Niche estimation above and below the species level. Trends Ecol. Evol. 2019, 34, 260–273. [Google Scholar] [CrossRef]
  55. Guo, Y.; Lu, Y.; El-Kassaby, Y.A.; Feng, L.; Wang, G.; Wang, T. Predicting growth and habitat responses of Ginkgo biloba L. to climate change. Ann. Forest Sci. 2019, 76, 101. [Google Scholar] [CrossRef] [Green Version]
  56. Wang, J.; Feng, L.; Tang, X.; Bentley, Y.; Höök, M. The implications of fossil fuel supply constraints on climate change projections: A supply-side analysis. Futures 2017, 86, 58–72. [Google Scholar] [CrossRef]
  57. Li, J.; Fan, G.; He, Y. Predicting the current and future distribution of three Coptis herbs in China under climate change conditions, using the MaxEnt model and chemical analysis. Sci. Total Environ. 2020, 698, 134141. [Google Scholar] [CrossRef] [PubMed]
  58. Puchalka, R.; Dyderski, M.K.; Vitkova, M.; Sadlo, J.; Klisz, M.; Netsvetov, M.; Prokopuk, Y.; Matisons, R.; Mionskowski, M.; Wojda, T.; et al. Black locust (Robinia pseudoacacia L.) range contraction and expansion in Europe under changing climate. Glob. Chang. Biol. 2021, 27, 1587–1600. [Google Scholar] [CrossRef] [PubMed]
  59. Tseng, C.Y.; Sun, M.F.; Li, T.C.; Lin, C.T. Effect of Coptis chinensis on biofilm formation and antibiotic susceptibility in Mycobacterium abscessus. Evid-Based Compl. Alt. 2020, 2020, 9754357. [Google Scholar] [CrossRef]
  60. Velásquez-Tibatá, J.; Salaman, P.; Graham, C. Effects of climate change on species distribution, community structure, and conservation of birds in protected areas in Colombia. Reg. Environ. Change 2013, 13, 235–248. [Google Scholar] [CrossRef]
  61. Record, S.; Fitzpatrick, M.C.; Finley, A.O.; Veloz, S.; Ellison, A.M. Should species distribution models account for spatial autocorrelation? A test of model projections across eight millennia of climate change. Global Ecol. Biogeogr. 2013, 22, 760–771. [Google Scholar] [CrossRef] [Green Version]
  62. Maiorano, L.; Cheddadi, R.; Zimmermann, N.E.; Pellissier, L.; Petitpierre, B.; Pottier, J.; Laborde, H.; Hurdu, B.I.; Pearman, P.B.; Psomas, A.; et al. Building the niche through time: Using 13,000 years of data to predict the effects of climate change on three tree species in Europe. Global Ecol. Biogeogr. 2013, 22, 302–317. [Google Scholar] [CrossRef]
  63. Li, X.; Tian, H.; Wang, Y.; Li, R.; Song, Z.; Zhang, F.; Xu, M.; Li, D. Vulnerability of 208 endemic or endangered species in China to the effects of climate change. Reg. Environ. Change 2013, 13, 843–852. [Google Scholar] [CrossRef]
  64. Blank, L.; Blaustein, L. Using ecological niche modeling to predict the distributions of two endangered amphibian species in aquatic breeding sites. Hydrobiologia 2012, 693, 157–167. [Google Scholar] [CrossRef]
  65. Lee, J.W.; Kang, Y.J.; Choi, H.K.; Yoon, Y.G. Fractionated Coptis chinensis extract and its bioactive component suppress Propionibacterium acnes-stimulated inflammation in human keratinocytes. J. Microbiol. Biotechnol. 2018, 28, 839–848. [Google Scholar] [CrossRef] [PubMed] [Green Version]
  66. Jung, J.; Choi, J.S.; Jeong, C.S. Inhibitory Activities of palmatine from Coptis chinensis against Helicobactor pylori and gastric damage. Toxicol. Res. 2014, 30, 45–48. [Google Scholar] [CrossRef] [Green Version]
  67. Friedemann, T.; Otto, B.; Klatschke, K.; Schumacher, U.; Tao, Y.; Leung, A.K.; Efferth, T.; Schroder, S. Coptis chinensis Franch. exhibits neuroprotective properties against oxidative stress in human neuroblastoma cells. J. Ethnopharmacol. 2014, 155, 607–615. [Google Scholar] [CrossRef]
  68. Yu, Q.; Tong, S.; Yan, J.; Hong, C.; Zhai, W.; Li, Y. Preparative separation of quaternary ammonium alkaloids from Coptis chinensis Franch by pH-zone-refining counter-current chromatography. J. Sep. Sci. 2011, 34, 278–285. [Google Scholar] [CrossRef] [Green Version]
  69. Yuan, L.; Tu, D.; Ye, X.; Wu, J. Hypoglycemic and hypocholesterolemic effects of Coptis chinensis Franch inflorescence. Plant Food. Hum. Nutr. 2006, 61, 139–144. [Google Scholar] [CrossRef] [PubMed]
  70. Araújo, M.B.; Luoto, M. The importance of biotic interactions for modelling species distributions under climate change. Global Ecol. Biogeogr. 2007, 16, 743–753. [Google Scholar] [CrossRef]
  71. Araújo, M.B.; Pearson, R.G.; Thuiller, W.; Erhard, M. Validation of species–climate impact models under climate change. Glob. Chang. Biol. 2005, 11, 1504–1513. [Google Scholar] [CrossRef] [Green Version]
  72. García-Valdés, R.; Zavala, M.A.; Araújo, M.B.; Purves, D.W. Chasing a moving target: Projecting climate change-induced shifts in non-equilibrial tree species distributions. J. Ecol. 2013, 101, 441–453. [Google Scholar] [CrossRef] [Green Version]
  73. Zeng, Y.; Low, B.W.; Yeo, D.C.J. Novel methods to select environmental variables in MaxEnt: A case study using invasive crayfish. Ecol. Model. 2016, 341, 5–13. [Google Scholar] [CrossRef]
Figure 1. Photos of Coptis chinensis in the field and its distribution. (A) location; (B) flower; (C) rhizome; (D) individual; (E) habitat.
Forests 12 01464 g001
Figure 2. Predicted distribution of Coptis chinensis in China under current climate condition.
Forests 12 01464 g002
Figure 3. Predicted distribution of Coptis chinensis in China under future (2050s–2090s) climatic scenarios.
Forests 12 01464 g003
Figure 4. Changes of potentially suitable areas of Coptis chinensis from current to future climatic conditions.
Forests 12 01464 g004
Figure 5. Areas (a) and changes (b) of habitats of different suitability for Coptis chinensis in China in different periods.
Forests 12 01464 g005
Figure 6. Composite prediction of low impact areas supported by varying numbers of shared socio-economic pathways (SSP1-2.6, SSP2-4.5, SSP3-7.0 and SSP5-8.5).
Forests 12 01464 g006
Figure 7. Core distribution shifts under 12 climate scenarios/years. Arrows indicate the magnitude and direction of predicted change over time.
Forests 12 01464 g007
Table 1. Environmental variables and their contributions and suitable value ranges.
CodeEnvironmental VariablePercent Contribution (%)
BIO02Mean diurnal range (Mean of monthly (max temp–min temp)) (°C)36.2
BIO04Temperature seasonality (standard deviation × 100)5.1
BIO06Min temperature of coldest month (°C)41.4
BIO10Mean temperature of warmest quarter (°C)2.1
BIO11Mean temperature of coldest quarter (°C)12.2
BIO14Precipitation of driest month (mm)3.0
Table 2. Predicted suitable areas under current and future climatic conditions.
DecadesPredicted Area (× 104 km2) and % of the Corresponding Current Area
Total Suitable RegionLowly Suitable RegionModerately Suitable RegionHighly Suitable Region
1970–2000120.4780.1037.163.21
SSP1-2.62050s68.6657.3011.050.30
(56.99%)(71.53%)(29.74%)(9.51%)
2070s69.6457.1712.020.45
(57.81%)(71.38%)(32.34%)(14.00%)
2090s74.4760.5313.500.44
(61.82%)(75.57%)(36.33%)(13.78%)
SSP2-4.52050s68.7256.9811.400.35
(57.05%)(71.14%)(30.66%)(10.92%)
2070s54.9848.176.680.14
(45.64%)(60.14%)(17.96%)(4.22%)
2090s49.0843.645.360.07
(40.74%)(54.49%)(14.42%)(2.27%)
SSP3-7.02050s70.4060.589.650.18
(58.44%)(75.63%)(25.97%)(5.51%)
2070s50.8045.844.900.06
(42.17%)(57.23%)(13.20%)(1.73%)
2090s33.5231.791.730.00
(27.83%)(39.69%)(4.65%)(0.11%)
SSP5-8.52050s55.6648.087.380.20
(46.21%)(60.02%)(19.86%)(6.38%)
2070s32.6330.502.120.02
(27.09%)(38.07%)(5.69%)(0.49%)
2090s14.6914.280.410.00
(12.19%)(17.83%)(1.10%)(0.00%)
Table 3. Low impact areas (LIAs) under different shared socio-economic pathways (SSPs).
LIA StatisticsShared Socio-Economic Pathways (SSPs)
SSP1-2.6SSP2-4.5SSP3-7.0SSP5-8.5
Geographic area (×104 km2)64.2247.3331.2912.86
Percentage of current suitable area (%)53.3139.2925.9710.67
Percentage of SSP1-2.6 area (%)100.0073.7048.7220.02
Publisher’s Note: MDPI stays neutral with regard to jurisdictional claims in published maps and institutional affiliations.

