Article

Scots Pine and Norway Spruce Wood Properties at Sites with Different Stand Densities

by
Benas Šilinskas
1,
Iveta Varnagirytė-Kabašinskienė
1,*,
Marius Aleinikovas
1,
Lina Beniušienė
1,
Jūratė Aleinikovienė
2 and
Mindaugas Škėma
1
1
Institute of Forestry, Lithuanian Research Centre for Agriculture and Forestry, Liepų str. 1, LT-53101 Girionys, Kaunas District, Lithuania
2
Vytautas Magnus University Agriculture Academy, Studentų str. 11, LT-53361 Akademija, Kaunas District, Lithuania
*
Author to whom correspondence should be addressed.
Forests 2020, 11(5), 587; https://doi.org/10.3390/f11050587
Submission received: 21 April 2020 / Revised: 13 May 2020 / Accepted: 21 May 2020 / Published: 23 May 2020
(This article belongs to the Section Wood Science and Forest Products)

Abstract

:
Background and Objectives: The aim of this study was to determine the effects of different stand densities on wood density (WD), global modulus of elasticity (MOE), and bending strength (MOR) in 35-year-old Scots pine (Pinus sylvestris L.) and Norway spruce (Picea abies (L.) H. Karst) stands, representing the hemiboreal forest zone. Materials and Methods: Scots pine and Norway spruce sites, representing different stand densities of 3000–3100; 2000–2100 and 1000–1100 trees per hectare, were chosen. Visually healthy model pine and spruce trees were selected, and diameter at breast height (DBH) was measured for model trees; the competition index was calculated; the MOE and MOR were evaluated by the Standards EN 408:2006 and EN 384:2016, at 12% moisture content; WD and the knot diameter were measured; and the strength class of wood was determined by the Standard EN 338:2009. To predict wood quality characteristics based on stand and tree characteristics, linear regression models were developed. Results and Conclusions: Higher stand density led to a significant change in the main wood properties of both conifer species. The highest mean WD, MOE, and MOR were obtained at the sites with the highest stand density. The MOE and MOR were highly correlated, but relatively weak correlations were found between MOE and MOR with tree DBH and WD. Despite the lower quality of Scots pine wood, the Norway spruce wood from more dense sites corresponded to the strength class of C16, according the strength grading of softwoods. The linear regression models did not perform well in describing the relationship of wood properties with stand and tree characteristics. The models for MOR accounted for the highest variation of 62–65% for both Scots pine and Norway spruce. These relationships can be expected to change with increased stand age or with the inclusion of specific crown parameters.

1. Introduction

The constantly changing influence of soil conditions, moisture, and growing space affect trees and therefore induce a considerable variation in wood physical and mechanical properties. Several silvicultural operations and forest management practices, including plant spacing and thinning, can increase tree biomass production while improving tree wood quality [1,2,3]. The competition for availability of sunlight, water, and nutrients between trees should be mentioned as one of the basic effects in a forest [4]. Below the optimal threshold, narrower spacing between trees can reduce the volume growth of each tree and increase tree mortality due to excessive intraspecific competition [5,6,7,8]. In forestry, this competition effect is inevitably related to the initial stand density, i.e., tree number per hectare at planting, and thinning intensity at different stand ages.
Influenced by different growth conditions, climate, tree developmental stage, and silvicultural treatments, wood density is one of the most important and first assessed species-specific parameter of wood quality. The wood density correlates with some wood mechanical properties such as the wood dynamic bending strength (MOR), flexibility, and stiffness, indicated by the global modulus of elasticity (MOE) [9,10]. However, earlier studies concluded that different thinning intensities had little or no impact on the wood density of the remaining Scots pine [11,12,13] and Norway spruce trees [14,15], mainly dependent on environmental factors (soil, climate, location, altitude, etc.).
For wood quality management, the effect of tree growth features is as important as the appropriate application of various silvicultural operations in the stand, i.e., selection of appropriate tree density at thinnings throughout the whole stand growth period. It is known that a high competition index indicates a negative impact on tree diameter [16]. Tree diameter at breast height (DBH) correlates well with wood density, and the wood density has a high correlation with the latewood percentage [17]. Therefore, it can be hypothesized that forest management practices that regulate spacing between trees act as a tool for wood quality improvement.
Other important parameters for determining wood quality are MOE and MOR [18,19]. It is well known that for softwood species, the MOE and MOR correlate with the basic wood properties, such as wood density (WD), annual ring width, and the proportion of latewood [20,21]. The predictions of MOE and MOR for Scots pine and Norway spruce were created using wood density, ring width, and age as predictors in France and Finland [22].
Following earlier studies, the identification of wood properties that can increase timber quality is important, and therefore, the best forest management options to improve wood quality should be selected [19,23]. Studies on the relationships of Scots pine and Norway spruce wood properties with stand characteristics under different growing conditions—stand density and thinning intensity—showed that wood quality was affected by different initial spacing [24,25,26,27]. For end-use applications, the wood theoretically is graded to the strength classes based on the MOE, MOR, and WD [28].
In Lithuania, Scots pine and Norway spruce are the most important conifer species, both economically and ecologically. Very limited studies, however, have reported the wood properties of these tree species. The MOE and MOR values are tested by different methods (dynamic and static) and different devices (MTG; Metriguard; 4-point bending; long span) [29], and the dynamic MOE of small Scots pine logs is modelled by log parameters [30].
The aim of this study was to examine the effects of stand density on wood quality, mainly wood density, modulus of elasticity, and bending strength, in Scots pine (Pinus sylvestris L.) and Norway spruce (Picea abies (L.) H. Karst) stands. We also developed models to predict wood quality characteristics based on stand and tree characteristics.

2. Material and Methods

2.1. Study Site

This study on wood properties was conducted in Lithuania, situated on the eastern coast of the Baltic Sea between latitudes 53°54’–56°27’ N and longitudes 20°56’–26°51’ E. The total land area is 65.200 km2. Lithuania belongs to the temperate climate zone, and its climate is characterized as transitional between the mild Western European and continental Eastern European climates [31]. The average air temperature was 6.9 °C, and the mean annual precipitation was 695 mm during the period of 1981–2010.
Lithuania represents the southern part of the hemiboreal forest zone, situated in a natural convergence zone between boreal and nemoral forests. Forests cover 2.2 million ha, which corresponds to 33.5% of the land area [32]. Coniferous stands prevail in Lithuania, covering 55.6% of the forested area. Scots pine (Pinus sylvestris L.) stands cover 34.6%, and Norway spruce (Picea abies (L.) H. Karst.) covers 20.9% of the forested area.

2.2. Study Plots and Field Measurements

The sites for this study were selected in a long-term experimental area, which was initially established by the Lithuanian Forest Institute in 1990 [33]. The areas of Scots pine and Norway spruce were ploughed in rows every 2 m before planting. Plantations were established in 1982 by manually planting one-year-old pine seedlings in rows every 0.5 m (10,000 seedlings ha−1), and two-year-old spruce seedlings in rows every 1 m (5000 seedlings ha−1). The research in this experimental area was initiated during the first early thinning when planted trees reached the age of 8–9 ears; the last thinning is planned when the trees will reach the age of 50 years.
For this study, Scots pine and Norway spruce sites, representing different stand densities of 3000–3100; 2000–2100, and 1000–1100 trees per hectare at an early age (hereafter, stand density), and different thinning regimes were chosen (Table 1). Up to 2015, the plots with the highest stand density (3000–3100 trees ha−1 at 8–9 years of age) were thinned three times (at the age of 8–9, 15, and 21 years), the plots with a moderate density of 2000–2100 trees ha−1— two times (at the age of 8–9 and 15 years), and the plots with the lowest density of 1000–1100 trees ha−1 were thinned only once (at the age of 8–9 years). Stand thinnings were performed by removing the worst-growing trees. While thinning the plots, tree branches were left in the forest.
For the evaluation of wood properties, twelve to thirteen 35-year-old Scots pine and Norway spruce trees were sampled in each of three stand density trials during the 4th thinning in 2015. In total, 39 Scots pine and 37 Norway spruce model trees were selected. All model trees were visually healthy, without damage caused by diseases or insects.
The forest site type for Scots pine stands was an oligotrophic mineral soil of a normal moisture regime, and for Norway spruce stands—mesoeutrophic mineral soil of a normal moisture regime, according to the Lithuanian classification of forest site types [34]. The soil in Scots pine and Norway spruce stands is classified as Hapli–Calcaric Arenosol and Hapli-Mollic Planosol, respectively, according to the World Reference Base for Soil Resources 2014 [35].
To provide basic information on the mineral nutrient saturation in soil, the mineral soil from the humus-accumulative horizon (Ap) was sampled. Three composite samples were combined from 10 subsamples collected systematically in each sample plot (the distance between the sampling points was at least 5 m). Soil chemical analyses were performed by standard analytical methods: pHCaCl2 by ISO 10390, total nitrogen by ISO 11261, total potassium, phosphorus, calcium and magnesium with an inductively coupled plasma optical emission spectroscopy (ICP-OES), and organic carbon with an elemental analyser LECO CNS 2000 (St. Joseph, MI, USA). The trends in the total soil nutrient content in stands were similar and mostly represented nutrient-poor soils. The nutrient stocks were largely concentrated in Ap horizons with carbon concentrations lower than 20 g kg−1 and nitrogen concentrations lower than 3 g kg−1, with potassium concentrations lower than 120 mg kg−1, but with different availability of phosphorus, i.e., 53 mg kg−1 and 131 mg kg−1 in Scots pine and Norway spruce stands, respectively.

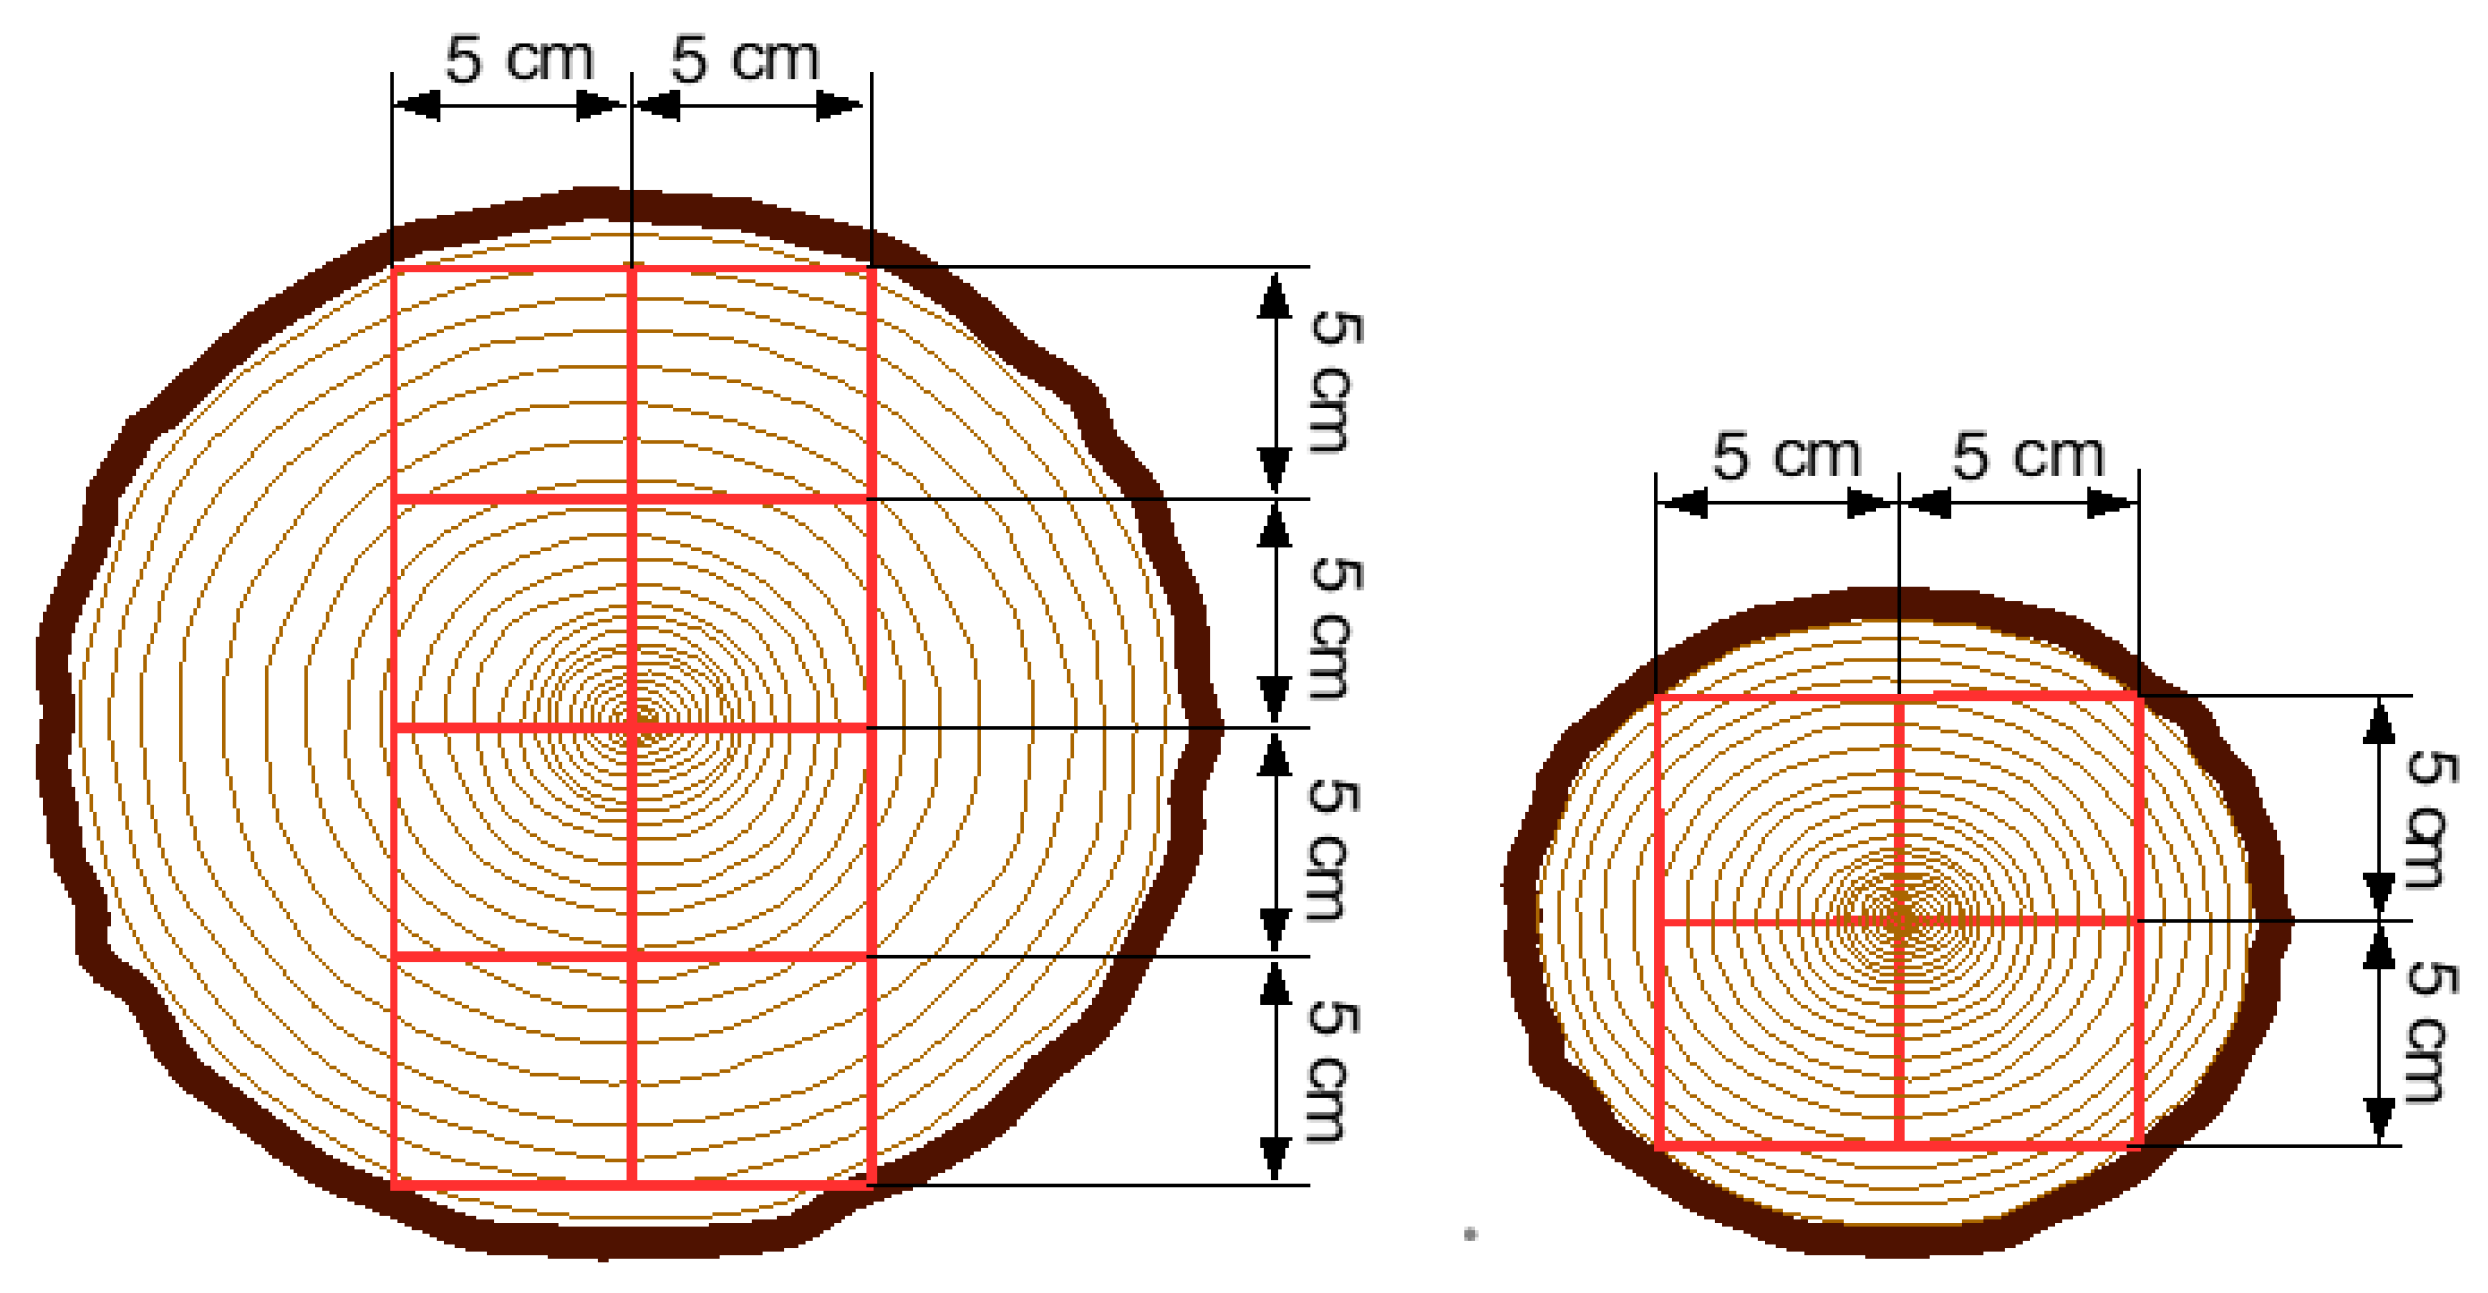
2.3. Sampling and Analysis of Wood Properties

As mentioned in the previous section, the selected 35-year-old pine and spruce model trees were sampled during the 4th thinning in 2015 (see Table 1). In this paper, stand density after the 1st thinning was used as a baseline indicator to describe the sites with different stand densities. The effect of stand density on the main wood properties was evaluated.
Before sampling of the model trees, tree diameter at breast height (DBH) was measured. The DBH of the model trees selected for this study was 15.2–25.7 cm for pine trees and 16.4–23.0 cm for spruce trees. The obtained DBH values were used to calculate the competition index (CI) [36]. This Hegyi CI, widely used to quantify competition degree among trees in the forest stands, was calculated as follows:
C I = j = 1 N D j D i × L i j
here, i—the target tree, j—the competing tree j, Di—the DBH of the target tree, Dj—the DBH of the competing tree j, Lij—the distance between the target tree i and competing tree j, N—the number of competing trees.
All trees at a distance of 1–2.8 m from the model trees were included to calculate the Hegyi CI.
Logs 3 meters long were cut from each model tree: in total, 39 pine logs with a mean DBH of 15.2–25.7 cm, and 37 spruce logs with a mean DBH of 16.4–23 cm were cut. To prepare the wood samples (hereafter, samples) the logs were cut following this scheme: first, starting from the tree base, two logs 1–1.1 meters long were cut, and, second, the samples were prepared according to the scheme in Figure 1. In total, 275 samples were prepared for pine and 310 samples were prepared for spruce.
In the laboratory, all prepared samples (dimensions 50 × 50 × 1000/1100 with average moisture content of 10%) were tested with a Bending Testing Machine 500 kN (FORM+TEST Seidner&Co. GmbH). The tests were done following the methodology given in Standard EN 408:2006 [37]. The samples were tested in four-point bending test. The global modulus of elasticity (MOE) and bending strength (MOR) were evaluated and calculated at 12% moisture content according to Standard EN: 384:2016 [38].
For the determination of wood density (WD), the samples were cut near the breakage point immediately after the bending test. The moisture content was determined by the oven dry method according to Standard EN: 13183-1:2002 [39]. The WD was calculated based on the mass/volume ratio. The values at 12% moisture content were calculated according to Standard EN 384:2016 [38]. In cases where the breakage point went through a knot, the knot diameter at a base (K) was measured.
The theoretical strength class of each wood sample group was determined based on the limiting values according to the European standard EN: 338:2009 [40]. EN 338 lists a convenient set of bending strength classes for softwoods (C-grades) and a set for hardwoods (D-grades). In this study, the wood sample group was assigned to the appropriate strength class if the characteristic values of MOE, as well MOR and WD (both are the 5th-percentiles), matched or exceeded the values of the desired class.

2.4. Data Analysis

The obtained data were analysed using the statistical package SAS 9.4 (SAS Institute Inc., NC, USA). To determine the significant differences between the sites with different stand densities, ANOVA followed by Duncan’s multiple range test was used. Different letters next to the mean values show statistically significant differences at p < 0.05 between the sites.
The MOE and MOR were modelled using SAS general linear models. The model for MOE was created including the following parameters: stand density (SD), sample height in the tree (LH), DBH, CI, WD, and K. The model for MOR additionally included the MOE parameter. All parameters in the models were chosen as random effects.
For the prediction of MOR and MOE based on the stand and tree characteristics, the following equations were developed:
MOE = a0 + a1SD + a2LH + a3DBH a4CI + a5K + a6WD + ε
MOR = b0 + b1SD + b2LH + b3DBH + b4CI + b5K + b6WD + b7MOE + ε
here, a0, b0—are intercepts; a1,b2, … xn—parameter estimates; SD—stand density; LH—log height; DBH—diameter at breast height; CI—competition index between trees; K—knot diameter; WD—wood density; MOE—global modulus of elasticity in static bending; MOR—modulus of rupture in static bending; ε—error terms.
For the best result, the linear models were improved by eliminating non-significant parameters at p < 0.05.

3. Results

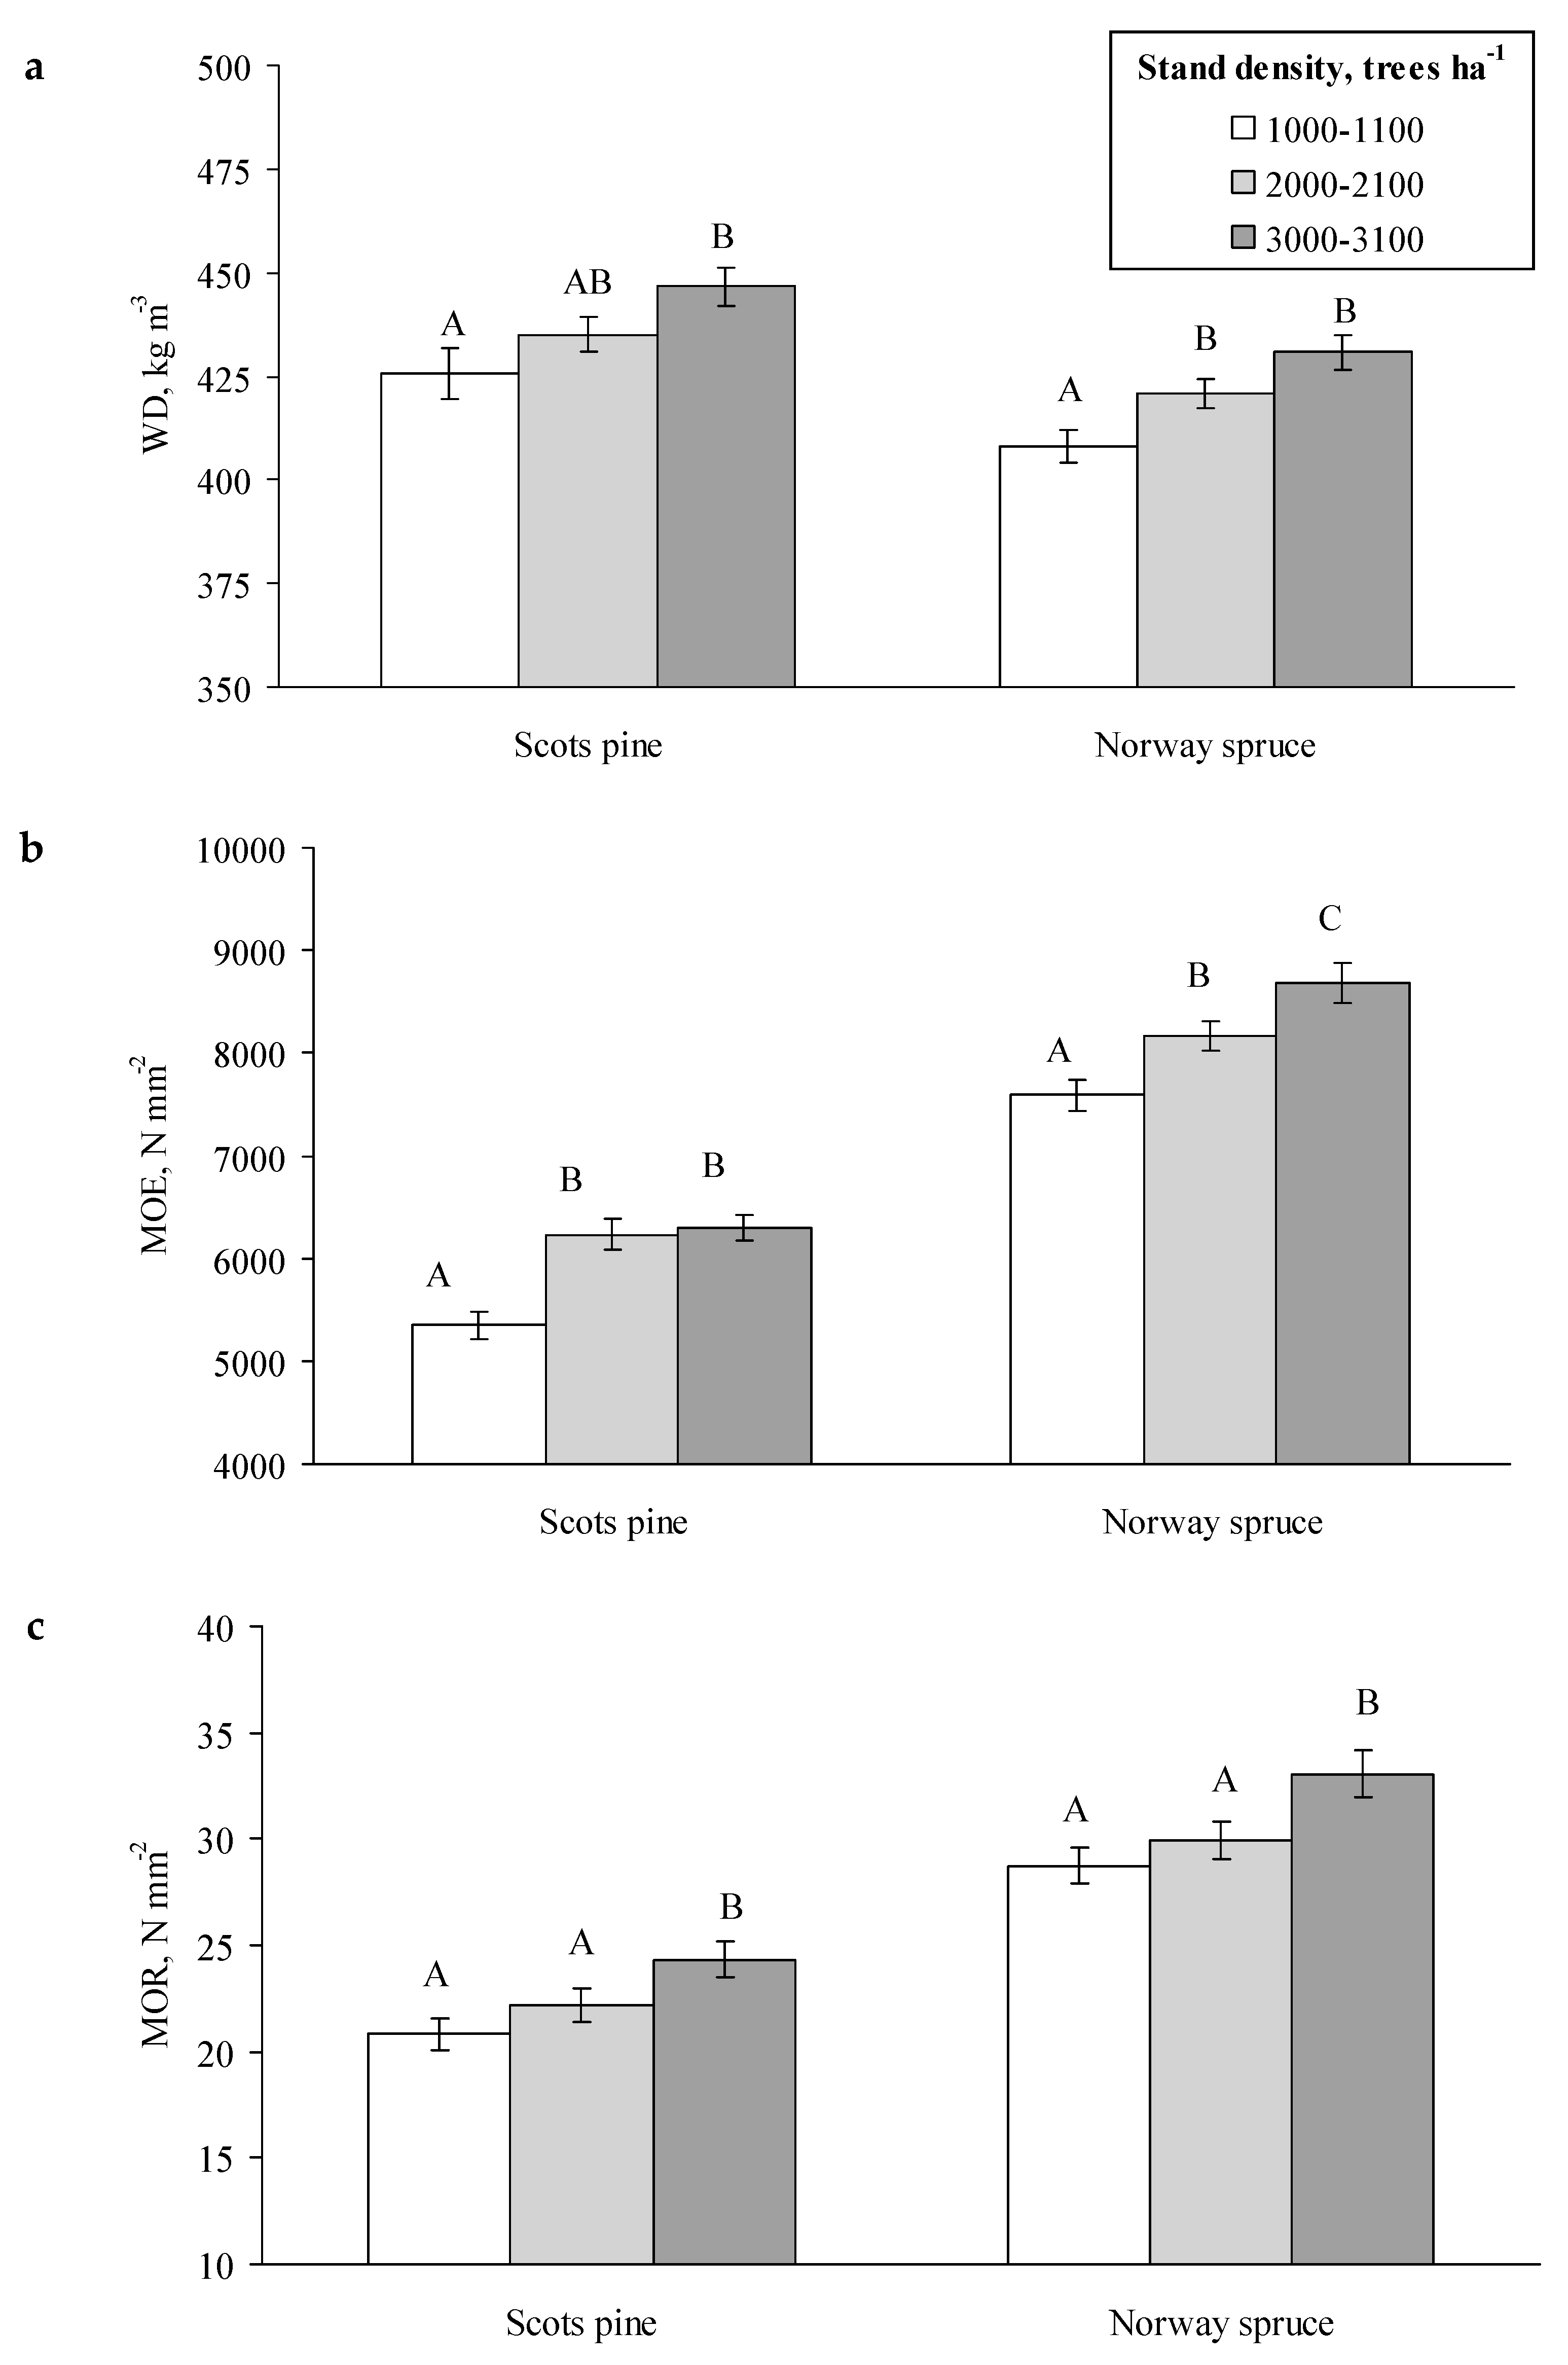
3.1. Wood Properties at the Sites of Different Stand Densities

The mean values of the knot diameter (K), wood density (WD), global modulus of elasticity (MOE), and bending strength (MOR) of Scots pine and Norway spruce at each site with a different density are summarized in Table 2. Mean tree diameters at breast height (DBH) varied in a range from 17.87 ± 0.15 cm to 19.51 ± 0.31 cm for Scots pine and from 17.86 ± 0.85 cm to 18.95 ± 0.18 cm for Norway spruce. The competition index (CI) was slightly higher for Scots pine growing under the lower stand density, but no effect of stand density on CI was obtained for Norway spruce.
For pine, the mean values of the K parameter showed larger variability between the sites of different stand densities and were higher than for spruce (Table 2). No effect of stand density on the mean K parameter was found for either species.
The variation of the WD, MOE, and MOR in relation to the stand density for different tree species is given in Figure 2. The WD values ranged from 425.7 ± 6.0 kg m−3 to 446.6 ± 4.8 kg m−3, depending on the pine stand density, and from 408 ± 3.9 kg m−3 to 430.8 ± 4.0 kg m−3, depending on the spruce stand density. The highest mean values of WD were obtained at the sites with the highest stand density of 3000–3100 trees ha−1. The lowest WD at the sites with 1000–1100 trees ha−1 differed significantly with respect to all other conditions both for pine and spruce.
In Figure 2, the variation of the MOE in relation to the number of trees per hectare for different tree species showed significant (p < 0.05) differences between the sites with the highest stand density of 3000–3100 trees ha−1 and the lowest stand density of 1000–1100 trees ha−1. For Norway spruce, significantly different MOE values were found for all sites with different stand densities: the MOE values decreased with decreasing stand density.
The mean MOR values showed a very similar tendency as the MOE values (Table 2; Figure 2). The highest mean MOR values were obtained in the stands with 3000–3100 trees ha−1 in comparison to all other conditions.
Based on the characteristic values of WD, MOE, and MOR, the wood samples from different stand density trials were theoretically graded according to the strength classes (Table 3). The wood samples of Norway spruce from the sites with stand density of 2100–3100 trees ha−1 corresponded to the strength class of C16. For the sites with 1100 trees ha−1, only 5% of the samples would be rejected in order to meet the requirements for C14. However, the Scots pine did not meet the requirements for any strength class: approximately 72–89% of the samples would be rejected in order to meet the requirements for C14.

3.2. Relationships of Stand and Tree Characteristics with Wood Quality Parameters

The correlation coefficients between stand and tree characteristics with wood quality parameters for Scots pine and Norway spruce are presented in Table 4 and Table 5, respectively. Generally, the stand and tree characteristics showed various degrees of correlation with the wood quality parameters. Both MOE and MOR were found to be highly correlated. There were significant relatively weak correlations between wood properties and most tree characteristics. For example, relatively weak correlations between MOE and MOR with tree DBH and WD were observed.

3.3. Modeling Wood Quality Parameters in Relation to Stand and Tree Characteristics

The models determined by the stepwise procedure are given in Table 6. The MOE was predicted by the stand density (SD), log height (LH), DBH, CI, WD, and K, with an R2 value of 0.18 for Scots pine (model 1) and of 0.38 for Norway spruce (model 5). The MOE, excluding the non-significant parameters, was best predicted by the SD, LH, K, and WD, with R2 =0.17 (Scots pine, model 2) and R2 = 0.38 (Norway spruce, model 6). Regarding the MOR equation, MOE was introduced in addition to the SD, LH, DBH, CI, K, and WD, and the total amount of variation explained was somewhat higher than that of the MOE model (R2 = 0.62 − 0.65). The best MOR model for Scots pine included LH, K, and MOE (model 4) and for Norway spruce—K and MOE (model 8).
More of the variation in MOE and MOR was explained by tree characteristics included in the models for Norway spruce than in those for Scots pine (Table 5). These models were inadequate in describing the relationships of MOE and MOR with SD and DBH.

4. Discussion

4.1. Effects of Stand Density on Wood Quality Characteristics

The obtained results demonstrate how the effect of stand density on wood quality can be identified by measurement of the main wood properties—wood density (WD), global modulus of elasticity (MOE), and bending strength (MOR). The stand density influences the growth of trees, the productivity of stands, and the quality of the produced wood [41].
The findings of this study showed that different stand densities caused various responses of wood quality characteristics of Scots pine and Norway spruce trees. Specifically, the mean values of WD increased with increasing stand density, and the lowest values were obtained at the sites with the lowest stand density. Other studies similarly concluded that thinning (decreasing the number of remaining trees per hectare) decreased WD of Scots pine [11] and Norway spruce [14,15,42]. Most authors indicated that these changes were a consequence of a higher growth rate. However, studies on numerous species reported no significant effect or little effect of stand density on WD [23,41,42,43] or even an increase [42]. This discrepancy may be attributed to differences in species and geographical location.
There were statistically significant differences in the characteristics of the wood between various stand densities. A significant effect of stand density on MOE and MOR of Scots pine and Norway spruce was found, i.e., the lowest MOE and MOR were observed at the lowest stand density. Few studies are available on the impact of thinning or stand density on MOE or MOR. However, in line with our results, ambivalent results were observed for MOE and MOR of other species. These wood mechanical properties significantly decreased in Sitka spruce influenced by early thinning [44] and in Douglas fir and Norway spruce with thinning [42]. However, in black spruce (Picea mariana), MOE slightly increased, but no changes of MOR values after thinning were reported [43]. No changes in both the MOE and MOR of loblolly pine [45] and no decrease in the MOE of Douglas fir [46] with varying silvicultural intensity were reported. However, both MOE and MOR increased in Sitka spruce [42]. According to Stöd et al. [28], the first thinnings provided saw timber with the lowest MOR and MOE, whereas the material from the second thinnings provided the higher values.
For timber researchers, it is important to understand the key principles and limitations of the wood strength-grading system. Based on the theoretic strength-class distribution, Norway spruce wood corresponded to the strength class of C16 at the sites with the highest stand density. However, Scots pine wood did not reach the requirements of any strength class. Compared with other studies, about 12% of the samples were rejected for the strength class of C14 and 20% for the strength class of C16, when testing spruce wood [47]. Similarly, Norway spruce wood met the requirements of the strength classes C18 to C22 in both thinned and unthinned stands, while Sitka spruce wood was classified in the C16 to C18 classes [42].

4.2. Relationships Between Tree Characteristics and Wood Quality Parameters

The correlation analysis showed various degrees of correlation between stand and tree characteristics and wood quality attributes in Scots pine and Norway spruce. Relationships between wood quality parameters (MOE, MOR) and tree characteristics (DBH, tree height) were indicated in previous studies [23,48]. In this paper, both MOE and MOR were highly correlated, but relatively weak correlations were found between MOE and MOR with tree DBH and WD. According to Jiang et al. [23], WD is often poorly related to any tree characteristics, which might be explained by the low variation in WD between trees from various stand densities. The density is lower in fast-growing softwoods and does not apply to diffuse porous hardwoods. Some mechanical wood properties were negatively correlated with most of the tree characteristics, indicating that fast growth rate results in poor wood properties [23,48].
Since relatively poor relationships between stand and tree parameters and wood quality variables were obtained in this study, the application of selected characteristics for the prediction of wood quality may be problematic without additional evaluation.

4.3. Modeling Wood Quality Parameters in Relation to Tree Characteristics

It is known that the use of MOE and MOR models enables the industry to assess the quality of wood products and to predict the bending stiffness and strength values based on tree characteristics. MOE and MOR are considered to be essential wood properties. For the predictions of MOR, MOE was selected by the stepwise procedure. In earlier studies, a close relationship of MOE and MOR was also recorded for many tree species [22,48,49], and MOR can be best estimated from MOE and tree characteristics [50]. Using linear regression models, attempts were made to determine MOE and MOR from site and tree indicators. In the study of Lei et al. [48], a stepwise method was applied to identify the best variables for predicting MOE and MOR based on the stand and tree characteristics in black spruce. The mentioned study indicated that for the prediction of MOE, stem taper was the best explanatory variable (R2 = 0.56), followed by tree crown length, DBH, stand density, and tree crown width. With the exception of stem taper and DBH, the variables positively influenced MOE. For the prediction of MOR, the MOE was the best explanatory variable, followed by tree DBH and tree crown length (R2 = 0.79). Further studies on black spruce reported that the best MOE model (R2 = 0.65) consisted of three reliable indicators: tree DBH, crown length, and WD [51]. These authors found that the MOE model was best explained by WD. The MOR model was best described by WD and DBH (R2 = 0.68).
Scots pine MOE and MOR were modeled in Finland and France according to three indicators: WD, ring width, and wood age [22]. The better MOE (R2 = 0.72) and MOR (R2 = 0.84) models were determined for Finnish Scots pine than for French Scots pine (R2 = 0.52 and R2 = 0.42, respectively). Including only the MOE index in the model, the best MOR models were found (R2 = 0.79–0.95). A study in Finland found that WD had the greatest influence on the modeling of MOE and MOR in Scots pine. Another important indicator that negatively affected these parameters was the branch thickness [28]. As indicated by Castéra et al., 1996 [50], the effect of knots on wood strength is great, which may partly explain the relatively low R2 value of MOR.
The variations of WD, MOE, and MOR have been analysed using linear mixed models [18]. For the best model for MOE (R2 = 0.80), the authors included four fixed indicators: the indicator property, calculated from resonance frequencies, and board length; WD at 12% moisture content; ratio of DBH of the sample trees to the mean DBH of the stand; and relative longitudinal position, calculated as the proportion of the longitudinal board position to tree height. Similarly, the best model for MOR consisted of the same fixed effects (R2 = 0.76).
For Norway spruce and Scots pine, general linear models were applied to determine the MOE and MOR based on tree and sample indices [20,21]. Only three random variables were used for MOE models: WD, mean ring width, and knot area ratio. To determine the MOR, the MOE was included in the models. The studies showed higher coefficients of determination for pine than for spruce.
In general, the models presented in this paper did not perform very well in describing the relationship of wood properties with stand and tree characteristics. The relationships found here can be expected to change with increases in stand age, the accumulation of mature wood or including specific crown parameters, site, and climate indices. In any case, these models could be an alternative tool to predict the wood strength from MOE and some stand and tree characteristics, since MOE can be obtained by various non-destructive testing methods. Further research should therefore be undertaken to examine the applicability of these findings to more fertile sites and mixed-species stands.
Differences in wood properties occur due to the different genotypes and environments of the trees, i.e., the soil and climatic conditions, in which the trees grow. When we explain the impact of forest management on wood properties, one of the explanatory statements is that any changes in tree growth conditions affect the wood properties [41]. The forest management recommendations assume that thinning in commercial forests will take place during certain rotation periods. The first thinning primarily is aimed at improving forest growth and yield in the future. When the trees are removed during thinning, the wood quality of the removed trees may be lower than that of mature forests. It can be assumed that this was a limitation of this study because the wood samples were taken from the trees that were removed during the thinning operations. The findings, presented in this study, should be also interpreted with caution because the proportion of juvenile wood was not evaluated. In practice, the proportion of juvenile wood should be minimized due to the specific anatomical properties (short wood cells, high amount of lignin, low WD, etc.). As noted by Yang and Hazenberg in 1994, the properties of juvenile and mature wood are also affected differently by different stand densities [52]. These authors found that the growth rate of juvenile wood was significantly different when different stand densities were compared.
Considerably more work will need to be done to determine the wood quality in the later stand development stages, sampling the wood at final felling, and testing the wood sampled from trees of different Kraft’s classes (social class that corresponds to different positions in the stand structure and crown development). Furthermore, there is a need for a cost-efficient and end-user oriented study on wood quality properties in the Baltic region.

5. Conclusions

The aim of the current study was to determine the effects of different stand densities on wood density (WD), global modulus of elasticity (MOE), and bending strength (MOR) in Scots pine (Pinus sylvestris L.) and Norway spruce (Picea abies (L.) H. Karst) stands. The results from this study indicated that higher stand density led to a significant change of the main wood properties for both conifer species. The highest mean WD, MOE, and MOR were obtained at the sites with the highest stand density. The MOE and MOR were highly correlated, but relatively weak correlations were found between MOE and MOR with tree DBH and WD.
Despite the lower quality of Scots pine wood, the Norway spruce wood from more dense sites corresponded to the strength class of C16 according to EN: 338:2009. The developed linear regression models to predict wood quality characteristics based on stand and tree characteristics did not perform very well in describing the relationship of wood properties with stand and tree characteristics. The models for MOR accounted for the highest variation of 62% and 65% for Scots pine and Norway spruce, respectively. The relationships can be expected to change with increases in stand age or the inclusion of specific crown parameters.

Author Contributions

Conceptualization, B.Š. and I.V.-K.; Formal analysis, B.Š. and I.V.-K.; Investigation, B.Š., I.V.-K., M.A., L.B., J.A., and M.Š; Methodology, B.Š., I.V.-K., and M.A.; Software, B.Š.; Supervision, B.Š. and I.V.-K.; Writing—original draft preparation, B.Š. and I.V.-K.; writing—review and editing, M.A., L.B., J.A., and M.Š. All authors have read and agreed to the published version of the manuscript.

Funding

This research received no external funding.

Acknowledgments

The paper presents the findings obtained through the long-term research programme “Sustainable Forestry and Global Changes” implemented by the Lithuanian Research Centre for Agriculture and Forestry.

Conflicts of Interest

The authors declare no conflict of interest.

References

  1. Zobel, B. Silvicultural effects on wood properties. IPEF International. 1992, 2, 31–38. [Google Scholar]
  2. Wang, X.; Ross, R.J.; McClellan, M.; Barbour, R.J.; Erickson, J.R.; Forsman, J.W.; McGinnis, G.D. Strength and Stiffness Assessment of Standing Trees Using a Nondestructive Stress Wave Technique; Res. Pap. FPL–RP–585; Department of Agriculture, Forest Service, Forest Products Laboratory: Madison, WI, USA, 2000. [Google Scholar]
  3. Beets, P.N.; Kimberley, M.O.; McKinley, R.B. Predicting wood density of Pinus radiata annual growth increments. N. Z. J. For. Sci. 2007, 37, 241–266. [Google Scholar]
  4. Brand, D.G.; Magnussen, S. Asymetric, two-sided competition in even-aged monocultures of red pine. Can. J. Forest Res. 1988, 18, 901–910. [Google Scholar] [CrossRef]
  5. Barron-Gafford, G.A.; Will, R.E.; Burkes, E.C.; Shiver, B.; Teskey, R.O. Nutrient concentrations and contents, and their relation to stem growth, of intensively managed Pinus teada and Pinus elliottii stands of different planting densities. For. Sci. 2003, 49, 291–300. [Google Scholar]
  6. Zhu, J.; Scott, C.T.; Scallon, K.L.; Myers, G.C. Effects of plantation density on wood density and anatomical properties of red pine (Pinus resinosa ait.). Wood Fiber Sci. 2007, 39, 502–512. [Google Scholar]
  7. Will, R.; Hennessey, T.; Lynch, T.; Holeman, R.; Heinemann, R. Effects of planting density and seed source on loblolly pine stands in southeastern Oklahoma. For. Sci. 2010, 56, 437–443. [Google Scholar]
  8. Akers, M.K.; Kane, M.; Zhao, D.; Teskey, R.O.; Daniels, R.F. Effects of planting density and cultural intensity on stand and crown attributes of mid-rotation loblolly pine plantations. For. Ecol. Manag. 2013, 310, 468–475. [Google Scholar] [CrossRef]
  9. Machado, J.S.; Louzada, J.L.; Santos, A.J.A.; Nunes, L.; Anjos, O.; Rodrigues, J.; Simões, R.M.S.; Pereira, H. Variation of wood density and mechanical properties of blackwood (Acacia Melanoxylon R. Br.). Mater. Des. 2014, 56, 975–980. [Google Scholar] [CrossRef]
  10. Moreno-Fernández, D.; Hevia, A.; Majada, J.; Cañellas, I. Do Common Silvicultural Treatments Affect Wood Density of Mediterranean Montane Pines? Forests 2018, 9, 80. [Google Scholar] [CrossRef] [Green Version]
  11. Peltola, H.; Kilpeläinen, A.; Sauvala, K.; Räisänen, T.; Ikonen, V. Effects of early thinning regime and tree status on the radial growth and wood density of Scots pine. Silva Fenn. 2007, 41, 489–505. [Google Scholar] [CrossRef] [Green Version]
  12. Mäkinen, H.; Hynynen, J. Wood density and tracheid properties of Scots pine: Responses to repeated fertilization and timing of the first commercial thinning. Forestry 2014, 87, 437–447. [Google Scholar] [CrossRef] [Green Version]
  13. Mäkinen, H.; Hynynen, J.; Penttilä, T. Effect of thinning on wood density and tracheid properties of Scots pine on drained peatland stands. Forestry 2015, 88, 359–367. [Google Scholar] [CrossRef]
  14. Jaakkola, T.; Mäkinen, H.; Saranpää, P. Wood density in Norway spruce: Changes with thinning intensity and tree age. Can. J. For. Res. 2005, 35, 1767–1778. [Google Scholar] [CrossRef]
  15. Jaakkola, T.; Mäkinen, H.; Saranpää, P. Wood density of Norway spruce: Responses to timing and intensity of first commercial thinning and fertilisation. For. Ecol. Manag. 2006, 237, 513–521. [Google Scholar] [CrossRef]
  16. Linkevičius, E.; Kuliešis, A.; Rohle, H.; Schroder, J.; Aleinikovas, M. The Impact of Competition for Growing Space on Diameter, Basal Area and Height Growth in Pine treles. Balt For. 2014, 20, 301–313. [Google Scholar]
  17. Hébert, F.; Krause, C.; Plourde, P.; Achim, A.; Prégent, G.; Ménétrier, J. Effect of Tree Spacing on Tree Level Volume Growth, Morphology, and Wood Properties in a 25-Year-Old Pinus banksiana Plantation in the Boreal Forest of Quebec. Forests 2016, 7, 276. [Google Scholar] [CrossRef] [Green Version]
  18. Høibø, O.; Vestøl, G.I.; Fischer, C.; Fjeld, L.; Øvrum, A. Bending properties and strength grading of Norway spruce: Variation within and between stands. Can. J. Forest Res. 2014, 44, 128–135. [Google Scholar] [CrossRef]
  19. Ruso, D.; Marziliano, P.A.; Macri, G.; Proto, A.R.; Zimbalatti, G.; Lombardi, F. Does Thinning Intensity Affect Wood Quality? An Analysis of Calabrian Pine in Southern Italy Using a Non-Destructive Acoustic Method. Forests 2019, 10, 303. [Google Scholar] [CrossRef] [Green Version]
  20. Hautamäki, S.; Kilpeläinen, H.; Verkasalo, E. Factors and Model for Bending Properties of Sawn Timber from Finland and North-Western Russia. Part I: Norway Spruce. Balt For. 2013, 19, 106–119. [Google Scholar]
  21. Hautamäki, S.; Kilpeläinen, H.; Verkasalo, E. Factors and Model for Bending Properties of Sawn Timber from Finland and North-Western Russia. Part II: Scots Pine. Balt For. 2014, 20, 142–156. [Google Scholar]
  22. Verkasalo, E.; Leban, J.M. MOE and MOR in static bending of small clear specimens of Scots pine, Norway spurce and European fir from Finland and France and their prediction for the comparison of wood quality. Pap. Puu-Pap Tim. 2002, 84, 332–340. [Google Scholar]
  23. Jiang, Z.; Wang, X.; Fei, B.; Ren, H.; Liu, X. Effect of stand and tree attributes on growth and wood quality characteristics from a spacing trial with Populus xiaohei. Ann. For. Sci. 2007, 64, 807–814. [Google Scholar] [CrossRef] [Green Version]
  24. Johansson, K. Influence of initial spacing and tree class on the basic density of Picea abies. Scand. J. For. Res. 1993, 8, 18–27. [Google Scholar] [CrossRef]
  25. Lassere, J.P.; Mason, E.G.; Watt, M.S. Influence of genotype and spacing on Pinus radiata [D. Don] corewood stiffness in an 11-year old experiment. For. Ecol. Manag. 2005, 205, 375–383. [Google Scholar] [CrossRef]
  26. Rais, A.; Poschenrieder, W.; Pretzsch, H.; van de Kuilen, J.-W.G. Influence of initial plant density on sawn timber properties for Douglas-fir (Pseudotsuga menziesii (Mirb.) Franco). Ann. For. Sci. 2014, 71, 617–626. [Google Scholar] [CrossRef]
  27. Simic, K.; Gendvilas, V.; O’Reilly, C.; Nieuwenhuis, M.; Harte, A.M. The Influence of Planting Density on Modulus of Elasticity of Structural Timber from Irish-Grown Sitka Spruce. Int. J. Des. Nat. Ecodyn. 2017, 12, 438–447. [Google Scholar] [CrossRef] [Green Version]
  28. Stöd, R.; Verkasalo, E.; Heinonen, J. Quality and Bending Properties of Sawn Timber from Commercial Thinnings of Scots Pine (Pinus sylvestris L.). Balt. For. 2016, 22, 148–162. [Google Scholar]
  29. Baltrušaitis, A.; Mišeikytė, S. Strength and Stiffness Properties of the Lithuanian Grown Scots Pine (Pinus Sylvestris): Non-destructive Testing Methods vs. Static Bending. Wood Res. 2011, 56, 157–168. [Google Scholar]
  30. Baltrušaitis, A.; Aleinikovas, M. Early-stage Prediction and Modelling Strength Properties Lithuanian-Grown Scots Pine (Pinus sylvestris L.). Balt. For. 2012, 18, 327–333. [Google Scholar]
  31. Lithuanian Hydrometeorological Service under the Ministry of Environment. Climate Atlas of Lithuania; Petro ofsetas: Vilnius, Lithuania, 2013.
  32. Ministry of Environment, State Forest Service. Lithuanian Statistical Yearbook of Forestry; Butkus, A., Dumčienė, V., Eigirdas, M., Kuliešis, A., Vižlenskas, D., Eds.; Lututė: Kaunas, Lithuania, 2017.
  33. Kuliešis, A.; Saladis, J. The effect of early thinning on the growth of pine and spruce stands. Balt. For. 1998, 1, 8–16. [Google Scholar]
  34. Vaičys, M.; Karazija, S.; Kuliešis, A.; Rutkauskas, A. Miškų Augavietės [Forest Sites]; Lututė: Kaunas, Lithuania, 2006; p. 95. (In Lithuanian) [Google Scholar]
  35. World Reference Base for Soil Resources. International Soil Classification System for Naming Soils and Creating Legends for Soil Maps; World Soil Resources Reports No. 106; FAO: Rome, Italy, 2014. [Google Scholar]
  36. Hegyi, F. A simulation model for managing Jack-pine stands. In Growth Models for Tree and Stand Simulation; Fries, J., Ed.; Research Note No. 30; Royal College of Forestry, Department of Forest Yield Research: Stockholm, Sweden, 1974; pp. 74–90. [Google Scholar]
  37. EN 408:2006. Timber Structures. Structural Timber and Glued Laminated Timber—Determination of some Physical and Mechanical Properties; European Committee for Standardization: Brussels, Belgium, 2006. [Google Scholar]
  38. EN 384:2016. Structural timber. Determination of Characteristic Values of Mechanical Properties and Density; European Committee for Standardization: Brussels, Belgium, 2016. [Google Scholar]
  39. EN 13183-1. Moisture Content of a Piece of Sawn Timber. Part 1: Determination by Oven Dry Method; European Committee of Standardization: Brussels, Belgium, 2002. [Google Scholar]
  40. EN 338:2009. Structural Timber. Strength Classes; European Committee for Standardization: Brussels, Belgium, 2009. [Google Scholar]
  41. Zobel, B.J.; Buijtenen, J.P. Wood Variation-its Cause and Control; Springer: Berlin/Heidelberg, Germany; New York, NY, USA; London, UK; Paris, French; Tokyo, Japan, 1989. [Google Scholar]
  42. Krajnc, L.; Farrelly, N.; Harte, A.M. The effect of thinning on mechanical properties of Douglas fir, Norway spruce, and Sitka spruce. Ann. For. Sci. 2019, 76, 25–37. [Google Scholar] [CrossRef] [Green Version]
  43. Vincent, M.; Krause, C.; Koubaa, A. Variation in black spruce (Picea mariana (Mill.) BSP) wood quality after thinning. Ann. For. Sci. 2011, 68, 1115–1125. [Google Scholar] [CrossRef]
  44. Moore, J.R.; Lyon, A.J.; Searles, G.J.; Lehneke, S.A.; Ridley-Ellis, D.J. Within-and between-stand variation in selected properties of Sitka spruce sawn timber in the UK: Implications for segregation and grade recovery. Ann. For. Sci. 2013, 70, 403–415. [Google Scholar] [CrossRef] [Green Version]
  45. Aslezaeim, N. Effect of Cultural Intensity and Planting Density on Wood Properties of Loblolly Pine (Pinus taeda L.). Ph.D Thesis, Mississippi State University, Starkville, MS, USA, 2016. [Google Scholar]
  46. Lowell, E.C.; Todoroki, C.L.; Dykstra, D.P.; Briggs, D.G. Linking acoustic velocity of standing Douglas-fir trees to veneer stiffness: A tree-log-product study across thinning treatments. N. Z. J. For. Sci. 2014, 44, 1. [Google Scholar] [CrossRef] [Green Version]
  47. Gil-Moreno, D.; Ridley-Ellis, D.; Harte, A.M. Timber grading potential of Douglas fir in the Republic of Ireland and the UK. Int. Wood Prod. J. 2019, 10, 64–69. [Google Scholar] [CrossRef]
  48. Lei, Y.C.; Zhang, S.Y.; Jiang, Z.H. Models for predicting lumber bending MOR and MOE based on tree and stand characteristics in black spruce. Wood Sci. Technol. 2005, 39, 37–47. [Google Scholar]
  49. Faust, T.D.; McAlister, R.H.; Zarnoch, S.J. Strength and stiffness properties of sweetgum and yellow-poplar structural lumber. For. Prod. J. 1991, 40, 58–64. [Google Scholar]
  50. Castéra, P.; Faye, C.; Ouadrani, A.E. Prevision of the bending strength of timber with a multivariate statistical approach. Ann. For. Sci. 1996, 53, 885–898. [Google Scholar]
  51. Liu, C.; Zhang, S.Y.; Cloutier, A.; Rycabel, T. Modeling lumber bending stiffness and strength in natural black spruce stands using stand and tree characteristics. For. Ecol. Manag. 2007, 242, 648–655. [Google Scholar] [CrossRef]
  52. Yang, K.C.; Hazenberg, G. Impact of spacing on tracheid lenght, relative density, and growth rate of juvenile wood and mature wood in Picea mariana. Can. J. Forest Res. 1994, 24, 996–1007. [Google Scholar] [CrossRef]
Figure 1. Schematic drawing of the sample preparation: approximately 4 to 8 samples were prepared from each log, depending on log diameter.
Forests 11 00587 g001
Figure 2. Mean values of wood density (WD) (a), global modulus of elasticity (MOE) (b), and bending strength (MOR) (c) at the sites with different stand densities. Bars show the std. error of the mean. Different capital letters at the top of the columns show statistically significant differences between the sites at p < 0.05.
Forests 11 00587 g002
Table 1. Characteristics of the study plots chosen within the long-term experimental area established in 1990–1992 [33]. The characteristics given in the table include stand thinnings during the experiment of the full planned duration.
Tree
Species
Stand Age a,
Years
Stand Density b,
Trees ha−1
Stand
Age,
Years
Stand Density,
Trees ha−1
Stand Age,
Years
Stand Density,
Trees ha−1
Stand Age,
Years
Stand Density,
Trees ha−1
Stand Age,
Years
Stand Density,
Trees ha−1
1st Thinning2nd Thinning3rd Thinning4th Thinning5th Thinning
Scots
pine
830001519002112003590050650
82000151200--3590050650
81000----3580050650
Norway
spruce
9310015190021120035100050650
92100151200--3590050650
91100----3590050650
a Stand age at thinning: 8–9-year-old stands were thinned for the first time to initiate the experiment, while 50-year-old stands will be thinned for the last time; for the study presented in this paper, trees were sampled during the 4th thinning, i.e., the effect of the first three thinnings on wood properties was evaluated. b Number of trees in one hectare left after each thinning.
Table 2. Main characteristics, i.e., tree diameter at breast height (DBH), competition index between trees (CI), knot diameter (K), wood density (WD), global modulus of elasticity (MOE), and bending strength (MOR) of model Scots pine and Norway spruce trees at sites with different stand densities.
Stand Density, Trees ha−1VariableMeanStd DevStd ErrorMinimumMaximum
Scots pine
1000DBH, cm18.180.910.116.719.6
CI1.280.360.040.281.87
K, mm18.938.711.18640
WD, kg m−3425.755.36.03284.29676.77
MOE, N mm−25352.281219.97133.112308.258540.63
MOR, N mm−220.816.990.768.7940.28
2000DBH, cm19.513.110.3115.125.7
CI1.150.540.050.322.07
K, mm21.688.40.95743
WD, kg m−3435.141.574.16363.21558.01
MOE, N mm−26232.881530.021533853.4210,877.55
MOR, N mm−222.168.230.827.448.32
3000DBH, cm17.871.420.1515.220.6
CI1.190.460.050.631.98
K, mm17.667.530.96438
WD, kg m−3446.6245.484.77355.4554.49
MOE, N mm−26300.821208.11126.643425.829933.33
MOR, N mm−224.338.120.8511.2148.9
Norway spruce
1100DBH, cm18.951.910.1816.723
CI1.070.460.040.432.16
K, mm14.2740.41434
WD, kg m−3408.0441.773.88315.12541.99
MOE, N mm−27592.131630.79151.414387.8114,136.29
MOR, N mm−228.758.920.8310.8155.66
2100DBH, cm17.860.850.0916.5019.70
CI1.470.520.050.692.19
K, mm13.775.190.572.0041
WD, kg m−3420.7635.733.65299.57523.02
MOE, N mm−28170.181410.01143.915350.8211,903.09
MOR, N mm−229.928.430.8611.7354.85
3100DBH, cm17.980.960.116.419.6
CI1.330.390.040.752.12
K, mm12.783.740.39421
WD, kg m−3430.7839.944.03357.63530.34
MOE, N mm−28682.91882.47190.164993.713,355.48
MOR, N mm−233.0610.911.115.0959.13
Table 3. Theoretical strength classes of Scots pine and Norway spruce wood samples at the sites with different stand densities (EN 338:2009).
SpeciesStand Density,
Trees ha−1
MOE,
N mm−2
MOR 5%,
N mm−2
WD 5%,
kg m−3
Strength
Class
Samples
Rejected for C14, %
Scots Pine30006418.712.9372.8R *72.3%
20006147.411.5372.7R78.7%
10005352.311.6358R89.3%
Norway Spruce31008682.916.7373.5C16-
21008170.218368.7C16-
11007592.113.8345.8R5.2%
* R—samples rejected in order to meet the requirements for the C14 strength class.
Table 4. Correlation coefficients and probability (in the line below) among tree characteristics and wood quality parameters for the model Scots pine trees, n = 275.
SD *LHCIDBHKWDMOEMOR
SD 0.016−0.079−0.063−0.0670.1740.2680.177
10.790.190.300.35<0.05<0.0001<0.05
LH0.016 −0.00030.0530.108−0.1770.133−0.114
0.79 0.990.380.13<0.05<0.050.06
CI−0.079−0.0003 −0.350−0.1690.0170.1080.075
0.190.99 <0.0001<0.050.780.070.21
DBH−0.0630.053−0.350 0.316−0.094−0.092−0.168
0.300.38<0.0001 <0.00010.120.13<0.05
K−0.0670.108−0.1690.316 0.016−0.172−0.447
0.350.13<0.05<0.0001 0.82<0.05<0.0001
WD0.174−0.1770.017−0.0940.016 0.1820.207
<0.05<0.050.780.120.82 <0.05<0.05
MOE0.2680.1330.108−0.092−0.1720.182 0.716
<0.0001<0.050.070.13<0.05<0.05 <0.0001
MOR0.177−0.1140.075−0.168−0.4470.2070.716
<0.050.060.21<0.05<0.0001<0.05<0.0001
* SD, stand density; LH, log height; DBH, diameter at breast height; K, knot diameter; WD, wood density; MOE, global modulus of elasticity; MOR, bending strength.
Table 5. Correlation coefficients and probability (the line below) among tree characteristics and wood quality parameters for the model Norway spruce trees, n = 310.
SD *LHCIDBHKWDMOEMOR
SD −0.00090.234−0.287−0.1420.2340.2650.184
0.99<0.0001<0.0001<0.05<0.0001<0.0001<0.05
LH−0.0009 0.016−0.0110.1130.1030.3290.222
0.99 0.790.850.070.07<0.0001<0.0001
CI0.2340.0155 −0.214−0.029−0.0870.0040.031
<0.00010.79 <0.050.640.130.940.59
DBH−0.287−0.011−0.214 −0.014−0.233−0.225−0.18
<0.00010.85<0.05 0.82<0.0001<0.0001<0.05
K−0.1420.113−0.029−0.014 0.03−0.229−0.381
<0.050.070.640.82 0.620.0001<0.0001
WD0.2340.103−0.087−0.2330.03 0.4020.271
<0.00010.070.13<0.00010.62 <0.0001<0.0001
MOE0.2650.3290.004−0.225−0.2290.402 0.769
<0.0001<0.00010.94<0.00010.0001<0.0001 <0.0001
MOR0.1840.2220.031−0.179−0.3810.2710.769
<0.05<0.00010.59<0.05<0.0001<0.0001<0.0001
* SD, stand density; LH, log height; DBH, diameter at breast height; K, knot diameter; WD, wood density; MOE, global modulus of elasticity; MOR, bending strength.
Table 6. The selected models (p < 0.05 for all parameters) determined by the stepwise procedure to describe wood quality characteristics of MOE and MOR in relation to stand and tree characteristics (SD, stand density; LH, log height; DBH, diameter at breast height; K, knot diameter; WD, wood density) in Scots pine and Norway spruce.
ModelR2R2 AjustedRMSECoeficient of Variation
Scots pine
1MOE = 1817.33 + 0.40SD + 763.61LH + 20.74DBH + 219.73CI − 31.83K + 4.73WD + ε0.180.151309.9522.33
2 *MOE = 2501.66 + 0.38SD + 771.52LH − 32.37K + 4.75WD + ε0.170.161306.5122.27
3MOR = 9.14 − 0.0001SD − 2.17LH − 0.12DBH − 0.38CI − 0.27K + 0.007WD + 0.003MOE + ε0.620.614.5721.78
4 *MOR = 9.23 − 2.32LH − 0.27K + 0.004MOE + ε0.620.624.5421.65
Norway spruce
5MOE = 4500.43 + 0.26SD + 967.78LH − 168.35DBH − 6.95CI − 99.96K + 14.32WD + ε0.380.371354.1316.82
6 *MOE = 4479.62 + 0.26SD + 967.42LH − 167.93DBH − 99.97K + 14.34WD + ε0.380.371351.5616.79
7MOR* = 8.41 − 0.0002SD − 0.43LH − 0.24DBH + 0.05CI − 0.47K + 0.001WD + 0.004MOE + ε0.650.645.6919.13
8 *MOR = 3.52 - 0.46K + 0,004MOE + ε0.650.645.6519
* Models No. 2, 4, 6, and 8 show the improved models obtained after eliminating the non-significant parameters.

