Article

The Spread and Role of the Invasive Alien Tree Quercus rubra (L.) in Novel Forest Ecosystems in Central Europe

Institute of Nature Protection and Engineering, University of Bielsko-Biala, 2 Willowa Str, PL-43-309 Bielsko-Biała, Poland
Forests 2020, 11(5), 586; https://doi.org/10.3390/f11050586
Submission received: 16 April 2020 / Revised: 15 May 2020 / Accepted: 21 May 2020 / Published: 23 May 2020
(This article belongs to the Section Forest Ecology and Management)

Abstract

:
Research Highlights: The factors that control the spread and regeneration of Quercus rubra (L.) and the functional diversity of invaded forest were studied in order to indicate the significant role of disturbances in a forest and the low functional richness and evenness of sites that are occupied by red oak. Background and Objectives: Red oak is one of the most frequent invasive trees from North America in Central Europe. It is also one of the most efficient self-regenerating invasive alien species in forests. The main goal of the study is to identify the characteristics of forest communities with a contribution of Q. rubra, and to assess its role in shaping the species diversity of these novel phytocoenoses. Materials and Methods: A total of 180 phytosociological records that have a share of Q. rubra in southern Poland were collected, including 100 randomly chosen plots from which soil samples were taken. In addition, vegetation sampling was performed in 55 plots in the vicinities that were uninvaded. Results: The probability of the self-regeneration and cover of Q. rubra seedlings depends mainly on the availability of maternal trees, and the abundance of seedlings was highest in cutting areas. The vegetation with Q. rubra differed in the plant functional types and environmental factors. According to the three-table ordination method, while the cover of red oak only affected the canopy of the remaining species, a comparison of the invaded and uninvaded plots demonstrated that the sites that were occupied by Q. rubra had lower values of functional richness and evenness, thus indicating higher habitat filtering and a lower importance of competition. Conclusions: Forest management practices play the most crucial role in the self-regeneration and occurrence of Q. rubra. However, the role of red oak in shaping the species composition and functional diversity is rather low.

1. Introduction

Among invasive alien species, woody plants, including trees, are a specific group that comprise a substantial proportion of invasive species worldwide [1]. Forestry and horticulture are the main causes of the invasion success of this group of plants [2]. However, there is a lack of case studies that explain all of the aspects of the invasiveness of a specific species. A few examples are some cultivated oaks that are native to North America, as well as Quercus palustris Münchh. and Q. rubra (L.) in Europe. The latter has the status of an invasive species in the Czech Republic [3], Slovenia [4], Poland [5], and Lithuania [6]. It is also potentially invasive in Germany [7], Slovakia [8], The Netherlands [9], Belgium [10], and Bulgaria [11]. It is believed to be invasive, sensu Richardson et al. [12], due to its spontaneous spread after its introduction, and has negative impact on native biota, including plants, arthropods, and soil biota [6,9,13,14,15]. This tree was introduced into Europe in 1691 and into Poland in 1798 and 1805 [16,17]. The alien Quercus rubra L. is preferred over native oaks, such as Q. robur L. and Q. petraea (Matt.) Liebl., by European foresters, because of its faster growth (up to 60% higher) compared to indigenous oaks, which thereby yields earlier profits for forestry managers [7,18]. Northern red oak is frequently used to establish silvopastoral systems, because it provides more favourable light conditions in autumn and early spring and shade in autumn, thus contributing to a reduction of evapotranspiration [19,20,21]. It was introduced in the Netherlands and Poland as a good timber-producing tree species on poor, sandy soils [5,7,9]. In its natural range, i.e., throughout eastern North America, its spread is dispersed by jays or red squirrels [22]. In an alien range, the presence of this tree species is the result of cultivation, especially along alleys, and its further spontaneous spread also depends on birds [23], although the precise regeneration mechanisms of the tree species are not fully known. Regeneration may be a crucial factor in the invasion success of northern red oak, and consequently enhances the reduction of native biodiversity by this species. Experiments conducted in Poland have shown that planting late-successional tree species that cast dense shade can hamper the regeneration of red oak [24]. In invaded forests, Q. rubra represents a “conservative strategy”, and usually has higher total biomass and higher root mass fraction than native trees [25]. Although the total forest area that is occupied by this species is relatively low (0.16%), it is present in over 80,000 localities [16]. Due to its high frequency and the resources of this tree in forests in Poland, many forest communities undergo changes that are associated with the impact of this species. The forest communities that can be classified by traditional Braun–Blanquet approach have started to lose their natural physiognomy and functionality over time. Instead of natural and semi-natural forests, novel forest communities have been formed. Such forests can be more species-poor than natural forests, and are characterised by a lower functional diversity. They are more similar to forest croplands and tree monocultures than to spontaneously developed forests. The main goal of the study is to identify the characteristics of forest communities that have a contribution of Q. rubra, and to assess the role of this species in shaping the species diversity and functional diversity of these novel phytocoenoses. The following hypotheses were formulated: (1) disturbances in forest areas are more important for the self-regeneration of red oak than the type of habitat; (2) the diversity of Q. rubra phytocoenoses is rather functional diversity, which ranges across the trophy gradient; (3) because red oak has an impact on the plant traits of the native species, it negatively affects the functional diversity within a community; and (4) non-invaded phytocoenoses are characterised by a higher functional diversity than those that have been invaded by Q. rubra.

2. Materials and Methods
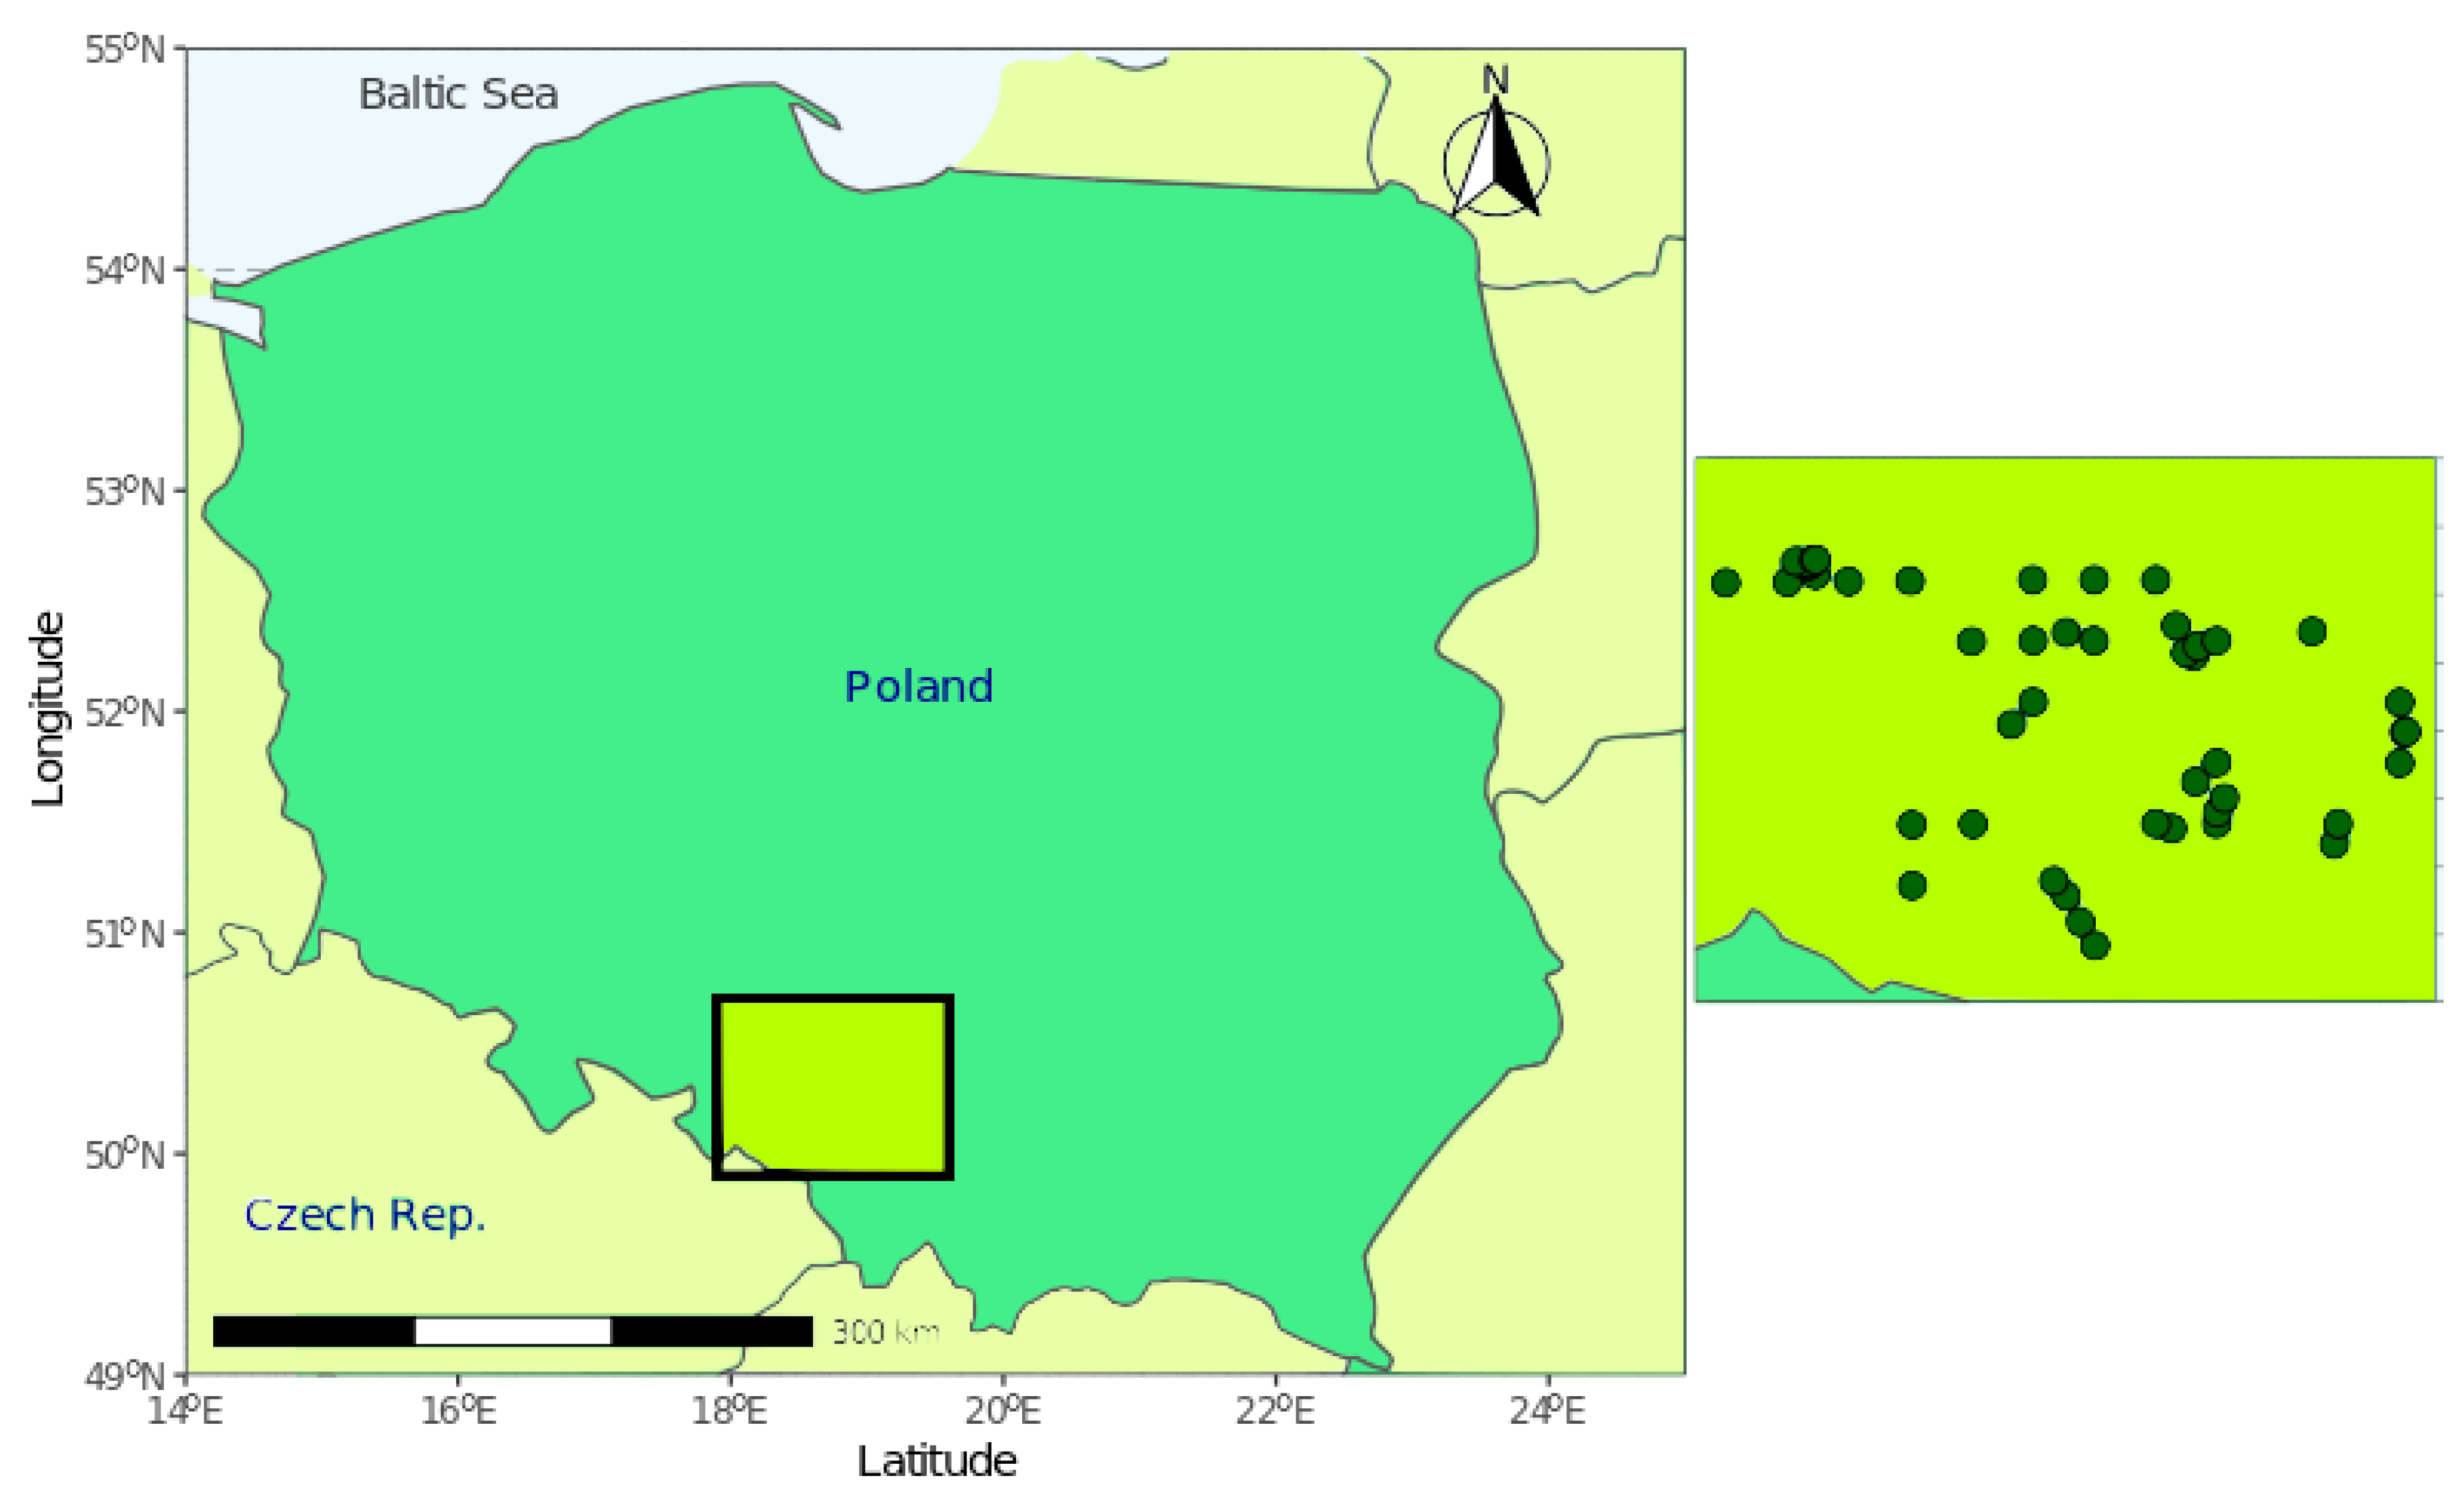
2.1. Study Area

The Silesian Upland (Figure 1), which is situated in southern Poland, forms a macroregion that occupies an area of approximately 4000 km2. According to the division of Poland into physical–geographical regions [25], the Silesian Upland consists of the following five mezoregions: the Chełm Ridge (50°27′57″ N, 18°21′04″ E), the Tarnowskie Góry Ridge (50°25′01″ N, 19°05′03″ E), the Katowice Upland (50°18′59″ N, 18°56′58″ E), the Jaworzno Hills (50°10′20″ N, 19°19′05″ E), and the Rybnik Plateau (50°06′59″ N, 18°31′59″ E). The carboniferous formations that form the basic geological structure of the region are covered with Triassic and Jurassic deposits in the northern and eastern parts of the region [26]. Quaternary deposits, which are sometimes several metres thick, are the remnants of two glaciations [27,28]. The water divide between the catchment basins of the two major rivers of Poland runs through the study area. The western part belongs to the basin of the Oder River, and the southeastern belongs to the basin of the Vistula River. The diversity of its natural resources has determined the way in which the region developed. The most important mineral, past and present, has been black coal (the Rybnik Plateau and Katowice Upland), as well as silver, lead, and zinc ore (the Tarnowskie Góry Ridge and the Jaworzno Hills). The processing industries that are connected with their exploitation also developed here. Some other important mineral resources are dolomites, sand, gravel, and clay. Because of the intense industrial activity, many different anthropogenic morphological forms have developed, including coal and heavy metal spoils, sand and clay pits, quarries, subsidence, and depressions of the surface. The urban–industrial activity is concentrated in the central and southwestern part of the Silesian Upland (the Katowice Upland, the Rybnik Plateau, and part of the Tarnowskie Góry Ridge), while in the western and northern part of the region, agricultural and forest areas still prevail [29].

2.2. Data Collection

This study is based on data that was collected mainly during the vegetation seasons of 2008–2011, and which was completed in 2017–2019. A total of 54 forest complexes of the Silesian Upland were searched for presence/absence data for Q. rubra (L.). In the end, the species was found in 47 of the forests (Figure 1). The sites were selected using a stratified random sampling, in order to cover all five of the mesoregions and the types of forests. The search for Q. rubra stands within a forest complex was random.
Fieldwork was carried out in the following types of habitats in forested areas, and was distinguished based on the type of disturbance, i.e., its natural or anthropogenic character:
  • Forest interiors: dense patches of a forest community at least 50 m away from any disturbed sites, e.g., forest roadsides and margins;
  • Forest roadsides: non-forest habitats that are associated with transport routes (forest paths, edges of roads, and railways). In addition, fringes of drainage and fire-control ditches were included;
  • Forest margins: non-forest habitats of a natural or semi-natural origin (borders of a forest area, contact zones with meadows, grasslands and scrub communities, or a contact zone with arable fields). These habitats differ from forest roadsides, due to the fact that the forest habitat is present only on one side;
  • Cutting areas: clearings, forest meadows, woodland glades, felling sites, and ruderal sites (dumping sites).
This classification is based on land use in forest areas. It corresponds with the classification of habitats that was used by Pyšek et al. [30]. In the present study, these are referred to as forest habitats. The second classification of forests is associated with the forest site types [31], including the type of soil, the granulometric composition of the soil, soil origin, moisture, trophy, the content of humus, and the dominant overstory species, for which a modified and simplified classification was used.
All of the stands were divided into four types, which are referred to as forest site types: deciduous forests (fresh and moist broad-leaved forests, wet deciduous forests, alder forests), mixed deciduous forests (fresh and wet mixed deciduous forests), coniferous forests (fresh and wet coniferous forests), and mixed coniferous forests (fresh and wet mixed deciduous forests, as well as all of the disturbed mixed coniferous forests).
The presence of the species within a given site was recorded for each habitat type. Independent of which type of habitat or in which phase of the life-cycle Q. rubra was recorded, it was regarded as a stand of the species. Individuals of Q. rubra were divided into three categories and defined as seedlings and small saplings (the presence of Northern red oak in the herb layer; saplings; large saplings or small trees (its presence in the shrub layer and mature trees, as well as its presence in the tree layer, including both blooming and fruiting individuals and non-fruiting individuals). In a stand of northern red oak, its abundance was estimated visually using the percent scale: 0%, 2%, 5%, 10%, 20%, …, 100%. Its abundance was assessed in a sample 10 m × 10 m plot for the forest interiors and in plots of mostly linear shapes that had been established in other habitats (forest roads, paths, forest margins, and cutting areas), which were 4 m × 25 m belts and had an approximate area of 100 m2. In the forest interiors, the cover abundance of other species was also estimated for each species that was present on a site.
For the complete phytosociological data set, community-weighted means of the Ellenberg indicator values (EIVs) were computed for light (L), temperature (T), soil moisture (F), soil reaction (R), and nitrogen (N), according to [32]. The plant traits were also collected for all of the species that were present in the phytosociological records. These were seed mass, specific leaf area (SLA), leaf dry mass, seed dispersal syndrome (wind, zoochory, autochory), perennial vs. annual nature, and competition, based on the Grime strategy. The data were collected from the LEDA Traitbase: database of life-history traits of the Northwest European flora [33] and Grime et al. [34] (Table 1).
Of the 180 plots in the forest interiors, soil samples were taken from 100 plots. In each plot, four subsamples were collected from the corners, and one subsample from the middle of the plot (from 0–10 cm of the topsoil). Next, they were mixed into one composite sample. The following parameters were determined: pH, measured potentiometrically in H2O (ph.aqua) and in KCl; and total organic C (%), according to the Tiurin method (Corg). In addition, loss on ignition (LOS) was determined in a muffle furnace (%), and total N content (NT; %) was assessed using the Kjeldahl method, whereas available magnesium (Mg) was determined using flame atomic absorption spectrometry. Available phosphorus (P) was analysed using the colorimetry method, sodium (Na) and potassium (K) were detected using flame emission spectroscopy, and Ca by spectrophotometry in 1 N ammonium acetate (mg/kg) To characterise the light conditions under the tree canopy layer (openings), a canopy scope was used [35] with our own modifications [36]. The list of environmental variables is shown in Table 1.

2.3. Statistical Analysis

All statistics and visualisations were performed using the R language and environment [37]. To identify the factors that influence the regeneration of Q. rubra (response variable: presence of seedlings), a generalised linear model (GLM) with a binomial distribution, corresponding with the logistic regression with glm () function, was used in the “stats” package. The type of forest habitat, forest site type, and cover of Q. rubra in the tree and shrub layers were also considered to be explanatory variables (covariates). Any interactions between the last two covariates was also determined. In order to examine the significance of the factors that control the cover abundance of Q. rubra seedlings, the same covariates were taken into account in the linear mixed-effect model (LMM) with a Gaussian distribution (“lme4” package) [38]. In addition, in the LMM, the forest complex was considered to be a random effect, and the remaining covariates as fixed effects. In order to select the best-fit models with the lowest corrected Akaike information (AICc) and the lowest delta (Δ), any criterion with Δ < 2 was included using the “dredge” function (“MuMIn” package) [39] (Table A1). The significance of the final model with the presentation of Wald chi-square statistics and p-values of each covariates were done using the “car” package [40]. The Spearman rank correlation test was used to estimate the magnitude of the relationship between the cover of seedlings and the cover of Q. rubra in the shrub and tree layers. The coefficients of the best-fitted models were shown in Table A2 and Table A3.
To explore the diversity of the vegetation that had been invaded by Q. rubra, cluster analysis (CA) was performed. As the distance measures, the Kulczynski index and Ward method were adopted as a way for grouping. The Calinsky–Harabasz criterion enabled the optimal number of clusters to be distinguished (“vegan” package) [41]. The indicatory species for each the vegetation units were determined using an indicator species analysis (ISA) using the “indicspecies” package [42]. The IndVal value and p-values were also computed. In order to assess the relationship between the vegetation diversity and plant traits, as well as the EIVs, a detrended correspondence analysis (DCA) was run as the length of a gradient (expressed as the length of the first axis), and was more than 4.0 Standard Deviation units. The passive projection of species attributes onto ordination was performed using the vector fitting and permutation test (999 iterations, “vegan” package).
In order to estimate the impact of the cover abundance of Q. rubra and other environmental factors on the plant traits of the vegetation that has been invaded by red oak, the three-table ordination method, the so-called “RLQ”, was used with the “ade4” package [43]. This statistical analysis used three tables: the species abundance (L) data, environmental data (R), and the species traits (Q) [44]. Data from 100 plots and 162 species was used as the L matrix, and the R matrix included 16 environmental factors (soil parameters and openings); the cover of Q. rubra in each layer of a community (tree: QR.A, shrub: QR.B, herb layer: (QR.C) and cumulative cover Q.TOT) was added to the R matrix, while it was simultaneously excluded from the L table. The Q matrix contained 14 variables of the 162 species mentioned above (Table 1). The rows of L correspond to the rows of R, and the columns of L correspond to the rows of Q. The significance of the model was tested using fourth-corner statistics with 999 permutations, in order to assess the significance of the link between the environmental variables and plant traits.
Phytosociological records were done in the vicinity of the 55 plots that had been invaded by Q. rubra using the same procedure (100 m2 and the same visual estimates of species cover); however, the sites were not invaded by the species. The components of functional diversity (FD) were computed for all of the paired plots, including functional richness (FRic), functional evenness (FEve), and functional divergence (FDiv) [45], as well as functional dispersion (FDis) using the “FD” package [46]. It was assumed that functional richness (FRic) can be interpreted as a measure of the size of the potentially available, functional space in which niches can be occupied by plants. Therefore, it indicated low habitat filtering. Functional evenness (FEve), which is a measure of niche overlap and functional divergence (FDiv), which is the degree of functional heterogeneity, can be treated as signs of competition in a community [47,48]. The Wilcoxon paired test was used to determine the significance of the differences in the FD components between the plots that had been or had not been invaded by Q. rubra.

3. Results

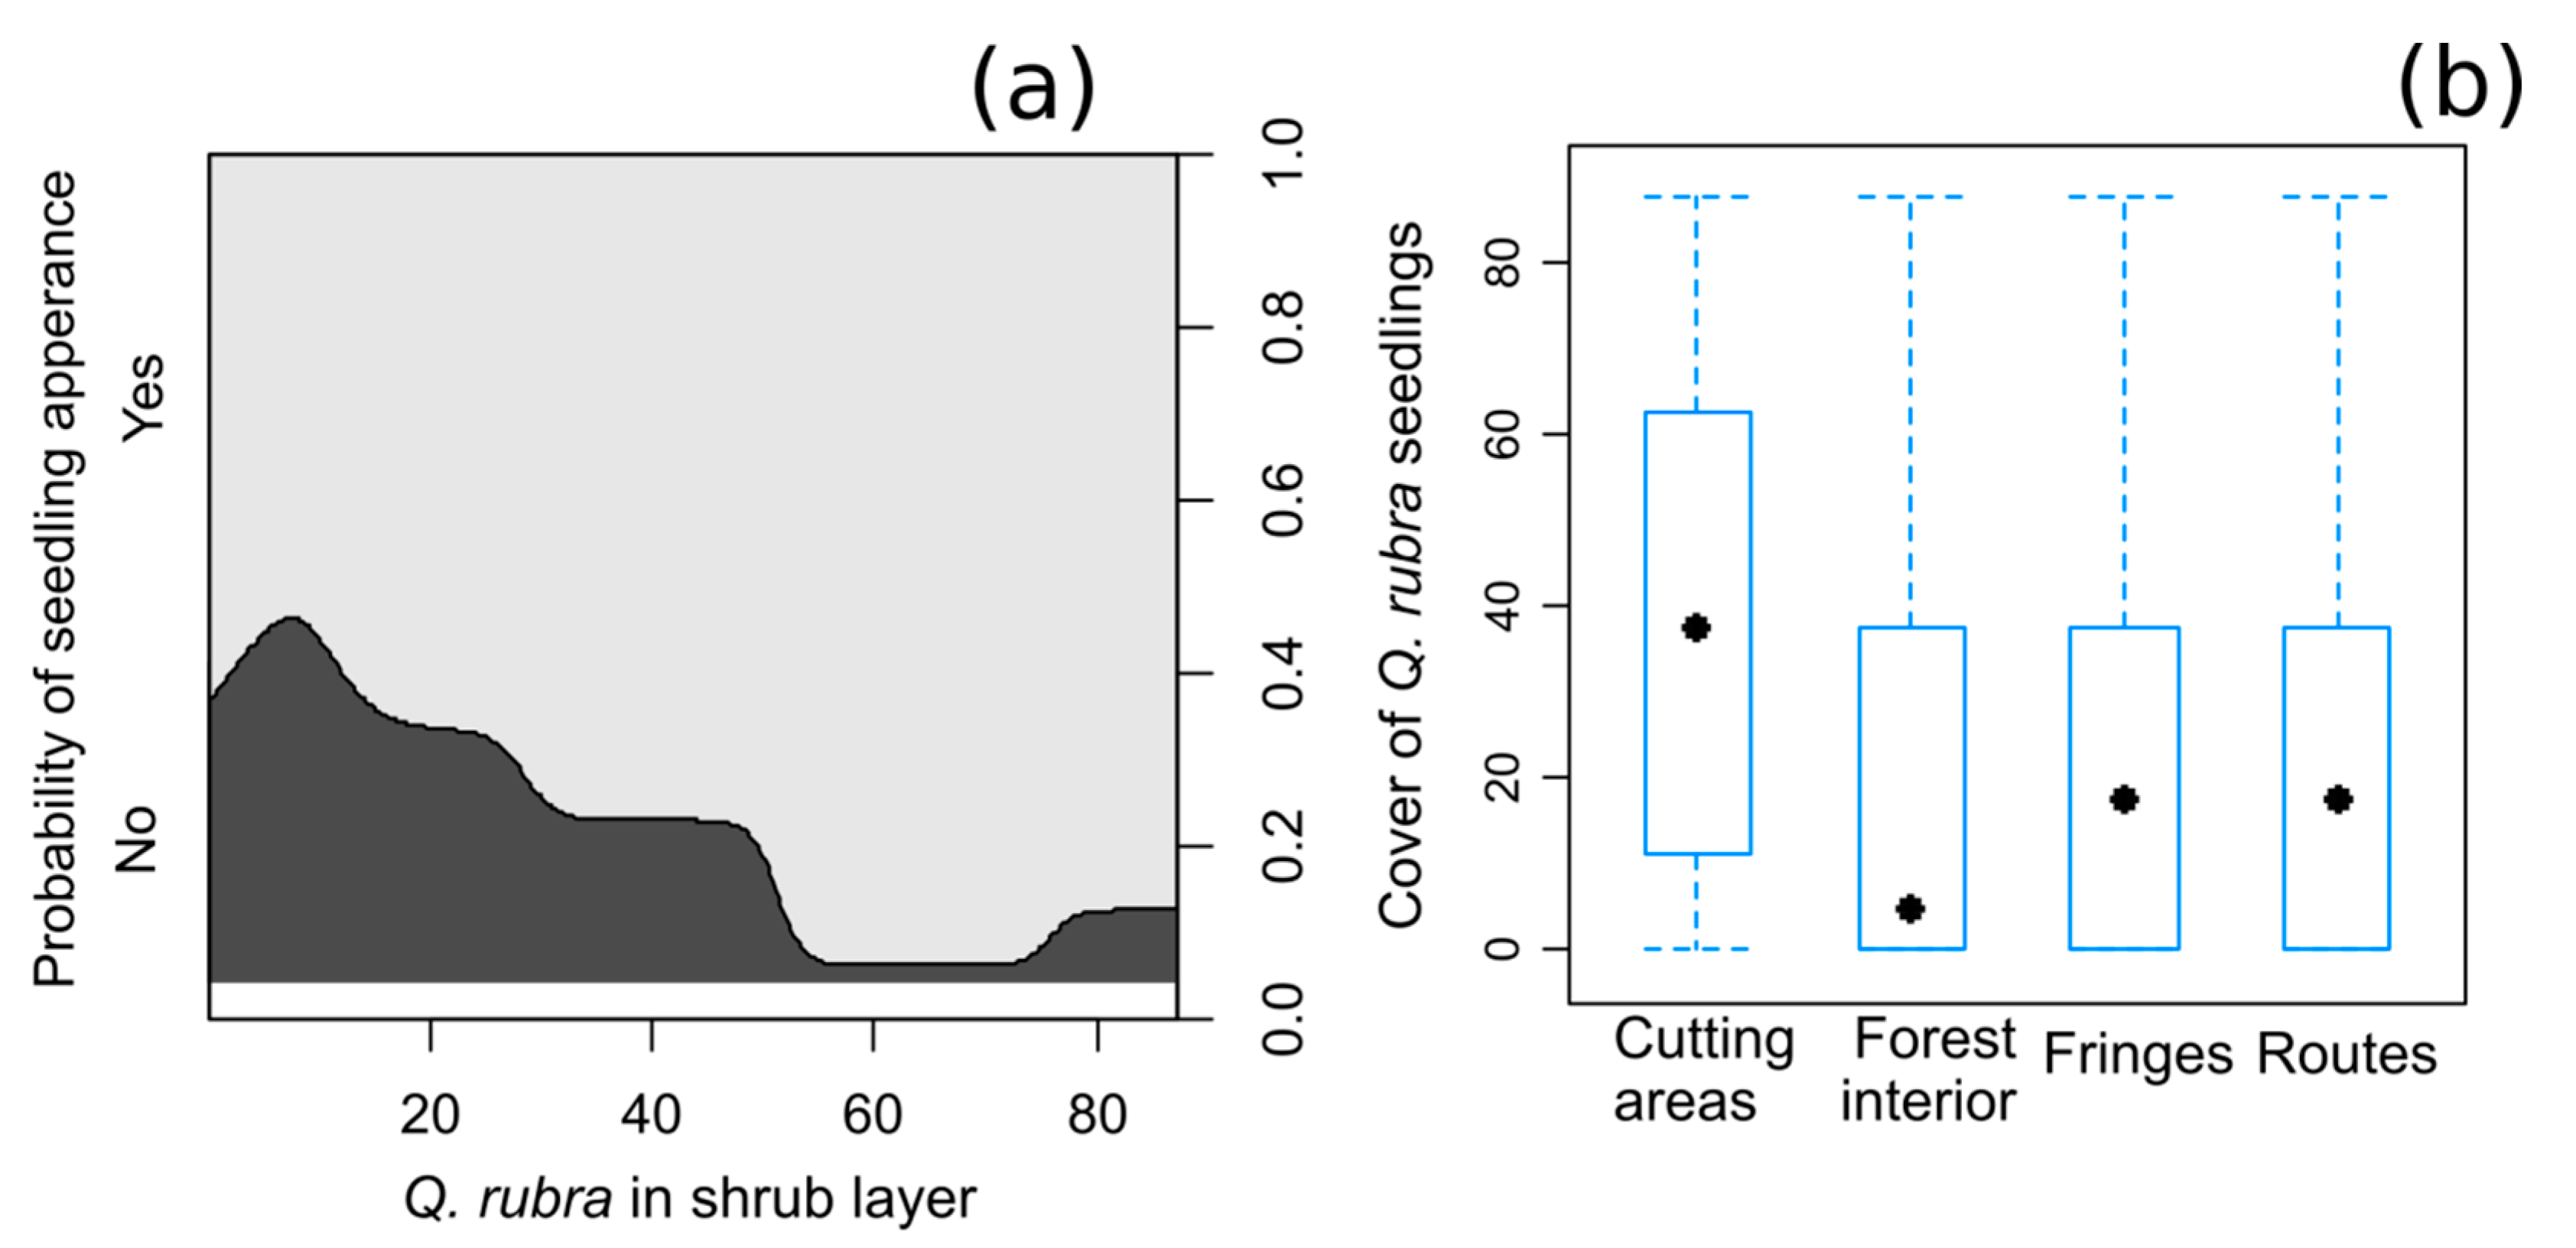
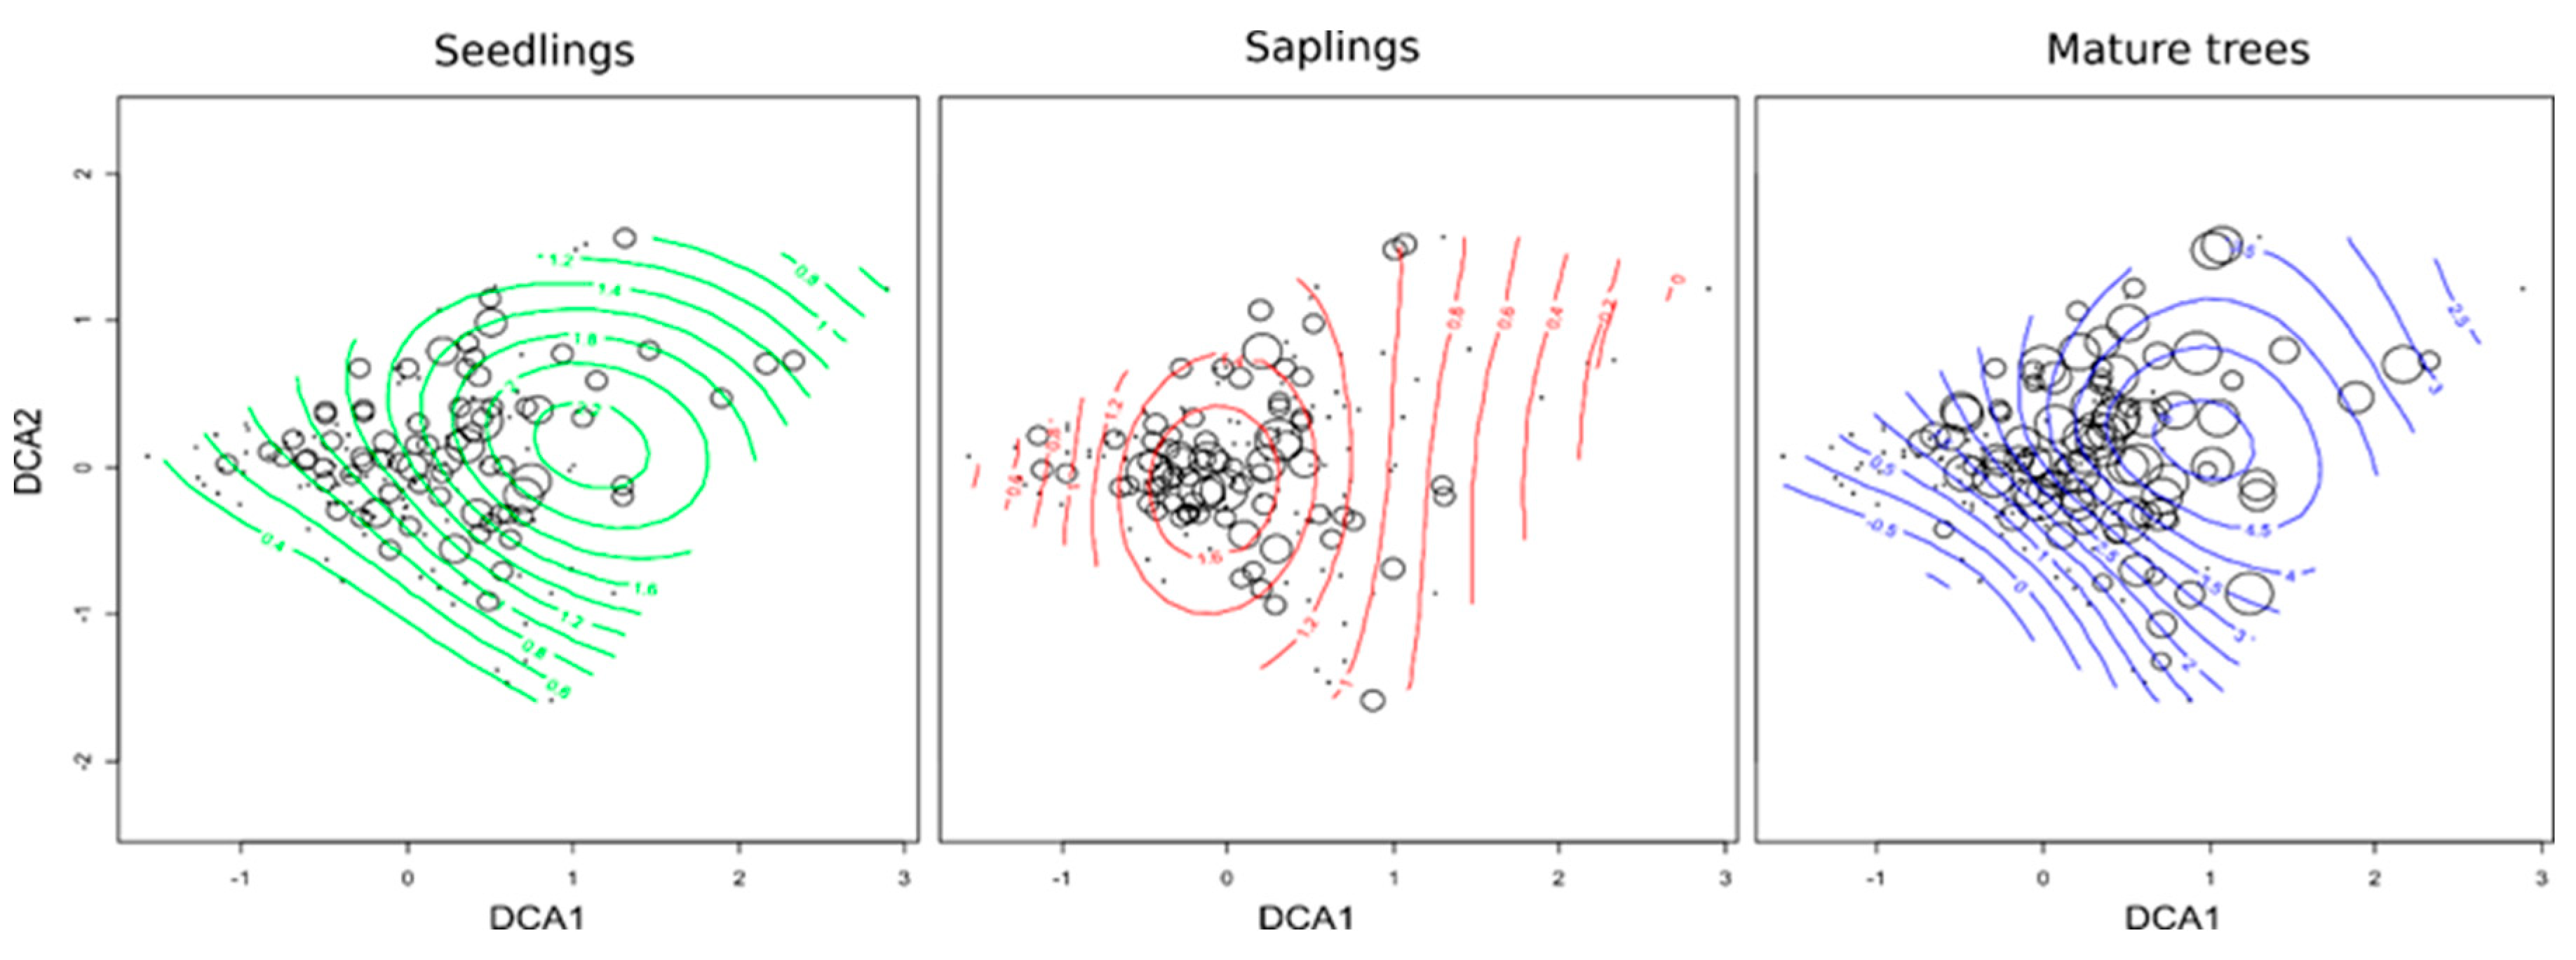
3.1. The Factors that Control the Regeneration and Abundance of Q. rubra Seedlings

Both models for regeneration (the presence of Q. rubra (L.) as a seedling) and for the cover abundance of the seedlings showed similar results (Table 2). The probability of the regeneration of Q. rubra was dependent on the cover of saplings and the type of forest habitat that was associated with a disturbance (Hypothesis 1; Table 2). The species tended to regenerate in the presence of Q. rubra in the overstorey, especially in the shrub layer, and the probability of self-regeneration also increased (Figure 2a). As far as the cover abundance of seedlings is concerned, both the cover of mature trees and saplings were significant factors. It was positive relationship, which was confirmed by a weak Spearman rank correlation test (Table 2). The cover of seedlings differed significantly between the types of habitats, and it was the highest in the cutting areas (Figure 2b).

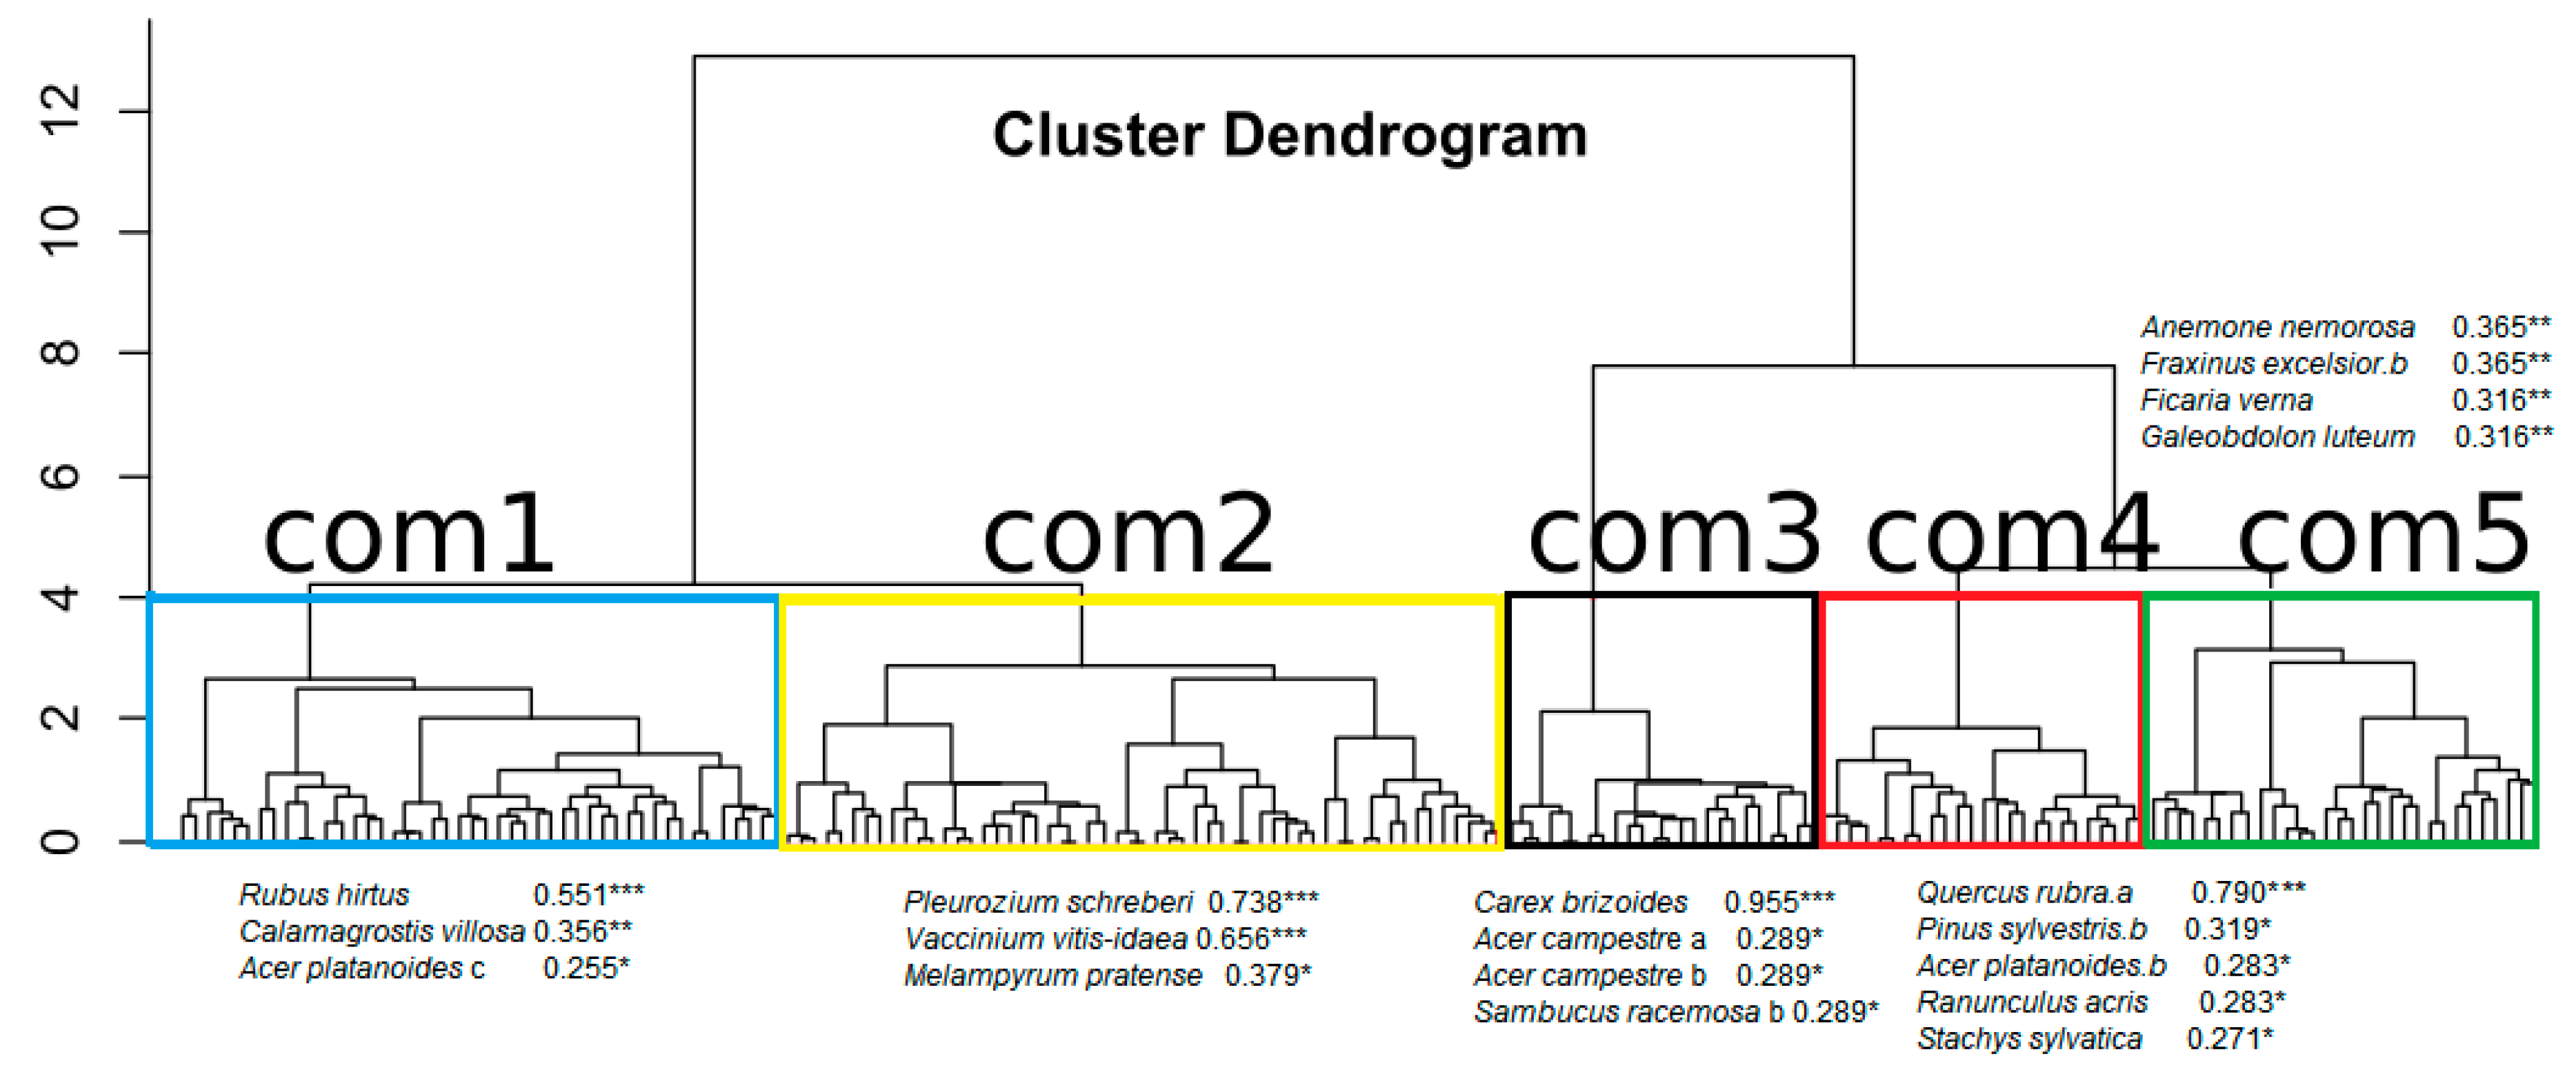
3.2. Functional Diversity of the Forest Communities That Have Q. rubra

The CA revealed five vegetation units that contained 46, 55, 24, 25, and 30 relevés, respectively (Figure 3). Although the total number of recorded species was 198, 43 were indicatory species for the five vegetation groups (communities) and their combinations. Only the indicator species for the main groups are shown in Figure 2. Quercus rubra in the tree layer was an indicator species for vegetation unit number 4, and it had the highest IndVal value amongst the indicator species (Figure 3). Some species were indicatory for more than two communities—e.g., Athyrium filix-femina L. (Roth) (communities 3 and 4), Impatiens parviflora DC. and Fagus sylvatica L. (communities 3 and 5), Pinus sylvestris L. (communities 1 and 2)—whereas Q. rubra in the herb layer was an indicator species for all of them, except for community 5.
A DCA revealed gradient of variation in species composition, mainly along the first axis (Figure 4). The differences in Q. rubra cover in specific layers between the plots are presented in Figure A1. The plots representing communities 2, 1, 4, 5 are located along the first axis, while community three is located along the second axis, which was distinct from the remaining one (r2 = 0.501, p = 0.001) (Table A4). The only significant factors of functional diversity were dispersion (FDis), which explained diversity across communities 1, 2, and 5, and evenness (FEve), across communities 1, 4, and 5 (Hypothesis 2). The species that are typical for deciduous forests are located on the right side of the plot (Carpinus betulus L., Fraxinus excelsior L., Anemone nemorosa L., Tilia cordata Mill. , and Fagus sylvatica). Below are the invasive (Impatiens parviflora) or native expansive graminoid species (Carex brizoides L., Calamagrostis villosa (Chaix) J. F. Gmel.), as well as some trees and shrubs (Betula pendula Roth, Alnus glutinosa Gaertn., and Sambucus nigra L.). The species that are typical for coniferous forests (Vaccinium vitis-idea L., Pleurosium shreberi (Willd. ex Brid.) Mitt., Melampyrum pratense L., Pyrola rotundifolia L., and Pinus sylvestris) are on the left side of plot.

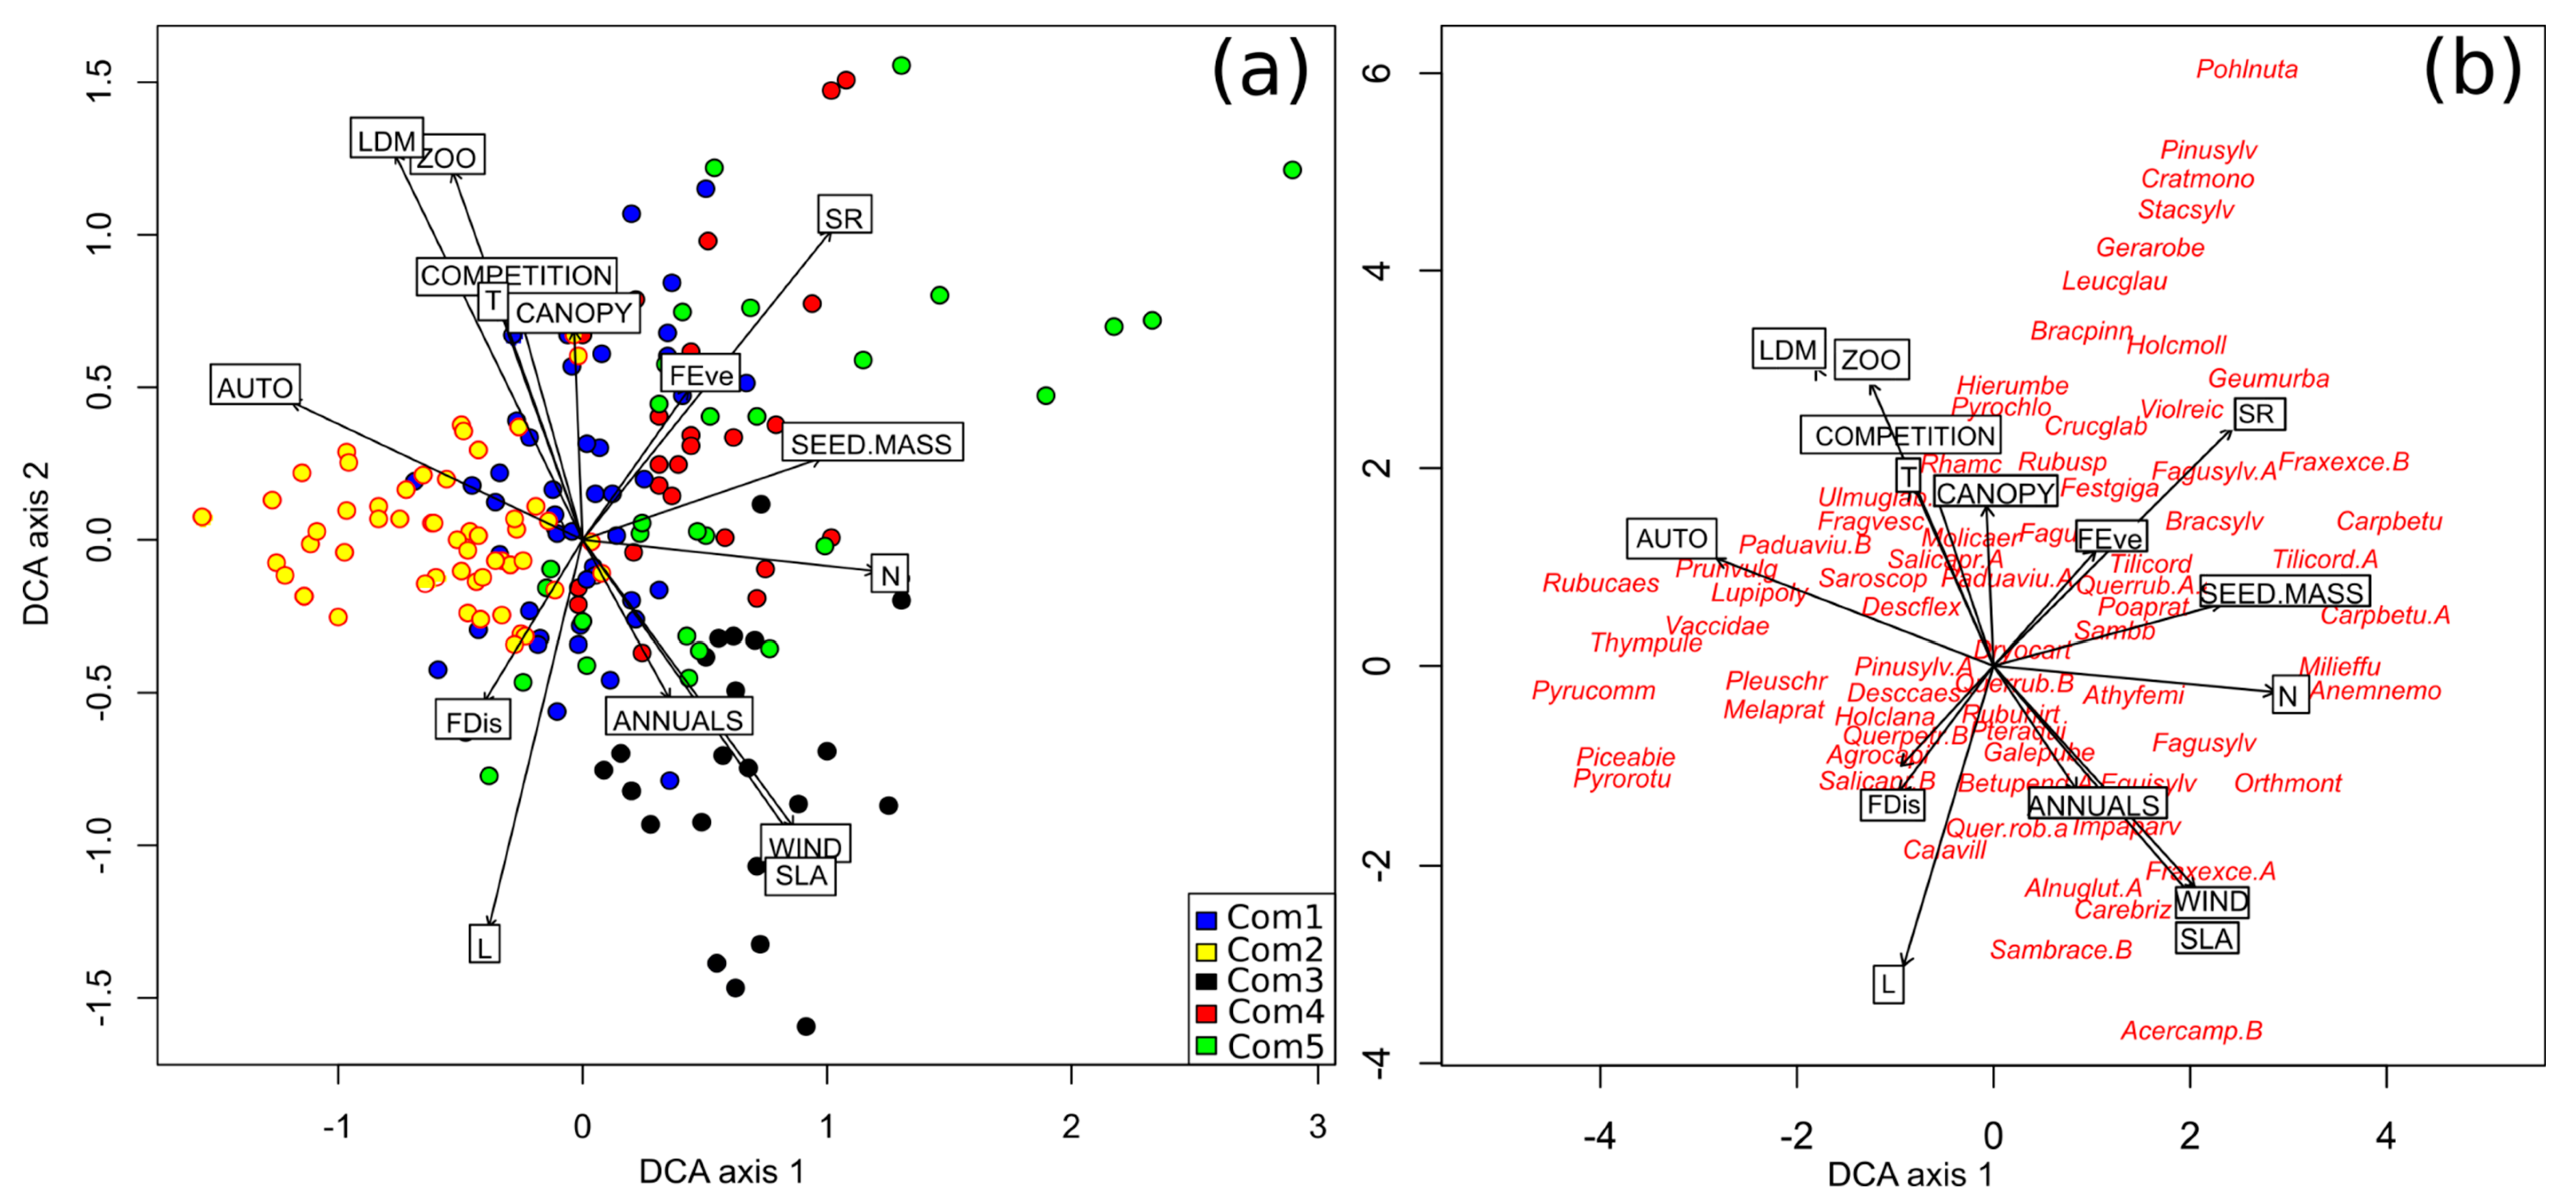
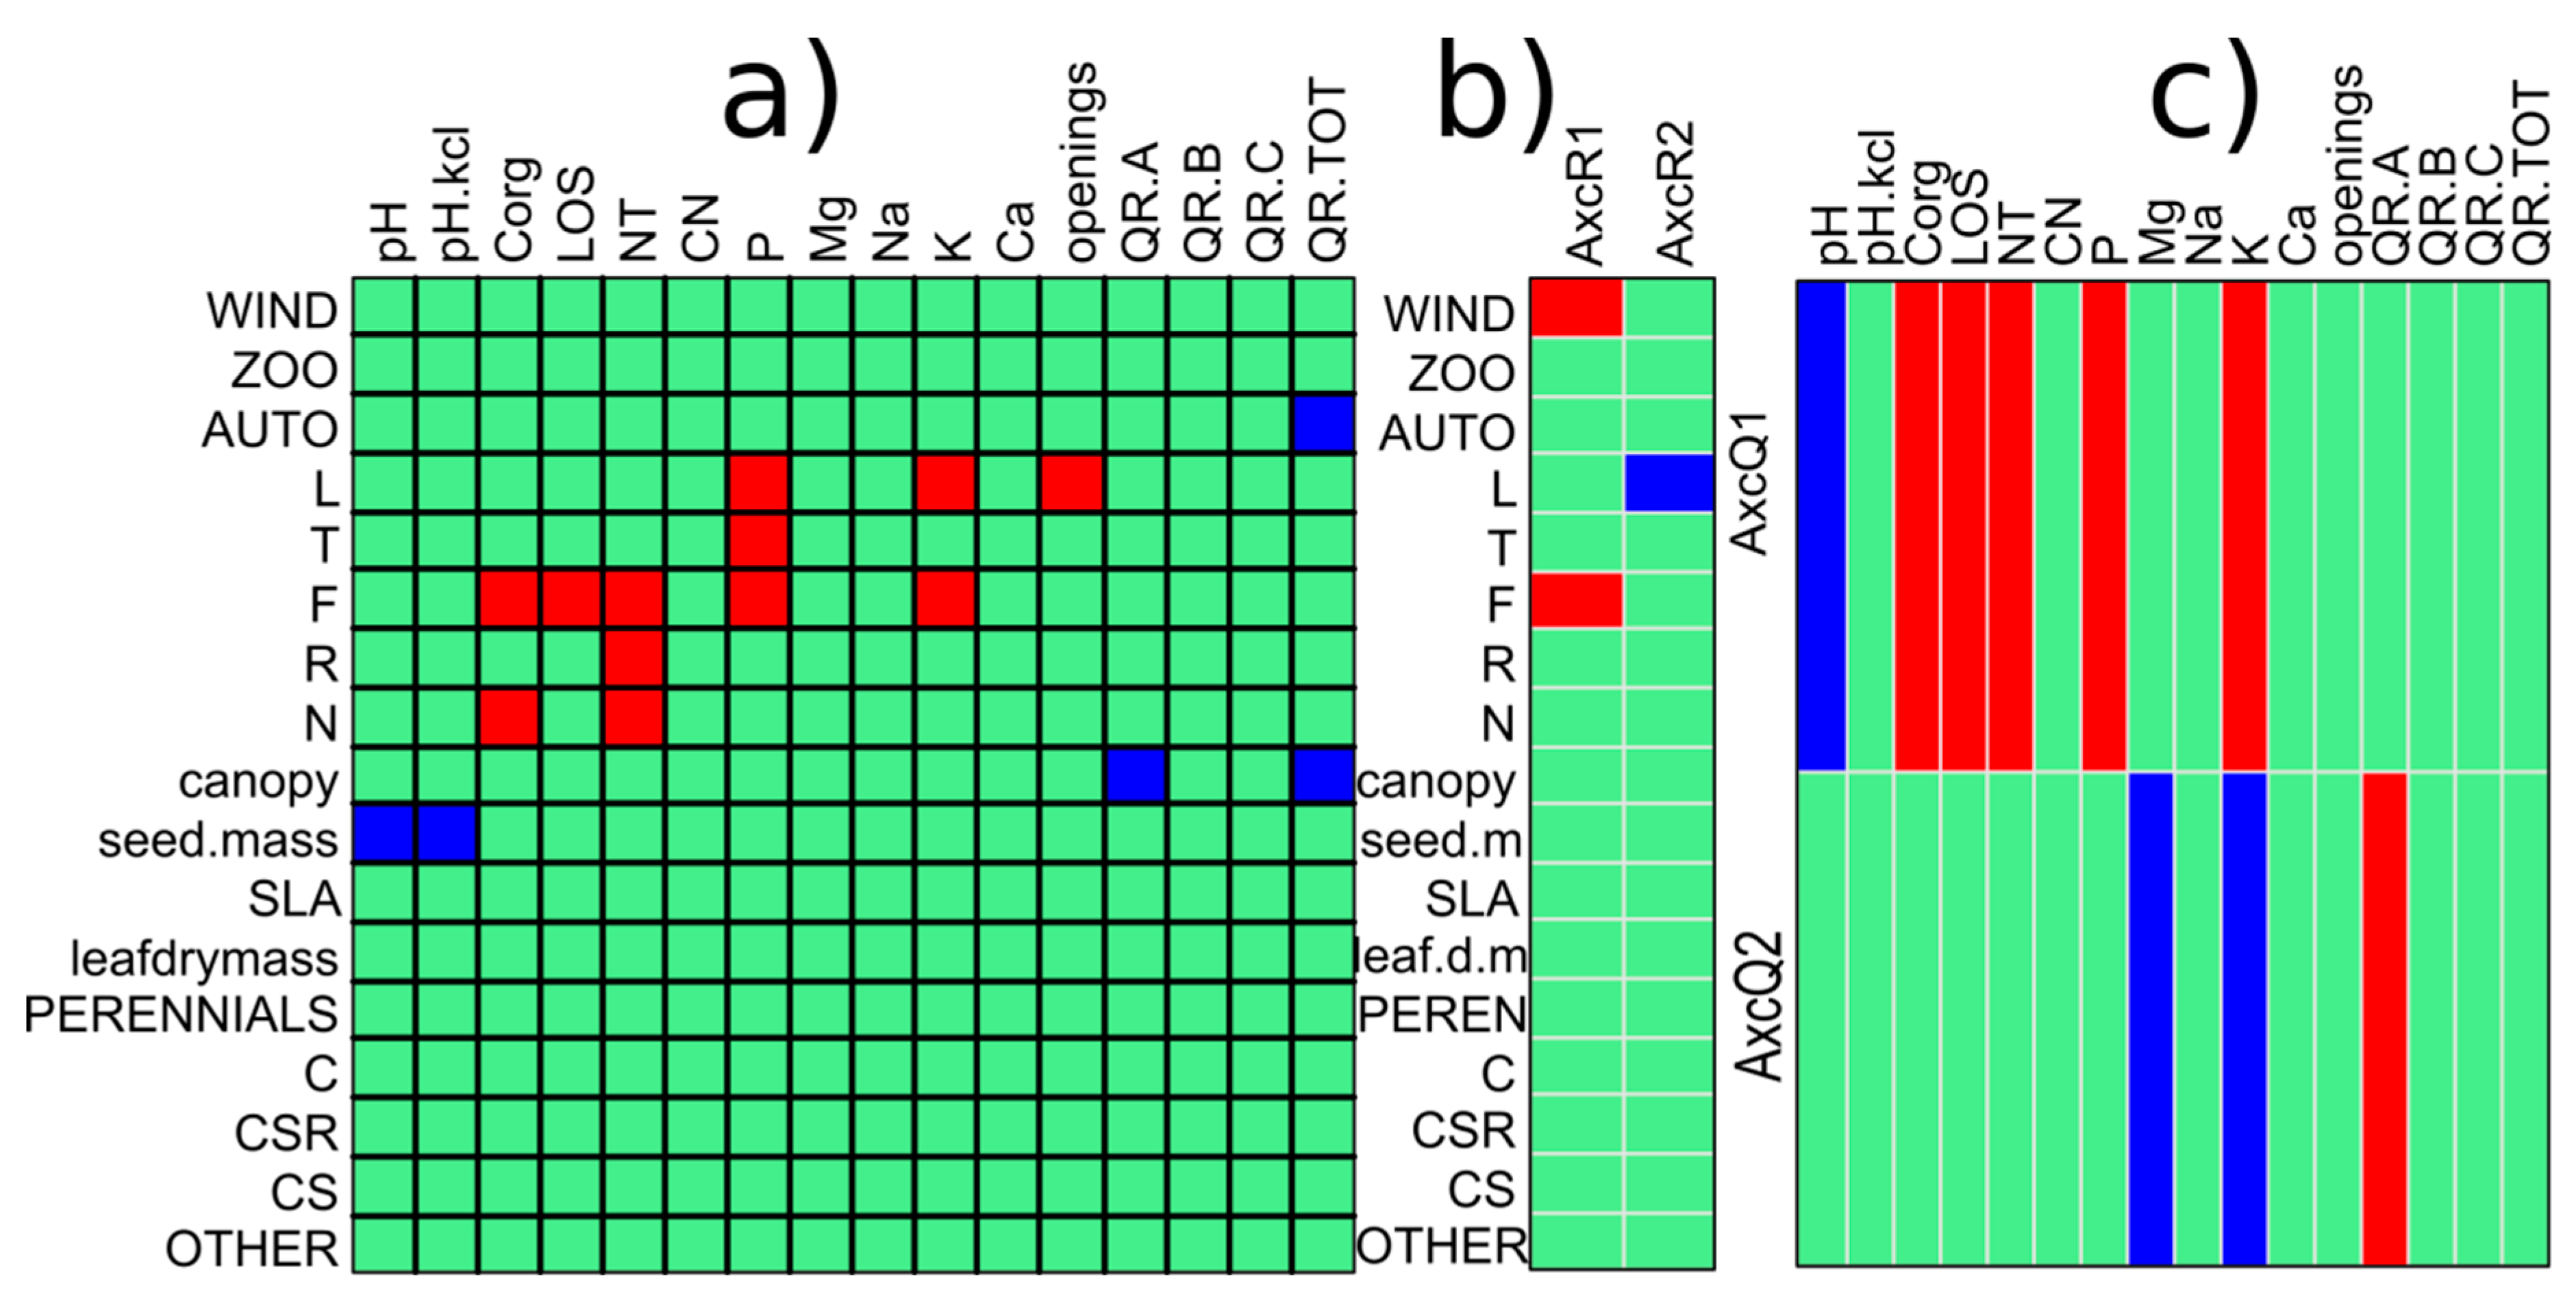
3.3. The Impact of Q. rubra on Plant Traits and the Functional Diversity of the Forest Communities

The species with autochorous strategies were associated with community number 2, whereas the species that have a large seed masses were confined to communities 4 and 5 (Hypothesis 3).
The plots of community number 3 were characterised by species with high SLA and light requirements. Community 1 had species that have a zoochorous strategy and a large competitive strategy. In the upper side, there are the species that occur in mixed coniferous forests (Geranium robertianum L., Stachys sylvatica L., and Leucoubryum glacum Hedw.). The RLQ ordination showed a significant relationship between the environmental variables (matrix R), species traits (matrix Q), and their cover abundance (matrix L). The first two RLQ axes accounted for 68.8% (Table A5) of the overall variation. The relationships between the environmental factors and species attributes (Figure 5a) and for the relationships between the first two RLQ axes (AxR1/AxR2, Figure 5b; AxQ1/AxQ2, Figure 5c) and the plant traits and environmental variables, respectively, indicated several significant associations, according to a fourth-corner analysis. Seed mass was negatively associated with pH and a canopy that has a cover of Q. rubra trees. The Ellenberg indicators for light were positively associated, among others, with canopy openings; the EIV for nitrogen (N) and moisture (F) were associated with the total nitrogen content and organic carbon. The autochorous species were negatively associated with the total cover of Q. rubra (Figure 5a).

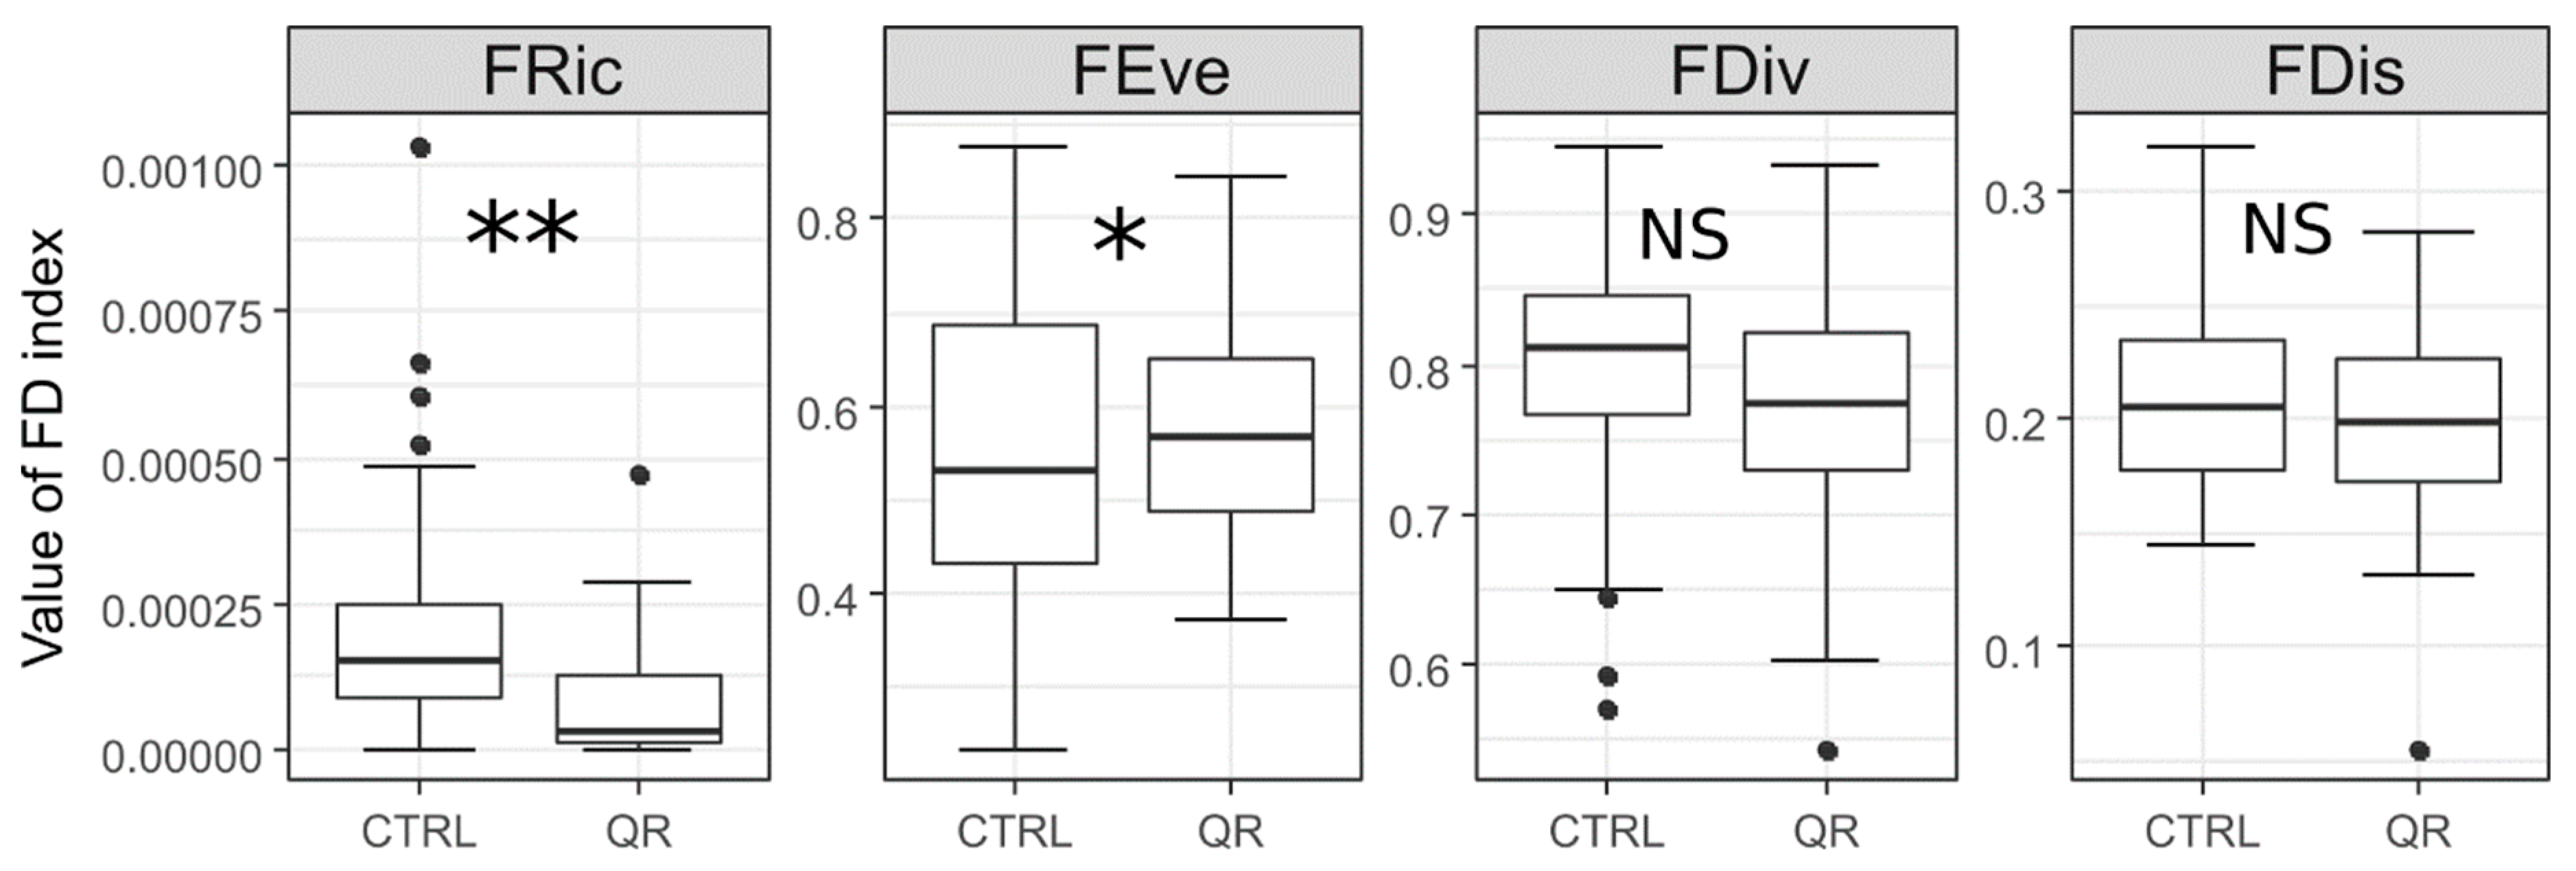
3.4. A Comparison of the Functional Diversity of the Invaded and Non-Invaded Forest Communities

Based on a comparison of the adjacent plots, it can be stated that the functional richness of the non-invaded control plots was higher as was the functional evenness (Hypothesis 4, Figure 6). Although the functional divergence was only higher in the plots that had been invaded by Q. rubra, the difference was not significant. In relation to the functional dispersion, it was slightly, non-significantly higher on the control plots only (Figure 6).

4. Discussion

4.1. Influence of Q. rubra in the Overstorey on the Presence and Abundance of Seedlings

A previous study [49] revealed that when red oak grows in a forest at each of its life cycles, it proves that there are favourable conditions for self-regeneration, because it indicates continuous growth. As has been shown elsewhere in the literature, this species is characterised by the high mortality of its seedlings, and therefore only a few individuals become shrubs and mature trees [17,49,50,51]. Although its seedlings and juveniles respond positively to light availability, the response can differ depending on the light gradient or disturbance [6,25,52,53,54,55,56,57,58]. Under favourable, sunny conditions, the juveniles grow rapidly and outcompete other plant species [59], which might explain the highest abundance of red oak seedlings in the cutting areas in this study. The limiting factors for the natural regeneration of a species include plants that have competitive strategies, e.g., shrubs [60]. The cutting areas were the best predictors for the occurrence of the self-regeneration of Quercus rubra L., and also had the highest cover of seedlings, which may be a consequence of the lack of competitor species in the forest and a high light availability. The cover of the mature trees of red oak had also a positive impact on the abundance of seedlings, which was confirmed also by Jagodziński et al. [24,57]. In the Q. rubra-dominated stands, a very high cover of seedlings occurred although almost no shrub individuals were recorded. This proves that self-regeneration is a consequence of seedling recruitment in the close vicinity of mother plants. Dispersal that is chiefly via gravity is limited to up to about 15 m from a maternal seed tree [23]. Another possible explanation for the high abundance of red oak seedlings in the cutting areas, fringes, and routes is the forest management practices that were used when this tree species was cultivated as a biocenotic admixture to tree stands. Many studies have shown that northern red oak regenerates better than native oaks and other alien species such as Padus serotine, Robinia pseudoacacia, and Acer negundo, even in protected areas like national parks, where natural old-growth forests prevail [50,61,62,63,64,65]. To sum up, it can be inferred that disturbances, i.e., fragmentation and former cultivation sites, have a greater impact on the regeneration of this species than the type of habitat (in terms of soil and trophy), which is expressed as the forest site type.

4.2. Differences among the Types of Forests That Have a Share of Q. rubra

There have been previous attempts to indicate the forest phytocoenoses that are likely to be invaded by red oak [8,49,66,67,68,69]. It has been found in beech forests, (a Medio-European neutrophile Fagus forest with Pinus sylvestris monocultures [53]), Robinia plantations [8], and even on non-exploited colliery waste tips [70]. In the present study, forests that have a share of red oak can be divided into the two groups of mixed deciduous forest and more coniferous communities; Q. rubra was the dominant species in the tree layer in only one community, where it was accompanied by Pinus sylvestris in the shrub layer. The patches of this phytocoenosis were characterised by higher trophies, which were expressed by the Ellenberg indicator for nitrogen. The species has not been described in terms of its indicator values in Europe [32,71], but only regionally in Czech Republic. Red oak is a moderately nutrient-rich site species that avoids extreme conditions [72]. In communities 1 and 2, which were characterised by more acidity and poorer trophy conditions, Q. rubra was less abundant in the tree layer (Figure A1). This suggests that trophy was a more important factor of the presence and abundance of Q. rubra in the overstorey layer than the gradient of the functional diversity of forests. Thus, Hypothesis 2 was not confirmed. However, according to Otręba and Ferchmin [65], the occurrence of this species is more associated with the decision of foresters to deliberately cultivate Q. rubra in particular soil types than its habitat requirements.
The lowest contribution of Q. rubra, in the forest ground layer of the mixed deciduous forests that had Carex brizoides, could be the effect of the competitive ability of this sedge [73,74]. It has been reported that this native expansive plant hinders the germination of seeds and the establishment of other species in woods, including tree seedlings. The sedge C. brizoides was reported to be a limiting factor for Q. rubra regeneration by other authors [23,54]. A similar situation has been found with shrub species, such as Rubus sp., and Calamagrostis villosa, a perennial grass that occurs quite frequently in the Silesian Upland. This grass can be expansive, and can also be found in different types of forests. A massive amount of grass is a manifestation of the degradation of habitat, which is manifested by the strong development of the grass cover [75,76].

4.3. Role of Red Oak in the Decrease of the Functional Diversity of Forest Communities

Red oak has had a negative impact on the canopy of other species, especially trees and shrubs, which was mainly apparent in regard to the relationship between the cover of Q. rubra in the tree layer and the plant traits of the remaining species in the canopies. Previously [13,14], it was reported that red oak had a negative impact on species richness and the abundance of resident species. Jagodziński et al. [24] demonstrated in detail that its mechanism of competition is mainly via shading, which is connected with a high leaf area index and the fractions of open-canopy light availability in monocultures of Q. rubra [51,56]. The patches were characterised by a positive relationship between the canopy openings and the Ellenberg indicator value for light. According to Woziwoda et al. [14], species that are sensitive to the occurrence of Q. rubra prefer semi-light or even sunny sites. Although the light factor explained the diversity across several types of Q. rubra forests, it was confined to those sites where red oak was not very abundant in the tree layer. The other relationships between the Ellenberg indicator values and soil parameters are well-recognised, e.g., a positive relationship between total nitrogen, organic carbon, and the EIV for N. Seed mass is negatively associated with pH, which can be explained by the fact that trees that have a larger seed mass occur more frequently in more fertile habitats. It could have been expected that as seedlings, red oak would influence the traits of resident species, because Q. rubra seedlings can occur on a massive scale, and sometimes have a negative impact on herbaceous species and tree seedlings. However, it has also been shown that the cover of the seedlings of red oak affect the abundance of species, but not the species richness [13]. Therefore, this is a probable explanation of why Q. rubra in the forest floor did not influence the plant traits of the other components the forest ground flora. Red oak itself only affected the canopy of plants, whereas the remaining dependences of the plant traits can be attributed to other environmental factors. Thus, within a community, an increasing abundance of the species does not affect particular plant traits of the resident species very much. Taking into account the overall situation with traits, i.e., functional diversity, red oak seemed to affect the diversity of the traits in the forest ecosystems. In regard to functional richness and functional divergence, the control patches had significantly higher values. In this case, the lower functional richness in the Q. rubra patches might indicate a higher degree of habitat filtering than in the adjacent sites, as well as a lesser importance of competition in shaping the species composition. This pattern is similar to the findings of [56], who analysed the response of the Q. rubra biomass to the functional components of resident species, but at a lower scale. Their findings on the functional components of an invaded community were similar to those in the present study. With an increasing biomass of Q. rubra, both functional richness and evenness decrease significantly. The obtained results suggest that the differences, both in species composition and functional diversity, are more the effects of the habitat requirements of all of the species that are present in forests than the impact of red oak. Taking into account the short-distance spread of Q. rubra from the cultivation sites, it is difficult to definitively indicate the ability of red oak to invade habitats, or the invasiveness of red oak. As it has been shown [69], the predictors of the invasion level are context-dependent, and they can differ due to the types of vegetation, disturbances, and the history of an area.

Funding

This research was funded by Ministry of Science and Higher Education, grant no. N N304092434.

Acknowledgments

Michele Simmons corrected the text linguistically. I am thankful to the three anonymous reviewers for their thorough and valuable comments on the earlier draft of the manuscript.

Conflicts of Interest

The author declares no conflict of interest.

Appendix A

Table A1. Base and best-fit models of the responses of Quercus rubra regeneration (QR) and Q. rubra seedling cover (QC), with the forest complex being treated as a random effect. The selected models had the lowest corrected Akaike information value (AICc) and the lowest delta value (Δ). GLMM: generalised linear mixed-effect model; LMM: linear mixed-effect model.
Response VariableType of ModelModelAICcΔ
QRGLM (base model)~Mature trees * Saplings + Habitat + Forest site647.53.68
GLM (best-fit model)~Mature trees * Saplings + Habitat644.230.0
QCLMM (base model)~Mature trees * Saplings + Habitat + Forest site + (1|complex)4947.8811.35
LMM (best-fit model)~Mature trees + Saplings + Habitat + Forest site + (1|complex)4936.530.0
Table A2. Coefficients of the best-fit model for the regeneration of Q. rubra. Z-Value (Estimated/Std. Error)—normally distributed Wald statistics.
EstimateStd. ErrorZ-Valuep-Value
(Intercept)1.72770330.77069442.2420.025
Mature trees−0.00112360.0106095−0.106NS
Saplings0.0213470.00763992.7940.0052
Habitat (forest interior)−1.11091730.7816578−1.421NS
Habitat (forest margins)−1.44082690.8467675−1.702NS
Habitat (transport routes)−1.63337830.7752345−2.1070.0351
Mature trees × saplings0.00086910.00051761.679NS
Table A3. Coefficients of the best-fit model for the seedling cover of Q. rubra. T-Value (Estimated/Std. Error)—T-distributed Wald statistics.
EstimateStd. ErrorDFT-Valuep-Value
(Intercept)26.692086.99856500.610023.8140.000154
Mature trees0.451980.07334525.64016.163<0.0001
Saplings0.417740.05835526.116647.16<0.0001
Habitat (forest interior)−17.38536.44975511.40766−2.6960.00726
Habitat (forest margins)−12.175817.43697512.87867−1.637NS
Habitat (transport routes)−18.618286.38134509.44177−2.9180.003683
Forest site (deciduous)7.143144.40885391.813121.62NS
Forest site (mixed coniferous)5.502613.33939516.071341.648NS
Forest site (mixed deciduous)3.428993.78507456.8640.906NS
Table A4. The variables passively fitted to the DCA results (p-value is based on the permutation test).
VariablesDCA1DCA2R2p-Value
FRic−0.68392−0.729560.06190.005
FEve0.659320.751860.08030.001
FDiv0.625020.780610.0256NS
FDis−0.60482−0.796360.08250.001
COMPETITION−0.323020.946390.10930.001
WIND0.67593−0.736960.30220.001
ZOO−0.400450.916320.3230.001
AUTO−0.933970.357360.30220.001
L−0.2882−0.957570.32650.001
T−0.407830.913060.12670.001
F0.06275−0.998030.05090.01
R0.70790.706310.38280.001
N0.99632−0.085730.2690.001
CANOPY−0.047160.998890.08780.001
SEED.MASS0.964580.263810.1910.001
SLA0.65848−0.75260.30450.001
Leaf Dry Mass−0.517390.855750.4060.001
PERENNIALS0.728150.685420.0074NS
ANNUALS0.56488−0.825170.07410.003
Table A5. Decomposition of the RLQ analysis.
RLQ AxesAxis 1Axis 2
Eigenvalues0.3750.184
Covariance0.6130.429
Correlation0.190.208
Total variance (%)46.10522.666
R/RLQ (%)0.8060.706
L/RLQ (%)0.2180.269
Q/RLQ (%)0.8250.793
Figure A1. Ordisurf plot of Q. rubra in specific layers of a forest, along the first two axes of the DCA in the study area.
Forests 11 00586 g0a1

References

  1. Weber, E. Invasive Plant Species of the World: A Reference Guide to Environmental Weeds; CABI Publishing: Wallingford, UK, 2003. [Google Scholar]
  2. Křivanek, M.; Pyšek, P. Forestry and horticulture as pathways of plant invasions: A database of alien woody plants in the Czech Republic. In Plant Invasions: Human Perception, Ecological Impacts and Management; Tokarska-Guzik Brock, B.J.H., Brundu, G., Child, L., Daehler, C.C., Pyšek, P.P., Eds.; Backhuys Publishers: Leiden, The Netherlands, 2008; pp. 213–218. [Google Scholar]
  3. Pyšek, P.; Sádlo, J.; Mandák, B. Alien flora of the Czech Republic, its composition, structure and history. In Plant Invasions: Ecological Threats and Management Solutions; Child, L.E., Brock, J.H., Brundu, G., Prach, K., Pysek, P., Wade, P.M., Williamson, M., Eds.; Edited Backhuys Publishers: Leiden, The Netherlands, 2003; pp. 113–130. [Google Scholar]
  4. Zelnik, I. The presence of invasive alien plant species in different habitats: Case study from Slovenia. Acta Biol. Slovenica 2012, 55, 25–38. [Google Scholar]
  5. Tokarska-Guzik, B.; Dajdok, Z.; Zając, M.; Zając, A.; Urbisz, A.; Danielewicz, W.; Hołdyński, C. Rośliny Obcego Pochodzenia w Polsce ze Szczególnym Uwzględnieniem Gatunków Inwazyjnych; Generalna Dyrekcja Ochrony Środowiska: Warszawa, Poland, 2012; ISBN 978-83-62940-33-2.
  6. Riepšas, E.; Straigyte, L. Invasiveness and ecological effects of red oak (Quercus rubra L.) in Lithuanian forests. Balt. For. 2008, 2, 122–130. [Google Scholar]
  7. Vor, T. Natural regeneration of Quercus rubra L. (Red Oak) in Germany. In Biological Invasions from Ecology to Control. Neobiota 6; Nentwig, W., Bacher, S., Cock, M.J.W., Dietz, H., Gigon, A., Wittenberg, R., Eds.; TU Germany: Berlin, Germany, 2005; pp. 111–123. [Google Scholar]
  8. Medvecká, J.; Jarolímek, I.; Hegedüšová, K.; Škodová, I.; Bazalová, D.; Botková, K.; Šibíková, M. Forest habitat invasions—Who with whom, where and why. For. Ecol. Manag. 2018, 409, 468–478. [Google Scholar] [CrossRef]
  9. Oosterbaan, A.; Olsthorn, A.F.M. Control strategies for Prunus serotina and Quercus rubra as exotic tree species in the Netherlands. In Biological Invasions from Ecology to Control. Neobiota 6; Nentwig, W., Bacher, S., Cock, M.J.W., Dietz, H., Gigon, A., Wittenberg, R., Eds.; TU Germany: Berlin, Germany, 2005; pp. 177–181. [Google Scholar]
  10. Merceron, N.R.; De Langhe, A.; Dubois, H.; Garin, O.; Gerarts, F.; Jacquemin, F.; Balligand, B.; Otjacques, M.; Sabbe, T.; Servranckx, M.; et al. Removal of acorns of the alien oak Quercus rubra on the ground by scatter-hoarding animals in Belgian forests. Biotechnol. Agron. Soc. Environ. 2017, 21, 127–130. [Google Scholar] [CrossRef]
  11. Petkova, K.; Popov, E.; Tsvetkov, I. Bulgaria. In Non-Native Tree Species for European Forests: Experiences, Risks and Opportunities. FP 1403 NNEXT Country Reports, Joint Volume; Hasenauer, H., Gazda, A., Konnert, M., Lapin, K., (Frits) Mohren, G.M.J., Spiecker, H., Eds.; University of Natural Resources and Life Sciences: Vienna, Austria, 2006; pp. 40–60. [Google Scholar]
  12. Richardson, D.M.; Pyšek, P.; Carlton, J.T. A compendium of essential concepts and terminology in invasion ecology. In Fifty Years Invasion Ecology: The Legacy of Charles Elton; John Wiley & Sons, Inc.: Hoboken, NJ, USA, 2011. [Google Scholar] [CrossRef]
  13. Chmura, D. Impact of alien tree species Quercus rubra L. on understorey environment and flora: A study of the Silesian Upland (Southern Poland). Pol. J. Ecol. 2013, 61, 431–442. [Google Scholar]
  14. Woziwoda, B.; Kopeć, D.; Witkowski, J. The negative impact of intentionally introduced Quercus rubra L. on a forest community. Acta Soc. Bot. Pol. 2014, 83, 39–49. [Google Scholar] [CrossRef]
  15. Gentili, R.; Ferrè, C.; Cardarelli, E.; Montagnani, C.; Bogliani, G.; Citterio, S.; Comolli, R. Comparing Negative Impacts of Prunus serotina, Quercus rubra and Robinia pseudoacacia on Native Forest Ecosystems. Forests 2019, 10, 842. [Google Scholar] [CrossRef] [Green Version]
  16. Woziwoda, B.; Potocki, M.; Sagan, J.; Zasada, M.; Tomusiak, R.; Wilczyński, S. Commercial forestry as a vector of alien tree species—The case of Quercus rubra L. introduction in Poland. Balt. For. 2014, 20, 131–141. [Google Scholar]
  17. Hereźniak, J. Amerykańskie drzewa i krzewy na ziemiach polskich. In Rośliny pochodzenia amerykańskiego zadomowione w Polsce; Ławrynowicz, M., Warcholińska, A.U., Eds.; Łódzkie Towarzystwo Naukowe. Szlakami Nauki: Łódź, Poland, 1992; pp. 97–150. [Google Scholar]
  18. Renou-Wilson, F.; Keane, M.; Farrell, E.P. Establishing oak woodland on cutaway peatlands: Effects of soil preparation and fertilization. For. Ecol. Manag. 2008, 255, 728–737. [Google Scholar] [CrossRef]
  19. Balandier, P.; Dupraz, C. Growth of widely spaced trees. A case study from young agroforestry plantations in France. Agrofor. Syst. 1999, 43, 151–167. [Google Scholar] [CrossRef]
  20. Lehmkuhler, J.W.; Felton, E.E.D.; Schmidt, D.A.; Bader, K.J.; Garrett, H.E.; Kerley, M.S. Tree protection methods during the silvopastoral-system establishment in midwestern USA: Cattle performance and tree damage. Agrofor. Syst. 2003, 59, 35–42. [Google Scholar] [CrossRef]
  21. Ferreiro-Dominguez, N.; Rigureiro-Rodrigez, A.; Mosquera-Losada, M.R. Response to sewage sludge fertilisation in a Quercus rubra L. silvopastoral system: Soil, plant biodiversity and tree pasture production. Agricult. Ecosys. Environ. 2011, 141, 49–57. [Google Scholar] [CrossRef] [Green Version]
  22. Garcia, D.; Banuelos, M.J.; Houle, G. Differential effects of acorn burial and litter cover on Quercus rubra recruitment AT the limit of its range in eastern North America. Can. J. Bot. 2002, 80, 1115–1120. [Google Scholar] [CrossRef]
  23. Nicolescu, N.V.; Vor, T.; Mason, W.L.; Bastien, J.C.; Brus, R.; Henin, J.M.; Kupka, I.; Lavnyy, V.; La Porta, N.; Mohren, F.; et al. Ecology and management of northern red oak (Quercus rubra L. syn. Q. borealis F. Michx.) in Europe: A review. Forestry 2018, 1–14. [Google Scholar] [CrossRef]
  24. Jagodziński, A.M.; Dyderski, M.K.; Horodecki, P.; Rawlik, K. Limited dispersal prevents Quercus rubra invasion in a 14-species common garden experiment. Divers. Distrib. 2018, 24, 403–414. [Google Scholar] [CrossRef] [Green Version]
  25. Dyderski, M.K.; Jagodziński, A.M. Functional traits of acquisitive invasive woody species differ from conservative invasive and native species. NeoBiota 2019, 41, 91–113. [Google Scholar] [CrossRef]
  26. Kondracki, J. Geografia Regionalna Polski; PWN: Warszawa, Poland, 1998. [Google Scholar]
  27. Gilewska, S. Wyżyny Śląsko-Małopolskie. In Geomorfologia Polski; Klimaszewski, M., Ed.; PWN: Warszawa, Poland, 1972; pp. 2323–2339. [Google Scholar]
  28. Stupnicka, E. Geologia Regionalna; Polski. Wyd. Geol: Warszawa, Poland, 1989. [Google Scholar]
  29. Nowak, T.; Urbisz, A.; Kapusta, P.; Tokarska-Guzik, B. Distribution patterns and habitat preferences of mountain vascular plant species in the Silesian Uplands (Southern Poland). Pol. J. Ecol. 2011, 59, 219–234. [Google Scholar]
  30. Pyšek, P.; Prach, K.; Mandák, B. Invasions of alien plants into habitats of Central European landscape: An historical pattern. In Plant Invasions: Ecological Mechanisms and Human Responses; Starfinger, U., Kowarik, I., Williamson, M., Eds.; Backhuys Publishers: Leiden, The Netherlands, 1998; pp. 23–32. [Google Scholar]
  31. Pielech, R.; Malicki, M. Relacje między typem siedliskowym lasu a zbiorowiskiem roślinnym w warunkach górskich. Sylwan 2014, 158, 675–683. [Google Scholar] [CrossRef]
  32. Ellenberg, H.; Leuschner, C. Vegetation Mitteleuropas mit den Alpen; Ulmer: Stuttgart, Germany, 2010. [Google Scholar]
  33. Kleyer, M.; Bekker, R.M.; Knevel, I.C.; Bakker, J.P.; Thompson, K.; Sonnenschein, M.; Poschlod, P.; Van Groenendael, J.M.; Klimeš, L.; Klimešová, J.; et al. The LEDA Traitbase: A database of life-history traits of the Northwest European flora. J. Ecol. 2008, 96, 1266–1274. [Google Scholar] [CrossRef]
  34. Grime, J.P.; Hodgson, J.G.; Hunt, R. Comparative Plant Ecology: A Functional Approach to Common British Species; Castlepoint Press: Dalbeattie, UK, 2007. [Google Scholar]
  35. Brown, N.; Jennings, S.; Wheeler, P.; Nabe-Nielsen, J. An improved method for the rapid assessment of forest understorey light environments. J. Appl. Ecol. 2000, 37, 1044–1053. [Google Scholar] [CrossRef]
  36. Chmura, D.; Salachna, A.; Sierka, E. Porównanie oceny zwarcia drzewostanu za pomocą metody wizualnej i zwarciomierza. Sylwan 2016, 160, 475–481. [Google Scholar] [CrossRef]
  37. R Core Team. R: A Language and Environment for Statistical Computing; R Foundation for Statistical Computing: Vienna, Austria, 2019. [Google Scholar]
  38. Bates, D.; Maechler, M.; Bolker, B.; Walker, S. Fitting Linear Mixed-Effects Models Using lme4. J. Stat. Softw. 2015, 67, 1–48. [Google Scholar] [CrossRef]
  39. Barton, K. MuMIn: Multi-Model Inference. R Package Version 1.43.15. Available online: https://CRAN.R-project.org/package=MuMIn (accessed on 9 April 2020).
  40. Fox, J.; Weisberg, S. An {R} Companion to Applied Regression, 3rd ed.; Sage: Thousand Oaks, CA, USA, 2018; Available online: https://socialsciences.mcmaster.ca/jfox/Books/Companion/ (accessed on 9 April 2020).
  41. Oksanen, J. Multivariate Analysis of Ecological Communities in R: Vegan Tutorial. 2011. Available online: http://r-forge.r-project.org/projects/vegan (accessed on 9 April 2020).
  42. Cáceres, M.D.; Legendre, P. Associations between species and groups of sites: Indices and statistical inference. Ecology 2009, 90, 3566–3574. [Google Scholar] [CrossRef] [PubMed]
  43. Dray, S.; Choler, P.; Doledec, S.; Peres-Neto, P.R.; Thuiller, W.; Pavoine, S.; ter Braak, C.J.F. Combining the fourth-corner and the RLQ methods for assessing trait responses to environmental variation. Ecology 2014, 95, 14–21. [Google Scholar] [CrossRef] [PubMed] [Green Version]
  44. Doledec, S.; Chessel, D.; ter Braak, C.J.F.; Champely, S. Matching species traits to environmental variables: A new three-table ordination method. Environ. Ecol. Stat. 1996, 3, 143–166. [Google Scholar] [CrossRef]
  45. Villéger, S.N.; Mason, W.H.; Mouillot, D. New multidimensional functional diversity indices for a multifaceted framework in functional ecology. Ecology 2008, 89, 2290–2301. [Google Scholar] [CrossRef] [Green Version]
  46. Laliberté, E.; Legendre, P. A distance-based framework for measuring functional diversity from multiple traits. Ecology 2010, 91, 299–305. [Google Scholar] [CrossRef]
  47. Kotowski, W.; Beauchard, O.; Opdekamp, W.; Meire, P.; Van Diggelen, R. Waterlogging and canopy interact to control species recruitment in floodplains. Function. Ecol. 2010, 24, 918–926. [Google Scholar] [CrossRef]
  48. Thonicke, K.; Billing, M.; von Bloh, W.; Sakschewski, B.; Niinemets, Ü.; Peñuelas, J.; Cornelissen, J.H.C.; Onoda, Y.; van Bodegom, P.; Schaepman, M.E.; et al. Simulating functional diversity of European natural forests along climatic gradients. J. Biogeogr. 2020. [Google Scholar] [CrossRef]
  49. Chmura, D. Differences in invasiveness of alien woody plants in forest communities of the Silesian Upland (Southern Poland). In The Role of Geobotany in Biodiversity Conservation; Holeksa, J., Babczyńska-Sendek, B., Wika, S., Eds.; University of Silesia: Katowice, Poland, 2009; pp. 297–302. [Google Scholar]
  50. Gazda, A.; Szlaga, A. Obce gatunki drzewiaste w północnym kompleksie Puszczy Niepołomickiej. Sylwan 2008, 152, 58–67. [Google Scholar] [CrossRef]
  51. Dyderski, M.K.; Chmura, D.; Dylewski, Ł.; Horodecki, P.; Jagodziński, A.M.; Pietras, M.; Robakowski, P.; Woziwoda, B. Biological Flora of the British Isles: Quercus rubra. J. Ecol. 2020, 291. [Google Scholar] [CrossRef]
  52. Dyderski, M.K.; Jagodziński, A.M. Drivers of invasive tree and shrub natural regeneration in temperate forests. Biol. Invasions 2018, 20, 2363–2379. [Google Scholar] [CrossRef] [Green Version]
  53. Woziwoda, B.; Krzyżanowska, A.; Dyderski, M.K.; Jagodziński, A.M.; Stefańska-Krzaczek, E. Propagule pressure, presence of roads, and microsite variability influence dispersal of introduced Quercus rubra in temperate Pinus sylvestris forest. For. Ecol. Manag. 2018, 428, 35–45. [Google Scholar] [CrossRef]
  54. Major, K.C.; Nosko, P.; Kuehne, C.; Campbell, D.; Bauhus, J. Regeneration dynamics of non-native northern red oak (Quercus rubra L.) populations as influenced by environmental factors: A case study in managed hardwood forests of southwestern Germany. For. Ecol. Manag. 2013, 291, 144–153. [Google Scholar] [CrossRef]
  55. Kuehne, C.; Nosko, P.; Horwath, T.; Bauhus, J. A comparative study of physiological and morphological seedling traits associated with shade tolerance in introduced red oak (Quercus rubra) and native hardwood tree species in southwestern Germany. Tree Physiol. 2014, 34, 184–193. [Google Scholar] [CrossRef]
  56. Dyderski, M.K.; Jagodziński, A.M. Low impact of disturbance on ecological success of invasive tree and shrub species in temperate forests. Plant Ecol. 2018, 219, 1369–1380. [Google Scholar] [CrossRef] [Green Version]
  57. Dyderski, M.K.; Jagodziński, A.M. Seedling survival of Prunus serotina Ehrh., Quercus rubra L. and Robinia pseudoacacia L. in temperate forests of Western Poland. For. Ecol. Manag. 2019, 450, 117498. [Google Scholar] [CrossRef]
  58. Dyderski, M.K.; Jagodziński, A.M. Similar Impacts of Alien and Native Tree Species on Understory Light Availability in a Temperate Forest. Forests 2019, 10, 951. [Google Scholar] [CrossRef] [Green Version]
  59. Parker, G.R.; Leopold, D.J.; Eichenberger, J.K. Tree dynamics in an old-growth, deciduous forest. For. Ecol. Manag. 1985, 11, 31–57. [Google Scholar] [CrossRef]
  60. Crow, T.R. Population dynamics and growth patterns for a cohort of northern red oak (Quercus rubra) seedlings. Oecologia 1992, 91, 192–200. [Google Scholar] [CrossRef] [PubMed]
  61. Gazda, A.; Fijała, M. Obce gatunki drzewiaste w południowym kompleksie Puszczy Niepołomickiej. Sylwan 2010, 154, 333–340. [Google Scholar] [CrossRef]
  62. Dajdok, Z.; Krzysztofiak, A.; Romański, M.; Śliwiński, M. Rośliny inwazyjne w Wigierskim Parku Narodowym; Wigierski Park Narodowy: Krzywe, Poland, 2007. [Google Scholar]
  63. Chwistek, K. Kierunki i dynamika zmian składu gatunkowego i struktury drzewostanów Ojcowskiego Parku Narodowego w latach 19902-003. Prądnik. Prace Muz. Szafera 2007, 17, 95–111. [Google Scholar]
  64. Szczygielski, M. Zmiany charakterystyki fitosocjologicznej borów świeżych Peucedano-Pinetum w puszczach: Piskiej i augustowskiej na przestrzeni 50 lat. Studia i Materiały CEPL 2007, 9, 153–167. [Google Scholar]
  65. Otręba, A.; Ferchmin, M. Obce gatunki drzew miarą przekształcenia przyrody Kampinoskiego Parku Narodowego. In Siedliska i gatunki wskaźnikowe w lasach. Studia i Materiały CEPL; Anderwald, D., Ed.; CEPL: Rogów, Poland, 2007; pp. 234–244. [Google Scholar]
  66. Chmura, D. Penetration and naturalisation of invasive alien plant species (neophytes) in woodlands of the Silesian Upland (southern Poland). Nat. Conserv. 2004, 60, 3–11. [Google Scholar]
  67. Chmura, D. Charakterystyka fitocenotyczna lasów z udziałem Quercus rubra L. na Wyżynie Śląskiej. Acta Bot. Siles. 2014, 10, 17–40. [Google Scholar]
  68. Zarzycki, W.; Wilczek, Z.; Woźnica, P.; Folcik, P.; Lewandowska, A.; Gancarek, M. Impact of northern red oak Quercus rubra L. on fern populations in different forest phytocoenoses. Sylwan 2015, 159, 658–665. [Google Scholar]
  69. Dyderski, M.K.; Jagodziński, A.M. Context-dependence of urban forest vegetation invasion level and alien species’ ecological success. Forests 2019, 10, 26. [Google Scholar] [CrossRef] [Green Version]
  70. Horodecki, P.; Jagodziński, A.M. Tree species effects on litter decomposition in pure stands on afforested post-mining sites. For. Ecol. Manag. 2017, 406, 1–11. [Google Scholar] [CrossRef]
  71. Hill, M.O.; Preston, C.D.; Roy, D.B. PLANTATT—Attributes of British and Irish Plants: Status, Size, Life History, Geography and Habitats; Centre for Ecology and Hydrology: Huntingdon, UK, 2004. [Google Scholar]
  72. Chytrý, M.; Tichý, L.; Dřevojan, P.; Sádlo, J.; Zelený, D. Ellenberg type indicator values for the Czech flora. Preslia 2018, 90, 83–103. [Google Scholar] [CrossRef] [Green Version]
  73. Chmura, D.; Sierka, E. The invasibility of deciduous forest communities after disturbance: A case study of Carex brizoides and Impatiens parviflora invasion. For. Ecol. Manag. 2007, 242, 487–495. [Google Scholar] [CrossRef]
  74. Dzwonko, Z.; Gawronski, S. The role of woodland fragments, soil types, and dominant species in secondary succession on the Western Carpathian foothills. Vegetatio 1994, 111, 149–160. [Google Scholar] [CrossRef]
  75. Olaczek, R. Kierunki degeneracji fitocenoz leśnych i metody ich badania. Phytocoenosis 1974, 3, 179–190. [Google Scholar]
  76. Łaska, G. The disturbance and vegetation dynamics: A review and an alternative framework. Plant Ecol. 2001, 157, 77–99. [Google Scholar] [CrossRef]
Figure 1. Location of the Silesian Upland on the territory of Poland and the studied forest complexes.
Forests 11 00586 g001
Figure 2. Conditional plot of the probability of seedling appearance under an overstorey of shrub and mature Q. rubra trees (a), and a comparison of the cover abundance of seedlings between the types of habitats (b).
Forests 11 00586 g002
Figure 3. Cluster analysis of the forest communities that have a contribution from red oak, and the indicator species for the distinguished vegetation clusters.
Forests 11 00586 g003
Figure 4. Detrended correspondence analysis (DCA) biplot of the forest communities that have red oak and the environmental factors that passively fit onto the ordination (a) ordination of plots, (b) ordination of species. Only the variables significant at p < 0.01 are shown. The labels (first four letters of genus and species name) represent the coordinates of the species in the ordination space. Uppercase letter A or B denotes tree and shrub layers, respectively.
Forests 11 00586 g004
Figure 5. Results of the fourth-corner tests: (a) the relationship between the plant species and environmental factors, (b) the relationship between the first two RLQ axes for the environmental gradients (AxR1 and AxR2) and traits, and (c) the relationship between the first two RLQ axes for the trait syndromes (AxQ1 and AxQ2) and environmental variables. Non-significant associations are represented by green cells, whereas significant associations (p < 0.05) are indicated by red (blue) cells, which show positive (negative) associations.
Forests 11 00586 g005
Figure 6. Comparison of the functional diversity components—richness (FRic), evenness (FEve), divergence (FDiv), and dispersion (FDis) (Wilcoxon sum rank test)—between the forests that were occupied by Quercus rubra (invaded sites) and non-invaded sites.
Forests 11 00586 g006
Table 1. List of the species traits and environmental variables that were subjected to RLQ environmental data, species abundance, and species traits) analysis.
NameType/Number of AttributesDescription of Variables
Ellenberg indicator valuesOrdinalL: light, T: temperature, F: moisture, R: soil reaction, N: nitrogen (0–9 scale)
Canopy (height of a plant)Continuous/1Mean value [m]
Seed massContinuous/10: no seed, for >0 mean value [mg]
SLA (specific leaf area)Continuous/1Mean value [mm2/g]
Leaf dry massContinuous/1Mean value [g]
Dispersal syndromeNominal/3WIND: anemochory, ZOO: zoochory, AUTO: autochory, barochory
PERENNIALSNominal/1herb perennials, woody perennials
Grime strategyNominal/4C: competitors, CSR: intermediate strategy, CR: competitive ruderal, OTHER: remaining strategies
Environmental variables
P, Mg, K, Ca, NaContinuous[mg/100 g]
pHOrdinalpH in (H2O, KCl)
CorgOrdinalOrganic carbon
LOSPercentLoss on ignition
NTPercentTotal nitrogen
CNContinuousRation of carbon and nitrogen
OpeningsPercentCanopy openings were measured using a canopy scope
QR.A, QR.B, QR.C, QR.TOTPercentPercent of cover abundance Quercus rubra in each layer: A-tree, B-shrub, C-herb layer, TOT—combined cover
Table 2. Results of the two generalised linear model (GLM) tests and the Spearman rank correlation test: the effect of habitat, the type of forest habitat, and Quercus rubra in the overstorey layers on the presence and cover of Q. rubra seedlings. Abbreviations: DF—degrees of freedom, NS—non-significant.
Type of TestStatisticsp-Value
Generalised Linear Model (Binomial Distribution)Wald Χ2DF
Mature trees2.1821NS
Saplings25.38571<0.0001
Habitat10.582030.01421
Mature trees × saplings3.461810.0628 (NS)
Linear Mixed-Effects Model (Gaussian Distribution)Wald Χ2DF
Mature trees37.98351<0.0001
Saplings51.26001<0.0001
Habitat10.240030.01663
Forest site3.86291NS
Spearman Rank CorrelationS statisticsrho
Mature trees and seedlings20,222,5140.21<0.0001
Saplings and seedlings18,002,0820.30<0.0002

