Article

The Economy of Canopy Space Occupation and Shade Production in Early- to Late-Successional Temperate Tree Species and Their Relation to Productivity

by
Christoph Leuschner
1,2,* and
Marc Hagemeier
1
1
Plant Ecology, Albrecht von Haller Institute for Plant Sciences, University of Goettingen, Untere Karspüle 2, D-37073 Göttingen, Germany
2
CBL, Centre of Biodiversity and Sustainable Land Use, University of Goettingen, D-37070 Göttingen, Germany
*
Author to whom correspondence should be addressed.
Forests 2020, 11(3), 317; https://doi.org/10.3390/f11030317
Submission received: 15 January 2020 / Revised: 5 March 2020 / Accepted: 10 March 2020 / Published: 13 March 2020
(This article belongs to the Special Issue Ecophysiology of Forest Succession under Changing Environment)

Abstract

:
Light capture is linked to occupation of canopy space by tree crowns, which requires investment of carbon and nutrients. We hypothesize that (i) late-successional trees invest more in casting shade than in occupying space than early-successional trees, and (ii) shade production and crown volume expansion are generally greater in more productive species. For six Central European early-successional (Betula pendula, Pinus sylvestris), mid/late-successional (Quercus petraea, Carpinus betulus), and late-successional tree species (Tilia cordata, Fagus sylvatica), we measured through full-tree harvests (1) crown volume, (2) the costs of canopy space exploration (carbon (C) and nutrients invested to fill crown volume), of space occupation (annual foliage production per volume), and of shade production (foliage needed to reduce light transmittance), and (3) related the costs to aboveground productivity (ANPP). The C and nutrient costs of canopy volume exploration and occupation were independent of the species’ seral stage, but increased with ANPP. In contrast, the cost of shade production decreased from early-to late-successional species, suggesting that the economy of shade production is more decisive for the competitive superiority of late-successional species than the economy of canopy space exploration and occupation.

1. Introduction

Plants optimize their access to resources through a suite of morphological and physiological adaptations of shoots and roots. Aboveground resources are energy (light) and carbon dioxide needed for photosynthesis, and canopy space which controls light access. Once light availability becomes limiting due to the presence of neighbors, competition for light increasingly determines plant fitness and triggers adaptations to increase light interception in the crowded canopy [1]. One strategy to avoid competition for light is superior height growth and the occupation of crown volume not accessible for other trees. This growth pattern is manifested in tall-growing trees, which can ultimately monopolize the light resource [2,3].
Light capture is essentially linked to the occupation of canopy volume by the foliage and a system of supporting axes, which also transport water, nutrients, and carbohydrates [4]. Due to spatial variation in the intensity and spectral composition of light in the canopy, space in the upper, middle, and lower crown has different value for the plant and is associated with different leaf- and branch-level adaptations when filling the volume [5]. Other factors with influence on crown space and the biomass contained in it are mechanical forces exerted by wind and swaying neighbor crowns. They can damage foliage and twigs and influence crown form and lateral branch growth [6,7]. Hence, the quality of crown space differs not only between upper and lower crown layers, but also between inner and outer crown sections. Light availability, air humidity, and plant water status are commonly thought to determine vertical gradients in leaf morphology and physiology, and in crown architecture [8,9,10]. Space (and its variable quality across the crown) is another resource which likely influences crown functioning, but has rarely been studied from a plant functional perspective [11]. Tree species have developed a multitude of crown architectural types, which differ in terms of the dominance of main axes, branching rules and angles of twigs and branches, and the density of axes and foliage per unit crown volume [12]. Correspondingly, different tree species have developed different strategies to fill canopy volume with axes and foliage. Based on branching rules, crown architecture models have been developed, which allow calculating three-dimensional light interception in forest canopies [13]. This approach does, however, not allow calculating biomass densities in different crown parts and thus to analyze tree crowns from a resource-economical perspective.
The biomass contained in a unit of crown volume has been determined for individual branches or shoots [14,15,16], whole crowns [15,16,17,18,19], and forest stands [20,21,22]. This allows calculating the costs in terms of carbon (C) or nutrient investment needed to explore new crown volume (the resources needed to fill the space with axes and foliage; ‘initial costs’) and the costs of continued crown volume occupation (the resources consumed by annual biomass turnover in the crown volume plus respirative C losses; ‘annual costs’). If the photosynthetic carbon gain and the growth and maintenance respiration of branches and leaves in a crown volume cell were known, a cost-benefit calculation of crown volume exploration and occupation would be possible [21]. This would allow comparing different plants in terms of space occupation efficiency [11]. Yet, establishing a complete C balance for a unit crown volume is a challenging task, as both photosynthesis and respiration change with leaf and branch age and season. Moreover, growth and maintenance respiration are of variable importance in different parts of the crown with growth respiration being much more important in rapidly expanding sun crown sections than in the shade crown. In the absence of precise gas exchange data, the carbon investment in leaf and branch growth may serve as a first approximation of the C costs of crown volume exploration.
The resource economy of crown space occupation may represent an important element of the plants’ growth strategy and might help assigning tree species to different functional types. Crown architecture and foliage properties differ considerably between phylogenetically distant groups [23,24], and they may also vary systematically with the species’ seral status and related growth strategy. Resource limitation should select for crown architectures and foliage properties that allow exploring canopy volume at minimal costs. Much research on tree functional types has focused on the distinction between early- and late-successional tree species, which have been found to differ in many morphological and physiological aspects, notably the response to, and requirement of, light [25,26]. Küppers [15,16,27] could show in the study of a secondary succession from scrub to late-successional forest that the late-successional trees filled crown space with a two to three times smaller leaf area and thus much lower carbon costs than the early-successional shrub species. The pioneering work of [15,16] with largely different plant growth forms has not been repeated in successional sequences, where species with similar growth form compete for canopy space, as in stand development and forest successions, where early-, mid-, and late-successional tree species may replace each other over time.
Early-successional trees generally have a higher light requirement and faster height growth, and they cast less shade on the forest floor than late-successional species. In crowded pioneer stands where light competition is intense, or during periods where rapid growth determines future survival, such as before canopy closure [28], we assume that species occupying space with lower initial and annual costs and consequently rapid height growth will be superior competitors [1]. With proceeding stand development under a fully established canopy, we assume that shade production, i.e., the maximization of light interception, becomes more important than the cost of space occupation [29], and species that produce shade at minimum costs should achieve superiority. Many late-successional trees may have adopted such a strategy. A cost-related perception of the processes of crown expansion and shade production could help to understand competition processes between mature trees in a mechanistic way. The costs of volume exploration and occupation, and shade production should be related to each other, but the association may not be strong. Species can achieve high shade production with relatively low investment in axes and foliage area per volume, when thin planophil leaves are produced, while the costs of volume filling may be low or high, depending on leaf area density [30].
Radiation interception and thus shade production are dependent on total leaf area, leaf orientation relative to the sun’s angle, and the optical properties of the foliage [31]. In a crown morphological study of early-, mid-, and late-successional tree species in a Central European secondary succession, [32] found leaf area index (LAI) to increase and leaf angles to decrease from early- to late-successional species, while foliar optical properties changed only little.
From these observations, we hypothesize (1) that late-successional trees invest more in casting shade than in occupying space, which is achieved by reducing the costs of shade production, and (2) that volume expansion and shade production generally are greater in more productive species, as both crown volume exploration and shade production are associated with costs. Possible strategies to reduce shade production costs are the development of a mono-layered shade crown and the formation of thin, less costly shade leaves with low respiration rates. Quantitative data to test these hypotheses are lacking.
In this study, we (1) measure the crown volume of mature trees in closed stands of six common Central European early-, mid/late-, and late-successional tree species through complete tree harvest, (2) determine the costs of crown space exploration and occupation, and of shade production in terms of C and nutrient investment, and (3) determine the aboveground primary productivity (ANPP) and biomass and nutrient accumulation of these species as factors possibly causing species differences in crown functioning. The selected species are early-successional Silver birch (Betula pendula Roth) and Scots pine (Pinus sylvestris L.), mid/late-successional Sessile oak (Quercus petraea Matt (Liebl.) and European hornbeam (Carpinus betulus L.), and late-successional little-leaved linden (Tilia cordata L.) and European beech (Fagus sylvatica L.). With respect to the costs of space occupation, we distinguish initial costs and annual costs. Respiration rates could not be determined in our study due to missing canopy access; the values of annual costs thus represent minimum values. With respect to the costs of shade production, we used published data of canopy PAR transmissivity in the studied stands [32], and quantified the investment in terms of leaf and twig mass in the crown needed to intercept a given fraction of incident radiation and to cast shade on the forest floor.

2. Material and Methods

2.1. Tree Species and Study Sites

The study was conducted in each two mature stands of early-successional Betula pendula and Pinus sylvestris, mid-/late-successional Quercus petraea and Carpinus betulus, and late-successional Tilia cordata, and Fagus sylvatica, which grew on similar soils in the Pleistocene lowlands of north-west and central Germany. In accordance with the species’ different seral status in forest succession, minimum light demand differed considerably (light-demanding to highly shade-tolerant; Table 1). As the six species belong to four different families (Betulaceae, Pinaceae, Fagaceae, Malvaceae), other morphological and physiological traits differ as well, notably leaf type (broadleaf vs. coniferous), tree lifespan (short- vs. long-lived), crown architectural type, and wood density (490–790 g cm−3) (see Table 1).
All 12 studied stands are located in the glacial lowlands or the adjacent low mountain ranges between Hamburg in the north and Halle/S. in the south at 80–240 m a.s.l. elevation on acidic, base-poor soils, mostly in level terrain (Table 2). Soils are in most cases dystric to spodo-dystric Cambisols or Cambisol-Podzols of medium to low fertility. Care was taken to select early- and late-successional species on similar soils of relatively poor N, P, Ca, Mg, and K supply. Mean annual temperature is 8–9 °C, mean annual precipitation varies between 800 mm yr−1 in the north-west and ~500 mm yr−1 in the south-east of the study region. We selected only stands with closed canopy (canopy closure > 0.9) and full, or at least high, dominance of the target species. Tree ages in the stands varied mostly between 80 and 120 years, with the Betula and Pinus trees being somewhat younger, and the Quercus trees older than this range. The younger stand ages of the selected pioneer species reflect the earlier culmination of stem volume increment in these species according to observations of [36,37] (Table 1). Mean tree height varied between 20 and 27 m. In case of presence of additional tree species, we selected stand patches, where the target species occurred in pure stands. The stem density of the 12 stands varied in dependence of the crown dimensions of the six species. It reached especially low values in the older Quercus stands with large crown diameters.

2.2. Determination of Aboveground Biomass, Biomass per Crown Volume and Biomass Nutrient Content

Two circular plots of 1000 m2 size (radius 17.9 m) were installed in each of the 12 stands in sections with high canopy closure (> 0.9). They were used for determining aboveground biomass (AGB) and also aboveground net primary productivity (ANPP). Canopy closure was assessed visually at about 10 locations per plot using a canopy mirror that was held in vertical upward direction from the ground to estimate gap fraction. Canopy gaps larger than about 25 m2 were avoided. Dendrometer tapes were used to measure the diameter at breast height (dbh) of all trees in the plots at 1.3 m height above ground, while tree height was measured for the majority of trees (32 to 46 per plot) with a hypsometer (PM-5/1520; Suunto, Vantaa, Finland) based on trigonometric principles. The height of the remaining trees was calculated from dbh data and dbh-height relationships that were established for every plot and tree species using different polynomial or logarithmic equations. In all cases, the equation with best fit was selected.
For determining biomass per crown volume as well as total aboveground biomass, four trees of each of the six species (Fagus: N = 9) were harvested in summer in full foliage and the biomass related to crown volume. The four (or nine) trees of a species were selected in the each two stands per species according to representativeness for the main dbh classes in the respective populations. First, crown volume was determined in the leafless state with the crown window approach, which allows visualizing and analyzing the 3-dimensional shape and volume of tree crowns. At 1.8 m height, we took drawings of the crown silhouette of every tree from four different directions in the stand, and overlaid them using the software WinDig version 2.5 [39] and CrownShape (M. Hagemeier, unpubl.) in order to calculate crown-specific polyhedrons that visualize the shape of the crown in good approximation of the natural conditions (see [30]). This model allowed calculating crown volume at different height levels. In addition, we measured the crown projection area of all 29 harvested trees with the Suunto hypsometer by determining the stem distance of eight points of the crown periphery. The trees were felled and the biomass of stem, branches, twigs, and leaves harvested quantitatively in 2 m-height intervals and dried at 70 °C until constant weight (at least 48 h). Subsequently, aliquots of all woody and non-woody biomass samples were analyzed for the contents of C, N, P, Ca, Mg, and K using gas chromatography (C, N) and element analysis with atomic absorption spectroscopy. We distinguished the biomass fractions stem wood and major side branches > 70 mm in diameter, coarse branch wood (20–70 mm in diameter), fine branch wood (diameter 7–20 mm), twigs (< 7 mm diameter), and leaves/needles. With the CrownShape model of the crown, it was possible to assign the biomass fractions in the different height levels to crown volume. The larger branches were not only characterized by diameter, but also with respect to insertion height and branch angle at the stem to help assigning branch biomass correctly to the different height levels of the crown. The crown of the trees was separated into upper, middle, and lower crown by assigning the uppermost 33 percent of vertical crown extension (crown top to crown base) to the upper, the central 33 percent to the middle, and the lowermost 33 percent to the lower crown section.
Leaf area index (LAI) was measured in two study years (1998, 1999) by litter collection in all 12 stands using each 10 circular litter buckets of 0.287 m2 aperture that were installed at fixed distances of 2.2 m in the plots. Litter collection took place on two dates (November/December and February/March) and the material was sorted for leaves, twigs and fruits and separated by species. Specific leaf area (SLA) of the litter was obtained from each 50 randomly collected freshly fallen leaves per bucket that were scanned for leaf area (WinFolia, Régent Instruments, Quebec, Canada) and the dry mass determined afterwards (70 °C, 48 h). The LAI of the target species and admixed species (if present) was obtained by multiplying SLA with leaf mass and relating the leaf area to bucket aperture.

2.3. The Cost of Canopy Space Occupation and Shade Production

Based on the tree harvests and the volume determination of the crown, we calculated the biomass density (mass per crown volume) for the different biomass fractions leaves/needles, fruits, twigs (< 7 mm in diameter), fine branchwood (7–20 mm), coarse branchwood (20–70 mm), stem wood (trunk and major branches > 70 mm), and standing deadwood (dead branches attached to the stem). Nutrient element densities (pools per crown volume) were calculated from the measured element concentrations in the different woody and non-woody biomass fractions, and biomass density in the crown sections. This was done separately for the sun crown, middle crown, and shade crown, i.e., the upper, middle, and lower third of vertical crown diameter. The stem biomass (which is relevant especially in the shade crown) was included in this analysis.
The interception of light in the crown was used as a measure of shade intensity on the forest floor, using the expression (1)
δ = −ln τ,
with δ being the interceptivity factor which characterizes shade intensity through a positive number, and τ being the measured transmissivity of the canopy for PAR (given as a fraction of 1; using data recorded in the studied stands by [32]). The lowest measured canopy transmissivity was 0.44% of incident PAR in a Fagus stand, which equals a δ value of 5.4. The cost of shade production was calculated by relating the investment in leaf mass in the canopy (C, N, P, or Mg pool in all foliage) to the light interception of the canopy (interceptivity factor δ).

2.4. Determination of Aboveground Productivity

We measured the three productivity components stem wood increment, coarse litter production (> 7 mm diameter), and fine litter production for quantifying the aboveground productivity (ANPP) of the 12 stands. Annual stem wood increment was measured with permanently mounted steel dendrometer tapes (resolution 0.25 mm) at 1.3 m height in each 20 trees per stand that were read in the years 1999 and 2000 at the end of the growing season. In order to extrapolate stem wood production to the stand level, the trees were selected to represent the main diameter classes of the tree populations, i.e., those dbh classes that were also investigated in the tree harvests. Stand-level stem wood increment was then obtained by extrapolating to the total population using the trees’ dbh values. Annual fine litter production (leaves/needles, flowers, and fruits, twigs < 7 mm diameter) was recorded with each ten litter bucket mentioned above, that were collected twice (Pinus stands: thrice) per year. Coarse litter (> 7 mm diameter) was determined in all stands by collecting all freshly fallen large branches in each five rectangular fields of 15.75 m2 size on the forest floor.

2.5. Statistical Analysis

All data were tested for normal distribution with a Shapiro-Wilk test. Non-Gaussian distribution was the rule. Differences between means were tested for significance with the non-parametric Mann-Whitney U-test. The plot-level data could not be compared among the species due to low degrees of freedom of these data (N = 2 stands per species). Pearson correlation analyses were conducted to investigate in the six-species sample the relation between the costs of crown volume exploration and shade production, and ANPP. All analyses were conducted with SAS software (SAS Institute, Cary, NC, USA). A significance level of p < 0.05 was used throughout the study.

3. Results

3.1. Aboveground Biomass and Stocks of Carbon and Nutrient Elements in the Crown

Total aboveground biomass (AGB; dry mass) was relatively low in the stands of early-successional Betula and Pinus (means of 176 and 162 Mg ha−1), intermediate in mid/late-successional Quercus (209 Mg ha−1), and highest in the stands of late- or mid/late-successional Tilia (246 Mg ha−1), Fagus (270 Mg ha−1) and Carpinus (375 Mg ha−1) (Figure 1). The relatively low AGB of the Quercus stands was linked to a much lower stem density of this species. In all six species, 47–88 % of AGB referred to coarse wood > 70 mm diameter (trunk and major side branches). The trunk itself contributed with 52–66 % to AGB in Pinus, Quercus, Carpinus, and Tilia, while this fraction was particularly large in Betula (75 %) and low in Fagus (41 %). While the species produced a similarly large fraction of twigs (< 7 mm diameter; 10–15 % of ABG), they differed considerably with respect to the proportion of fine and coarse branch wood (axes of 7–70 mm in diameter). This fraction was largest in Fagus (42–43 %) and Carpinus (29–30 %), intermediate in Quercus (22–25 %), Tilia (18–22 %), and Pinus (18–20 %), and lowest in Betula (8–9 %) (Figure 1). Dead branches in the crown contributed to AGB with 4.6 % in Pinus and 1.5 % in Quercus, but were negligible in the other species (0.2–0.7 %). While leaf biomass represented 1.0–1.4 % of AGB in the five broad-leaved tree species, the proportion of pine needle mass was much larger (10.1 %).
The biomass of leaves/needles, twigs, and small and large branches per unit crown volume was in all species higher in the sun crown than in the mid and shade crown (Figure 2). Pinus and Carpinus were the species with highest biomass density in the sun crown. Only when the stem wood was included was biomass density higher in the shade than the sun crown. The leaf/needle fraction was particularly important in the sun crown of Pinus, while smaller and larger branches (7–70 mm) contributed most of the sun crown biomass in Quercus, Carpinus, Tilia, and Fagus. Twigs < 7 mm were the dominant fraction in Betula.
Species differences in foliar nutrient concentrations were greatest between the conifer Pinus and the broadleaf species with lower N, Ca, Mg, and K contents in the former, while foliar P contents differed less (Figure S1 in the Supplementary Materials: left column). Carpinus was characterized by relatively high Ca contents in the foliage, Betula by high Mg, and Tilia high K contents. Nutrient concentrations generally tended to be higher in shade than in sun leaves with the exception of N. In contrast to nutrient concentrations, Pinus tended to have higher nutrient contents per leaf area (projected area) than the broadleaf species. Relatively high area-related values were also measured in early-successional Betula, which exceeded the contents of the mid/late-successional species for all elements except P (Figure S1: right column). Sun leaves generally had higher nutrient contents per leaf area than shade leaves with the exception of K. On a ground area basis, the Carpinus stands with largest biomass stock also had the highest aboveground pools of N, P, Ca, and K of the six species, followed by Tilia and Fagus, while the lowest stocks were measured in the early-successional Betula and Pinus stands (Figure S2 in the Supplementary Materials). The Mg pools were highest in Carpinus and Fagus and lowest in Betula, Pinus, and Quercus.
Due to the higher biomass per volume in the shade crown, the content of nutrients (N, P, Ca, K, Mg) per shade crown volume was generally higher in Carpinus, Tilia (and partly also Fagus) than in the other species (Figure 3). In contrast, Pinus had higher nutrient densities in the sun than shade crown due to its high needle mass, which contains more nutrients than the wood fractions. Among the six species, Pinus and Carpinus tended to have the highest nutrient densities in the sun crown.

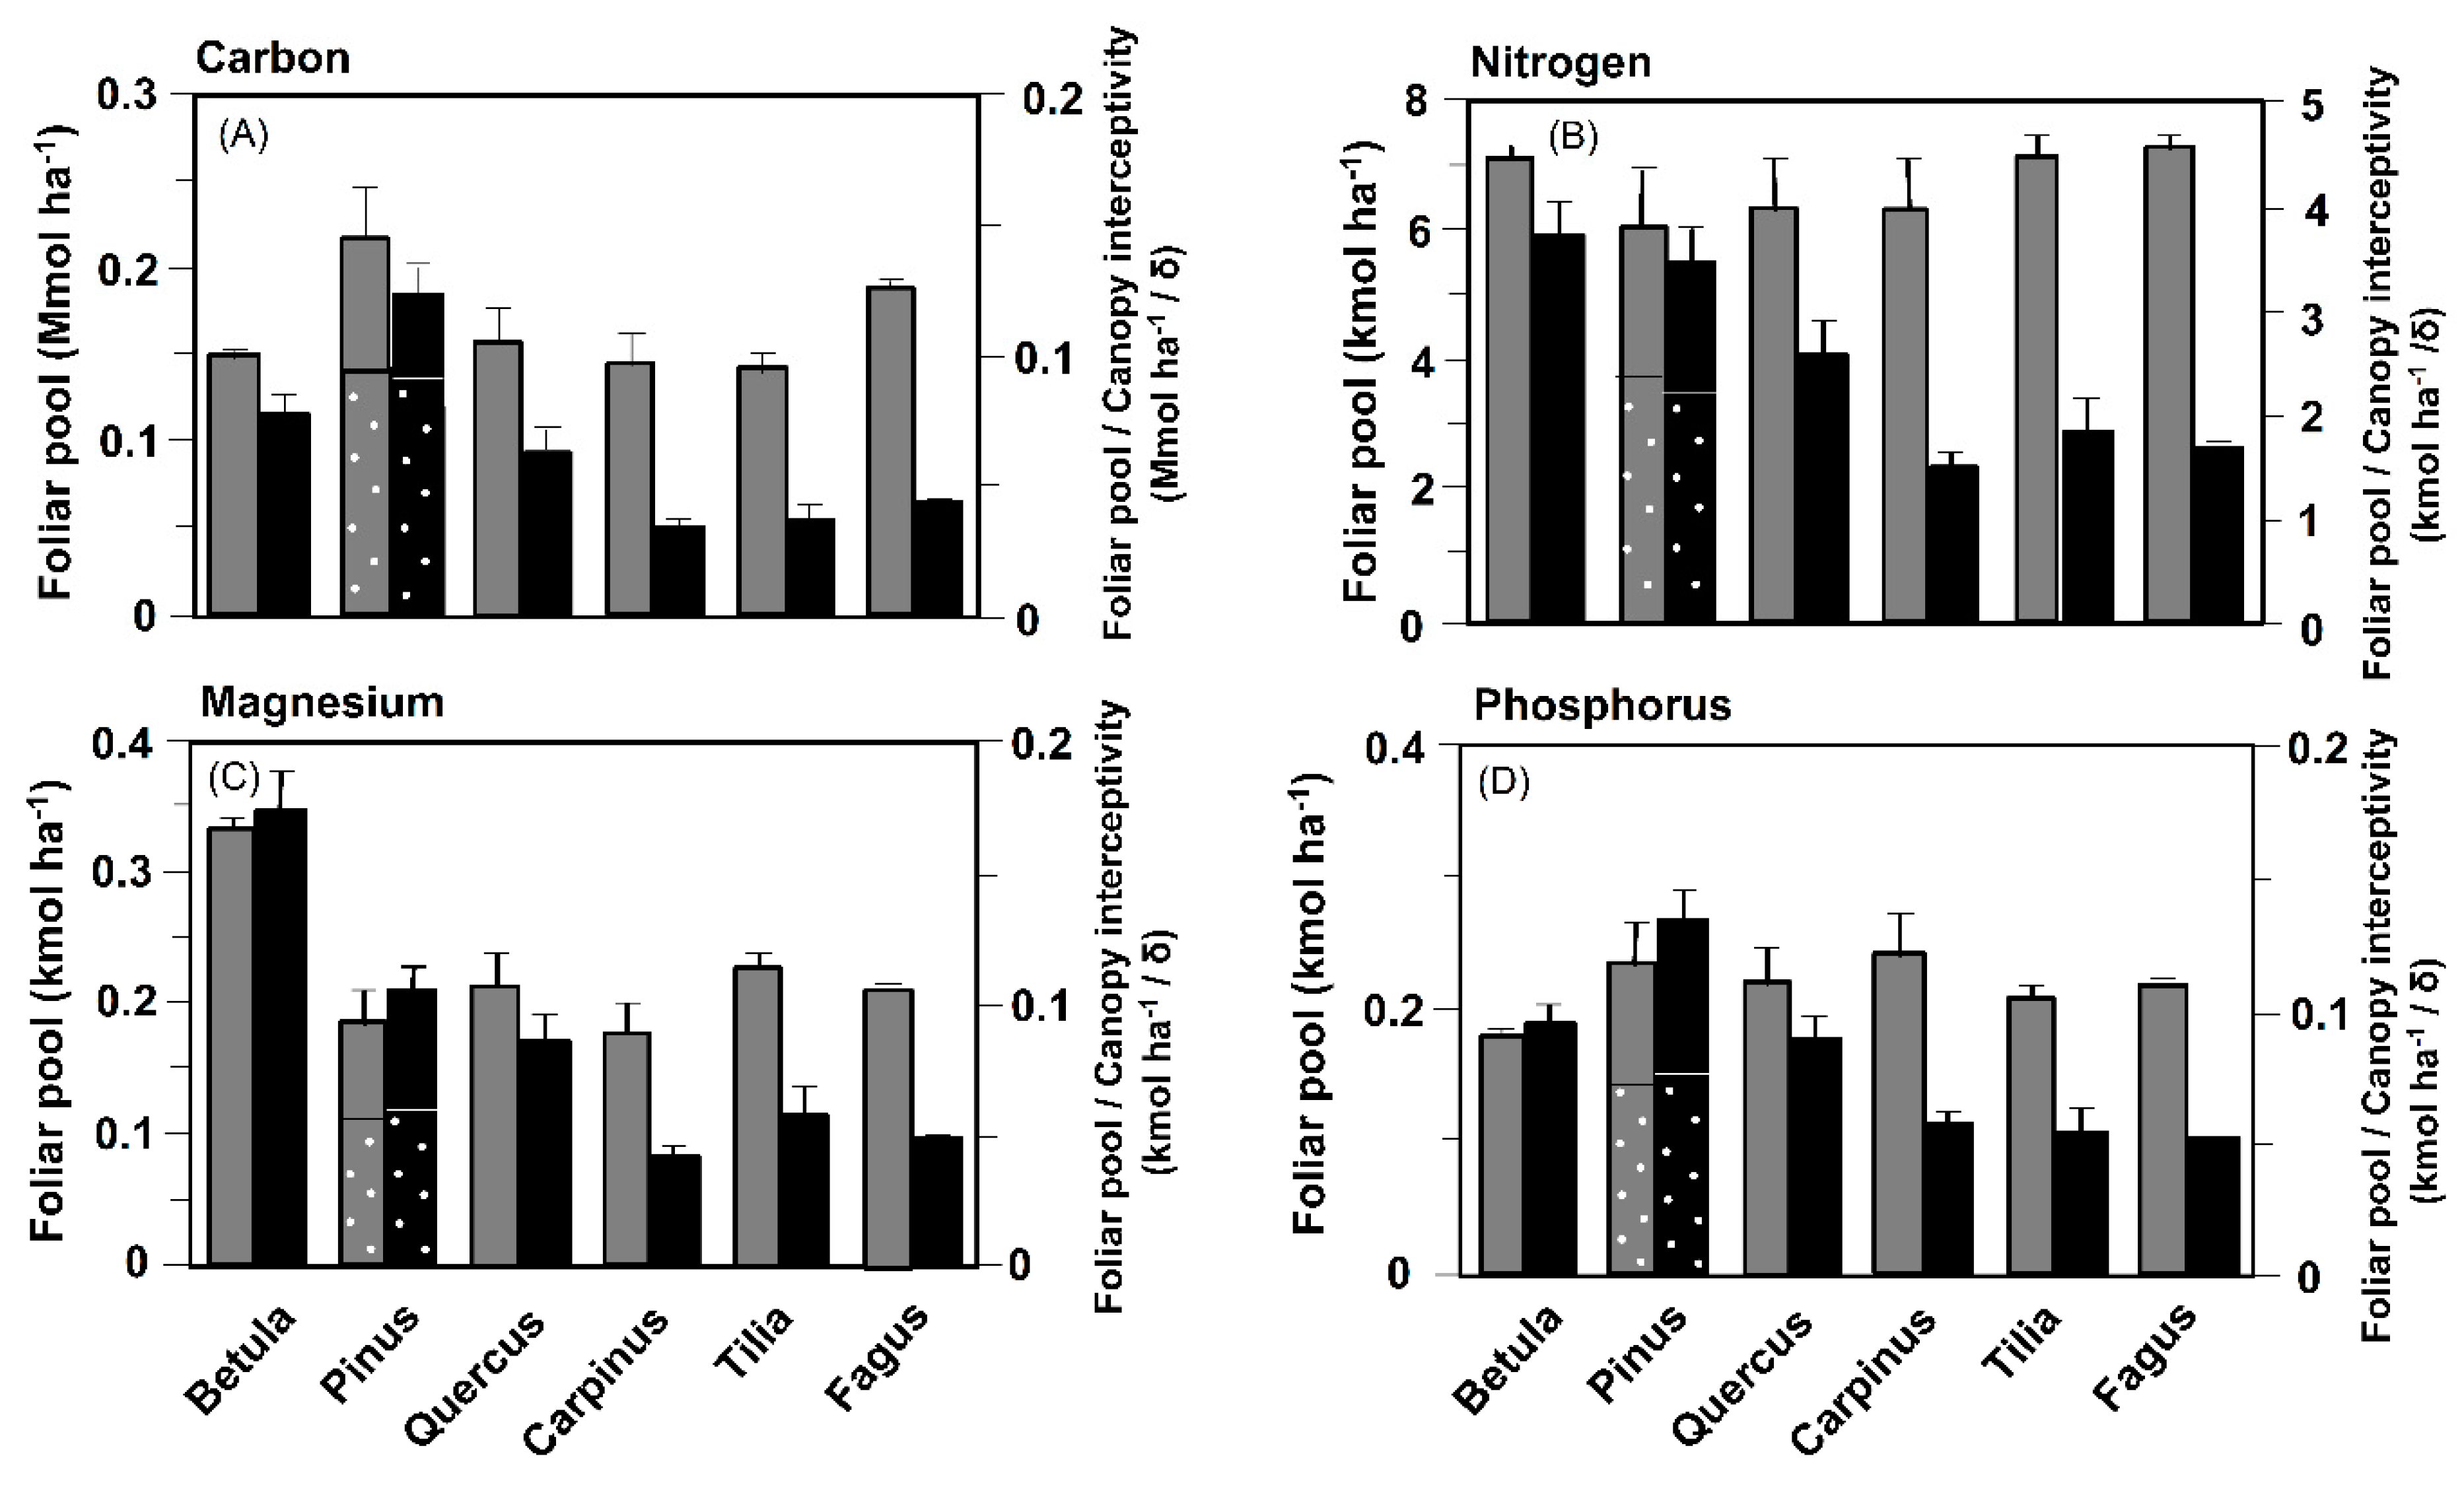
3.2. Carbon and Nutrient Costs of Space Occupation and Shade Production

The ‘initial costs’ of crown space exploration consist of the mass of leaves/needles, twigs and branches contained in that volume, while the ‘annual costs’ of space occupation include only the annually produced leaf/needle mass. The initial costs in terms of carbon, N, P, and Mg were relatively high in Pinus and Carpinus with large leaf/needle and branch masses per sun crown volume, while the annual costs were more similar among the species (Figure 4). Fagus had the lowest initial and annual costs of all species (difference only partly significant).
By relating the investment in leaf mass to the light interception of the canopy (interceptivity factor δ), the cost of shade production was estimated for the six species in Figure 5. While all species invested relatively similar amounts of C, N, and P in leaf mass per ground area (grey bars in Figure 5), Betula had elevated Mg costs to produce its foliage. The ratio of foliar C pool (and foliar N, P, and Mg pools) to δ was largest in early-successional Betula and Pinus, and decreased toward the mid/late- and late-successional species (black bars in Figure 5).

3.3. Aboveground Productivity

ANPP (i.e., the sum of stemwood increment, growth of branches and twigs, leaf and fruit production) and the increase in dead branchwood was highest in Pinus (mean of the two stands: 16.3 Mg ha−1 yr−1) and Carpinus (15.9), and lowest in Tilia (8.5), while Quercus (11.6), Fagus (11.3) and Betula (9.7) took intermediate positions (Figure 6). Considerable species differences existed with respect to stemwood production (relatively high in Carpinus and Fagus, intermediate in Betula and Pinus, relatively low in Quercus and Tilia), while twig and branch mass production was more similar among the species (Figure S3 in the Supplementary Materials). In Pinus, a large amount of carbon accumulated during the measuring period as standing dead branchwood in the crown interior. This fraction was smaller in Quercus and Carpinus, but still substantial (black bars in Figure 6). Leaf/needle production was lower in the early-successional species Betula and Pinus (2.7 and 2.6 Mg ha−1 yr−1) than in the four mid/late-successional species (Quercus and Carpinus 3.3, Tilia 3.6, and Fagus 3.4; Figure S3).
Across the species sample, the initial C and N costs of crown space exploration increased significantly with ANPP, as did the annual C cost of space occupation (Table 3). In contrast, the C and N costs of shade production were unrelated to ANPP.

4. Discussion

4.1. Do the Costs of Space Occupation and Shade Production Vary with the Species’ seral Status?

The calculated initial and annual costs of crown volume exploration and occupation varied between the six species but showed only a weak and insignificant trend to lower values in the late-successional species. The change in the costs with the species’ seral status was much clearer in the study of [15,16], who investigated a secondary succession from bare soil to forest and found a large decrease in the cost of space exploration from early-successional shrubs to late-successional trees. We explain the less clear pattern in our study with the fact that [15,16] contrasted different life forms (small shrub, tall shrub, tree), while we compared species with different growth strategies but from the same life form. Our results suggest that the seral status may have only a minor influence on the space occupation costs in the sun crown, and that this factor is not decisive for achieving competitive superiority in the crown of mixed stands. In fact, mid/late-successional Carpinus tended to have higher costs of space occupation than early-successional Betula, but it often replaces birch in stand dynamics in mixed broadleaf forests [34].
The comparison of upper, middle, and lower crown sections showed that the C and nutrient costs of space exploration differed largely across the crown of the same tree because the mass per volume of the three main crown components (leaves/needles, twigs and smaller branches < 70 mm, trunk, and main side branches) varies greatly from crown top to crown base. In the late-successional species, foliage density was more than 10 times higher in the uppermost sun crown (> 0.9 relative crown height) than in the shade crown, reaching 10–20 m2 m−3 in Carpinus and Tilia, while corresponding values in Betula and Quercus were much lower (~ 3 m2 m−3) [30]. Highest values of foliage mass per sun crown volume (c. 500 g m−3) were observed in Pinus, which maintains two to three needle generations on the same branch. In the shade crown, species differences in leaf/needle area and mass per volume were much smaller. However, the formation of axes (twigs and branches) consumes more resources than leaf growth here, and these costs increase from the sun to the shade crown. Exploring sun crown volume is most expensive in terms of C and nutrient investment for Carpinus and Pinus, and cheapest for Fagus and Betula. This suggests that the specific canopy architecture of a species may have a greater influence on the cost of crown space exploration than the species’ seral status. Obviously, species can only be compared for equivalent crown sections.
The outcome of competition in crowded canopies may depend more on the casting of shade and the sensitivity of branches to damage by neighboring trees than economic space exploration and occupation. Our data show that the six species differed only moderately in the carbon and nutrient investment needed to fill the crown volume with foliage, while the resulting radiation interception and thus shade production were largely different. This translated into carbon and nutrient costs of shade production that were two- to threefold higher in the early-successional species (and in mid/late-successional Quercus) than in the late-successional species, mainly due to different shade crown architectures. This is support for our first hypothesis. The late-successional trees possess larger leaf areas in the shade crown with the leaves arranged in mono-layers, while the early-successional trees produce shade crowns of smaller vertical extension with steeper leaf angles [32]. These features make it too expensive for early-successional species to produce shade intensities equivalent to those found under late-successional species.

4.2. Are Crown Expansion and Shade Production Related to Productivity and Nutrient Acquisition?

A characteristic feature of temperate forest successions is a significant increase in canopy light interception and thus in shade production from early to late stages, which is associated with an increase in stand leaf area (LAI; [30,32]). As late-successional trees achieve higher shade intensities through larger leaf areas, they require additional resources. Is high shade production therefore dependent on a higher productivity of late-successional species, or do the lower specific shade production costs of these trees compensate for the additional expenses? A correlation analysis showed for our species sample no relationship between the C and N costs of shade production and ANPP. In accordance, theoretical considerations and existing empirical data suggest that there may be no simple trend in aboveground productivity from early- to late-successional temperate tree species, whereas the shade production costs tend to decrease greatly. Photosynthetic carbon gain as the biochemical basis of productivity is the product of median leaf photosynthesis rate in the crown, total leaf area and leaf area duration. Compilations of photosynthesis data from temperate trees indicate that early-successional tree species on average have higher photosynthesis rates at light saturation (Amax) than late-successional species [40,41]. However, the Amax difference between early- and late-successional species may be quite small, as is visible in the Central European tree flora [34]. Total leaf area (LAI), in contrast, tends to increase from stands of early- to late-successional tree species [34]. This is also the case for our species sample, where the LAI of closed, mostly monospecific stands increased from 1.8 (Pinus) and 4.0 (Betula) to 8.3 (Carpinus) and 8.4 (Fagus) in the successional sequence [30]. As Amax and LAI change in opposite direction from early- to late-successional species, both effects may roughly compensate each other, putatively resulting in only minor change in ANPP. In fact, the productivity data of this study show a similar range of ANPP values for early-successional (Betula, Pinus) and late-successional species (Carpinus, Tilia, Fagus) (9.2–18.1 vs. 8.2–16.1 Mg ha−1 yr−1; Figure 2, Table 4). Variation within the early- and late-successional groups (e.g., Betula vs. Pinus, Carpinus vs. Tilia) was greater than the difference between the two groups. Additional ANPP data from the literature support this conclusion (Table 4). By focusing on forest stands on moderately fertile to poor, acidic well-drained soils, we attempted to reduce the influence of nutrient and water supply on ANPP in the data set. This was not possible for precipitation, which was lower at the Tilia and Carpinus sites. The assembled production data mostly refer to tree ages, at which wood production is close to its peak in the tree’s life cycle. According to volume growth tables [36], this happens in early-successional species at younger ages (ca. 60-80 years) than in most late-successional species (ca. 120–150 years) when grown in even-aged stands. Thus, stands of similar age (e.g., 100 years) may differ in productivity between early- and late-successional species, as the trees are in different stages of their life cycle, even though maximum productivity in the life cycle is not that different.
Larger than species differences in ANPP were differences in relative carbon allocation to wood, branch, leaf, and fruit production among the six species. The observed patterns did not exhibit a clear trend from early- to late-successional species, but rather point at contrasts between tree functional types, notably gymnosperm vs. angiosperm trees (Figure S3). Striking was the large variation in the proportion of ANPP, which is allocated to stem wood production (22 to 49%). This fraction was particularly large in Fagus and low in Pinus. Unexpected was the large fraction of annual carbon gain that ended in dead branches in Pinus. This may be a consequence of intensive self-thinning in the 50 yr-old pine stands, where light competition leads to widespread dieback of branches in the lower inner crown. It is likely that both younger and older pine trees with less intense competition are allocating more carbon to the production of stem wood and needles than was measured in the two stands here.
Higher costs of crown volume exploration might constrain volume expansion and thus height growth. This is suggested by the higher costs found in the more productive species of our sample. In other words, less productive species seem to develop more cost-efficient strategies to explore crown volume with smaller biomass amounts placed in the crown. This could have disadvantages with respect to crown stability, if, for example, the axial system becomes more susceptible to storm or ice damage.
Aboveground biomass stocks ranged from 160 to 195 Mg ha−1 in the early-successional stands (Betula, Pinus) and from 210 to 380 Mg ha−1 in the late-successional stands (Carpinus, Tilia, Fagus), with intermediate values in Quercus. The difference is largely explained by the higher age of the late-successional forests (48–67 vs. 83–116 years; see Table S1 in the Supplementary Materials). Nutrient concentrations in the leaf/needle and wood biomass fractions differed only little between early- and late-successional species (with the exception of Mg with elevated concentrations in Betula). More important was the difference between angiosperm and gymnosperm trees and between certain species, for example between Fagus, Tilia, and Carpinus. In contrast, nutrient contents per leaf area were higher in early-successional Betula and especially Pinus in comparison to the mid- and late-successional species. Thus, the higher photosynthetic capacity of early-successional species [40,41] and their higher growth rate at young age were associated with higher N, Mg, Ca, K, and P contents per leaf area (P only in Pinus). On the stand level, foliar nutrient pools were roughly of same size among the early-, mid-, and late-successional angiosperm tree species, while they were much higher in Pinus due to the species’ high needle mass. Under the assumption that the 12 stands grow on soils with similar nutrient availability, this suggests that early-successional Betula (and partly also Quercus) is able to produce N- and Mg-richer leaves than the late-successional species, because these species possess a smaller total leaf area and leaf mass. The total aboveground nutrient pools (stem, branches, leaves) were greater in the late- than in the early-successional species, which results not only from larger wood biomass stocks, but also from the larger branch and twig mass, especially in Carpinus and Fagus. This is in part a consequence of the higher age of these stands. This pool contained 30 to over 60% of the total aboveground nutrient pool in the studied species, demonstrating that a large part of the costs of crown space exploration refers to branch and twig growth with no clear trend from early- to late-successional species.

5. Conclusions

Our study with mature trees of six common Central European tree species shows a threefold difference in the species’ cost of crown space occupation in the sun crown, and a fivefold in the shade crown. It appears that the costs relate more to species-specific growth strategies, notably the contrast between gymnosperms and angiosperms, than to the species’ seral status. The results thus are only weak support for the assumption that late-successional species replace earlier-successional ones through a more economic exploration and occupation of canopy space, as was suggested by the findings of [15,16]. In early stages of stand development, fitness mostly depends on the capacity for rapid height growth into empty canopy space, as is realized by light-demanding pioneer trees, and resource economy itself may be less important. Later in stand development, when competitive exclusion becomes a more important process, the economy of shade production seems to be more decisive than the economy of crown space exploration and occupation. Late-successional species with their distinct shade crown are able to cast shade at lower costs. Our results further indicate that the development of a distinct shade crown and the associated ability to produce shade at low costs apparently do not depend on higher plant productivity, as is suggested by Betula which lacks a typical shade crown but has a relatively high ANPP, and Tilia with a distinct shade crown but rather low ANPP. Clearly, our analysis is a case study that is valid primarily for the age of assumed maximum productivity, which can only indicate tendencies of cost differences between species. The results cannot simply be extrapolated to other stages in the trees’ life cycle and other species. Moreover, we were unable to calculate the full costs of occupying crown space, because branch and foliage respiration were ignored. It has also to be kept in mind that the 12 studied stands grew on similar soil, but precipitation was lower at the Tilia and Carpinus sites, as the range of these species in Central Europe is mostly confined to more continental regions. This could have influenced crown structure and productivity, even though both species are adapted to moderately dry climates. We suggest extending the economic analysis of crown functioning to other tree species, forest types, and climatic regions in order to test the more general validity of the patterns recognized in this study.

Supplementary Materials

The following information is available online at https://www.mdpi.com/1999-4907/11/3/317/s1, Figure S1: Mass-related (left column) and area-related contents (right column) of N, P, Ca, Mg and K in sun leaves (grey bars) and shade leaves (black bars) of the six tree species (means and standard deviation), Figure S2: Stores of carbon and five nutrient elements in the different compartments of aboveground biomass in the 12 stands of the six tree species, Figure S3:Components of aboveground net primary production (in % of ANPP) in the six tree species (mean of each two stands),Table S1: Structural characteristics of the 12 stands.

Author Contributions

C.L. conceived the study, M.H. conducted the research and did most of the data analysis, C.L. wrote the paper, both authors reviewed the final draft. All authors have read and agreed to the published version of the manuscript.

Acknowledgments

We gratefully acknowledge the financial support granted by Deutsche Bundesstiftung Umwelt (DBU) to MH.

Conflicts of Interest

The authors declare no conflict of interest.

References

  1. Valladares, F.; Niinemets, Ü. The architecture of plant crowns: From design rules to light capture and performance. In Functional Plant Ecology; Pugnaire, F.I., Valladares, F., Eds.; CRC Press: Boca Raton, London; New York, NY, USA, 2007; pp. 101–149. [Google Scholar]
  2. Landsberg, J.J. Forest canopies. In Encyclopedia of Environmental Biology; Nierenberg, W.A., Ed.; Academic Press: San Diego, CA, USA, 1995; Volume 3, pp. 81–94. [Google Scholar]
  3. Bazzaz, F. Plants in Changing Environments; Cambridge Univ. Press: Cambridge, UK, 1996. [Google Scholar]
  4. Valladares, F. Architecture, ecology, and evolution of plant crowns. In Handbook of Functional Plant Ecology; Pugnaire, F.I., Valladares, F., Eds.; Marcel Dekker: New York, NY, USA, 1999; pp. 121–194. [Google Scholar]
  5. Grams, T.E.E.; Lüttge, U. Space as a resource. Prog. Bot. 2011, 72, 349–370. [Google Scholar]
  6. Rudnicki, M.; Lieffers, V.J.; Silins, U. Stand structure governs the crown collisions of lodgepole pine. Can. J. For. Res. 2003, 33, 1238–1244. [Google Scholar] [CrossRef] [Green Version]
  7. Hajek, P.; Seidel, D.; Leuschner, C. Mechanical abrasion, and not competition for light, is the dominant canopy interaction in a temperate mixed forest. For. Ecol. Manag. 2015, 348, 108–116. [Google Scholar] [CrossRef]
  8. Niinemets, Ü. Photosynthesis and resource distribution through plant canopies. Plant Cell Environ. 2007, 30, 1052–1071. [Google Scholar] [CrossRef]
  9. Oldham, A.R.; Sillett, S.C.; Tomescu, A.M.F.; Koch, G.W. The hydrostatic gradient, not light availability, drives height-related variation in Sequoia sempervirens (Cupressaceae) leaf anatomy. Am. J. Bot. 2010, 97, 1087–1097. [Google Scholar] [CrossRef] [Green Version]
  10. Chin, A.R.O.; Sillett, S.C. Within-crown plasticity in leaf traits among the tallest conifers. Am. J. Bot. 2017, 106, 1–13. [Google Scholar] [CrossRef]
  11. Reiter, I.M.; Häberle, K.-H.; Nunn, A.J.; Heerdt, C.; Reitmayer, H.; Grote, R.; Matyssek, R. Competitive strategies in adult beech and spruce: Space-related foliar carbon investment versus carbon gain. Oecologia 2005, 146, 337–349. [Google Scholar] [CrossRef]
  12. Farnsworth, K.D.; Niklas, K.J. Theories of optimization, form and function in branching architecture in plants. Funct. Ecol. 1995, 9, 355–363. [Google Scholar] [CrossRef]
  13. Chen, S.G.; Ceulemans, R.; Impens, I.A. A fractal-based Populus canopy structure model for the calculation of light interception. For. Ecol. Manag. 1994, 69, 97–110. [Google Scholar] [CrossRef]
  14. Fleck, S. Integrated Analysis of Relationships between 3D-Structure, Leaf Photosynthesis and Branch Transpiration of Mature Fagus sylvatica and Quercus petraea Trees in a Mixed Forest Stand; Bayreuther Forum für Ökologie 97; University of Bayreuth: Bayreuth, Germany, 2001. [Google Scholar]
  15. Küppers, M. Kohlenstoffhaushalt, Wasserhaushalt, Wachstum und Wuchsform von Holzgewächsen im Konkurrenzgefüge eines Heckenstandortes. Ph.D. Thesis, University of Bayreuth, Bayreuth, Germany, 1982. [Google Scholar]
  16. Küppers, M. Carbon relations and competition between woody species in a Central European hedgerow. IV. Growth from and partitioning. Oecologia 1985, 66, 343–352. [Google Scholar] [CrossRef]
  17. Kozovits, A.R.; Matyssek, R.; Winkler, J.B.; Göttlein, A.; Blaschke, H.; Grams, T.E.E. Aboveground space sequestration determines competitive success in juvenile beech and spruce trees. New Phytol. 2005, 167, 181–196. [Google Scholar] [CrossRef] [PubMed]
  18. Kramer, R.D.; Sillett, S.C.; van Pelt, R. Quantifying aboveground components of Picea sitchensis for allometric comparisons among tall conifers in North American rainforests. For. Ecol. Manag. 2018, 430, 59–77. [Google Scholar] [CrossRef]
  19. Sillett, S.C.; van Pelt, R.; Carroll, A.L.; Campbell-Spickler, J. Structure and dynamics of forests dominated by Sequoiadendron giganteum. For. Ecol. Manag. 2019, 448, 218–239. [Google Scholar] [CrossRef]
  20. Cermak, J.; Riguzzi, F.; Ceulemans, R. Scaling up from the individual tree to the stand level in Scots pine. I. Needle distribution, overall crown and root geometry. Ann. Sci. For. 1997, 55, 63–88. [Google Scholar] [CrossRef] [Green Version]
  21. Ford, E.D. Branching, crown structure, and the control of timber production. In Attributes of Trees as Crop Plants; Cannell, M.G.R., Jackson, J.E., Eds.; Institute of Terrestrial Ecology: Huntingdon, UK, 1985; pp. 228–252. [Google Scholar]
  22. Leuschner, C. Changes in forest ecosystem function with succession in the Lüneburger Heide. In Ecosystem Properties and Landscape Function in Central Europe; Tenhunen, J., Hantschel, R., Lenz, R., Eds.; Ecological Studies 147; Springer: Berlin, Germany, 2001; pp. 517–567. [Google Scholar]
  23. Hallé, F.; Oldeman, R.A.A.; Tomlinson, P.B. Tropical Trees and Forests. An Architectural Analysis; Springer: Heidelberg/Berlin, Germany, 1978. [Google Scholar]
  24. Turner, I.M. The Ecology of Trees in the Tropical Rain Forest; Cambridge University Press: Cambridge, UK, 2001. [Google Scholar]
  25. Bazzaz, F. The physiological ecology of plant succession. Ann. Rev. Ecol. Syst. 1979, 10, 351–371. [Google Scholar] [CrossRef] [Green Version]
  26. Huston, M.; Smith, T. Plant succession, life history and competition. Am. Nat. 1987, 130, 168–198. [Google Scholar] [CrossRef]
  27. Küppers, M. Canopy gaps: Competitive light interception and economic space filling–A matter of whole plant allocation. In Exploitation of Environmental Heterogeneity by Plant Ecophysiological Processes Above and Below Ground; Caldwell, M., Pearcy, R.W., Eds.; Academic Press: San Diego, CA, USA, 1994; pp. 111–114. [Google Scholar]
  28. Franklin, J.F.; Spies, T.A.; van Pelt, R.; Carey, A.B.; Thornburgh, D.A.; Berg, D.R.; Lindenmayer, D.B.; Harmon, M.E.; Keeton, W.S.; Shaw, D.S. Disturbance and structural development of natural forest ecosystems with silvicultural implications, using Douglas-fir forests as an example. For. Ecol. Manag. 2002, 155, 399–423. [Google Scholar] [CrossRef]
  29. Grace, J.B.; Tilman, D. Perspectives on Plant Competition; Academic Press: San Diego, CA, USA, 1990. [Google Scholar]
  30. Hagemeier, M.; Leuschner, C. Functional crown architecture of five temperate broadleaf tree species: Vertical gradients in leaf morphology, leaf angle, and leaf area density. Forests 2019, 10, 265. [Google Scholar] [CrossRef] [Green Version]
  31. Stoutjesdijk, P.; Barkman, J.J. Microclimate, Vegetation and Fauna; Opulus Press: Uppsala, Sweden, 1987. [Google Scholar]
  32. Hagemeier, M.; Leuschner, C. Leaf and crown optical properties of five early-, mid- and late-successional temperate tree species and their relation to sapling light demand. Forests 2019, 10, 925. [Google Scholar] [CrossRef] [Green Version]
  33. Ellenberg, H. Vegetation Mitteleuropas mit den Alpen, 6th ed.; Ulmer Verlag: Stuttgart, Germany, 1996. [Google Scholar]
  34. Leuschner, C.; Ellenberg, H. Ecology of Central European Forests. In Vegetation Ecology of Central Europe; Springer Nature: Cham, Switzerland, 2017; Volume 1. [Google Scholar]
  35. Leuschner, C.; Meier, I.C. The ecology of Central European tree species: Trait spectra, functional trade-offs, and ecological classification of adult trees. Perspec. Plant Ecol. Evol. Syst. 2018, 33, 89–103. [Google Scholar] [CrossRef]
  36. Schober, R. Ertragstafeln wichtiger Baumarten; Sauerländer, J.D., Frankfurt, M., Eds.; Germany, 1995; Available online: https://www.lehmanns.de/shop/weitere-fachgebiete/5012551-9783793907305-ertragstafeln-wichtiger-baumarten-bei-verschiedener-durchforstung (accessed on 11 March 2020).
  37. Böckmann, F. Wachstum und Ertrag der Winterlinde (Tilia cordata Mill.) in Niedersachsen und Nordhessen. Ph.D. Thesis, University of Göttingen, Göttingen, Germany, 1990. [Google Scholar]
  38. Roloff, A. Kronenentwicklung und Vitalitätsbeurteilung ausgewählter Baumarten der gemäßigten Breiten. Schr. Forstl. Fak. Univ. Göttingen Niedersächs. Forstl. Vers. anst. 1989, 93, 1–258. [Google Scholar]
  39. Lovy, D. WinDIG. University of Geneva, Switzerland. 1996. Available online: http://www.unige.ch/sciences/chifi/cpb/windig.html (accessed on 1 February 2002).
  40. Ceulemans, R.; Saugier, B. Photosynthesis. In Physiology of Trees; Raghavendra, A.S., Ed.; Wiley: New York, NY, USA, 1991; pp. 21–50. [Google Scholar]
  41. Kutsch, W.; Wirth, C.; Kattge, J.; Nöllert, S.; Herbst, M.; Kappen, L. Ecophysiological characteristics of mature trees and stands–Consequences for old-growth forest productivity. In Old-Growth Forests. Function, Fate and Value; Wirth, C., Gleixner, G., Heimann, M., Eds.; Ecol. Stud. 127; Springer: Berlin/Heidelberg, Germany, 2009; pp. 57–80. [Google Scholar]
  42. Art, H.W.; Marks, P.L. A summary table of biomass and net annual primary production in forest ecosystems of the world. In Proceedings of the XVth IUFRO Congress, Gainsville, Florida, USA, 15–20 March 1971; Working Group on Forest Biomass Studies, Section 25, Growth and Yield. University of Florida: Gainsville, FL, USA; IUFRO: Vienna, Austria; pp. 3–32. [Google Scholar]
  43. De Angeles, D.L.; Gardner, R.H.; Shugart, H.H. Productivity of forest ecosystems studied during the IPB: The woodland data set. In Dynamic Properties of Forest Ecosystems; Reichle, D.E., Ed.; Cambridge University Press: Cambridge, UK; London, UK; New York, NY, USA; Melbourne, Australia, 1981; pp. 567–672. [Google Scholar]
  44. Cannell, M.G.R. World Forest Biomass and Production Data; Academic Press: London, UK, 1982. [Google Scholar]
  45. Scarascia-Mugnozza, G.; Bauer, G.A.; Persson, H.; Matteucci, G.; Masci, A. Tree biomass, growth and nutrient pools. In Carbon and Nitrogen Cycling in European Forest Ecosystems; Schulze, E.D., Ed.; Ecol. Stud. 142; Springer: Berlin, Germany, 2000; pp. 49–62. [Google Scholar]
  46. Ellenberg, H.; Mayer, R.; Schauermann, J. Ökosystemforschung–Ergebnisse des Sollingprojekts 1966–1986; Ulmer: Stuttgart, Germany, 1986. [Google Scholar]
Figure 1. Biomass stocks in the 12 studied forest stands of the six tree species by fraction. Deadwood refers to dead branches attached to the stem. The leaf/needle fraction was too small to be depicted in the bars in several stands. The species are arranged according to their position in forest succession.
Forests 11 00317 g001
Figure 2. Biomass per unit crown volume in the sun (A), mid (B), and shade crown (C) of the six species by biomass fraction (means and standard deviation of each four harvested trees [Fagus: N = 9]). Deadwood refers to dead branches attached to the stem. Significantly different means between species are marked by different small letters.
Forests 11 00317 g002
Figure 3. Pools of nitrogen (A), phosphorus (B), calcium (C), potassium (D), and magnesium (E) in the biomass (leaves/needles, twigs, branches, stem wood) per unit crown volume in the sun, mid and shade crown of the six tree species (means and standard deviation of each four harvested trees [Fagus: nine]). Significantly different means between species are marked by different small letters. The leaf fraction is marked by white dots in the bars.
Forests 11 00317 g003
Figure 4. Costs of canopy space exploration and occupation in the sun crown of the six species, expressed as ‘initial costs’ (grey bars; the standing biomass of leaves/needles, twigs, and branches) and ‘annual costs’ (black bars; annual leaf/needle mass production) in terms of C, N, Mg, or P investment (AD) needed to build the organs (means and standard deviation of each four harvested trees [Fagus: N = 9]). Significantly different means between species are indicated by different small letters (initial costs) or capital letters (annual costs). For Pinus, only the production of current-year needles is considered in the annual costs. In case of nitrogen, foliar leaching and uptake are not considered. The species are arranged according to their position in forest succession.
Forests 11 00317 g004
Figure 5. Cost of shade production in terms of leaf biomass in the stands of the six species (means and standard deviation of each 10 litter buckets per stand). Given is the carbon (A), nitrogen (B), magnesium (C) and phosphorus (D) investment needed to build the foliage in the stands (grey bars; foliar pool) and the quotient foliar element pool / δ, with δ being the interceptivity factor of the canopy. δ is derived from measured canopy transmissivity for PAR (see text for explanation). The dotted bars mark the current-year needles of Pinus.
Forests 11 00317 g005
Figure 6. Aboveground productivity (dry mass) of the 12 stands of six tree species in 1999 by fraction. Coarse and fine litter was collected with two different litter bucket types. The production of deadwood refers to the calculated increase in dead branch mass in the trees.
Forests 11 00317 g006
Table 1. Some morphological and functional characteristics of the six studied tree species (after various sources, including [33,34,35]). The species are arranged according to their seral status in forest succession.
Betula
pendula
Pinus sylvestrisQuercus petraeaCarpinus
betulus
Tilia
cordata
Fagus
sylvatica
FamilyBetulaceaePinaceaeFagaceaeBetulaceaeMalvaceaeFagaceae
Successional statusearlyearlymid/latemid/latelatelate
Maximum age (yr)120450500250400450
Age of peak volume increment 16575125?65145
Maximum height (m)355050304556
Wood density (g cm−3)610490650790490680
Crown architectural type 2Ra/Sc/TrRauhRauhTrollTrollTroll
Shade production of adults 3VVIIIIIII
Light demand of saplings 421181133.53.5
Light demand of shade leaves 5 212562.53<1
1 After [36], Tilia after [37]. 2 After [23], with adaptations from [38]; Ra/Sc/Tr-first Rauh, later Scarrone, and finally Troll.3 From various literature sources and personal observation of [33]. Relative categorization of species (I-very high, II-high, III-medium, IV-low, V-very low).4 Relative PAR flux density (in % of incident flux density around noon at overcast sky) measured over saplings in closed stands of the species after [32], and Hagemeier, unpubl. 5 Relative PAR flux density (in % of incident flux density around noon at overcast sky) measured at the level of lowest shade leaves inside closed stands (56 to 136 individual measurements per species; [32], and Hagemeier, unpubl.)
Table 2. Some physiographic characteristics of the 12 study sites (each two per species) in north-west and central Germany
SpeciesSite
#
LocationCoordi-NatesSlopeElevation
m a.s.l.
Soil SubstrateAdmixed
Species
Betula
pendula
1Lehrer Wald (Helmstedt county), Lower Saxony10°42’E
52°19’N
level95Loamy
sand
Alnus glutinosa
2Lappwald (Helmstedt county), Lower Saxony11°01’E 52°16’Nlevel147Loamy
sand
Pinus sylvestris
Pinus
sylvestris
3Unterlüss, Lüneburger Heide, Lower Saxony52°51’N
10°16’E
level103Loamy sandBetula pendula
4Unterlüss, Lüneburger Heide, Lower Saxony52°50’N
10°15’E
level112Loamy sandBetula pend.,
Picea abies
Quercus
petraea
5Breitenhees, Lüneburg Heath, Lower Saxony10°30’E 52°49’Nlevel120Loamy
sand
Picea abies
6Breitenhees, Lüneburg Heath, Lower Saxony10°30’E
52°49’N
level123Loamy
sand
Picea abies
Carpinus
betulus
7Ziegelrodaer Forst (near Mansfeld), Thuringia11°32’E
51°26’N
5% NW225Sandy
loam
Tilia cordata, Acer ssp.
8Ziegelrodaer Forst
(near Mansfeld), Thuringia
11°32’E
51°26’N
11% N235Sandy
loam
Fraxinus exc.
Tilia cordata
Tilia
cordata
9Colbitz-Letzlinger Heide (Wolmirstedt), Sax.-Anhalt11°32’E
52°21’N
level85Loamy
sand
Quercus rob.,
Fraxinus exc.
10Colbitz-Letzlinger Heide (Wolmirstedt), Sax.-Anhalt11°33’E
52°20’N
level78Loamy
sand
Quercus rob.,
Fraxinus exc.
Fagus
sylvatica
11Unterlüss, Lüneburger Heide, Lower Saxony10°16’E
52°50’N
level115SandQuercus petraea
12Unterlüss, Lüneburger Heide, Lower Saxony10°19’E
52°49’N
level113Loamy
sand
-
Table 3. Pearson correlation coefficients (r) and p values of correlation analyses between ANPP and the initial and annual C or N costs of crown volume occupation and shade production in the sample of six species.
Crown Volume OccupationShade Production
Initial C costsAnnual C costsInitial N costsAnnual N costsC costsN costs
r0.770.750.760.480.400.07
p0.040.040.040.160.210.44
Note: Bold figures indicate significant relationships.
Table 4. Aboveground net primary productivity in stands dominated by the six tree species of this study according to own results and literature data [42,43,44,45,46].
Tree speciesAgeBasal areaANPPSource
yearsm2 ha−1Mg ha−1 year−1
Betula pendula42–5521.6–267.7–10.8[42,43,44]
45–6725.2–28.59.2–10.2This study
Pinus sylvestris35–5530.8–357.9–22.0[42,43,44]
48–5029.5–33.414.5–8.1This study
65 ± 628.1 ± 4.86.8Förster et al., submitted
Quercus petraea117-12.6[42,43,44]
149-15423.8–27.511.4–11.8This study
Carpinus betulus95–11631.5–3715.7–16.1This study
Tilia cordata74-7.0[42,43,44]
65–8335.9–37.78.2–8.7This study
Fagus sylvatica80–12225.2–3110.1–17.3[42,43,44]
95–11524.2–30.810.1–12.4This study
146 ± 3129.1 ± 6.49.0Förster et al., submitted
11824.68.9[45]
71–13432–409.4–10.9[46]

