Article

Topographic Factors and Tree Heights of Aged Cryptomeria japonica Plantations in the Boso Peninsula, Japan

Graduate School of Agricultural and Life Sciences, The University of Tokyo, Yayoi 1-1-1, Bunkyo-ku, Tokyo 113-8657, Japan
*
Author to whom correspondence should be addressed.
Forests 2020, 11(7), 771; https://doi.org/10.3390/f11070771
Submission received: 25 May 2020 / Revised: 11 July 2020 / Accepted: 15 July 2020 / Published: 18 July 2020
(This article belongs to the Special Issue Ecophysiology of Forest Succession under Changing Environment)

Abstract

:
This study aimed to clarify the environmental factors limiting the height of aged Cryptomeria japonica trees. The study was conducted on C. japonica plantations of about 100 years old at the Boso Peninsula, Japan, where the climatic conditions are almost uniform. Twenty-eight plots measuring 10 × 10 m were established on ridges, and 40 plots were established on the middle or lower sections of slopes. The stand ages ranged from 93 to 115 years old. The height of the tallest tree and soil depth (SD) were measured in each plot, and the wetness index (WI) and openness (OP) of each plot were calculated using a digital elevation model. The tree height at the 100-year age (H100) was estimated. The H100 ranged from 16.2 to 44.9 m and was significantly correlated with the logWI (r = 0.78) and OP (r = −0.70). SD and H100 were significantly correlated in the plots on the ridges but not in the plots on the middle or lower sections of slopes. It indicated that soil water retention capacity might limit tree height in the relatively dry soil conditions. The coefficient of determination adjusted by the number of parameters for H100 predicted using multiple regression analysis with environmental factors of logWI, logWI and OP, or logWI, OP and SD were 0.60, 0.69, and 0.73, respectively. The inclusion of OP and SD in the model improved the prediction of H100, suggesting that the wind and rooting depth could be the influencing factors in determining the height of aged trees. The findings of this study could be used in the planning and management of forestry plantations of long rotation system.

1. Introduction

Climate change, which is caused by an increase in the concentration of greenhouse gases in the atmosphere, has become a serious global environmental problem. The Paris Agreement aims for net-zero greenhouse gas emissions by the late 21st century. The strengthening of carbon sinks, such as forests, is essential to achieve this. However, forest declines, which are presumed to be caused by droughts and high temperatures under climate change, have been observed around the world [1], and there is increasing concern about the negative impacts of climate change on forest ecosystems [2]. Information on the relationship between the environment and forest productivity is needed to predict the impact of climate change on forest productivity. The site index, which is the dominant tree height at a reference stand age, is used as an index of site productivity [3,4]. The relationship between environmental factors and site index in even-aged forests, such as plantations [5,6,7] and natural forests [8,9], is well studied.
The height growth rates of trees generally decrease with age. This reduction in height growth in aged trees has been explained by the water stress caused by tall tree height, which increases the hydraulic resistance and the gravitational potential of xylem water [10,11,12,13]. Thus, tall trees suffer from water stress even under moist soil conditions. In addition, it has been reported that water flow in the trunks of trees is disrupted by the intensive shaking of trees during strong winds [14], and tall trees are more susceptible to strong winds [15]. Therefore, the water status of the leaves of aged trees is influenced by other factors than soil drying. It has been suggested that the relationship between environmental factors and site index could change with changes in the reference stand age.
Cryptomeria japonica is the primary plantation species and the tallest tree species in Japan. It grows fast in moist soil conditions [16], and its height growth rate begins to decrease at shorter tree heights in shallow soil sites compared with deep soil sites [17,18,19]. Cryptomeria japonica is a deep-rooting species, and the roots of aged trees growing in deep effective soil sites have been reported to reach depths of 2.5–3 m [20]. The inhibition of rooting depth is a factor that reduces tree height growth. Tange and Someya [21] investigated the relationship between soil hardness and the distribution of fine roots in the soil at three C. japonica stands on a flat topography, with tree heights of about 20 m and different stand ages of 21, 49, and 74 years old. The height growth rates were higher in the young stands than the aged stands, and fine root distribution was related to soil hardness and was limited within 0.9 m of soil depth (SD) in the aged stand. Tange et al. [22] compared the photosynthetic rates and water potential at midday among these three stands and showed that the slow-growing aged trees showed larger reductions in photosynthesis and lower water potential than fast-growing young trees. They suggested that the height of aged trees was influenced by the effective soil thickness, which is where roots could grow easily, and that soil conditions limit how tall trees can grow. In Japan, a decline in the growth of aged C. japonica trees has been observed at shrines in the Kanto plain since the late 20th century. As areas of decline overlap with areas with large vapor pressure deficits during the growing season (May–September) [23], desiccation caused by urbanization was regarded as one of the environmental changes influencing the decline. It is considered that these aged trees compared with young trees are closer to the upper limit of tree heights in their environmental conditions, and more susceptible to changes in the environmental factors relating to water relations of trees.
It has been reported that the site index of C. japonica in regions where climatic conditions are similar is highly correlated with topographic factors related to drought stress, such as soil moisture and openness to sunshine and wind [6,24]. The reference age of C. japonica in these studies was 40 years old, and the site indices were shorter than 30 m [6,24]. The standard rotation age for plantations in Japan is becoming longer, and the number of aged plantations is increasing [25]. However, the environmental factors that determine the height of aged C. japonica trees have not been determined.
This study aimed to examine the environmental factors, other than climate, that influence the height of C. japonica trees of around 100 years of age in the Boso Peninsula, Japan. The findings of this research provide information for the selection of suitable sites of long rotation systems. This information could be useful for the planning and management of plantation forestry.

2. Materials and Methods

2.1. Study Site

The study was conducted at The University of Tokyo Chiba Forest of the Graduate School of Agricultural and Life Sciences, the University of Tokyo on the Pacific Ocean side of Japan. The Chiba Forest is located in the Southeast part of the Boso Peninsula in the Kanto region and extends from 140°5′35″ to 10′15″ E and from 35°8′05″ to 12′45″ N. The mean annual precipitation and annual mean temperature ± standard deviation at the site from 1989 to 2018, with missing data for 2001, 2009, and 2013–2016, was 2202 ± 362 mm and 14.2 ± 0.4 °C, respectively [26]. The rainfall is seasonal, with 60.5 ± 5.7% of the annual precipitation occurring from May to October, and the monthly precipitation of July and August from 1989 to 2018 was less than 50 mm in 10 out of 24 years [26]. The annual evapotranspiration of the 70-year-old mixed plantation of the C. japonica and Chamaecyparis obtusa at the Chiba Forest was estimated at 1240 ± 157 mm [27]. The bedrocks in the Chiba Forest are sedimentary rocks of Neogene strata, which consist of sandstone, conglomerate, mudstone, and tuff [28]. The soils in the Chiba Forest are derived from sedimentary rocks and were strongly influenced by volcanic ash during the Quaternary. The soils are Brown Forest Soils and Black Soils, according to the Japanese forest soil classification system [29]. The texture of most soils was clay loam [30].
The study stands were even-aged C. japonica plantations whose stand ages ranged from 93 to 115 years old and whose elevations ranged from 154 to 341 m (Table A1).

2.2. Field Survey

Study plots were chosen by field observation on the relationship between topographic conditions and tree heights. Sixty-eight study plots were established in 25 sub-compartments—28 of these were on ridges, and 40 were on the middle or lower sections of slopes. The plot size was 10 × 10 m. The tree height (H) of the tallest tree in each plot was measured using a laser distance-measuring instrument (TruPulse200, Laser Technology Inc. Centennial, CO, USA). Increments in the height of C. japonica planted trees from the 95-year-old to 115-year-old were estimated at 0.8 to 1.8 m according to site qualities [31,32]. The tree height at the 100-year age (H100) was estimated using the measured H, stand age, and mean annual height growth during 95- to 115-year-old.
The soil depths at five points were measured around the tallest tree using a soil penetration meter (Daiki Rika Kogyo Co., Ltd. Saitama, Japan), with a cone base area of 3.14 cm2, a weight of 1.18 kg, and a drop height of 21 cm. Soil depth was determined as the depth up to bedrock or a layer rich in boulders. When more than 100 drops were needed to make the cone penetrate 4 cm, we considered the cone to have reached bedrock or a layer rich in boulders. The mean of the three deepest soil depths was regarded as the soil depth (SD) of the plot. The field surveys were conducted from October 2008 to February 2009 and from October to November 2009.

2.3. Topographic Analysis

The topographic wetness index (WI) and topographic openness (OP) of each plot were calculated using a digital elevation model (DEM) with 10 m × 10 m grid cells [33] using a geographical information system analysis program, TNTlitev er.6.4 (Micro Images). The DEM was prepared using a 1/25,000 topographic map. WI was developed for a hydrological forecasting model of a basin and expressed water flow and accumulation [34], and the significant correlation between WI and soil moisture content was reported [35]. OP is a topographic index of the amount of observable sky and expresses the degree of dominance or enclosure of a location on an irregular surface [36,37]. OP is calculated only due to the undulations of the ground surface, and the obstruction of visibility due to vegetation is not considered in OP. In general, WI of the convex terrain is smaller than one of the concave terrains and the OP of the convex terrain is larger than one of concave terrains. Therefore, a negative correlation is generally observed between WI and OP.
The WI was calculated using the equation
WI = ln(A/tanB)
where WI is the topographic wetness index, A is the specific catchment area (m2 m−1), and B is the slope gradient. TheA was calculated as the catchment area/grid width, where the catchment area is calculated as the flow accumulation, and the grid width is 10 m [38,39].
OP was calculated using the equation
OP = 90 − X
where X is an average of the angles of elevation for the eight directions N, NE, E, SE, S, SW, W, and NW. The angle of elevation for each direction is the maximum angle of elevation calculated using the DEM [36].

2.4. Statistical Method

Simple correlation analyses and multiple linear regression analyses between H100 and environmental factors were conducted using R (ver.3.5.1). In order to evaluate how each environmental factor affected the height of aged C. japonica trees, we obtained a standardized partial regression coefficient. We used Akaike′s information criteria (AIC) for the model selection procedure. The formula for AIC [40] could be expressed as follows:
AIC = n ln(σ2) + 2(p + 1)
where n is the number of observations, σ2 is the mean square error and p is the number of parameters.

3. Results

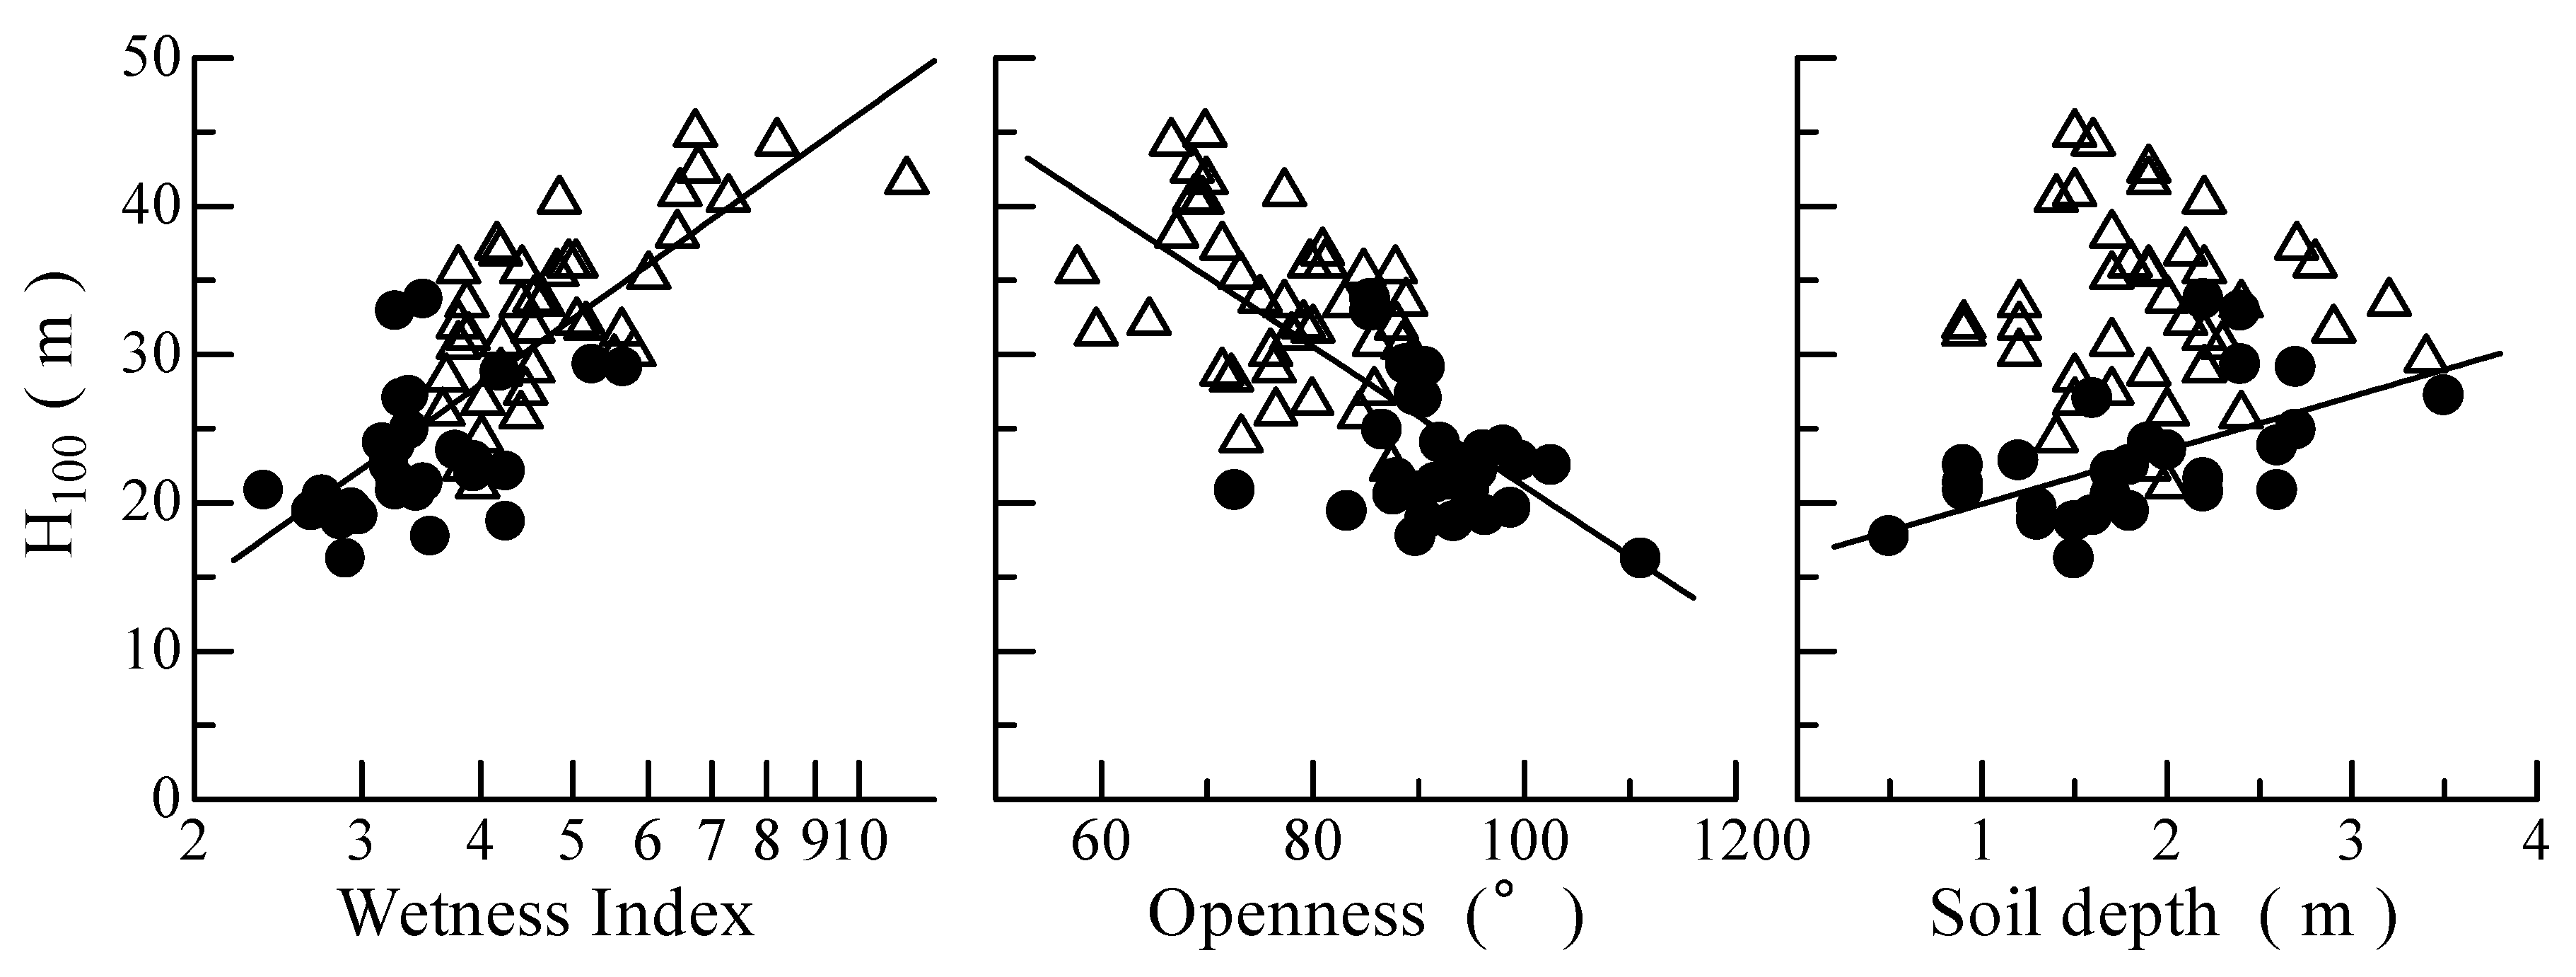
3.1. Topographical Characteristics and Tree Heights

The H100 ranged from 16.2 to 44.9 m, and the mean H100 of the plots on the ridges (22.9 ± 4.3 m, ranging from 16.2 to 33.7 m) was significantly shorter than that of the plots on the middle or lower sections of the slopes (33.2 ± 5.7 m, ranging from 21.2 to 44.9 m) (p < 0.001, Figure 1). The WI ranged from 2.37 to 11.23, and the mean WI of the plots on the ridges (3.47 ± 0.70, ranging from 2.37 to 5.66) was smaller than that of the plots on the middle or lower section of slopes (5.03 ± 1.47, ranging from 3.65 to 11.23) (p < 0.001, Figure 1, Table A1). As the catchment area of the plots on the ridge was 100 m2, WI was determined by the slope gradient. Plots R18 and R19 had high WI and were on the river terraces. The OP ranged from 57.7 to 111.1° (Figure 1, Table A1), and the OP of the plots on the ridges (92.1 ± 6.9°, ranging from 72.7 to 111.1°) was larger than that of the plots on the middle or lower section of the slopes (77.2 ± 8.4°, ranging from 57.7 to 91.9°) (p < 0.001, Figure 1, Table A1). The SD ranged from 0.5 to 3.5 m (Figure 1, Table A1), and it did not differ between the plots on the ridges (1.8 ± 0.7 m, ranging from 0.5 to 3.5 m) and the middle or lower sections of the slopes (1.9 ± 0.6 m, ranging from 0.9 to 3.4 m) (p = 0.59, Figure 1, Table A1).
The relationship between H100 and WI was shown as a saturation curve and there was a significant correlation between logWI and H100 (H100 = 45.7 logWI + 0.46; r = 0.78, p < 0.001; Figure 1). There was a significant correlation between logWI and OP (r = −0.57, p < 0.001), and a significant correlation was also observed between OP and H100 (H100 = −0.47 OP + 68.2; r = −0.70, p < 0.001; Figure 1). There was no significant correlation between SD and H100 (H100 = 2.18 SD + 24.8; r = 0.19, p = 0.14; Figure 1). However, a significant correlation was found between SD and H100 for the plots on the ridges (H100 = 3.65 SD + 16.3; r = 0.57, p = 0.002). For the plots with the same SD, H100 on the ridges tended to be shorter than that on the middle or lower sections of the slopes. For the plots on the ridges, the correlation coefficient between the H100 and logWI or OP was 0.41 or −0.32, respectively. The correlation coefficient with SD (0.57) was the highest among the three environmental factors for the plots on the ridges.

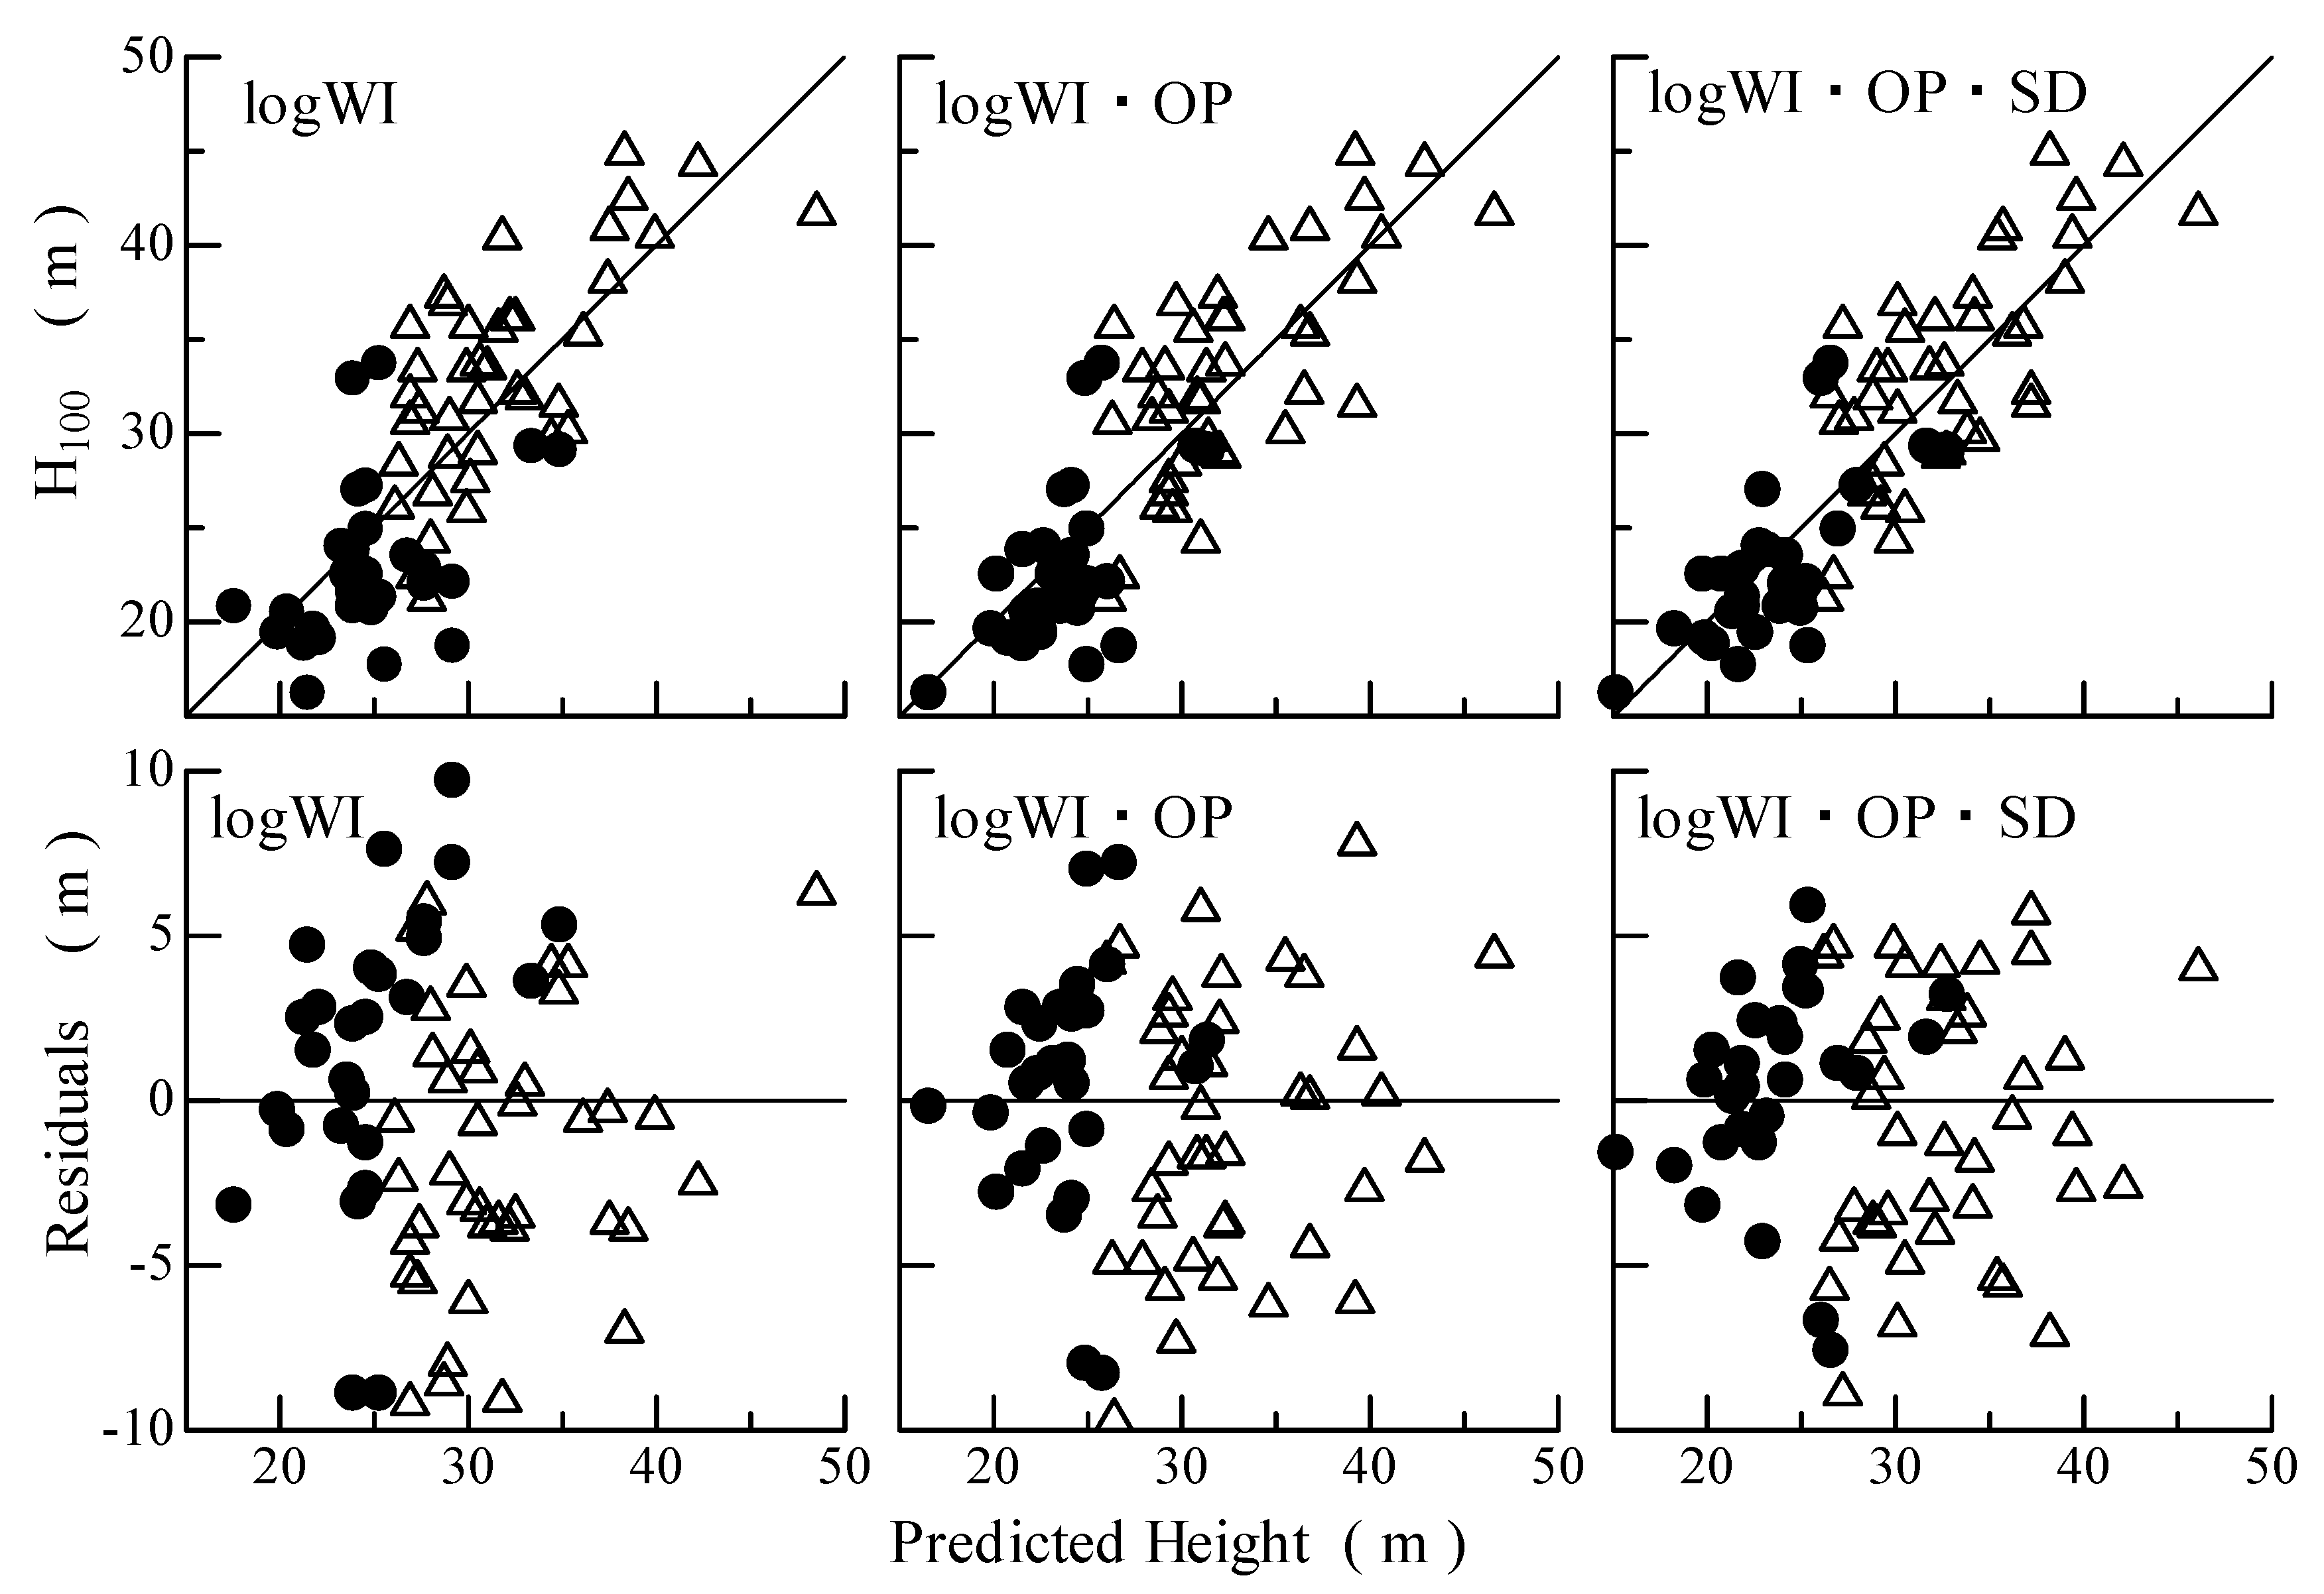
3.2. Prediction of Tree Height from Topographical Characteristics

Using logWI, logWI and OP, or logWI, OP and SD as explanatory variables, regression equations for predicting the H100 by multiple linear regression models were obtained. The obtained equations are shown in Figure 2.
For the predictions using logWI and logWI and OP, there was a tendency to overestimate the H100 of the plots on the ridges and to underestimate the H100 of the plots on the middle or lower sections of the slopes (Figure 2). This tendency weakened for the predictions using logWI, OP and SD (Figure 2). The standard errors of the height predicted using logWI, logWI and OP, or logWI, OP and SD were 4.5, 4.0, and 3.7 m, respectively. The prediction model using logWI, OP and SD was selected by the model selection procedure of the AIC (logWI:402, logWI and OP: 386, logWI, OP and SD: 378). All explanatory variables of the prediction model using logWI, OP and SD were selected as the significant variables (logWI (p < 0.001), OP (p < 0.001), SD (p = 0.004)). The standardized partial regression coefficient of logWI, OP or SD were 3.86, −2.97, and 1.41, respectively. The logWI was the most important variable and the importance of OP was comparable with logWI.

4. Discussion

The height (H100) of aged C. japonica trees was significantly correlated with logWI (r = 0.78) and OP (r = −0.70). In general, when the position of a plot was lower on a slope, the WI tended to be larger, and the OP tended to be smaller. The larger the WI, the more likely the location would have moist soil conditions. When rainwater flows through the soil, soil nutrients also dissolve and flow. In addition, the degradation of organic matter and the mineralization of nutrients occurs more rapidly in moist soil conditions. Therefore, the larger the WI, the more likely the location is to have fertile soil conditions. It has been reported that the height growth rate of C. japonica saplings within five years after planting was correlated with the foliage nitrogen concentration [30]. However, no significant correlation was found between the site index of C. japonica with the reference age of 40 years old and foliage nitrogen concentration [41], suggesting that the influence of soil fertility on tree height growth was large in the growth stage of increasing the leaf mass of a tree. High correlations between the site index and indices of soil water conditions, such as WI, have been reported for C. japonica [6,24] and Canadian boreal forest species [8]. Therefore, WI is likely to be an appropriate indicator of the influence of environmental factors on the site index.
The correlation between H100 and OP was almost as high as that with WI (Figure 1). Although Zushi [24] also reported a significant correlation between site index (ranging 21.8 to 29.9 m) for a reference stand of 40 years old and OP, the correlation was much lower than that between the site index and WI. A high correlation between the OP and H100 in this study suggested that the influence of winds on height growth may increase with an increase in height.
The significant correlation between tree height and SD for the plots on ridges, as opposed to the plots on the middle or lower sections of slopes, suggests that the effect of SD on height growth was largest at sites with relatively dry soil conditions. As SD did not correlate with tree height in moist soil conditions, the water retention capacity of SD could be a critical factor for the height growth of aged C. japonica trees under relatively dry soil conditions. These findings are in agreement with Meredieu et al. [42], who reported the effect of SD on the height growth of Quercus rubra.
The coefficient of determination adjusted by the number of parameters for predicting H100 using multiple linear regression models increased by the inclusion of OP and SD to the logWI as explanatory variables. Based on the standardized partial regression coefficient in the selected model, the importance of OP was comparable with logWI. It suggested that OP was an important environmental factor that limited the height of aged trees. The correlation coefficient between the WI and site index of C. japonica depended on the resolution level of the DEM and was significant in the case of using a 12.5-m high-resolution DEM [6]. As the water flow process in a basin is sensitive to fine topography, appropriate soil water dynamics could be simulated using high-resolution DEM [43]. In Japan, the development of a 5-m-resolution DEM from airborne laser scanner data is being promoted [31], and these airborne laser scanners can map tree heights [44,45]. As WI and OP, which were calculated using DEM, can predict tree height with high accuracy, the use of an airborne laser scanner to measure tree heights and micro-topography could improve the analysis of the relationships between topographic conditions and site index.
One of the foci of this study was to evaluate the effect of SD on the heights of aged trees. Previous studies on environmental factors and the productivity of plantations in Japan have focused on using a site index with the dominant tree height of 40-year-old trees [6,16,18,24]. Mashimo [18] reported a high correlation between the site index of C. japonica and soil physical properties, which was related to rooting of up to 50 cm deep. We found that SD was the most influencing environmental factor on the heights of aged C. japonica trees in relatively dry soil conditions (Figure 1).
In the case of the long rotation system, we need to consider the influence of climate change for the selection of suitable sites for plantation. At the end of the 21st century, the climate around Japan is projected to increase in the mean monthly air temperature by about 3 °C and in the frequency of heavy precipitation and winter storms [46]. An increase in precipitation in August is predicted with a delay at the end of the rainy season [47]. However, future increases in annual precipitation are unclear because of large uncertainty. Although an increase in air temperature would increase evapotranspiration, an increase in summer precipitation could mitigate the water stress of trees. According to the Japan Meteorological Agency, annual instantaneous maximum wind speeds higher than 40 m s−1 were observed at the Katsuura weather station (about 20 km in the distance from the Chiba Forest) in seven years during 53 years (1967–2019), and the four years were in the recent six years [48]. The frequency and intensity of strong wind events could increase in the future. The sensitivity to wind damage is significantly related to tree height [15]. A consideration of the influence of strong wind events will become more important for the planning and management of plantation forestry.

5. Conclusions

The relationship between the height of aged C. japonica trees and the WI, OP, and SD showed that WI was the environmental factor with the most influence on the height of aged trees. It was also suggested that the influence of OP was comparable with WI. As the correlations between SD and tree height were significant for plots on the ridges, soil water retention capacity could limit tree heights at sites with relatively dry soil conditions. In addition, as the inclusion of OP and SD in the models improved better prediction, the effects of wind and rooting depth on tree height could increase with height growth. This is a first report on the relationship between topographic factors and height of aged C. japonica trees, and the effect of soil depth on the height of the aged trees. The findings of this research could be used on the planning and management of forestry plantations of the long rotation system.

Author Contributions

T.T. conceived, designed the research, and wrote the manuscript; T.T. and F.G. performed the field survey and the data analysis. All authors have read and agreed to the published version of the manuscript.

Funding

This study was financially supported in part by a Grant-in-Aid for Scientific Research to T.T. (#21380092) from the Japan Society for the Promotion of Science.

Acknowledgments

In this section you can acknowledge any support given which is not covered by the author contribution or funding sections. This may include administrative and technical support, or donations in kind (e.g., materials used for experiments).

Conflicts of Interest

The authors declare no conflict of interest.

Appendix A

Table A1. Topographical characteristics and tree heights of plots.
PlotAgeElevationDirectionSlopeWetness IndexOpennessSoil Depth (m)Height (m)
(Year)(M)(°)(°)(°)
R19432098193.3793.80.922.1
R29922655213.2698.12.623.7
R39927324784.2695.61.722.0
R4100321205432.3772.70.920.8
R5100312129113.9499.61.222.8
R610025121213.2685.52.432.9
R7100305233302.8590.71.318.8
R8100302201213.2688.02.221.6
R9100217161193.3789.73.527.2
R1010230474233.1692.11.924.1
R1110322372173.4991.70.921.5
R1210330859272.9896.41.619.3
R13103316233133.7796.22.023.7
R14105196210203.3190.41.627.3
R15105202265113.9495.51.722.3
R1610520517173.4985.52.234.2
R17105239297183.4389.72.221.0
R1810619727935.2588.92.429.8
R1910621035025.6690.72.729.6
R20107227276163.5589.80.518.0
R21108280259223.21102.61.823.0
R22113340276282.9398.81.320.3
R23114340162292.89111.11.516.8
R2411430226384.2693.41.519.5
R25114323284332.7387.71.721.3
R26115314297352.6683.31.820.2
R2711521787213.2694.92.621.6
R28115154199193.3786.62.725.9
M193270132424.2071.41.928.3
M294308132233.8587.41.922.0
M394292161284.5480.02.931.2
M494299124323.8783.02.432.9
M59625549364.4177.31.233.0
M69623273276.4467.11.737.7
M799270310184.8184.81.935.4
M89918639185.0481.22.836.0
M999233205424.0279.91.526.7
M1099245208167.2968.81.440.4
M1199243298296.7868.61.942.4
M12100239345324.1671.42.737.3
M1310026280314.2080.92.136.9
M14100229108463.8878.02.231.2
M15100250350234.9579.71.836.1
M16100298278445.6359.50.931.5
M17102272118404.5675.02.033.9
M18103276247216.4877.31.541.2
M19103296227343.7979.10.932.2
M2010423097404.4257.71.936.1
M21104198232166.7369.81.545.3
M22104205283343.7987.82.236.1
M2310426547373.6872.31.528.7
M2410520621294.8469.52.240.8
M25105293299305.0564.52.132.7
M2610519618538.2066.61.644.7
M27105193283311.2369.91.942.1
M28105213281244.2185.81.731.2
M2910719933695.5389.53.430.3
M30107238342165.1687.91.232.5
M31107197231343.7988.52.331.2
M32108267188284.5476.32.229.6
M33108255172204.4184.42.426.4
M3410919356383.6576.52.026.7
M35111341324373.9791.92.021.8
M361141836164.6588.83.234.8
M37114214274364.0173.21.425.2
M38114218352134.4685.81.728.6
M39114295128235.8076.01.231.2
M40115210233256.0173.11.736.7
R1–R28 are plots on the ridges and M1–M40 are plots on the middle or lower sections of the slopes.

References

  1. Allen, C.D.; Macalady, A.K.; Chenchouni, H.; Bachelet, D.; McDowell, N.; Vennetier, M.; Kitzberger, T.; Rigling, A.; Breshears, D.D.; Hogg, E.H.; et al. A global overview of drought and heat-induced tree mortality reveals emerging climate change risk for forests. For. Ecol. Manag. 2010, 259, 660–684. [Google Scholar] [CrossRef] [Green Version]
  2. Kirilenko, A.P.; Sedjo, R.A. Climate change impacts on forestry. Proc. Natl. Acad. Sci. USA 2007, 104, 19697–19702. [Google Scholar] [CrossRef] [PubMed] [Green Version]
  3. Skovsgaard, J.P.; Vanclay, J.K. Forest site productivity: A review of the evolution of dendrometric concepts for even-aged stands. Forestry 2008, 81, 13–31. [Google Scholar] [CrossRef] [Green Version]
  4. Bontemps, J.D.; Bouriaud, O. Predictive approaches to forest site productivity: Recent trends, challenges and future perspectives. Forestry 2014, 87, 109–128. [Google Scholar] [CrossRef]
  5. Gonzalez-Rodriguez, M.A.; Dieguez-Aranda, U. Exploring the use of learning techniques for relating the site index of radiata pine stands with climate, soil and physiography. For. Ecol. Manag. 2020, 458, 117803. [Google Scholar] [CrossRef]
  6. Mitsuda, Y.; Ito, S.; Sakamoto, S. Predicting the site index of sugi plantations from GIS-derived environmental factors in Miyazaki Prefecture. J. For. Res. 2007, 12, 177–186. [Google Scholar] [CrossRef]
  7. Hunter, I.R.; Gibson, A.R. Predicting Pinus radiata site index from environmental variables. N. Z. J. For. Sci. 1984, 14, 53–64. [Google Scholar]
  8. Bjelanovic, I.; Comeau, P.G.; White, B. High resolution site index prediction in boreal forests using topographic and wet areas mapping attributes. Forests 2018, 9, 113. [Google Scholar] [CrossRef] [Green Version]
  9. Socha, J.; Tyminska-Czabanska, L.; Grabska, E.; Orzel, S. Site index models for forest-forming tree species in Poland. Forests 2020, 11, 301. [Google Scholar] [CrossRef] [Green Version]
  10. Yoder, B.J.; Ryan, M.G.; Waring, R.H.; Schoettle, A.W.; Kaufmann, M.R. Evidence of reduced photosynthetic rates in old trees. For. Sci. 1994, 40, 513–527. [Google Scholar]
  11. Ryan, M.G.; Yoder, B.J. Hydraulic limits to tree height and tree growth. BioScience 1997, 47, 235–242. [Google Scholar] [CrossRef] [Green Version]
  12. Ryan, M.G.; Bond, B.J.; Law, B.E.; Hubbard, R.B.; Woodruff, D.V.; Cienciala, E.; Kucera, J. Transpiration and whole-tree conductance in ponderosa pine trees of different heights. Oecologia 2000, 124, 553–560. [Google Scholar] [CrossRef]
  13. Koch, G.W.; Sillett, S.C.; Jennings, G.M.; Davis, S.D. The limits to tree height. Nature 2004, 428, 851–854. [Google Scholar] [CrossRef] [PubMed]
  14. Ueda, M.; Shibata, E. Why do trees decline or dieback after a strong wind? Water status of Hinoki cypress standing after a typhoon. Tree Physiol. 2004, 24, 701–706. [Google Scholar] [CrossRef] [PubMed] [Green Version]
  15. Locatelli, T.; Tarantola, S.; Gardiner, B.; Patenaude, G. Variance-based sensitivity analysis of a wind risk model-Model behavior and lessons for forest modelling. Environ. Model. Softw. 2017, 87, 84–109. [Google Scholar] [CrossRef] [Green Version]
  16. Nishizawa, M.; Mashimo, Y.; Kawabata, K. Estimation method of site index by quantification. Bull. FFPRI. 1965, 176, 1–54, (In Japanese with English summary). [Google Scholar]
  17. Nakamura, T. Relation between the soil morphological properties and the growing processes of Cryptomeria stands in the University Forest in Tiba Prefecture. Bull. Univ. Tokyo For. 1943, 32, 1–70, (In Japanese with English Summary). [Google Scholar]
  18. Mashimo, Y. Studies on the physical properties of forest soil and their relation to the growth of sugi (Cryptomeria japonica) and hinoki (Chamaecyparis obtusa). For. Soils Jpn. 1960, 11, 1–182, (In Japanese with English Summary). [Google Scholar]
  19. Tange, T.; Matsumoto, Y.; Mashimo, Y.; Sakura, T. Course of height growth of Cryptomeria japonica trees planted on a slope. Comparison among the near ridge, the mid-slope and the near bottom in the Tokyo University Forest in Chiba. Bull. Univ. Tokyo For. 1989, 81, 39–51, (In Japanese with English Summary). [Google Scholar]
  20. Karizumi, N. Illustration of Tree Roots; Seibunndo Sinkosha: Tokyo, Japan, 1979; pp. 592–596. (In Japanese) [Google Scholar]
  21. Tange, T.; Someya, M. Soil properties of Cryptomeria japonica plantations with different height growth courses at the Experimental Station at Tanashi, The University of Tokyo. Misc. Inf. Univ. Tokyo For. 2013, 53, 1–7. (In Japanese) [Google Scholar]
  22. Tange, T.; Someya, M.; Norisada, M.; Masumori, M. Photosynthetic limitation of similar-height Cryptomeria japonica trees growing at different rates. Photosynthetica 2013, 51, 158–160. [Google Scholar] [CrossRef]
  23. Sakata, M. Evaluation of possible causes for the decline of Japanese cedar (Cryptomeria japonica) based on elemental composition and δ13C of needles. Environ. Sci. Technol. 1996, 30, 2376–2381. [Google Scholar] [CrossRef]
  24. Zushi, K. Spatial distribution of soil carbon and nitrogen storage and forest productivity in a watershed planted to Japanese cedar (Cryptomeria japonica D. Don). J. For. Res. 2006, 11, 351–358. [Google Scholar] [CrossRef]
  25. Forestry Agency. Annual Report on Forest and Forestry in Japan, Fiscal Year 2018. Available online: https://www.maff.go.jp/e/data/publish/attach/pdf/index-170.pdf (accessed on 10 May 2020).
  26. The University of Tokyo Forests. Meteorological Data. 2020. Available online: http://www.uf.a.u-tokyo.ac.jp/research_division/data/kishou/index_english.html (accessed on 1 March 2020).
  27. Maita, E.; Suzuki, M.; Ohta, T. Change in the annual discharge after clear-cutting a 70-year-old mixed plantation of sugi and hinoki in a Tertiary formation area. J. Jpn. For. Soc. 2005, 87, 124–132, (In Japanese with English Summary). [Google Scholar] [CrossRef]
  28. IIjima, A.; Ikeya, N. Geology of the Tokyo University Forest in Chiba. Misc. Inf. Univ. Tokyo For. 1976, 20, 1–38, (In Japanese with English Summary). [Google Scholar]
  29. Forest Soil Division. Classification of forest soils in Japan. Bull. FFPRI 1976, 280, 1–28, (In Japanese with English Summary). [Google Scholar]
  30. Tange, T. Ecophysiological study on the growth of Cryptomeria japonica planted trees. Bull. Univ. Tokyo For. 1995, 93, 1–139, (In Japanese with English Summary). [Google Scholar]
  31. Shiraishi, N. Study on the growth prediction of even-aged stands. Bull. Univ. Tokyo For. 1986, 75, 199–256, (In Japanese with English Summary). [Google Scholar]
  32. Suzuki, M.; Shiraishi, N.; Suzuki, M.; Tatsuhara, S.; Yamamoto, H. Studies on the growth of old sugi (Cryptomeria japonica) stand (I): The development process of the old sugi plantations in the Kiyosumi area. Bull. Univ. Tokyo For. 2003, 109, 27–45, (In Japanese with English Summary). [Google Scholar]
  33. Geospatial Information Authority of Japan. Digital Elevation Model. 2020. Available online: https://fgd.gsi.go.jp/download/ref_dem.html (accessed on 1 March 2020).
  34. Beven, K.J.; Kirkby, M.J. A physically based, variable contributing area model of basin hydrogy. Hydrol. Sci. 1979, 24, 43–69. [Google Scholar] [CrossRef] [Green Version]
  35. Li, X.; McCarty, G.W.; Lang, M.; Ducey, T.; Hunt, P.; Miller, J. Topographic and physicochemical control on soil denitrification in prior converted croplands located on the Delmarva Peninsula, USA. Geoderma 2018, 309, 41–49. [Google Scholar] [CrossRef]
  36. Yokoyama, R.; Shirasawa, M.; Kikuchi, Y. Representation of topographic feature by openness. J. Jpn. Soc. Photogramm. Remote Sens. 1999, 38, 26–34, (In Japanese with English Summary). [Google Scholar]
  37. Prime, O.D.A.; Echigo, A.; Yokoyama, R.; Yoshida, T. Supervised landform classification of Northeast Honshu from DEM-derived thematic maps. Geomorphology 2006, 78, 373–386. [Google Scholar] [CrossRef]
  38. Quinn, P.F.; Beven, K.J. Spatial and temporal predictions of soil moisture dynamics, runoff, variable source areas and evapotranspiration for Plynlimon, Mid-Wales. Hydrol. Process. 1993, 7, 425–448. [Google Scholar] [CrossRef]
  39. Quinn, P.F.; Beven, K.J.; Lamb, R. The ln(a/tanβ) index: How to calculate and how to use it within the TOPMODEL framework. Hydrol. Process. 1995, 9, 161–182. [Google Scholar] [CrossRef]
  40. Akaike, H. A new look at the statistical model identification. IEEE Trans. Autom. Control 1974, 19, 716–723. [Google Scholar] [CrossRef]
  41. Ito, T.; Ueda, M.; Miyauchi, H. Variation of the nutrient content in sugi (Cryptomeria japonica) needles according to tree age, site quality and forest site unit. J. Jpn. For. Soc. 1972, 54, 74–79, (In Japanese with English Summary). [Google Scholar]
  42. Meredieu, C.; Arrouays, D.; Goulard, M.; Auclair, D. Short range soil variability and its effect on red oak growth (Quercus rubra L.). Soil Sci. 1996, 161, 29–38. [Google Scholar] [CrossRef]
  43. Zhang, W.; Montgomery, D.R. Digital elevation model grid size, landscape representation and hydrologic simulations. Water Resour. Res. 1994, 30, 1019–1028. [Google Scholar] [CrossRef]
  44. Socha, J.; Pierzchalski, M.; Baiazy, R.; Clesieiski, M. Modelling top height growth and site index using repeated laser scanning data. For. Ecol. Manag. 2017, 406, 307–317. [Google Scholar] [CrossRef]
  45. Noordermeer, L.; Gobakken, T.; Naessert, E.; Bollandsas, O.M. Predicting and mapping site index in operational forest inventories using bitemporal airborne laser scanner data. For. Ecol. Manag. 2020, 457, 117768. [Google Scholar] [CrossRef]
  46. Sasaki, H.; Murata, A.; Hanafusa, M.; Oh’izumi, M.; Kurihara, K. Projection of future climate in a non-hydrostatic regional climate model nested within an atmospheric general circulation model. SOLA 2012, 8, 53–56. [Google Scholar] [CrossRef] [Green Version]
  47. Kusumoto, S.; Mizuta, R. Future changes in the baiu rain band projected by a 20-km mesh global atmospheric model: Sea surface temperature dependence. SOLA 2008, 4, 85–88. [Google Scholar]
  48. Japan Meteorology Agency. Archives of Weather Observations. Available online: http://www.data.jma.go.jp/obd/stats/etrn/index.php (accessed on 4 July 2020).
Figure 1. Relationships between tree heights and wetness index, openness, or soil depth (n = 68). The x axis in the left panel is a logarithmic scale. Filled circles indicate the plots on the ridges (n = 28) and open triangles indicate the plots on the middle or lower sections of the slopes (n = 40). The regression lines were shown in the figure. For soil depth, the regression line obtained from the plots on the ridges is shown.
Forests 11 00771 g001
Figure 2. Tree height (H100) prediction using multiple regression analysis with the wetness index (H100 = 45.7 logWI + 0.46; aR2 = 0.60; AIC = 402), the wetness index and openness (H100 = 33.0 logWI – 0.26 OP + 29.8; aR2 = 0.69; AIC = 386), and the wetness index, openness, and soil depth (H100 = 31.5 logWI – 0.28 OP + 2.34 SD + 28.0; aR2 = 0.73; AIC = 378) (n = 68). Filled circles indicate plots on the ridges and, open triangles indicates plots on the middle or lower sections of the slopes. aR2: coefficient of determination adjusted by the number of parameters.
Forests 11 00771 g002

