Article

Carbon and Nitrogen Stocks in Three Types of Larix gmelinii Forests in Daxing’an Mountains, Northeast China

1
School of forestry, Northeast Forestry University, Harbin 150040, China
2
Key Laboratory of Sustainable Forest Ecosystem Management-Ministry of Education, Northeast Forestry University, Harbin 150040, China
*
Author to whom correspondence should be addressed.
Forests 2020, 11(3), 305; https://doi.org/10.3390/f11030305
Submission received: 3 February 2020 / Revised: 5 March 2020 / Accepted: 9 March 2020 / Published: 11 March 2020
(This article belongs to the Special Issue Forest Resources Assessments: Mensuration, Inventory and Planning)

Abstract

:
Studying carbon and nitrogen stocks in different types of larch forest ecosystems is of great significance for assessing the carbon sink capacity and nitrogen level in larch forests. To evaluate the effects of the differences of forest type on the carbon and nitrogen stock capacity of the larch forest ecosystem, we selected three typical types of larch forest ecosystems in the northern part of Daxing’an Mountains, which were the Rhododendron simsii-Larix gmelinii forest (RL), Ledum palustre-Larix gmelinii forest (LL) and Sphagnum-Bryum-Ledum palustre-Larix gmelinii forest (SLL), to determine the carbon and nitrogen stocks in the vegetation (trees and understories), litter and soil. Results showed that there were significant differences in carbon and nitrogen stocks among the three types of larch forest ecosystems, showing a sequence of SLL (288.01 Mg·ha−1 and 25.19 Mg·ha−1) > LL (176.52 Mg·ha−1 and 14.85 Mg·ha−1) > RL (153.93 Mg·ha−1 and 10.00 Mg·ha−1) (P < 0.05). The largest proportions of carbon and nitrogen stocks were found in soils, accounting for 83.20%, 72.89% and 64.61% of carbon stocks and 98.61%, 97.58% and 96.00% of nitrogen stocks in the SLL, LL and RL, respectively. Also, it was found that significant differences among the three types of larch forest ecosystems in terms of soil carbon and nitrogen stocks (SLL > LL > RL) (P < 0.05) were the primary reasons for the differences in the ecosystem carbon and nitrogen stocks. More than 79% of soil carbon and 51% of soil nitrogen at a depth of 0–100 cm were stored in the upper 50 cm of the soil pool. In the vegetation layer, due to the similar tree biomass carbon and nitrogen stocks, there were no significant differences in carbon and nitrogen stocks among the three types of larch forest ecosystems. The litter carbon stock in the SLL was significantly higher than that in the LL and RL (P < 0.05), but no significant differences in nitrogen stock were found among them (P > 0.05). These findings suggest that different forest types with the same tree layer and different understory vegetation can greatly affect the carbon and nitrogen stock capacity of the forest ecosystem. This indicates that understory vegetation may have significant effects on the carbon and nitrogen stocks in soil and litter, which highlights the need to consider the effects of understory in future research into the carbon and nitrogen stock capacity of forest ecosystems.

1. Introduction

Forest is a large carbon and nitrogen pool in terrestrial ecosystems [1,2], playing an important role in regulating the global stock, distribution and cycling of carbon and nitrogen [3,4,5]. The accurate estimation of carbon and nitrogen stocks in forest ecosystem is key to assessing the potential of forest carbon sinks, assessing forest functions in reducing the atmospheric carbon and nitrogen oxides, and coping with climate change [6,7]. However, carbon and nitrogen stocks in forest ecosystem are significantly affected by the forest type, land use, climate and forest management [8,9,10]. The forest type is a particularly vital factor for ecosystem carbon and nitrogen stocks in areas with the same climate [11]. The forest type can change the species composition, community structure, and productivity of the forest ecosystem, and these changes may have a significant effect on forest ecosystem carbon and nitrogen stocks and distribution features [12,13]. In boreal forest ecosystems, previous studies have shown the high uncertainty of carbon stocks [14], suggesting that the effect of forest type on carbon and nitrogen stocks in forest ecosystems is critical. The boreal forest is extremely sensitive to climate change [15], as it is the world’s second-largest forest biome and has a large amount of carbon stocks [16]. Some studies have shown that the carbon sink capacity of boreal forests has been weakening due to the effect of human and natural disturbances [17,18]. Thus, research on the effect of forest type on the accurate estimation of forest ecosystem carbon and nitrogen stocks in boreal forest is important in the context of continuing global warming.
While previous studies have examined the carbon and nitrogen stocks and distribution in different forest types [5,19,20], these studies have mainly focused on forest ecosystems dominated by different tree components [21,22] to explore how and to what extent the species mixtures and specific tree species may impact forest carbon and nitrogen stocks [19]. Few researchers have examined differences in forests that differ predominantly with respect to the tree layer and understory vegetation. Although the understory vegetation contributes little to ecosystem carbon and nitrogen stocks due to the lower biomass, it is highly possible that understory vegetation plays vital roles in regulating carbon and nitrogen in the forest ecosystem, especially for soil [23]. Understory variation may result in the input of different organic matters from litter and roots, causing differences in soil temperature and moisture, soil microbial richness and composition, and soil property and nutrient levels. Meanwhile, while previous studies on carbon and nitrogen in the forest ecosystems also have shown significant differences in soil nutrients, soil property, soil greenhouse gas emission and vegetation biomass [24,25,26,27], the effect of these forest types on forest ecosystem carbon and nitrogen stocks remains unclear.
The present study aimed at the typical Larix gmelinii (Rupr.) Rupr. forest in the north of Daxing’an Mountains. Three types of typical larch forest ecosystems, all characterized by the same tree layer and different understory vegetation [27], namely the Sphagnum-Bryum-Ledum palustre-Larix gmelinii forest (SLL), Rhododendron dauricum-Larix gmelinii forest (RL) and Ledum palustre-Larix gmelinii forest (LL), were studied to compare their carbon and nitrogen stocks and distribution in each forest ecosystem. Our results explore the effect of forest types on the carbon and nitrogen in larch forests and are expected to provide a new method for accurately estimating carbon and nitrogen stocks.

2. Materials and Methods
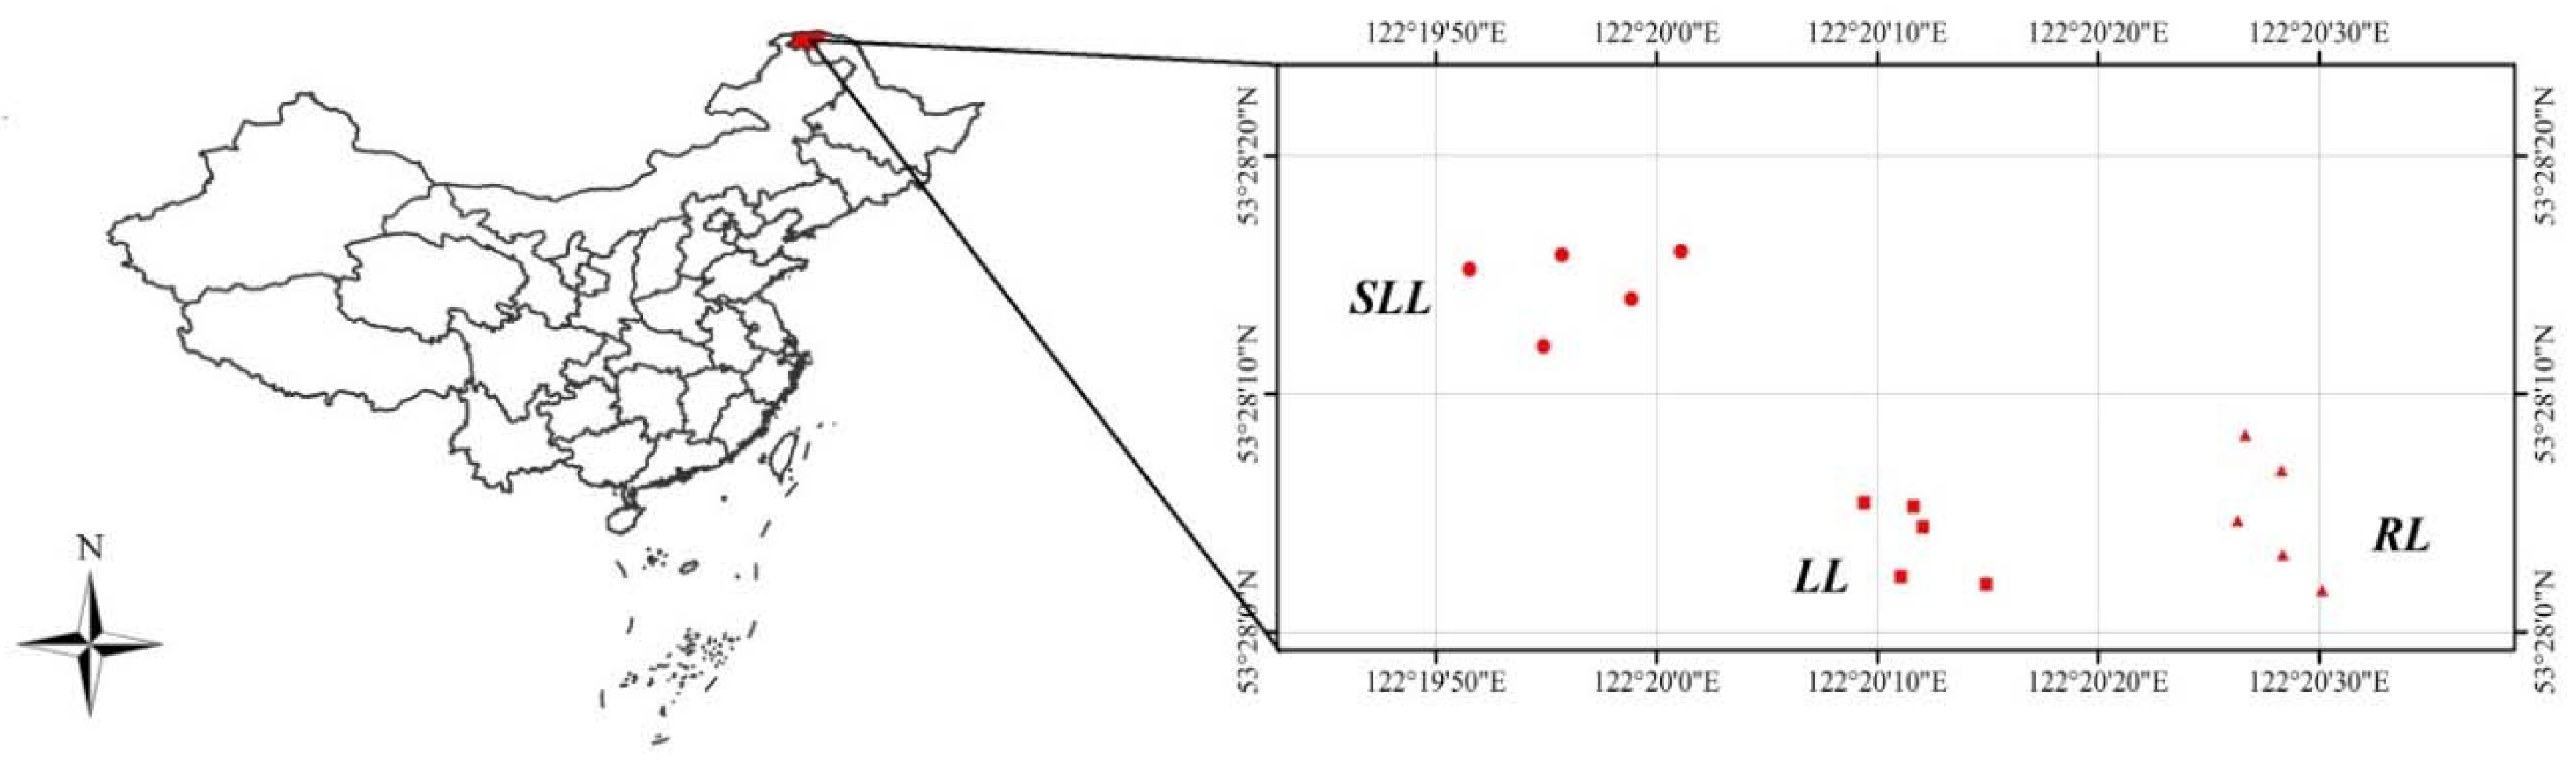
2.1. Study Area

Field measurements were conducted in the Heilongjiang Mohe Forest Ecosystem Research Station in the Daxing’an Mountains in northeast China 122°07′–122°27′ E, 53°22′–53°30′ N (Figure 1), which is a permafrost region. The study site is characterized by a typical cold temperate continental monsoon climate [25]. The average annual air temperature is −4.9 °C and the annual average precipitation is 350–500 mm, with 60%–70% falling from June to August. Snow pack lasts more than half the year (from October to April). The frost-free period is 80–90 days throughout the year. The soil in the study area is predominantly brown coniferous forest soil, interspersed with meadow soil and marsh soil in Chinese soil classification [28]. The soil pH is 4.4–5.4. The soil organic carbon and total nitrogen average content are 21.50–62.38 g·kg−1 and 3.00–5.01 g·kg−1, respectively [29].
Larch (Larix gmelinii) forest is the top community of the forest ecosystem in the Daxing’an Mountains area. The flower bud opening period of Larix gmelinii occurs in early May, and the leaf spreading period begins in mid-May. The complete discoloration of leaves occurs after mid- September, and leaves fall in October [30]. The understory vegetation is mainly dominated by Rhododendron dauricum L.Authority, Ledum palustre L.Authority and Vaccinium vitis-idaea L.Authority [31]. Furthermore, there are several different types of larch forest ecosystems due to the special forest structure and the effect of environmental factors [27]. These forests are characterized by the same tree layer of larch but different understory species, such as the Sphagnum-Bryum-Ledum palustre-Larix gmelinii forest (SLL), Rhododendron dauricum-Larix gmelinii forest (RL) and Ledum palustre-Larix gmelinii forest (LL).

2.2. Plot Design

In July 2018, three typical larch forest ecosystems—RL, LL and SLL—were selected based on the preliminary survey. Five 20 m × 20 m plots were located randomly within each forest type (Figure 1). For each plot, the diameters at breast height (DBH) for all trees were measured, and only those with a DBH ≥ 5 cm were recorded in terms of their DBH and tree height. Three 5 m × 5 m subplots of shrubs, three 1 m × 1 m subplots of herbs and three 0.5 m × 0.5 m subplots of litter were established randomly within each sampling plot. The forest type, stand age, stand density, elevation, slope and understory species composition of all 15 plots in the three typical larch forest ecosystems were recorded (Table 1). Meanwhile, the species, height and coverage of each shrub and herb were measured and recorded in each subplot (Table 2).

2.3. Vegetation and Litter Biomass

On the basis of the DBH measurements of the sampling plots, the tree biomass was quantified by species-specific allometric biomass equations [32] (Table 3). The stems, branches, foliage and roots were collected from three standard woods in each plot. The stems were sampled from the base, DBH and tip of the trunk. The branches were sampled in proportion from the rough branches and the twigs. The leaves were sampled from the upper, middle and lower layers of the canopy in equal proportions. The roots were sampled in proportion from the rough roots and the small roots [33]. All collected samples were brought back to the laboratory and dried at 65 °C to achieve a constant weight [34].
The understory vegetation (shrub and herb) biomass in each subplot was estimated using full excavation methods [34], and a total of 45 subplot samples was collected for the assessment of understory vegetation carbon and nitrogen stocks. Shrubs were harvested and separated into leaves, branches and roots; herbs were harvested and separated into their aboveground and belowground components. The understory vegetation samples were transported to the laboratory and dried at 65 °C to a constant weight for biomass.
The litter was harvested and separated into an under-decomposed layer and semi-decomposed layer [13]. All the litter and twigs (< 2 cm diameter) in each quadrat were collected and brought to the laboratory to be oven-dried at 65 °C to a constant weight.

2.4. Soil Sampling

In each sample plot, three soil profiles were selected randomly, and the surface litter of each point was cleared. Soil profiles were dug to a depth of 100 cm and samples were collected from a succession of ten depth levels: 0–10 cm, 10–20 cm, 20–30 cm, 20–30 cm, 30–40 cm, 40–50 cm, 50–60 cm, 60–70 cm, 70–80 cm, 80–90 cm and 90–100 cm. Soil samples from the same depth layer in the same plot were mixed in equal proportions, and the mixtures were air-dried at room temperature (25 °C). The mixtures were then smashed and passed through a 2 mm mesh sieve to remove coarse roots and other debris from the samples. The soil bulk density (g·cm−3) of each layer was measured using a soil bulk sampler with a 5.0 cm diameter and 5.0 cm high stainless-steel cutting ring.

2.5. Carbon and Nitrogen Content Analysis and Stock Calculation

The dried biological and soil samples of each component were ground and screened with a 2.5 mm metal sieve. The nitrogen contents in the vegetation, litter and soil samples were determined on aliquots of 1.0 g of samples using the semi-micro-Kjeldahl method [35]. The carbon contents in the vegetation, litter and soil samples were measured by the dichromate oxidation method [36].
We determined the carbon and nitrogen stocks (i.e., carbon and nitrogen in biomass per unit of land) in the vegetation and litter biomass by multiplying carbon and nitrogen contents with biomass amount (dry weight per unit of land) [8]. The soil carbon and nitrogen stocks were calculated as follows [34]:
C ( N ) Ssoil = i = 1 n SOC ( TN ) i × BDi × Di × 10 × ( 1 η i )
where CSsoil and NSsoil denote the carbon and nitrogen stocks of the soil (Mg·ha−1), respectively; i represents the 0–10 cm, 10–20 cm, 20–30 cm, 20–0 cm, 30–40 cm, 40–50 cm, 50–60 cm, 60–70 cm, 70–80 cm, 80–90 cm and 90–100 cm soil layers; BDi is the soil bulk density of layer i (g·cm−3); SOCi and TNi represent the soil carbon and nitrogen contents of layer i (g·kg−1), respectively; Di is the soil thickness of layer i (cm); and ηi is the volumetric percentage of the coarse soil fraction (i.e., >2 mm) of layer i.

2.6. Environmental Factors

The environmental factors, including the leaf area index (LAI), air temperature, relative humidity above the surface of 1.5 m, vapor pressure deficit (VPD), soil temperature at 10 cm below the surface and soil water content (SWC) in the three types of larch forest ecosystems were measured in July 2018. For environmental factors, LAI, soil temperature and SWC were measured using LAI-2200, a 6300-needle soil thermometer and Time Domain Reflectometer (TDR) soil moisture measuring instruments, respectively. Air temperature and relative humidity were measured using TES-1360A handheld digital thermo-hygrometers. Values for the saturated VPD were calculated based on the measured air temperature and relative humidity using the equation of Bolton [37]. These environmental values were measured hourly from 8:00 am to 6:00 pm; then, the average of each type was taken as the environmental index for this type of larch forest.

2.7. Statistical Analysis

One-way analysis of variance (ANOVA) with was followed up with a Least Significant Difference (LSD) test was used to analyze the differences in carbon and nitrogen stocks among the different components of the forest ecosystems. Duncan’s post hoc test was used to perform the multiple comparisons. The correlations between the ecosystem carbon and nitrogen stocks and the environmental factors obtained from the measurement in our study were determined by Pearson’s test. Statistical significance was set at P < 0.05 or 0.01. All analyses were performed using Microsoft Excel 2010 and SPSS 19.0 for Windows.

3. Results

3.1. Carbon and Nitrogen Stocks of the Larch Forest

3.1.1. Vegetation Layer

The tree biomass carbon and nitrogen stocks in the RL were higher than those in the SLL and LL, but the differences were not significant (P > 0.05) (Table 4). Among the tree components, stems showed the highest carbon and nitrogen stocks in the RL, which were 63.12% and 37.49%, respectively, compared with the carbon and nitrogen stocks in the LL and SLL, which were 62.23% and 38.64%, and 62.51% and 37.41%, respectively (Table 5). The carbon and nitrogen stocks in shrub were the highest in the RL, then in the LL, followed by the SLL (P < 0.05). In the shrub layer of the three types of larch forest ecosystems, most of the carbon and nitrogen was stored in the roots (> 50%). Carbon and nitrogen stocks in herbs showed significant differences among the three types of larch forest ecosystems, with SLL > LL > RL (P < 0.05). Meanwhile, the carbon and nitrogen stocks in the aboveground components in the herbs were significantly higher than those in the belowground component in all the three types of larch forest ecosystems (P < 0.05).

3.1.2. Litter Layer

As shown in Table 6, the litter carbon stock in the SLL was significantly greater than that in the LL and RL (P < 0.05), but there was no significant difference between the LL and RL (P > 0.05). The litter nitrogen stock in the SLL was also greater than that in the LL and RL, but there were no significant differences among the three types of larch forest ecosystems (P > 0.05). For litters, the carbon and nitrogen stocks in the semi-decomposed layer were significantly higher than those in under-decomposed layer in all three types of larch forest ecosystems (P < 0.05) (Table 7).

3.1.3. Soil Layer

Significant differences in the soil carbon and nitrogen stocks among three types of larch forest ecosystems were found, showing the pattern SLL > LL > RL (P < 0.05) (Table 8). In the three types of larch forest ecosystems, the soil carbon and nitrogen stocks showed decreased trends along with the increase of soil depth. The soil carbon and nitrogen stocks were mainly concentrated in upper soil of 0–50 cm depth, occupying 79.27%–80.10% and 51.56%–61.40% of total carbon and nitrogen stocks of 1 m depth soil (Table 9).

3.1.4. Ecosystem

Ecosystem carbon and nitrogen stocks were highest in the SLL, then in the LL, and lowest in the RL (P < 0.05) (Table 10). Soil was the largest carbon and nitrogen contributor to the ecosystem, contributing 83.20%, 72.89% and 64.61% of carbon stock and 98.61%, 97.58% and 96.00% of nitrogen stock in the SLL, LL and RL, respectively (Table 11). The carbon and nitrogen stocks of vegetation biomass in the three types of larch forest ecosystems accounted for 33.74% and 3.20% in the RL, 25.67% and 1.82% in the LL, and 15.64% and 1.03% in the SLL, respectively. The litter contributed a very small portion of carbon and nitrogen in all the three types of larch forest ecosystems (carbon < 2%; nitrogen < 1%).

3.2. Effects of the Environmental Factors on the Ecosystem Carbon and Nitrogen Stocks of the Larch Forest

The environmental factors were significantly different in the three types of larch forest ecosystems (P < 0.05) (Table 12). LAIs in the RL and LL were significantly higher than that in the SLL. Air temperature, VPD and soil temperature were the highest in the RL, then in the LL, followed by the SLL (P < 0.05). In contrast, the SWC and the relative humidity of the SLL were higher than those in the LL and RL (P < 0.05).
The correlation analysis showed that the ecosystem carbon and nitrogen stocks were positively correlated with relative humidity and SWC (Table 13, P < 0.01) in the larch forest ecosystem, whereas LAI, air temperature, VPD and soil temperature were negatively correlated with the carbon and nitrogen stocks (Table 13, P < 0.01). In general, the environmental factors had great influences on the ecosystem carbon and nitrogen stocks in the larch forest.

4. Discussion

4.1. Ecosystem Carbon and Nitrogen Stocks in Different Types of Larch Forest

4.1.1. Vegetation Layer

The carbon and nitrogen stocks in vegetation biomass are important contributors to those in the forest ecosystem [34]. In the vegetation layer, the tree biomass was the main contributor to carbon and nitrogen stocks in three types of larch forest ecosystems, with more than 72% of carbon and 90% of nitrogen being stored in tree biomass. This result is similar to the findings by Yang et al. [34], who found that the tree biomass carbon stock accounted for more than 98.77% of the vegetation biomass carbon stock. However, there were no significant differences in the tree biomass carbon and nitrogen stocks among the three types of larch forest ecosystems, which may be explained by the similar tree species, species stand density, age (Table 1), carbon and nitrogen contents and tree biomass (Table A1) (P > 0.05). In the tree layer, more than 60% of carbon was stored in the stems, which is mainly the result of the higher biomass in steam (Table A1). Our results showed more than 64% of the biomass was in the form of steam, which was consistent with previous studies [13,24]. However, due to the lowest nitrogen content being in steam, the nitrogen stock in steam only contributed 37.41%–38.64% in the tree layer (Table 5).
The understory vegetation (shrub and herb layers) is also an important part of the forest ecosystem and plays an important role in nutrient turnover and cycling [38,39,40]. While the contribution of understory vegetation to ecosystem carbon and nitrogen stocks was very small (< 2%), as shown in Table 10, there were significant differences in understory vegetation carbon and nitrogen stocks among the three types of larch forest ecosystems. Different understory vegetation with different carbon and nitrogen stocks can alter the soil microbes [41], soil properties and structure [42] and soil temperature and water content [43], which may ultimately have a great influence on soil carbon and nitrogen [23]. This result is in agreement with previous studies [23,34]. For example, Ciarkowska et al. [44] found the predominance of Alpine lady fern or bilberry species in the understory of the Carpathian montane spruce forest led to distinct differences in soil chemical characteristics. Similarly, Špulák et al. [45] reported that the variants of dominant ground vegetation under the beech stand markedly affected the litter and soil chemistry. This influence of understory vegetation on litter and soil was also observed in our study, even though the mechanism and processes by which different understory vegetation affects ecosystem carbon and nitrogen stocks still need further investigation.

4.1.2. Litter Layer

Litter, as an important link between vegetation and soil for material and energy exchange, contributes more to the carbon and nitrogen turnover than carbon and nitrogen accumulation [46]. The carbon stock in litter was higher in the SLL than that in the LL and RL (P < 0.05), which mainly resulted from the higher amount of litter biomass in the SLL (Table A2). Additionally, the amount of accumulated litter influences the soil carbon contents. These findings are consistent with those of Miao et al. [47], who found that litter addition increased the soil total carbon, soil microbial biomass carbon and underground processes. However, no significant difference in litter nitrogen stocks was found in the three types of larch forest ecosystems (P > 0.05). This result may be due to another finding, namely that the litter nitrogen content in the SLL was lower than that in the LL and RL. In the three types of larch forest ecosystems, the semi-decomposed layer held more carbon and nitrogen compared with under-decomposed layer, resulting from the more abundant biomass in the semi-decomposed layer than that in the under-decomposed layer (Table A2). Previous researchers also found that more microbial activity in the semi-decomposed layer results in more carbon and nitrogen stocks in the semi-decomposed layer [13].

4.1.3. Soil Layer

The soil was the main carbon and nitrogen pool for the three types of larch forest ecosystems. In our study, soil carbon and nitrogen stocks were significantly different between the three types of larch forest ecosystems, showing the pattern SLL > LL > RL (P < 0.05). The changes of plant species, soil properties and the environmental factors in different types of forest ecosystems may have a significant effect on soil. Litter and fine roots were recognized as the main factors for the accumulation of soil carbon and nitrogen in previous studies [48,49], because the changes in the quality and quantity of litter and roots can affect soil organic matter decomposition mechanisms, control soil organic matter decomposition, and finally influence the stock of soil carbon and nitrogen [39,40,50]. Different forest types may also result in different inputs of organic matter from litter and roots. In our study, the rate of litter decomposition from mosses in the SLL showed a slower tendency than that of other shrubs in boreal forest, leading to more soil carbon and nitrogen accumulation in the SLL. Meanwhile, the humid and low-temperature environmental conditions in the SLL can affect the activity of soil microorganism, which in turn affects the decomposition of soil organic matter [8,39,40,51]. This could explain the higher soil carbon and nitrogen stocks in the SLL.
Similar to the findings of previous studies [52,53], the soil carbon and nitrogen stocks showed similar vertical distribution characteristics in the three types of larch forest ecosystems, demonstrating decreased trends with the increase of soil depth, which may be explained by the effects of litter and vegetation on soil carbon and nitrogen, declining with increasing soil depth [54,55]. As most litter and fine roots are distributed on the surface soil, the soil carbon and nitrogen stocks accumulate at the surface soil. In our study, more than 79% of carbon and 51% of nitrogen were stocked in the 0–50 cm soil layer, while only less than 21% and 49% carbon and nitrogen were stored in the 50–100 cm soil layer. These findings are consistent with other studies [8,56] which found that the topsoil held more carbon and nitrogen than the subsoil.

4.1.4. Ecosystem

The ecosystem carbon and nitrogen stocks are mainly determined by the vegetation and the soil carbon pool [17,18]. However, because of the complex processes of vegetation and soil interactions in forest ecosystem [19], previous studies showed significant differences of carbon and nitrogen stocks among different forest types [9,20]. Our results also showed significant differences in ecosystem carbon and nitrogen stocks among the three types of larch forest ecosystems, with the highest carbon and nitrogen stocks in the SLL (288.01 ± 16.25 Mg·ha−1 and 25.19 ± 2.70 Mg·ha−1), which were significantly higher than those in the LL (176.52 ± 15.88 Mg·ha−1 and 14.85 ± 1.40 Mg·ha−1) and RL (153.93 ± 10.11 Mg·ha−1 and 10.00 ± 0.92 Mg·ha−1) (P < 0.05). In our study, soil was the largest contributor to ecosystem carbon and nitrogen stocks in the three types of larch forest ecosystems, with 83.20%, 72.89% and 64.61% of carbon stock and 98.61%, 97.58% and 96.00% of nitrogen stock in the SLL, LL and RL, respectively. Furthermore, soil was the major reason for the differences in the ecosystem carbon and nitrogen stocks among the three types of larch forest ecosystems. This result agrees with the findings of Finér et al. and He et al. [8,57] that soil was the major carbon and nitrogen pool in the forest ecosystem. Meanwhile, a study on boreal forest carbon stocks also showed that most boreal carbon resides in its soil [14]. The carbon and nitrogen stocks in vegetation biomass are important contributions to the carbon and nitrogen stocks in the forest ecosystem [34]. Our study showed that the carbon and nitrogen stocks in vegetation biomass were the second-largest components in the three types of larch forest ecosystems. The vegetation biomass carbon stocks in the three types of larch forests ranged from 45.06 to 51.94 Mg·ha−1, which was a similar finding to Hu et al. [33], who found that the biomass carbon stock in middle age larch forest was 50.96 Mg·ha−1. In addition, our study showed that litter contributed less than 2% of the carbon and nitrogen stocks to the ecosystem in the three types of larch forest ecosystems, resulting from the lower biomass in litter. This result is consistent with previous studies [34,58], which found that the litter contributed little (about 6%) to ecosystem carbon stocks.

4.2. Effect of Environmental Factors on Larch Forest Carbon and Nitrogen Stocks

Many factors can affect the forest ecosystem carbon and nitrogen stocks by affecting the carbon and nitrogen processes between plants and soil in the forest ecosystem [59]. The temperature and water have significant effects on vegetation growth and the subsequent litter inputs into soil [60,61]. In our study, the temperatures, including the air temperature and soil temperature, had significant negative correlations with ecosystem carbon and nitrogen stocks (P < 0.01). This agrees with the study findings by Koven [51] that an increase in temperature benefited the decomposition of soil organic matter. This explains why more soil organic matter accumulated in lower-temperature SLL, resulting in higher soil carbon and nitrogen contents and stocks in the SLL (Table A3, Table 12). Carbon and nitrogen stocks in soil can largely determine the level of their stocks in the forest ecosystem; thus, the ecosystem carbon and nitrogen stocks in the SLL were the highest. The relative humidity and SWC showed positive correlations with the forest ecosystem carbon and nitrogen stocks, which confirmed the lower decomposition rate of organic matter in humid conditions [62,63]. Additionally, the lower VPD in SLL in our study means a higher relative humidity, which also benefits the accumulation of soil carbon and nitrogen. Thus, there was a negatively correlation between VPD and the carbon and nitrogen stocks in the larch forest ecosystem. LAI also showed a negative correlation with the carbon and nitrogen stocks in the larch forest ecosystem, because it can affect the forest ecosystem carbon and nitrogen stocks by influencing the temperature and humidity in the air and the soil [64,65].

4.3. Implications

Some previous studies have shown significant differences in carbon and nitrogen stocks among different forest ecosystems, and the differences were mostly attributed to the differences in compositions of tree species [8,20,66]. However, our study showed there was also significant effect of the forest type, such as larch forests, with the same tree layer and different understory vegetation. The highest carbon and nitrogen stocks found in the SLL were 1.63 and 1.70 times more than those in the LL and 1.87 and 2.52 times as much as those in the RL, respectively. This result indicates the importance of understory vegetation as a characteristic classification symbol of forest in the estimation of forest ecosystem carbon and nitrogen—particularly, for the estimation of carbon and nitrogen stocks in the area of Daxing’an Mountains. Furthermore, as there are also other forest types, such as Pinus sylvestris var. mongolica Litv. forest, Betula platyphylla Suk. forest and Populus davidiana Dode forest, characterized and named by dominant species and the main understory species [27], by considering the differences of carbon and nitrogen stocks among the different forest types, our study provides a novel approach to accurately estimating forest carbon and nitrogen stocks.

5. Conclusions

In this study, we highlighted the effects of forest types on carbon and nitrogen stocks in larch forests. There were significant differences in carbon and nitrogen stocks among the three types of larch forest ecosystems. Compared with the vegetation and litter, soil contributed more to carbon and nitrogen stocks in the forest ecosystem and was the main reason for the variations in the carbon and nitrogen stocks among the different types of larch forest ecosystems. Our study indicates that forest types with the same tree layer but different understory vegetation can greatly affect the carbon and nitrogen stocks of forest ecosystems. This highlights that there is a necessity of considering the carbon and nitrogen stock capacity of forests with different understory vegetation, which may have significant effects on the carbon and nitrogen stocks.

Author Contributions

Conceptualization, R.X. and X.M.; experiment conception and design, R.X. and X.M.; investigation, R.X. and B.D.; data analysis, R.X.; funding acquisition, X.M.; writing, R.X. All authors contributed to the revision and approved the manuscript.

Funding

This work was financially supported by the National Science Foundation of China (Grant No. 31770488).

Acknowledgments

We acknowledge the financial support from the National Natural Science Foundation of China (Grant No. 31770488). We are particularly grateful to the following lab members for their help and assistance with field work: Tijiu Cai, Xiaoming Wang, Liangliang Duan. We would also like to thank the Mohe Forest Ecological Research Station for supporting our field work.

Conflicts of Interest

The authors declare no conflict of interest.

Appendix A

Table A1. Biomass, carbon and nitrogen contents in vegetation layers.
LayerComponentRLLLSLL
Biomass
(Mg·ha−1)
Carbon
Content (g·kg−1)
Nitrogen
Content (g·kg−1)
Biomass
(Mg·ha−1)
Carbon
Content (g·kg−1)
Nitrogen Content (g·kg−1)Biomass
(Mg·ha−1)
Carbon
Content (g·kg−1)
Nitrogen Content (g·kg−1)
TreesFoliage2.69 ± 0.44 Da562.80 ± 11.40 Aa14.11 ±1.64 Aa2.49 ± 0.61 Da554.71 ± 15.85 Aa14.40 ± 1.82 Aa2.45 ± 0.39 a558.49 ± 15.07 Aa13.54 ± 2.13 Aa
Branches7.49 ± 1.45 Ca486.03 ± 12.47 BCa7.32 ± 0.87 Ba6.80 ± 1.96 Ca491.09 ± 14.81 Ca7.05 ± 0.94 Ba6.84 ± 1.32 Ca489.16 ± 11.32 Ba7.16 ± 1.00 Ba
Stems62.79 ± 14.83 Aa470.60 ± 9.64 Ca1.39 ± 0.19 Ca55.94 ± 19.41 Aa466.47 ± 12.09 Ba1.46 ± 0.21 Ca57.73 ± 13.71 Aa464.08 ± 11.08 Ca1.38 ± 0.22 Ca
Roofs24.50 ± 5.85 Ba496.39 ± 18.16 Ba2.10 ± 0.30 Ca21.81 ± 7.63 Ba511.35 ± 19.77 Ba2.11 ± 0.31 Ca22.53 ± 5.40 Ba508.43 ± 20.11 Ba2.25 ± 0.28 Ca
Subtotal97.47 ± 22.55 a 87.03 ± 29.61 a 89.55 ± 20.82 a
ShrubsFoliage0.94 ± 0.14 Ca445.05 ± 28.54 Ab15.05 ± 1.13 Aa0.77 ± 0.12 Cb595.54 ± 43.81 Aa14.65 ± 1.12 Aa0.44 ± 0.09 Cc549.21 ± 27.79 Aa12.01 ± 0.69 Ab
Stems3.75 ± 0.66 Ba418.79 ± 23.40 ABa6.12 ± 0.32 Bb1.82 ± 0.43 Bb537.09 ± 29.24 Ba7.52 ± 0.83 Ca1.12 ± 0.27 Bc504.82 ± 40.00 Ba7.34 ± 0.41 Ca
Roofs7.07 ± 1.37 Aa400.62 ± 24.11 Ba6.27 ± 0.67 Bc3.35 ± 0.60 Ab514.68 ± 49.93 Ca9.95 ± 0.96 Ba1.71 ± 0.31 Ac474.57 ± 25.41 Ca8.43 ± 0.67 Bb
Subtotal12.30 ± 2.11 a 5.63 ± 1.11 b 3.07 ± 0.61 c
HerbsAboveground0.33 ± 0.08 Ac416.61 ± 16.30 Ab11.67 ± 0.92 Aa0.51 ± 0.13 Ab434.80 ± 24.82 Aab10.33 ± 1.07 Ab1.02 ± 0.13 Aa452.87 ± 27.54 Aa11.43 ± 0.46 Aab
Belowground0.18 ± 0.04 Bb411.96 ± 33.58 Aa10.24 ± 0.94 Ba0.25 ± 0.06 Ba428.05 ± 23.51 Aa9.66 ± 0.46 a0.11 ± 0.01 Bc428.52 ± 28.05 Aa9.88 ± 0.67 Ba
Subtotal0.53 ± 0.11 c 0.70 ± 0.18 b 1.12 ± 0.17 a
Total 110.3 ± 24.77 a 93.36 ± 31.52 a 93.74 ± 20.66 a
The data are presented as mean ± standard deviation. Different capital letters represent significant differences among different components in each layer, and different lowercase letters represent significant differences among forest types (P < 0.05).
Table A2. Biomass, carbon and nitrogen contents in litter layers.
ComponentRLLLSLL
Biomass
(Mg·ha−1)
Carbon Content (g·kg−1)Nitrogen Content (g·kg−1)Biomass
(Mg·ha−1)
Carbon Content (g·kg−1)Nitrogen Content (g·kg−1)Biomass
(Mg·ha−1)
Carbon Content (g·kg−1)Nitrogen Content (g·kg−1)
Under-decomposed1.94 ± 0.44 Bb509.38 ± 29.22 Aa14.70 ± 1.64 Aa2.17 ± 0.31 Bb468.74 ± 45.32 Aa13.44 ± 1.31 Bab2.90 ± 0.69 Ba486.91 ± 43.39 Aa12.49 ± 1.53 Ab
Semi-decomposed3.27 ± 0.56 Ab469.67 ± 21.93 Ba15.12 ± 0.69 Ab3.27 ± 0.55 Ab463.43 ± 25.96 Aa17.41 ± 0.88 Aa4.16 ± 0.46 Aa464.84 ± 24.57 Aa14.19 ± 0.69 Ab
Total5.38 ± 1.00 b 5.27 ± 0.85 b 6.97 ± 1.08 a
The data are presented as mean ± standard deviation. Different capital letters represent significant differences among different components, and different lowercase letters represent significant differences among forest types (P < 0.05).
Table A3. Bulk density, carbon and nitrogen contents in soil layers.
LayerRLLLSLL
Bulk Density (g·cm−3)Carbon Content (g·kg−1)Nitrogen Content (g·kg−1)Bulk Density (g·cm−3)Carbon Content (g·kg−1)Nitrogen Content (g·kg−1)Bulk Density (g·cm−3)Carbon Content (g·kg−1)Nitrogen Content (g·kg−1)
0–10 cm0.72 ± 0.03 Cc66.74 ± 2.37 Ac3.86 ± 0.53 Ac0.86 ± 0.07 Db85.86 ± 9.74 Ab4.89 ± 0.92 Ab1.34 ±0.11 Ca97.71 ± 14.62 Aa6.76 ± 0.85 Aa
10–20 cm1.58 ± 0.10 Bb14.65 ± 1.54 Bc1.41 ± 0.28 Bb1.45 ± 0.10 Cc20.06 ± 4.49 Bb1.81 ± 0.47 Bb1.72 ± 0.07 BCa27.75 ± 3.61 Ba3.62 ± 0.61 Ba
20–30 cm1.62 ± 0.12 Bb8.31 ± 1.36 BCc0.96 ± 0.19 Cc1.83 ± 0.14 ABa12.23 ± 2.95 Cb1.51 ± 0.34 Bb1.78 ± 0.12 ABab16.72 ± 1.71 Ca2.22 ± 0.32 Ca
30–40 cm1.66 ± 0.12 Bb7.37 ± 0.48 Ca0.78 ± 0.13 CDa1.85 ± 0.12 ABa7.01 ± 0.37 CDa0.81 ± 0.12 Ca1.71 ± 0.12 BCab8.24 ± 1.50 CDa0.92 ± 0.22 Da
40–50 cm1.82 ± 0.09 Aa4.84 ± 0.53 Cb0.65 ± 0.17 CDb1.87 ± 0.11 Ab4.74 ± 0.41 Db0.78 ± 0.19 Cab1.63 ± 0.10 BCb9.68 ± 0.36 CDa0.99 ± 0.16 Da
50–60 cm1.89 ± 0.16 Aa2.89 ± 0.38 Cb0.60 ± 0.10 CDb1.79 ± 0.10 ABab3.07 ± 0.38 Db0.59 ± 0.22 Cb1.68 ± 0.16 BCb8.27 ± 0.52 CDa1.06 ± 0.12 Da
60–70 cm1.88 ± 0.09 Aa3.11 ± 0.25 Cb0.50 ± 0.07 CDb1.74 ± 0.08 ABb3.43 ± 0.43 Db0.74 ± 0.20 Ca1.84 ± 0.10 ABab7.95 ± 0.69 CDa0.90 ± 0.11 Da
70–80 cm1.83 ± 0.12 Aa2.39 ± 0.42 Cc0.46 ± 0.10 CDb1.74 ± 0.10 ABa3.35 ± 0.39 Db0.93 ± 0.13 Ca1.78 ± 0.12 BCa7.99 ± 0.84 CDa0.90 ± 0.18 Da
80–90 cm1.65 ± 0.09 Ba2.90 ± 0.31 Cc0.51 ± 0.07 Db1.70 ± 0.09 Ba3.99 ± 0.41 Db0.82 ± 0.19 Ca1.68 ± 0.08 ABa6.98 ± 0.16 Da0.94 ± 0.14 Da
90–100 cm1.61 ± 0.16 Ba2.52 ± 0.40 Cc0.63 ± 0.13 Ea1.72 ± 0.05 Ba3.82 ± 0.12 Db0.72 ± 0.13 Ca1.76 ± 0.11 Aa5.91 ± 0.16 Da0.74 ± 0.07 Da
Mean1.55 ± 0.04 b16.59 ± 2.07 c1.29 ± 0.08 c1.58 ± 0.06 ab21.22 ± 1.44 b1.68 ± 0.15 b1.66 ± 0.10 a26.81 ± 2.65 a2.35 ± 0.12 a
The data are presented as mean ± standard deviation. Different capital letters represent significant differences among different layers in soil, and different lowercase letters represent significant differences among forest types (P < 0.05).

References

  1. Tang, X.L.; Zhao, X.; Bai, Y.F.; Tang, Z.Y.; Wang, W.T.; Zhao, Y.C.; Wan, H.W.; Xie, Z.Q.; Shi, X.Z.; Wu, B.F.; et al. Carbon pools in China’s terrestrial ecosystems: New estimates based on an intensive field survey. Proc. Natl. Acad. Sci. USA 2018, 115, 4021–4026. [Google Scholar] [CrossRef] [PubMed] [Green Version]
  2. Johnson, D.W.; Turner, J. Nitrogen budgets of forest ecosystems: A review. For. Ecol. Manag. 2014, 318, 370–379. [Google Scholar] [CrossRef]
  3. Ķēniņa, L.; Jaunslaviete, I.; Liepa, L.; Zute, D.; Jansons, Ā. Carbon pools in old-growth Scots Pine stands in Hemiboreal Latvia. Forests 2019, 10, 911. [Google Scholar] [CrossRef] [Green Version]
  4. Sponseller, R.A.; Gundale, M.J.; Futter, M.; Ring, E.; Nordin, A.; Nasholm, T.; Laudon, H. Nitrogen dynamics in managed boreal forests: Recent advances and future research directions. Ambio 2016, 45 Suppl 2, 175–187. [Google Scholar] [CrossRef] [Green Version]
  5. Ali, A.; Ahmad, A.; Akhtar, K.; Teng, M.J.; Zeng, W.S.; Yan, Z.G.; Zhou, Z.X. Patterns of biomass, carbon, and soil properties in masson pine (Pinus massoniana Lamb) plantations with different stand ages and management practices. Forests 2019, 10, 645. [Google Scholar] [CrossRef] [Green Version]
  6. Mitchard, E.T.A.; Feldpausch, T.R.; Brienen, R.J.W.; Lopez-Gonzalez, G.; Monteagudo, A.; Baker, T.R.; Lewis, S.L. Markedly divergent estimates of amazon forest carbon density from ground plots and satellites. Glob. Ecol. Biogeogr. 2014, 23, 935–946. [Google Scholar] [CrossRef]
  7. Pan, Y.D.; Birdsey, R.A.; Fang, J.Y.; Houghton, R.; Kauppi, P.E.; Kurz, W.A.; Jackson, R.B.; Pacala, S.W.; McGuire, A.D.; Piao, S.; et al. A large and persistent carbon sink in the world’s forests. Science 2011, 33, 988–993. [Google Scholar] [CrossRef] [Green Version]
  8. He, Y.K.; Qin, L.; Li, Z.Y.; Liang, X.Y.; Shao, M.X.; Tan, L. Carbon storage capacity of monoculture and mixed-species plantations in subtropical China. For. Ecol. Manag. 2013, 295, 193–198. [Google Scholar] [CrossRef]
  9. Baddeley, J.A.; Edwards, A.C.; Watson, C.A. Changes in soil C and N stocks and C:N stoichiometry 21 years after land use change on an arable mineral topsoil. Geoderma 2017, 303, 19–26. [Google Scholar] [CrossRef]
  10. Lutter, R.; Kõlli, R.; Tullus, A.; Tullus, H. Ecosystem carbon stocks of estonian premature and mature managed forests: Effects of site conditions and overstorey tree species. Eur. J. For. Res. 2018, 138, 125–142. [Google Scholar] [CrossRef]
  11. Chen, D.M.; Zhang, C.L.; Wu, J.P.; Zhou, L.X.; Lin, Y.B.; Fu, S.L. Subtropical plantations are large carbon sinks: Evidence from two monoculture plantations in south China. Agric. For. Meteorol. 2011, 151, 1214–1225. [Google Scholar] [CrossRef]
  12. Wei, X.R.; Wang, X.; Ma, T.N.; Huang, L.Q.; Pu, Q.; Hao, M.D.; Zhang, X.C. Distribution and mineralization of organic carbon and nitrogen in forest soils of the southern Tibetan Plateau. Catena 2017, 156, 298–304. [Google Scholar] [CrossRef]
  13. Liu, S.; Luo, D.; Liu, Q.L.; Zhang, L.; Yang, H.G.; Shi, Z.M. Carbon and nitrogen storage and distribution in different forest ecosystems in the subalpine of western Sichuan. Acta Ecol. Sin. 2017, 37, 1074–1083. [Google Scholar]
  14. Bradshaw, C.J.A.; Warkentin, I.G. Global estimates of boreal forest carbon stocks and flux. Glob. Planet. Chang. 2015, 128, 24–30. [Google Scholar] [CrossRef]
  15. Högberg, P.; Näsholm, T.; Franklin, O.; Högberg, M.N. Tamm review: On the nature of the nitrogen limitation to plant growth in fennoscandian boreal forests. For. Ecol. Manag. 2017, 403, 161–185. [Google Scholar] [CrossRef] [Green Version]
  16. Wang, C.K.; Gower, S.T.; Wang, Y.H.; Zhao, H.X.; Yan, P.; Bond-Lamberty, B.P. The influence of fire on carbon distribution and net primary production of boreal Larix gmelinii forests in north-eastern China. Glob. Chang. Biol. 2001, 7, 719–730. [Google Scholar] [CrossRef]
  17. Govwe, S.T.; Krankina, O.; Olson, R.J.; Apps, M.; Linder, S.; Wang, C. Net primary production and carbon allocation patterns of boreal forest ecosysterm. Ecol. Appl. 2001, 11, 1395–1411. [Google Scholar]
  18. Ciais, P.; Canadell, J.G.; Luyssaert, S.; Chevallier, F.; Shvidenko, A.; Poussi, Z.; Jonas, M.; Peylin, P.; King, A.W.; Schulze, E.-D.; et al. Can we reconcile atmospheric estimates of the Northern terrestrial carbon sink with land-based accounting? Curr. Opin. Environ. Sustain. 2010, 2, 225–230. [Google Scholar] [CrossRef]
  19. Cremer, M.; Kern, N.V.; Prietzel, J. Soil organic carbon and nitrogen stocks under pure and mixed stands of European beech, Douglas fir and Norway spruce. For. Ecol. Manag. 2016, 367, 30–40. [Google Scholar] [CrossRef]
  20. Hansson, K.; Fröberg, M.; Helmisaari, H.S.; Kleja, D.B.; Olsson, B.A.; Olsson, M.; Persson, T. Carbon and nitrogen pools and fluxes above and below ground in spruce, pine and birch stands in southern Sweden. For. Ecol. Manag. 2013, 309, 28–35. [Google Scholar] [CrossRef]
  21. Vesterdal, L.; Schmidt, I.K.; Callesen, I.; Nilsson, L.O.; Gundersen, P. Carbon and nitrogen in forest floor and mineral soil under six common European tree species. For. Ecol. Manag. 2008, 255, 35–48. [Google Scholar] [CrossRef]
  22. Blaško, R.; Forsmark, B.; Gundale, M.; Lundmark, T.; Nordin, A. Impacts of tree species identity and species mixing on ecosystem carbon and nitrogen stocks in a boreal forest. For. Ecol. Manag. 2020, 458. [Google Scholar] [CrossRef]
  23. Pan, P.; Zhao, F.; Ning, J.K.; Zhang, L.; Ouyang, X.Z.; Zang, H. Impact of understory vegetation on soil carbon and nitrogen dynamic in aerially seeded Pinus massoniana plantations. PLoS ONE 2018, 13, e0191952. [Google Scholar] [CrossRef] [PubMed]
  24. Meng, S.W.; Jia, Q.Q.; Liu, Q.J.; Zhou, G.; Wang, H.M.; Yu, J. Aboveground biomass allocation and additive allometric models for natural Larix gmelinii in the western Daxing’anling Mountains, northeastern China. Forests 2019, 10, 150. [Google Scholar] [CrossRef] [Green Version]
  25. Gao, W.F.; Yao, Y.L.; Liang, H.; Song, L.Q.; Sheng, H.C.; Cai, T.J.; Gao, D.W. Emissions of nitrous oxide from continuous permafrost region in the Daxing’an Mountains, Northeast China. Atmos. Environ. 2019, 198, 34–45. [Google Scholar] [CrossRef]
  26. Kajimoto, T.; Matsuura, Y.; Sofronov, M.A.; Volokitina, Y.A.; Mori, S.; Osawa, A.; Abaimov, P.A. Above- and belowground biomass and net primary productivity of a Larix gmelinii stand near Tura, central Siberia. Tree Physiol. 1999, 19, 815–822. [Google Scholar] [CrossRef]
  27. Luo, J.C. Research of site classification in Xilinji forestry bureau. J. Beijing For. Univ. 1990, 12, 10–32. [Google Scholar]
  28. Gong, Z.T.; Zhao, Q.G.; Zeng, Z.S.; Lin, P.; Wang, R.C. Chinese soil classification. Soils. 1987, 5, 168–169. [Google Scholar]
  29. Yang, L.B.; Sui, X.; Wei, D.; Cui, F.X.; Zhu, D.Y.; Ni, H.W. Fungal diversity in the brown coniferous forest soils of Daxing’anling Mountains, Northeast China. Chin. J. Appl. Ecol. 2019, 30, 3411–3418. [Google Scholar]
  30. Yang, L.P.; Qin, Y.; Zhang, C.H.; Feng, X.Y.; Yang, L. Impact of climate change on phenology of Larix gmelinii in the Daxing’an Mountains, Northeast China. Arid Zone Res. 2016, 5, 577–583. [Google Scholar]
  31. Mu, C.C.; Lu, H.C.; Wang, B.; Bao, X.; Cui, W. Short-term effects of harvesting on carbon storage of boreal Larix gmelinii–Carex schmidtii forested wetlands in Daxing’anling, Northeast China. For. Ecol. Manag. 2013, 293, 140–148. [Google Scholar] [CrossRef]
  32. Peng, W.; Dong, L.H.; Li, F.R. Carbon storage of forest vegetation and allocation for main forest types in the east of Daxing’an Mountains based on additive biomass model. Acta Ecol. Sin. 2016, 27, 3749–3758. [Google Scholar]
  33. Hu, H.Q.; Luo, B.Z.; Wei, S.J.; Wei, S.W.; Wen, Z.M.; Sun, L.; Luo, S.S.; Wang, L.M.; Ma, H.B. Estimating biological carbon storage of five typical forest types in the Daxing’anling Mountains, Heilingjiang, China. Acta Ecol. Sin. 2015, 35, 5745–5760. [Google Scholar]
  34. Yang, B.; Zhang, W.H.; Lu, Y.L.; Zhang, W.W.; Wang, Y.A. Carbon storage dynamics of secondary forest succession in the central Loess Plateau of China. Forests 2019, 10, 342. [Google Scholar] [CrossRef] [Green Version]
  35. Yang, Y.H.; Luo, Y.Q. Carbon: nitrogen stoichiometry in forest ecosystems during stand development. Global Ecol. Biogeogr. 2011, 20, 354–361. [Google Scholar] [CrossRef]
  36. Nelson, D.W.; Sommers, L.E. Carbon and organic matter. In Methods of Soil Analysis-Part 2: Chemical and Microbiological Properties; Page, A.L., Mille, R.H., Eds.; American Society of Agronomy: Madison, WI, USA, 1982; pp. 561–579. [Google Scholar]
  37. David, B. The computation of equivalent potential temperature. Mon. Wea. Rev 1980, 108, 1046–1053. [Google Scholar]
  38. Wardle, D.A.; Hörnberg, G.; Zackrisson, O.; Kalela-Brundin, M.; Coomes, D.A. Long-term effects of wildfire on ecosystem properties across an Island area gradient. Sci. Total Environ. 2003, 300, 972–975. [Google Scholar] [CrossRef]
  39. Creamer, C.A.; Menezes, A.B.D.; Krull, E.S.; Sanderman, J.; Newton-Walters, R.; Farrell, M. Microbial community structure mediates response of soil C decomposition to litter addition and warming. Soil Biol. Biochem. 2015, 80, 175–188. [Google Scholar] [CrossRef] [Green Version]
  40. Manuel, D.B.; Pablo, G.P.; Milla, R.; Gallardo, A.; Maestre, F.T. Soil characteristics determine soil carbon and nitrogen availability during leaf litter decomposition regardless of litter quality. Soil Biol. Biochem. 2015, 81, 134–142. [Google Scholar]
  41. Sun, Y.F.; Zhang, Y.Q.; Feng, W.; Qin, S.G.; Liu, Z.; Bai, Y.X.; Yan, R.; Fa, K.Y. Effects of xeric shrubs on soil microbial communities in a desert in northern China. Plant Soil 2017, 414, 281–294. [Google Scholar] [CrossRef]
  42. Mihoč, M.A.K.; Giménez-Benavides, L.; Pescador, D.S.; Sánchez, A.M.; Cavieres, L.A.; Escudero, A. Soil under nurse plants is always better than outside: A survey on soil amelioration by a complete guild of nurse plants across a long environmental gradient. Plant Soil 2016, 408. [Google Scholar] [CrossRef]
  43. Gurlevik, N.; Kelting, D.L.; Allen, H.L. Nitrogen mineralization following vegetation control and fertilization in a 14-year-old loblolly pine plantation. Soil Sci. Soc. Am. J. 2004, 68, 272–281. [Google Scholar] [CrossRef]
  44. Ciarkowska, K.; Miechówka, A. The role of bilberry and alpine lady-fern in soil formation within the carpathian subalpine spruce forest stands. Geoderma 2017, 305, 162–172. [Google Scholar] [CrossRef]
  45. Špulák, O.; Souček, J.; Dušek, D. Quality of organic and upper mineral horizons of mature mountain beech stands with respect to herb layer species. J. For. Sci. 2016, 62. [Google Scholar] [CrossRef] [Green Version]
  46. Ping, P.; Fang, Z.; Ouyang, X.Z.; Zhang, Y.; Ning, J.K.; Guo, R. Characteristics of soil carbon and nitrogen and relationship with litter quality under different understory vegetation in Pinus massoniana plantations. Acta Ecol. Sin. 2018, 38, 3988–3997. [Google Scholar]
  47. Miao, R.H.; Ma, J.; Liu, Y.Z.; Liu, Y.C.; Yang, Z.L.; Guo, M.X. Variability of aboveground litter inputs alters soil carbon and nitrogen in a coniferous–broadleaf mixed forest of central China. Forests 2019, 10, 188. [Google Scholar] [CrossRef] [Green Version]
  48. Yang, L.Y.; Wu, S.T.; Zhang, L.B. Fine root biomass dynamics and carbon storage along a successional gradient in Changbai Mountains, China. Forestry 2010, 83, 379–387. [Google Scholar] [CrossRef]
  49. Yimer, F.; Ledin, S.; Abdelkadir, A. Soil organic carbon and total nitrogen stocks as affected by topographic aspect and vegetation in the Bale Mountains, Ethiopia. Geoderma 2006, 135, 335–344. [Google Scholar] [CrossRef]
  50. Prieto, I.; Stokes, A.; Roumet, C. Root functional parameters predict fine root decomposability at the community level. J. Ecol. 2016, 104, 725–733. [Google Scholar] [CrossRef]
  51. Koven, C.D.; Hugelius, G.; Lawrence, D.M.; Wieder, W.R. Higher climatological temperature sensitivity of soil carbon in cold than warm climates. Nat. Clim. Chang. 2017, 7, 817–822. [Google Scholar] [CrossRef] [Green Version]
  52. Fu, X.L.; Shao, M.G.; Wei, X.R.; Horton, R. Soil organic carbon and total nitrogen as affected by vegetation types in northern Loess Plateau of China. Geoderma 2010, 155, 31–35. [Google Scholar] [CrossRef]
  53. Hussain, S.; Sharma, V.; Arya, V.M.; Sharma, K.R.; Rao, C.S. Total organic and inorganic carbon in soils under different land use/land cover systems in the foothill himalayas. Catena 2019, 182, 104104. [Google Scholar] [CrossRef]
  54. Wang, W.J.; Qiu, L.; Zu, Y.G.; Su, D.X.; An, J.; Wang, H.Y.; Zheng, G.Y.; Sun, W.; Chen, X.Q. Changes in soil organic carbon, nitrogen, pH and bulk density with the development of larch (Larix gmelinii) plantations in China. Glob. Chang. Biol. 2011, 17, 2657–2676. [Google Scholar]
  55. Yao, Y.F.; Shao, M.G.; Fu, X.L.; Wang, X.; Wei, X.R. Effects of shrubs on soil nutrients and enzymatic activities over a 0–100 cm soil profile in the desert-loess transition zone. Catena 2019, 174, 362–370. [Google Scholar] [CrossRef]
  56. Gray, J.M.; Bishop, T.F.A.; Wilson, B.R. Factors controlling soil organic carbon stocks with depth in Eastern Australia. Soil Sci. Soc. Am. J. 2016, 79, 1741. [Google Scholar] [CrossRef] [Green Version]
  57. Finér, L.; Mannerkoski, H.; Piirainen, S.; Starr, M. Carbon and nitrogen pools in an old-growth, Norway spruce mixed forest in eastern Finland and changes associated with clear-cutting. For. Ecol. Manag. 2003, 174, 51–63. [Google Scholar] [CrossRef]
  58. Liu, C.G.; Pang, J.P.; Jepsen, M.R.; Lü, X.T.; Tang, J.W. Carbon stocks across a fifty year chronosequence of rubber plantations in tropical China. Forests 2017, 8, 209. [Google Scholar] [CrossRef] [Green Version]
  59. Wang, T.; Kang, F.F.; Cheng, X.Q.; Han, H.R.; Ji, W.J. Soil organic carbon and total nitrogen stocks under different land uses in a hilly ecological restoration area of North China. Soil Tillage Res. 2016, 163, 176–184. [Google Scholar] [CrossRef]
  60. Yang, Y.H.; Li, P.; Ding, J.Z.; Zhao, X.; Ma, W.H.; Ji, C.J.; Fang, J.Y. Increased topsoil carbon stock across China’s forests. Glob. Chang. Biol. 2014, 20, 2687–2696. [Google Scholar] [CrossRef]
  61. Beer, C.; Reichstein, M.; Tomelleri, E.; Ciais, P.; Jung, M.; Carvalhais, N.; Rodenbeck, C.; Arain, M.A.; Baldocchi, D.; Bonan, G.B.; et al. Terrestrial gross carbon dioxide uptake: Global distribution and covariation with climate. Sci. Total Environ. 2010, 329, 834–838. [Google Scholar] [CrossRef] [Green Version]
  62. Zhang, X.B.; Sun, Z.G.; Liu, J.; Ouyang, Z.; Wu, L.H. Simulating greenhouse gas emissions and stocks of carbon and nitrogen in soil from a long-term no-till system in the North China Plain. Soil Tillage Res. 2018, 178, 32–40. [Google Scholar] [CrossRef]
  63. Li, Y.Y.; Dong, S.K.; Wen, L.; Wang, X.X.; Wu, Y. Soil carbon and nitrogen pools and their relationship to plant and soil dynamics of degraded and artificially restored grasslands of the Qinghai-Tibetan Plateau. Geoderma 2014, 213, 178–184. [Google Scholar] [CrossRef]
  64. Hardwicka, S.R.; Toumia, R.; Pfeiferb, M.; Turnerc, E.C.; Nilusd, R.; Ewersb, R.M. The relationship between leaf area index and microclimate in tropical forest and oil palm plantation: Forest disturbance drives changes in microclimate. Agric. For. Meteorol. 2015, 201, 187–195. [Google Scholar] [CrossRef] [PubMed] [Green Version]
  65. Finzi, A.C.; Breemen, N.V.; Canham, C. Canopy tree-soil interactions within temperate forests: Species effects on soil carbon and nitrogen. Ecol. Appl. 1998, 8, 440–446. [Google Scholar]
  66. Alexander, H.D.; Mack, M.C. A canopy shift in interior Alaskan boreal forests: Consequences for above- and belowground carbon and nitrogen pools during post-fire succession. Ecosystems 2016, 19, 98–114. [Google Scholar] [CrossRef]
Figure 1. Representation of the study site. RL: Rhododendron simsii-Larix gmelinii forest, LL: Ledum palustre-Larix gmelinii forest and SLL: Sphagnum-Bryum-Ledum palustre-Larix gmelinii forest.
Forests 11 00305 g001
Table 1. Stand characteristics of the three typical larch forest ecosystems in the Daxing’an Mountains forest region. DBH: diameter at breast height.
Forest TypeRLLLSLL
Stand age75–9075–9075–90
Elevation (m)324326332
Slope/°342
Stand density (trees·ha−1)1266 ± 1261300 ± 1001117 ± 126
Mean tree Height(m)17.23 ± 1.5416.78 ± 1.9417.47 ± 1.60
Mean DBH (cm)13.78 ± 2.1213.14 ± 2.6114.06 ± 2.23
Table 2. The characteristics of the main understory in the three types of larch forest ecosystems.
Forest TypeUnderstory Species CompositionMean Height (cm)Coverage (%)
RLRhododendron dauricum L.157.56 ± 13.0380
Vaccinium uliginosum L.32.32 ± 5.1430
Ledum palustre L. 43.23 ± 6.3620
Vaccinium vitis-idaea L.18.29 ± 3.2210
LLLedum palustre L.56.10 ± 8.5570
Vaccinium uliginosum L.28.97 ± 4.3220
Pyrola incarnate H. Andr.13.24 ± 3.8440
Vaccinium vitis-idaea L.17.52 ± 2.0150
Fragaria orientalis Losinsk. 13.45 ± 4.5010
SLLSphagnum palustre L.1.56 ± 0.3360
Bryum L.0.62± 0.1540
Ledum palustre L.48.58 ± 5.9770
Vaccinium macrocarpon L.21.02 ± 5.4120
Vaccinium uliginosum L.35.74 ± 4.1150
Pyrola incarnata H. Andr.14.08 ± 2.3610
Vaccinium vitis-idaea L.15.43 ± 2.7130
Fragaria orientalis Losinsk.12.17 ± 1.585
Table 3. Individual biomass regression model of larch forest.
ComponentsRegression EquationR2
RootWG = exp (−3.8091) ×D (2.5955)0.82
StemWS = exp (−2.8231) ×D (2.5784)0.95
BranchWB = exp (−4.0360) ×D (2.2300)0.78
FoliageWL = exp (−4.3762) ×D (1.9638)0.80
Whole treeW = WG + WS +WB + WL0.96
In the regression equation, D stands for DBH.
Table 4. Carbon and nitrogen stocks in the vegetation layer.
ComponentCarbon Stock (Mg·ha−1)Nitrogen Stock (kg·ha−1)
RLLLSLLRLLLSLL
Tree Layer
Foliage1.51 ± 0.24 Da1.38 ± 0.32 Da1.37 ± 0.24 Da37.98 ± 6.53 Ca35.57 ± 7.94 Ca32.91 ± 5.11 Ca
Branches3.64 ± 0.70 Ca3.33 ± 0.92 Ca3.34 ± 0.64 Ca54.52 ± 10.09 Ba47.09 ± 8.87 Ba48.74 ± 9.67 Ba
Stems29.61 ± 7.28 Aa26.02 ± 8.86 Aa26.86 ± 6.78 Aa86.27 ± 17.56 Aa80.00 ± 20.63 Aa79.00 ± 18.27 Aa
Roots12.15 ± 2.86 Ba11.09 ± 3.49 Ba11.40 ± 2.57 Ba51.33 ± 12.36 Ba44.36 ± 8.40 Ba50.50 ± 12.13 Ba
Subtotal46.91 ± 9.86 a41.81 ± 12.13 a42.97 ± 9.15 a230.09 ± 42.04 a207.02 ± 43.44 a211.16 ± 41.52 a
Shrub Layer
Foliage0.42 ± 0.07Ca0.46 ± 0.07 Ca0.24 ± 0.04 Cb14.01 ± 1.68 Ca11.15 ± 1.44 Bb5.28 ± 1.28 Cc
Stems1.58 ± 0.36Ba0.97 ± 0.22 Bb0.56 ± 0.11 Bc23.01 ± 4.74 Ba13.70 ± 3.70 Bb8.23 ± 2.13 Bc
Roots2.83 ± 0.52Aa1.75 ± 0.46 Ab0.81 ± 0.13 Ac43.61 ± 4.14 Aa33.82 ± 9.06 Ab14.36 ± 2.71 Ac
Subtotal4.82 ± 0.88a3.18 ± 0.73 b1.60 ± 0.25 c80.63 ± 8.96 a58.66 ± 13.06 b27.87 ± 5.73 c
Herb Layer
Aboveground0.14 ± 0.03 Ac0.22 ± 0.06 Ab0.44 ± 0.10 Aa3.82 ± 0.78 Ab5.29 ± 1.57 Ab14.74 ± 2.61 Aa
Belowground0.07 ± 0.02 Bb0.11 ± 0.03 Ba0.05 ± 0.01 Bc1.84 ± 0.38 Ba2.43 ± 0.66 Ba1.10 ± 0.14 Bb
Subtotal0.21 ± 0.05 c0.33 ± 0.08 b0.49 ± 0.08 a5.66 ± 1.12 c7.72 ± 2.19 b15.84 ± 2.65 a
Total51.94 ± 10.79 a45.32 ± 12.94 a45.06 ± 9.43 a316.38 ± 52.12 a273.40 ± 58.69 a258.87 ± 50.59 a
The data are presented as mean ± standard deviation. Different capital letters represent significant differences among different components in each layer, and different lowercase letters represent significant differences among forest types (P < 0.05).
Table 5. Carbon and nitrogen distributions in the vegetation layer.
ComponentCarbon Proportion (%)Nitrogen Proportion (%)
RLLLSLLRLLLSLL
Tree Layer
Foliage3.223.303.1916.5117.1815.59
Branches7.767.957.7723.7022.7523.08
Stems63.1262.2362.5137.4938.6437.41
Roots25.9026.5226.5322.3021.4323.92
Subtotal100.00100.00100.00100.00100.00100.00
Shrub Layer
Foliage8.7114.4714.9017.3819.0018.95
Stems32.7830.5034.7828.5423.3529.53
Roots58.5155.0350.3254.0857.6551.52
Subtotal100.00100.00100.00100.00100.00100.00
Herb Layer
Aboveground66.6766.6789.8067.4968.5293.06
Belowground33.3333.3310.2032.5131.486.94
Subtotal100.00100.00100.00100.00100.00100.00
Table 6. Carbon and nitrogen stocks in the litter layer.
ComponentCarbon Stock (Mg·ha−1)Nitrogen Stock (kg·ha−1)
RLLLSLLRLLLSLL
Under-decomposed0.98 ± 0.23 Bb1.02 ± 0.19 Bb1.41 ± 0.29 Ba28.53 ± 7.90 Ba29.15 ± 5.02 Ba35.92 ± 7.27 Ba
Semi-decomposed1.54 ± 0.33 Ab1.52 ± 0.29 Ab1.92 ± 0.13 Aa49.66 ± 10.42 Aa56.86 ± 8.81 Aa59.04 ± 8.08 Aa
Total2.53 ± 0.56 b2.54 ± 0.48 b3.33 ± 0.41 a78.19 ± 17.97 a86.01 ± 13.24 a94.96 ± 14.00 a
The data are presented as mean ± standard deviation. Different capital letters represent significant differences among different components, and different lowercase letters represent significant differences among forest types (P < 0.05).
Table 7. Carbon and nitrogen distributions in the litter layer.
ComponentCarbon Proportion (%)Nitrogen Proportion (%)
RLLLSLLRLLLSLL
Under-decomposed38.7440.1642.3436.4933.8937.83
Semi-decomposed61.2659.8457.6663.5166.1162.17
Total100.00100.00100.00100.00100.00100.00
Table 8. Carbon and nitrogen stocks in the soil layer.
Layer (cm)Carbon Stock (Mg·ha−1)Nitrogen Stock (Mg·ha−1)
RLLLSLLRLLLSLL
0–1038.54 ± 5.93 Ac52.54 ± 7.07 Ab94.99 ± 11.87 Aa2.19 ± 0.28 Ac3.06 ± 0.43 Ab7.04 ± 0.78 Aa
10–2017.09 ± 1.92 Bb20.82 ± 2.99 Bb39.92 ± 5.83 Ba1.44 ± 0.22 Bb1.91 ± 0.49 Bb5.16 ± 0.63 Ba
20–3010.05 ± 1.31 Cc15.07 ± 2.89 Cb24.34 ± 3.78 Ca0.93 ± 0.18 Cc1.85 ± 0.23 Bb3.20 ± 0.38 Ca
30–407.91 ± 0.80 Db9.57 ± 2.15 Db12.03 ± 1.81 Da0.73 ± 0.15 CDb1.11 ± 0.25 Ca1.33 ± 0.20 Da
40–505.26 ± 0.55 Eb4.80 ± 0.50 Eb13.09 ± 2.32 Da0.69 ± 0.12 CDb0.91 ± 0.24 Cb1.35 ± 0.33 Da
50–604.43 ± 0.71 Eb4.98 ± 0.73 Eb12.61 ± 1.22 Da0.84 ± 0.19 CDb0.94 ± 0.27 Cb1.63 ± 0.25 Da
60–704.38 ± 0.54 Eb4.83 ± 0.35 Eb11.89 ± 1.78 Da0.63 ± 0.14 Dc1.03 ± 0.18 Cb1.34 ± 0.19 Da
70–803.80 ± 0.50 Eb4.76 ± 0.16 Eb12.14 ± 1.79 Da0.67 ± 0.12 CDb1.46 ± 0.23 Ba1.36 ± 0.29 Da
80–904.05 ± 0.40 Ec5.74 ± 0.65 Eb10.01 ± 0.99 Da0.70 ± 0.07 CDb1.18 ± 0.25 Ca1.36 ± 0.26 Da
90–1003.95 ± 0.41 Ec5.56 ± 0.71 Eb8.61 ± 1.20 Da0.78 ± 0.12CDb1.03 ± 0.15 Ca1.08 ± 0.20 Da
Total99.46 ± 10.28 c128.66 ± 11.56 b239.63 ± 27.64 a9.61 ± 0.85 c14.49 ± 1.33 b24.84 ± 2.64 a
The data are presented as mean ± standard deviation. Different capital letters represent significant differences among different layers in soil, and different lowercase letters represent significant differences among forest types (P < 0.05).
Table 9. Carbon and nitrogen distributions in the soil layer.
Layer (cm)Carbon Proportion (%)Nitrogen Proportion (%)
RLLLSLLRLLLSLL
0–1038.7540.8339.6422.8121.1328.33
10–2017.1816.1816.6615.0013.1920.76
20–3010.1011.7110.169.6912.7812.88
30–407.957.445.027.607.675.35
40–505.293.735.467.196.285.43
50–604.453.875.268.756.496.56
60–704.403.754.966.567.115.39
70–803.823.705.076.9810.085.47
80–904.084.464.187.298.155.47
90–1003.984.323.598.137.114.35
Total100.00100.00100.00100.00100.00100.00
Table 10. Ecosystem carbon and nitrogen stocks in the three types of larch forest ecosystems.
ComponentCarbon Stock (Mg·ha−1)Nitrogen Stock (Mg·ha−1)
RLLLSLLRLLLSLL
Vegetation 51.94 ± 10.79 Ba45.32 ± 12.94 Ba45.06 ± 9.43 Ba0.32 ± 0.05 Ba0.27 ± 0.06 Ba0.26 ± 0.05 Ba
Litter 2.53 ± 0.56 Cb 2.54 ± 0.48 Cb 3.33 ± 0.41 Ca 0.08 ± 0.02 Ca 0.09 ± 0.01 Ca 0.09 ± 0.01 Ca
Soil 99.46 ± 10.28 Ac128.66 ± 11.56 Ab239.63 ± 27.64 Aa 9.61 ± 0.85 Ac 14.49 ± 1.33 Ab24.84 ± 2.64 Aa
Total153.93 ± 10.11 c176.52 ± 15.88 b288.01 ± 16.25 a10.00 ± 0.92 c14.85 ± 1.40 b25.19 ± 2.70 a
The data are presented as mean ± standard deviation. Different capital letters represent significant differences among different components, and different lowercase letters represent significant differences among forest types (P < 0.05).
Table 11. Ecosystem carbon and nitrogen distributions in the three types of larch forest ecosystems.
ComponentCarbon Proportion (%)Nitrogen Proportion (%)
RLLLSLLRLLLSLL
Vegetation 33.74 25.67 15.64 3.201.82 1.03
Litter 1.64 1.44 1.16 0.800.61 0.36
Soil 64.61 72.89 83.2096.0097.58 98.61
Total100.00100.00100.00100.00100.00100.00
Table 12. Mean values of environmental factors of the three types of larch forest.
Forest TypesLAI
(m2m−2)
Air Temperature
(°C)
Relative Humidity (%)VPD
(kPa)
Soil Temperature (°C)SWC (%)
RL1.85 ± 0.07 a25.95 ± 0.13 a60.49 ± 0.58 c 1.32 ± 0.02 a 9.77 ± 0.10 a9.87 ± 1.80 c
LL1.87 ± 0.05 a23.25 ± 0.16 b65.77 ± 1.53 b0.98 ± 0.05 b8.56 ± 0.23 b16.04 ± 1.25 b
SLL1.60 ± 0.02 b21.56 ± 0.69 c70.90 ± 1.85 a0.75 ± 0.06 c7.96 ± 0.15 c24.80 ± 1.69 a
Different letters in the same index means different levels of significance (P < 0.05); SWC is soil water content, LAI is leaf area index, and VPD is vapor pressure deficit.
Table 13. Correlation matrix of the ecosystem carbon and nitrogen stocks and environmental factors in the larch forest.
Environment FactorsNitrogen StockLAIAir TemperatureRelative HumidityVPDSoil TemperatureSWC
Carbon stock0.89 **−0.86 **−0.85 **0.88 **−0.87 **−0.79 **0.91 **
Nitrogen stock1−0.70 **−0.84 **0.85 **−0.86 **−0.85 **0.87 **
* Significant at the 0.05 level; ** Significant at the 0.01 level. SWC is soil water content, LAI is leaf area index, VPD is vapor pressure deficit.

