Article

Flowering Phenology and Characteristics of Pollen Aeroparticles of Quercus Species in Korea

Department of Environmental Horticulture, University of Seoul, Seoul 02504, Korea
*
Author to whom correspondence should be addressed.
Forests 2020, 11(2), 232; https://doi.org/10.3390/f11020232
Submission received: 27 January 2020 / Revised: 14 February 2020 / Accepted: 16 February 2020 / Published: 20 February 2020
(This article belongs to the Special Issue Tree Pollen and Floral Biology)

Abstract

:
In recent decades, airborne allergens for allergic respiratory diseases have been found to increase significantly by a process of converting coniferous forests into broad-leaved forests in Korea. This study was conducted to evaluate factors, including airborne pollen counts, micromorphology, and flowering phenology, that can affect oak pollen-related allergic symptoms. The catkin of Mongolian oak (Quercus mongolica Fisch. ex Ledeb.) showed the most rapidly blooming catkin on Julian day 104 in flower development. Among six species, the last flowering was observed on Julian day 119 in Korean oak (Quercus dentata Thunb.). The pollen dispersal was persisted for about 32 days from Julian day 104 to Julian day 136. Airborne pollen was observed about 2 weeks after flowering phase H, the senescence phase. Pollen size varied by species, with the largest from Q. mongolica (polar axis length, PL = 31.72 µm, equatorial axis length, EL = 39.05 µm) and the smallest from Jolcham oak (Quercus serrata Murray) (PL = 26.47 µm, EL = 32.32 µm). Regarding pollen wall structure, endexine of Q. dentata was coarsely laminated or fragmented. The endexine thicknesses of Sawtooth oak (Quercus acutissima Carruth.) and Q. serrata were thick and stable, whereas Galcham oak (Quercus aliena Blume), Q. mongolica, and Oriental cork oak (Quercus variabilis Blume) had thinner endexines. The area occupied by pollenkitt of Q. variabilis was significantly larger than that of Q. acutissima. Importantly, Q. variabilis had a distinctly thick 17 kDa protein band, a presumed major allergen. Oak species differ in pollen protein composition, and thus there is a possibility that the allergenic activity of pollen proteins vary depending on oak species. This study highlights the fact that native oak species in Korea differ in flowering pattern of male flowers, pollen morphology, and pollen chemical constituents. These discrepancies in flowering and pollen properties imply variable allergic responses to oak pollen from different species.

1. Introduction

Korea has large forested areas, with about 60% of the country being forest. Oaks (Quercus species) are the most common deciduous trees in Korea. Quercus species, which account for 48% of the domestic deciduous forests and 24.9% of the total forest area, are widely distributed throughout the country [1]. Quercus species select a favorable period to proceed with the formation of leaves and flower buds. Generally, Quercus species undergo formation of leaves and flower buds starting in early spring. They overwinter as buds, and flower the following spring [2]. The species of Quercus genus are monoecious in that they have both male and female inflorescences in a single tree. There is a long period between pollination and fertilization, and male flowers mature earlier than female flowers [3]. Like other trees with catkins, Quercus is pollinated by wind [4]. Quercus species can be commonly found in urban forests of high-density cities such as Seoul [1,5], and some studies have shown that the area of deciduous forests in Korea is increasing [6,7].
On the basis of allergen sensitization tests conducted in the 1980s, 1990s, and 2010s using 31 pollen allergens, reactivity to tree pollen increased from the 1990s to the 2010s [8]. Furthermore, pollen transferred by wind has extremely low pollenkitt (also called pollen coat) in an outer exine layer [9]. The amount of pollenkitt affects dispersal of pollen grains. Pollenkitt keeps other pollen around and makes several pollens become one mass. Pollen lumps, sticky material, are difficult to blow in the wind. Previous studies [10,11,12,13] investigated 61 allergenic plant pollens with transmission electron microscopy (TEM) and found that highly allergenic pollens had less pollenkitt.
Global warming has resulted in a global increase in pollen concentrations, an extension in pollen season, and/or the northward range expansion of the habitat of allergenic pollen taxa, leading to an increasing number of pollen allergic diseases worldwide. Consequently, the pollen-related global public health challenge is increasing [14]. The prevalence of chronic respiratory diseases, including allergic rhinitis and asthma, is estimated to be up to 40% in Europe [15,16]. This problem can be further complicated due to their need to consider several factors such as lifestyle and various environmental changes. For example, climate factors change certain signaling systems, consequently affecting production, dispersal patterns, and allergens (as allergenic proteins) of airborne pollens [17,18]. Among tree pollen allergens, those for oak, birch, alder, and pine have shown significantly increased skin reactivity [8]. Pollen emissions of birch and alder are lower than those of other allergenic tree pollens but are more likely to cause allergy [19]. Even though pines produce large amounts of pollen, pine pollen allergy has not been reported [20]. Previous research has demonstrated that oaks produce enormous amounts of pollen, which acts as an allergen. For example, one grain of pollen contains several kinds of proteins, such as “Que a 1” in Quercus alba pollen. This is the only protein characterized as an allergy protein in Quercus species [21]. “Que a 1” belongs to the pathogenesis-related intracellular protein class 10 (PR-10 protein group) as does “Bet v 1” from Betula pollen. Proteins belonging to PR-10 are known to cause allergic disease [22].
More importantly, because of the large number of oak trees, airborne oak pollen is widespread during spring. A skin reactivity test conducted in recent studies revealed a rate of allergic reactivity to Quercus pollen of about 14%, the highest rate among native tree species in Korea. Conversely, the response rates in China and Japan were 6.8% and 10.4% lower, respectively, than that of Korea. This high sensitization rate of Quercus pollen indicates the importance of research investigating oak pollen allergy [8,15,23]. The density of airborne pollen is highly correlated with prevalence of allergies. Flowering phenology and pollen emission data can be used to identify species with the greatest influence on airborne pollen density. Furthermore, pollen size affects migration speed and dispersal distance.
Most of the phenology or palynology studies conducted with Quercus focus on Q. alba, Quercus robur, or Quercus ilex, which are not present in Korea, and may have pollen characteristics that differ from those of trees that do grow in Korea [24,25,26,27]. Therefore, this study was conducted to assess the spatial and temporal patterns of flowering phenology in temperate oak species and to evaluate pollen characteristics for the allergenic potential of oak pollens.

2. Materials and Methods

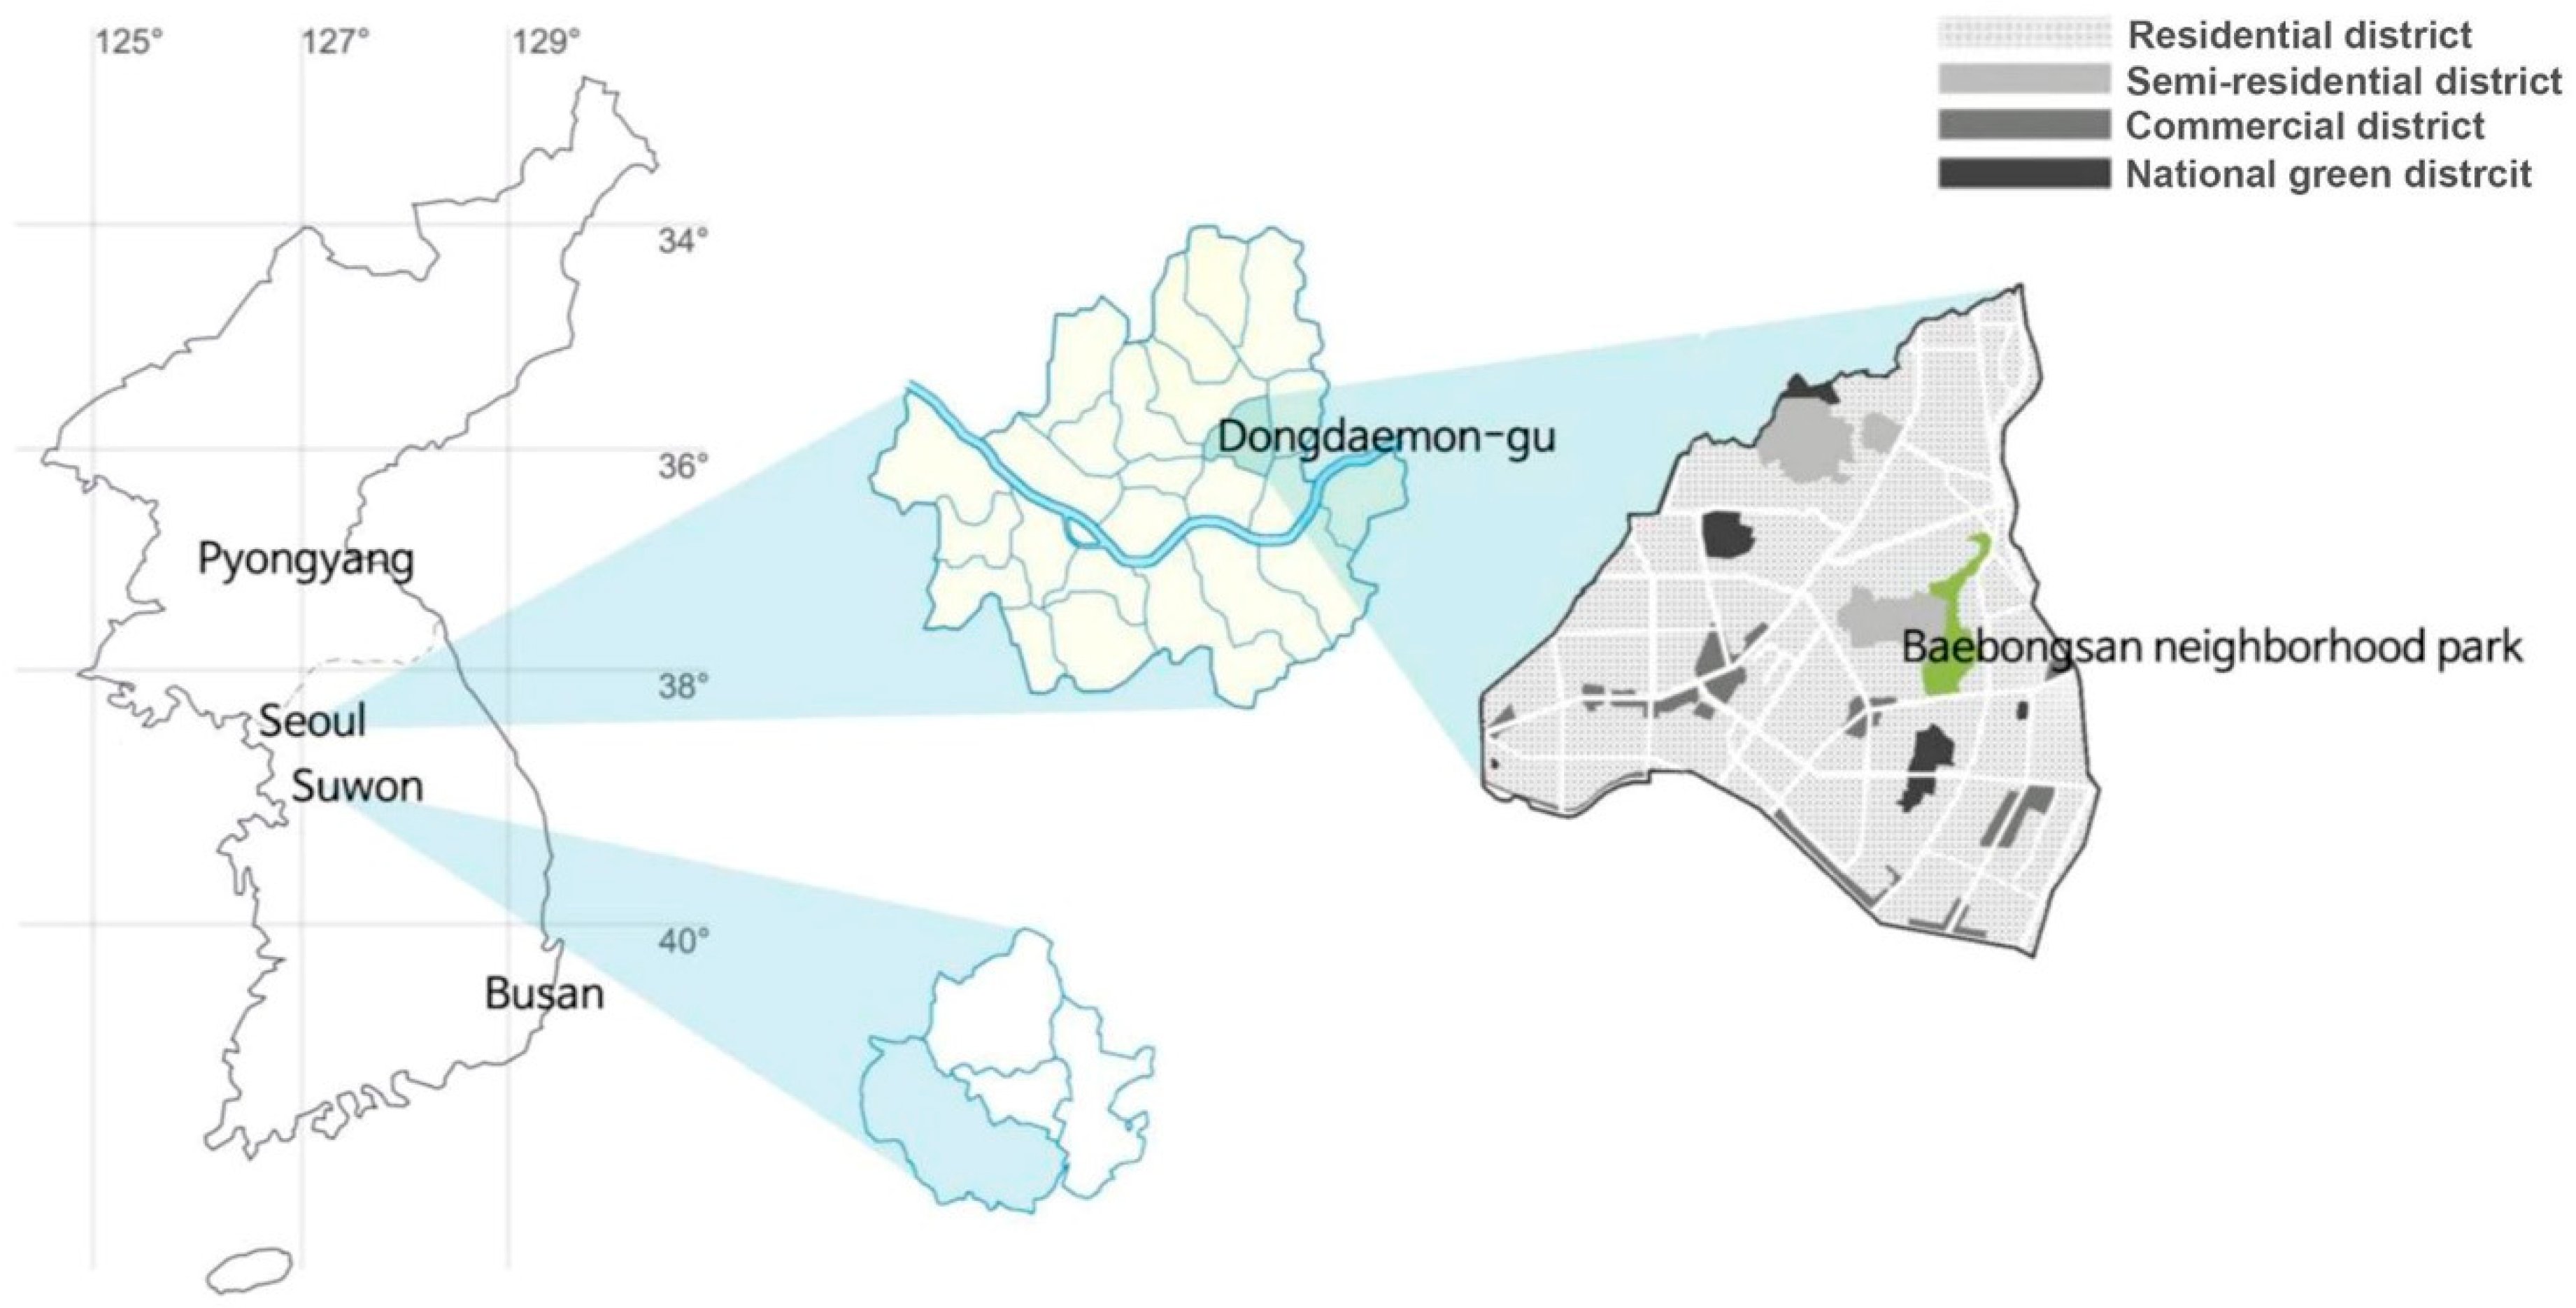
2.1. Study Site and Plant Material

Pollen sampling was conducted in Seoul, located in the middle of the Korean peninsula. Seoul is the capital of the Republic of Korea, and contains 19.4% of the total population of the Republic of Korea. Phenological patterns of male flowers in five oak species (Quercus acutissima, Quercus aliena, Quercus dentata, Quercus mongolica, and Quercus serrata) were measured in Baebongsan Neighborhood Park, an urban forest surrounded by a residential area, in northeast Seoul (37°34′52.1″ N, 127°03′48.8″ E) (Figure 1). For this investigation, three trees per species (15 trees) with similar diameter at breast height (DBH) and age were selected.

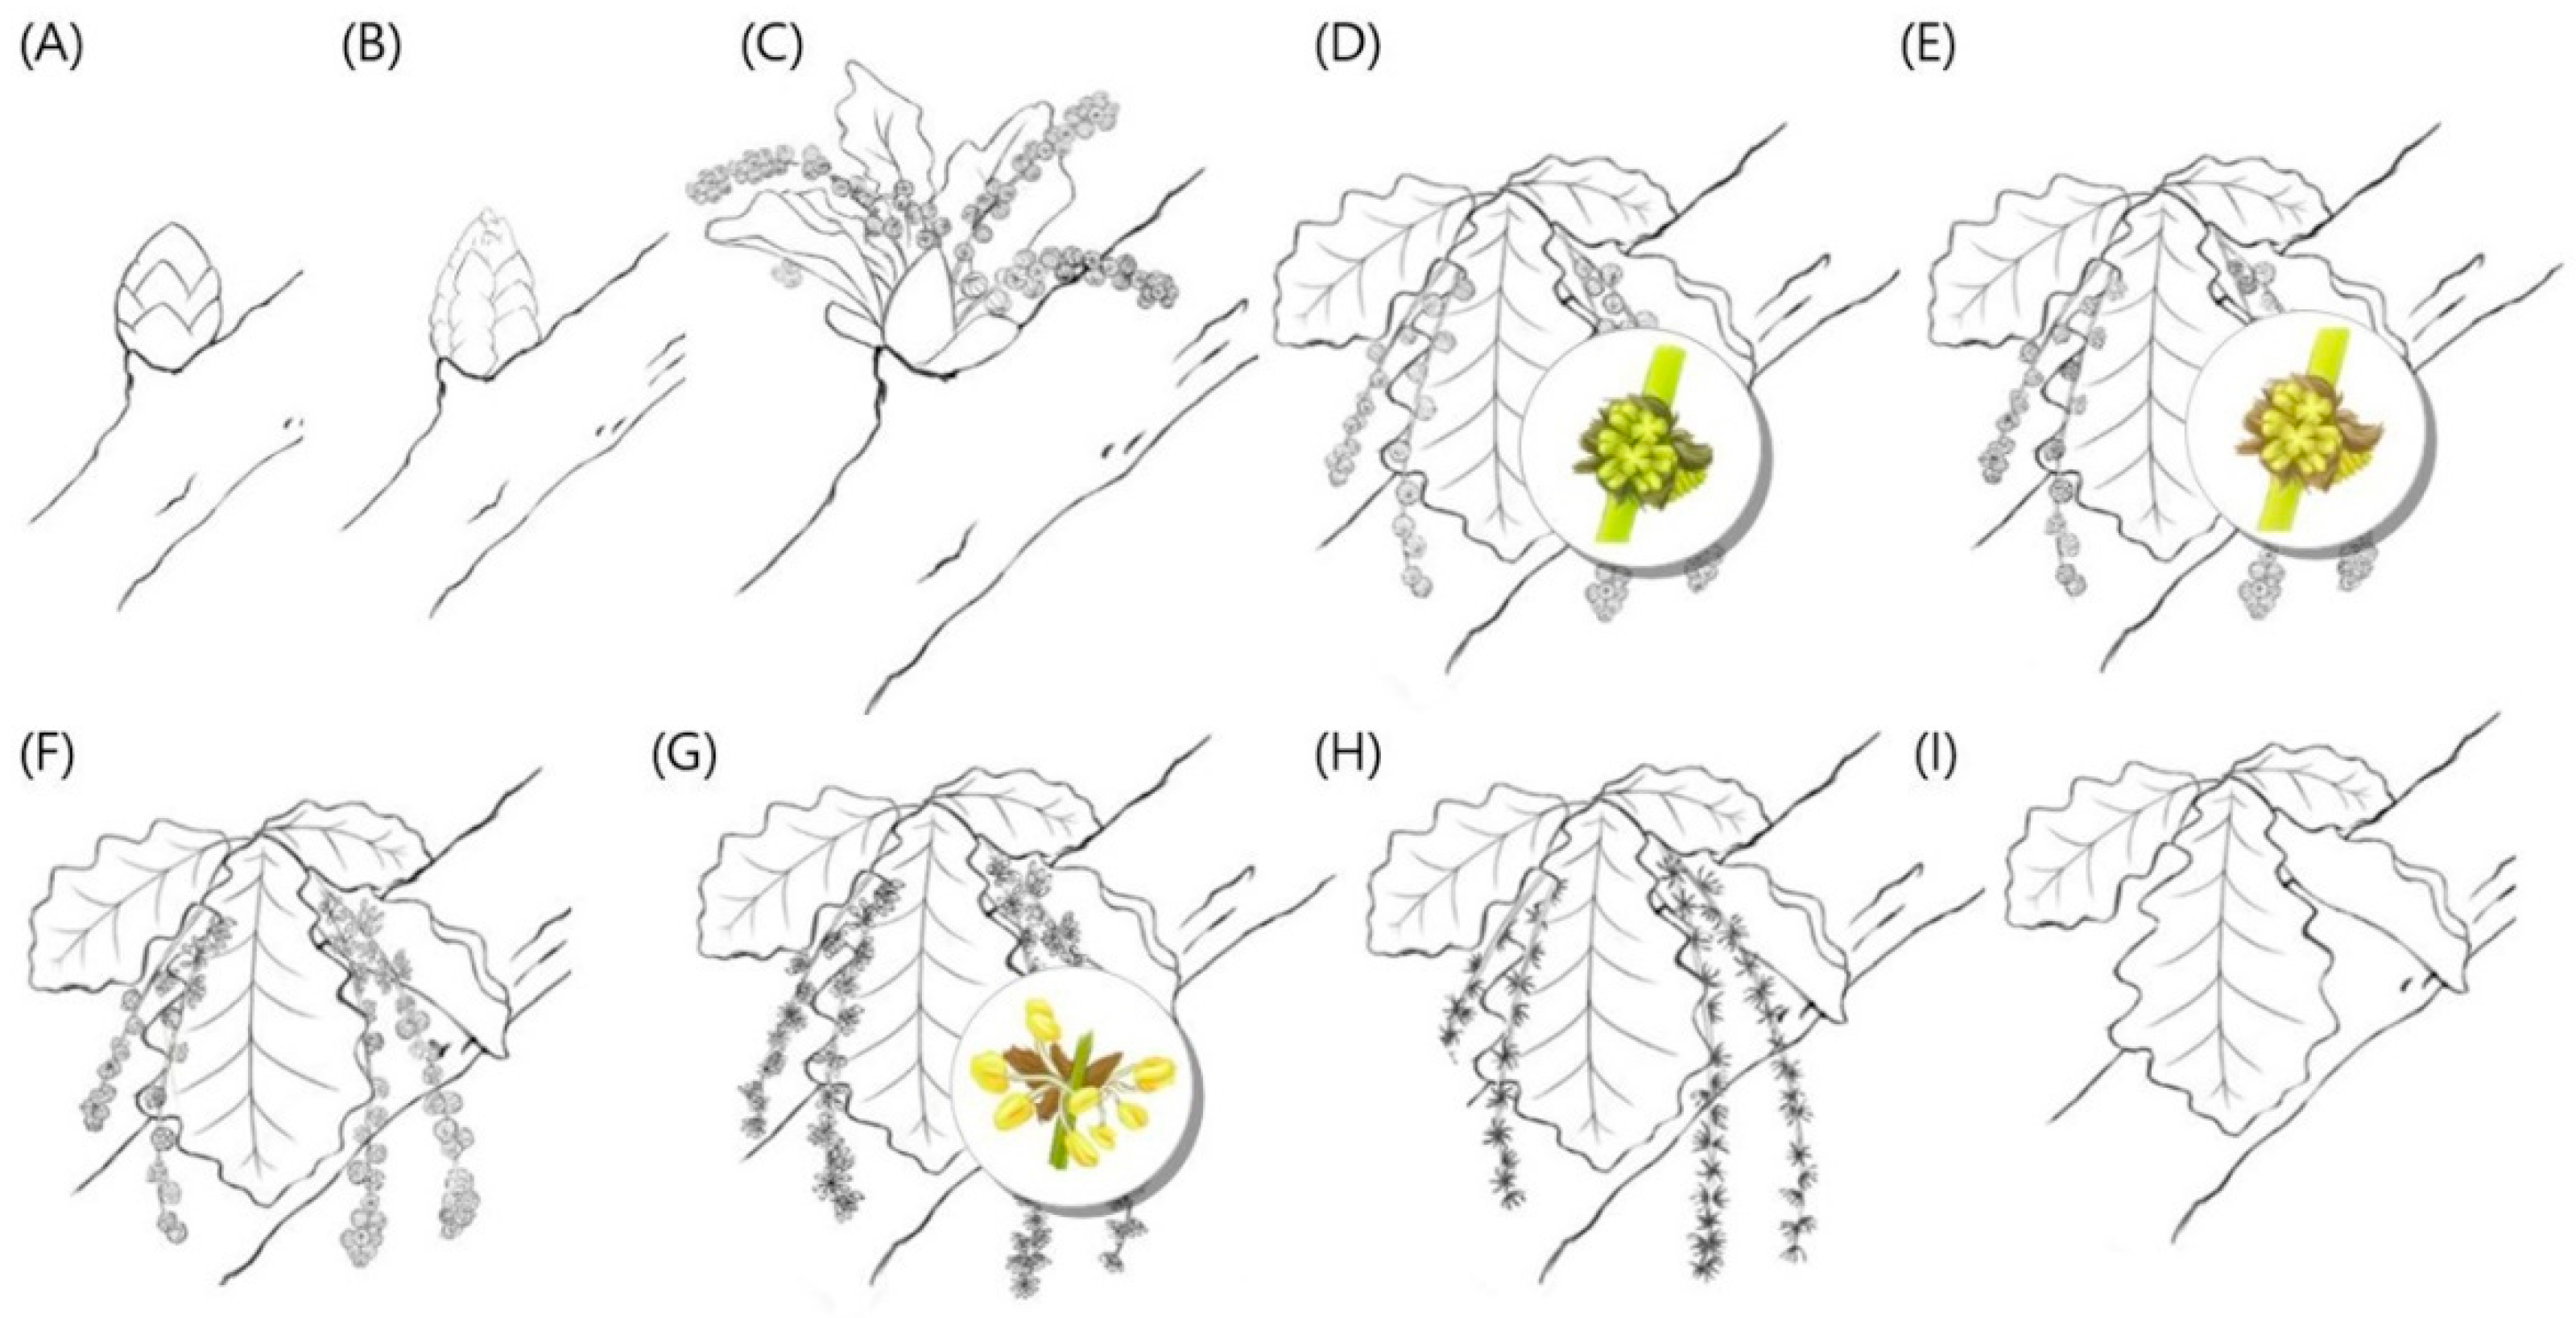
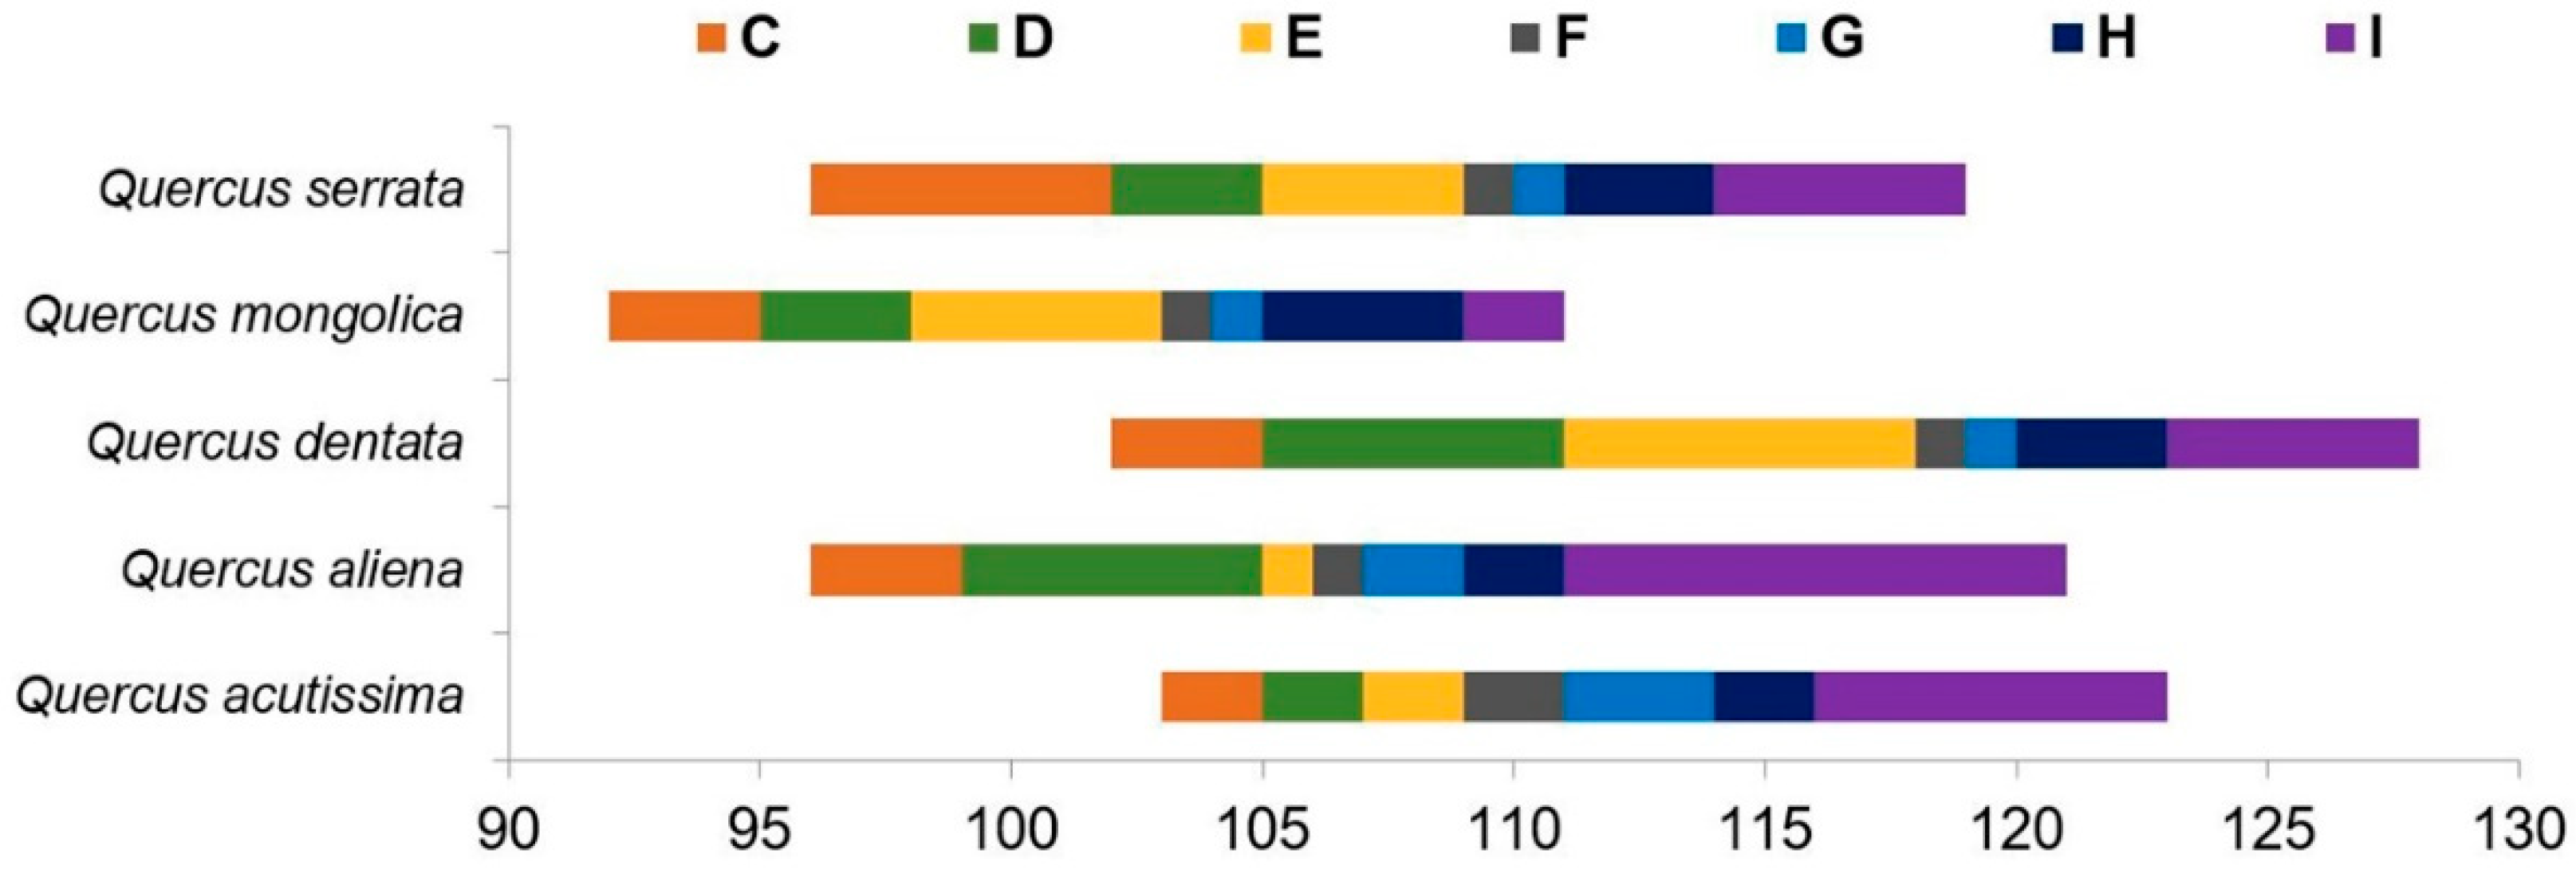
2.2. Flowering Phenology

Fifteen trees of Quercus spp. in Baebongsan Neighborhood Park were selected for this study, and the flowering phenology was monitored six days per week. As shown in Figure 2, detailed descriptions of the flowering stages in male flowers are as follows. (Figure 2A) Winter bud: the first stage of assessment of flowering phenology. Closed buds represent dormancy. The size and shape of buds varied with species, but all were brown. No vegetative green leaves were showing in this stage. (Figure 2B) Bud burst: the bud scale is split, and a new green leaf emerges. (Figure 2C) Catkin development: a green catkin structure appears with its head in an upward position. (Figure 2D) Catkin elongation: the catkin starts to drop, with the head in a downward position. The catkin is still green. (Figure 2E) Maturation of catkin: the catkin is fully elongated, and each male flower separates and lengthens. The flower color changes to yellow green. One or two days pass before the next step, flowering. (Figure 2F) Start of flowering: the first flower of catkin anthesis; most anthers are closed. The flower starts to release pollen at this stage. (Figure 2G) Full flowering: more than 80% of catkins are in anthesis. Almost all flower anthers are in dehiscence. (Figure 2H) Senescence: the catkin turns brown and dries. The flowers stop releasing pollen. (Figure 2I) Catkin falls: flowering is finished, and the dried and twisted catkin falls from the tree.

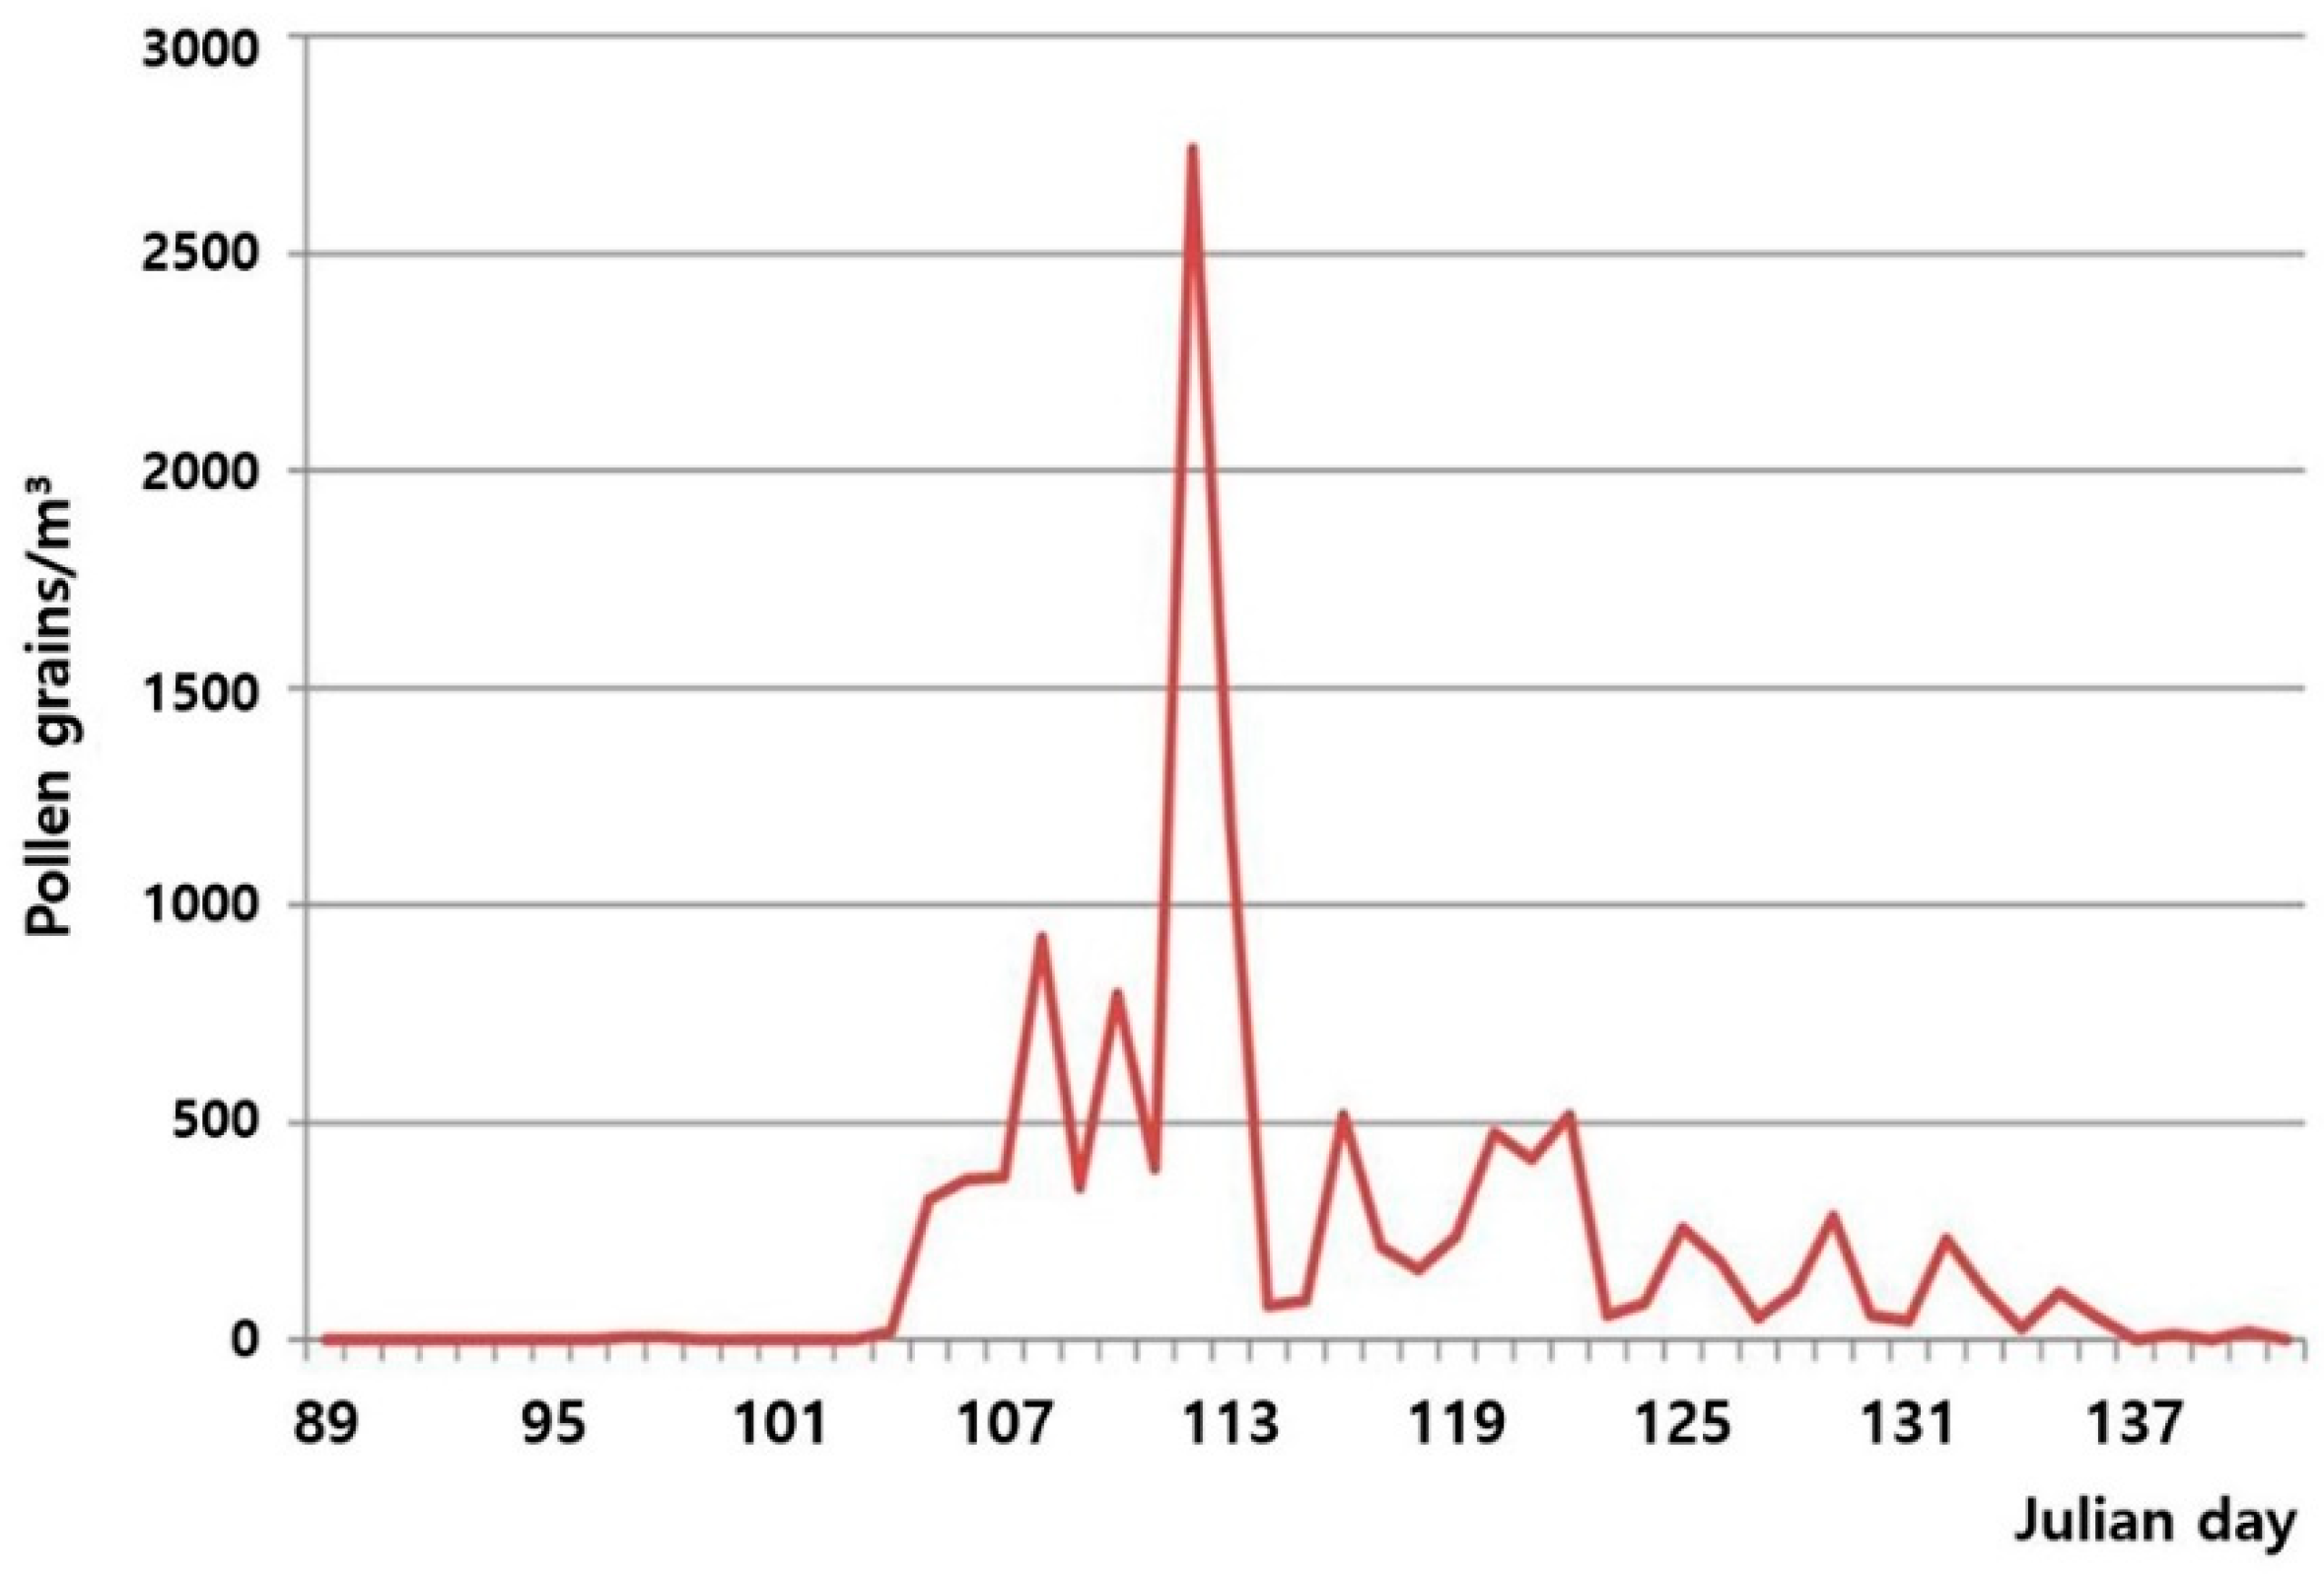
2.3. Airborne Pollen

The presence and amount of airborne pollen in six oak species (Quercus acutissima, Quercus aliena, Quercus dentata, Quercus mongolica, Quercus serrata, and Quercus variabilis) were measured using a Burkard 7-day recording volumetric trap (Burkard Manufacturing Co. Ltd., Rickmansworth, Hertfordshire, United Kingdom) during the study period. The Burkard spore trap was installed on the roof terrace of a building with 12 m height in Guri, approximately 6 km east of Seoul. Pollen grains were collected daily and counted at 200× magnification with a digital camera (Nikon FDX-35; Nikon, Tokyo, Japan) coupled to a Nikon Labophot-2 microscope.

2.4. Size of Pollen Grains

The pollen grains were stained by Calberla’s fuchsin staining solution (10 mL of glycerin, 20 mL of 95% alcohol, 30 mL of distilled water, and 0.2 mL of basic fuchsin) [28,29]. The stained pollen grains were viewed and counted under a Nikon Labophot-2 microscope at 400× magnification, and pollen size was measured by the length of polar and equatorial axis defined as follows: polar axis, the maximum diameter of the pollen grains; equatorial axis, the plane perpendicular to the polar axis. At least 100 pollen grains in each Quercus species were measured for polar axis length (PL), equatorial axis length (EL), and polar/equatorial length (PL/EL) ratio [30].

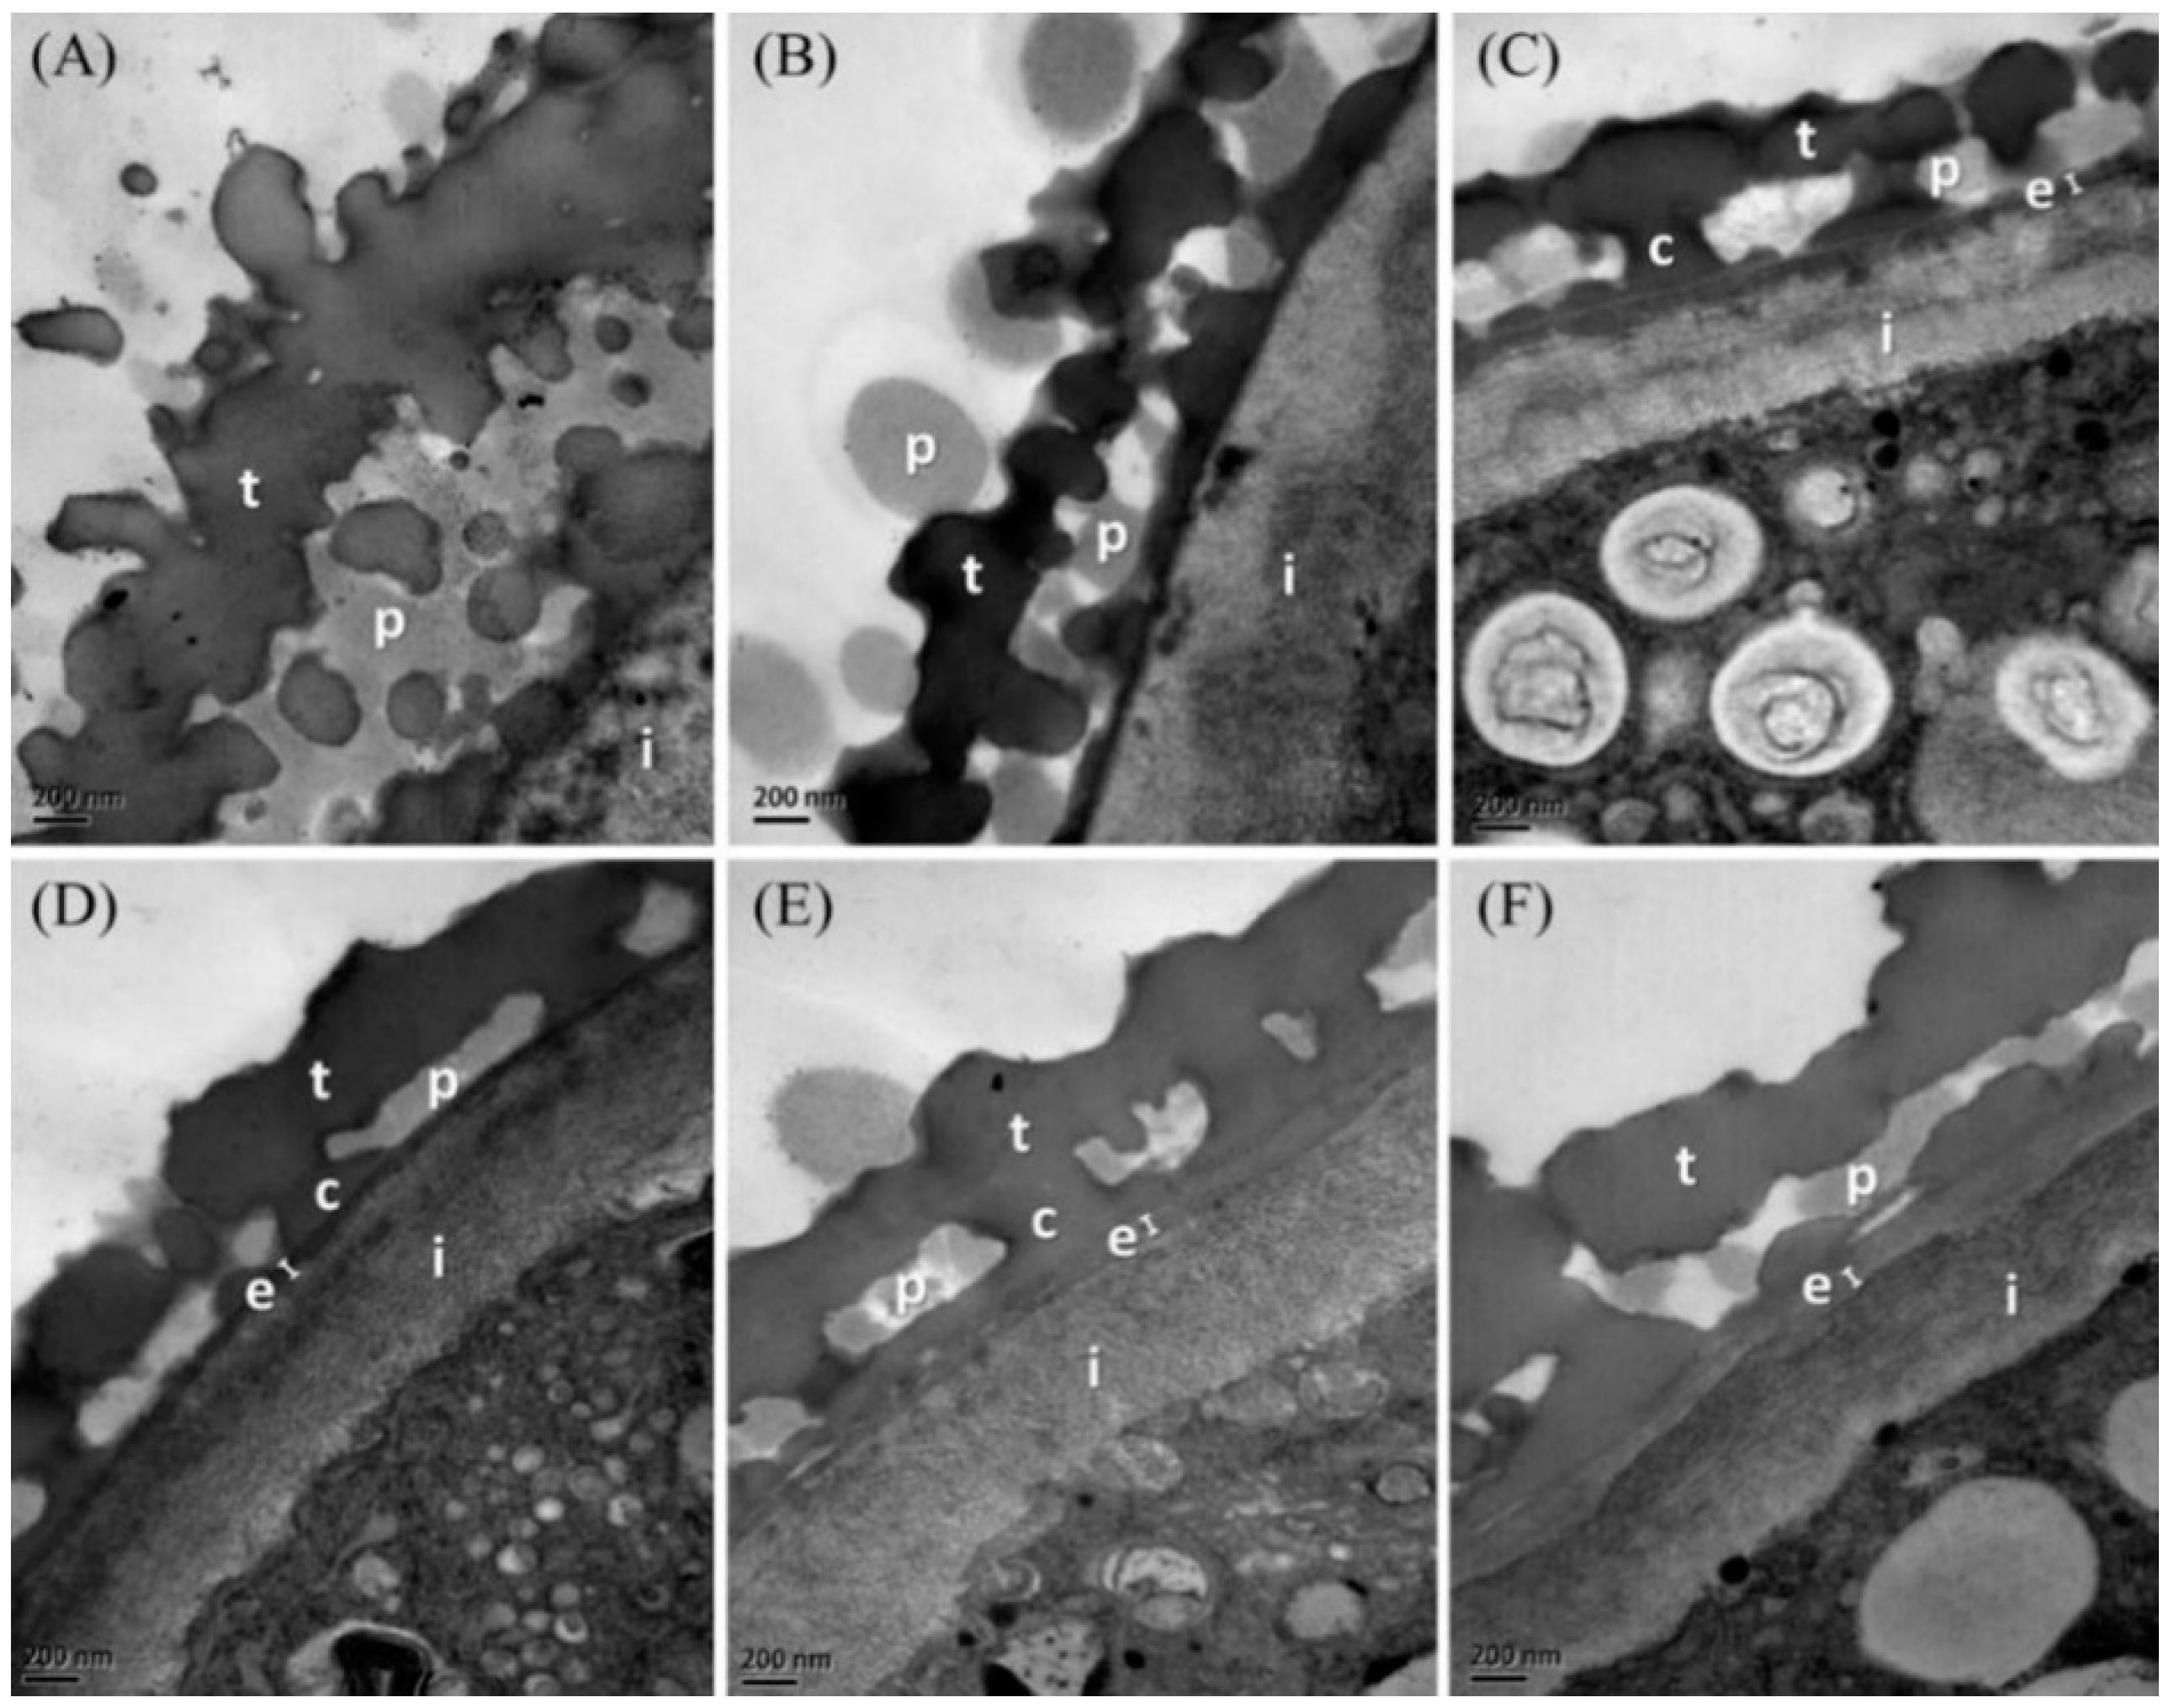
2.5. Observation of Pollen Exine Structure

Sections of the pollen wall were observed by TEM. Two milligrams of pollen per species were primarily fixed in modified Karnovsky’s fixative [31] overnight in a refrigerator. After fixation, the samples were washed with 0.05 M sodium cacodylate buffer three times. After washing, samples were fixed with 700 µL of 2% OsO4 and 700 µL of 0.1 M cacodylate buffer for 2 h. The samples were then briefly washed with distilled water twice and stained with 0.5% uranyl acetate overnight. The next day, the samples were dehydrated with ethanol. After transitioning by propylene oxide, samples were infiltrated with propylene oxide and Spurr’s resin and polymerized in Spurr’s resin for 24 h in a 70 °C dry oven [32]. The sample block was then cut into thin sections of 70–90 nm with a diamond blade in an ultramicrotome and observed with a JEM 1010 (JEOL) TEM at 80 kV [33].

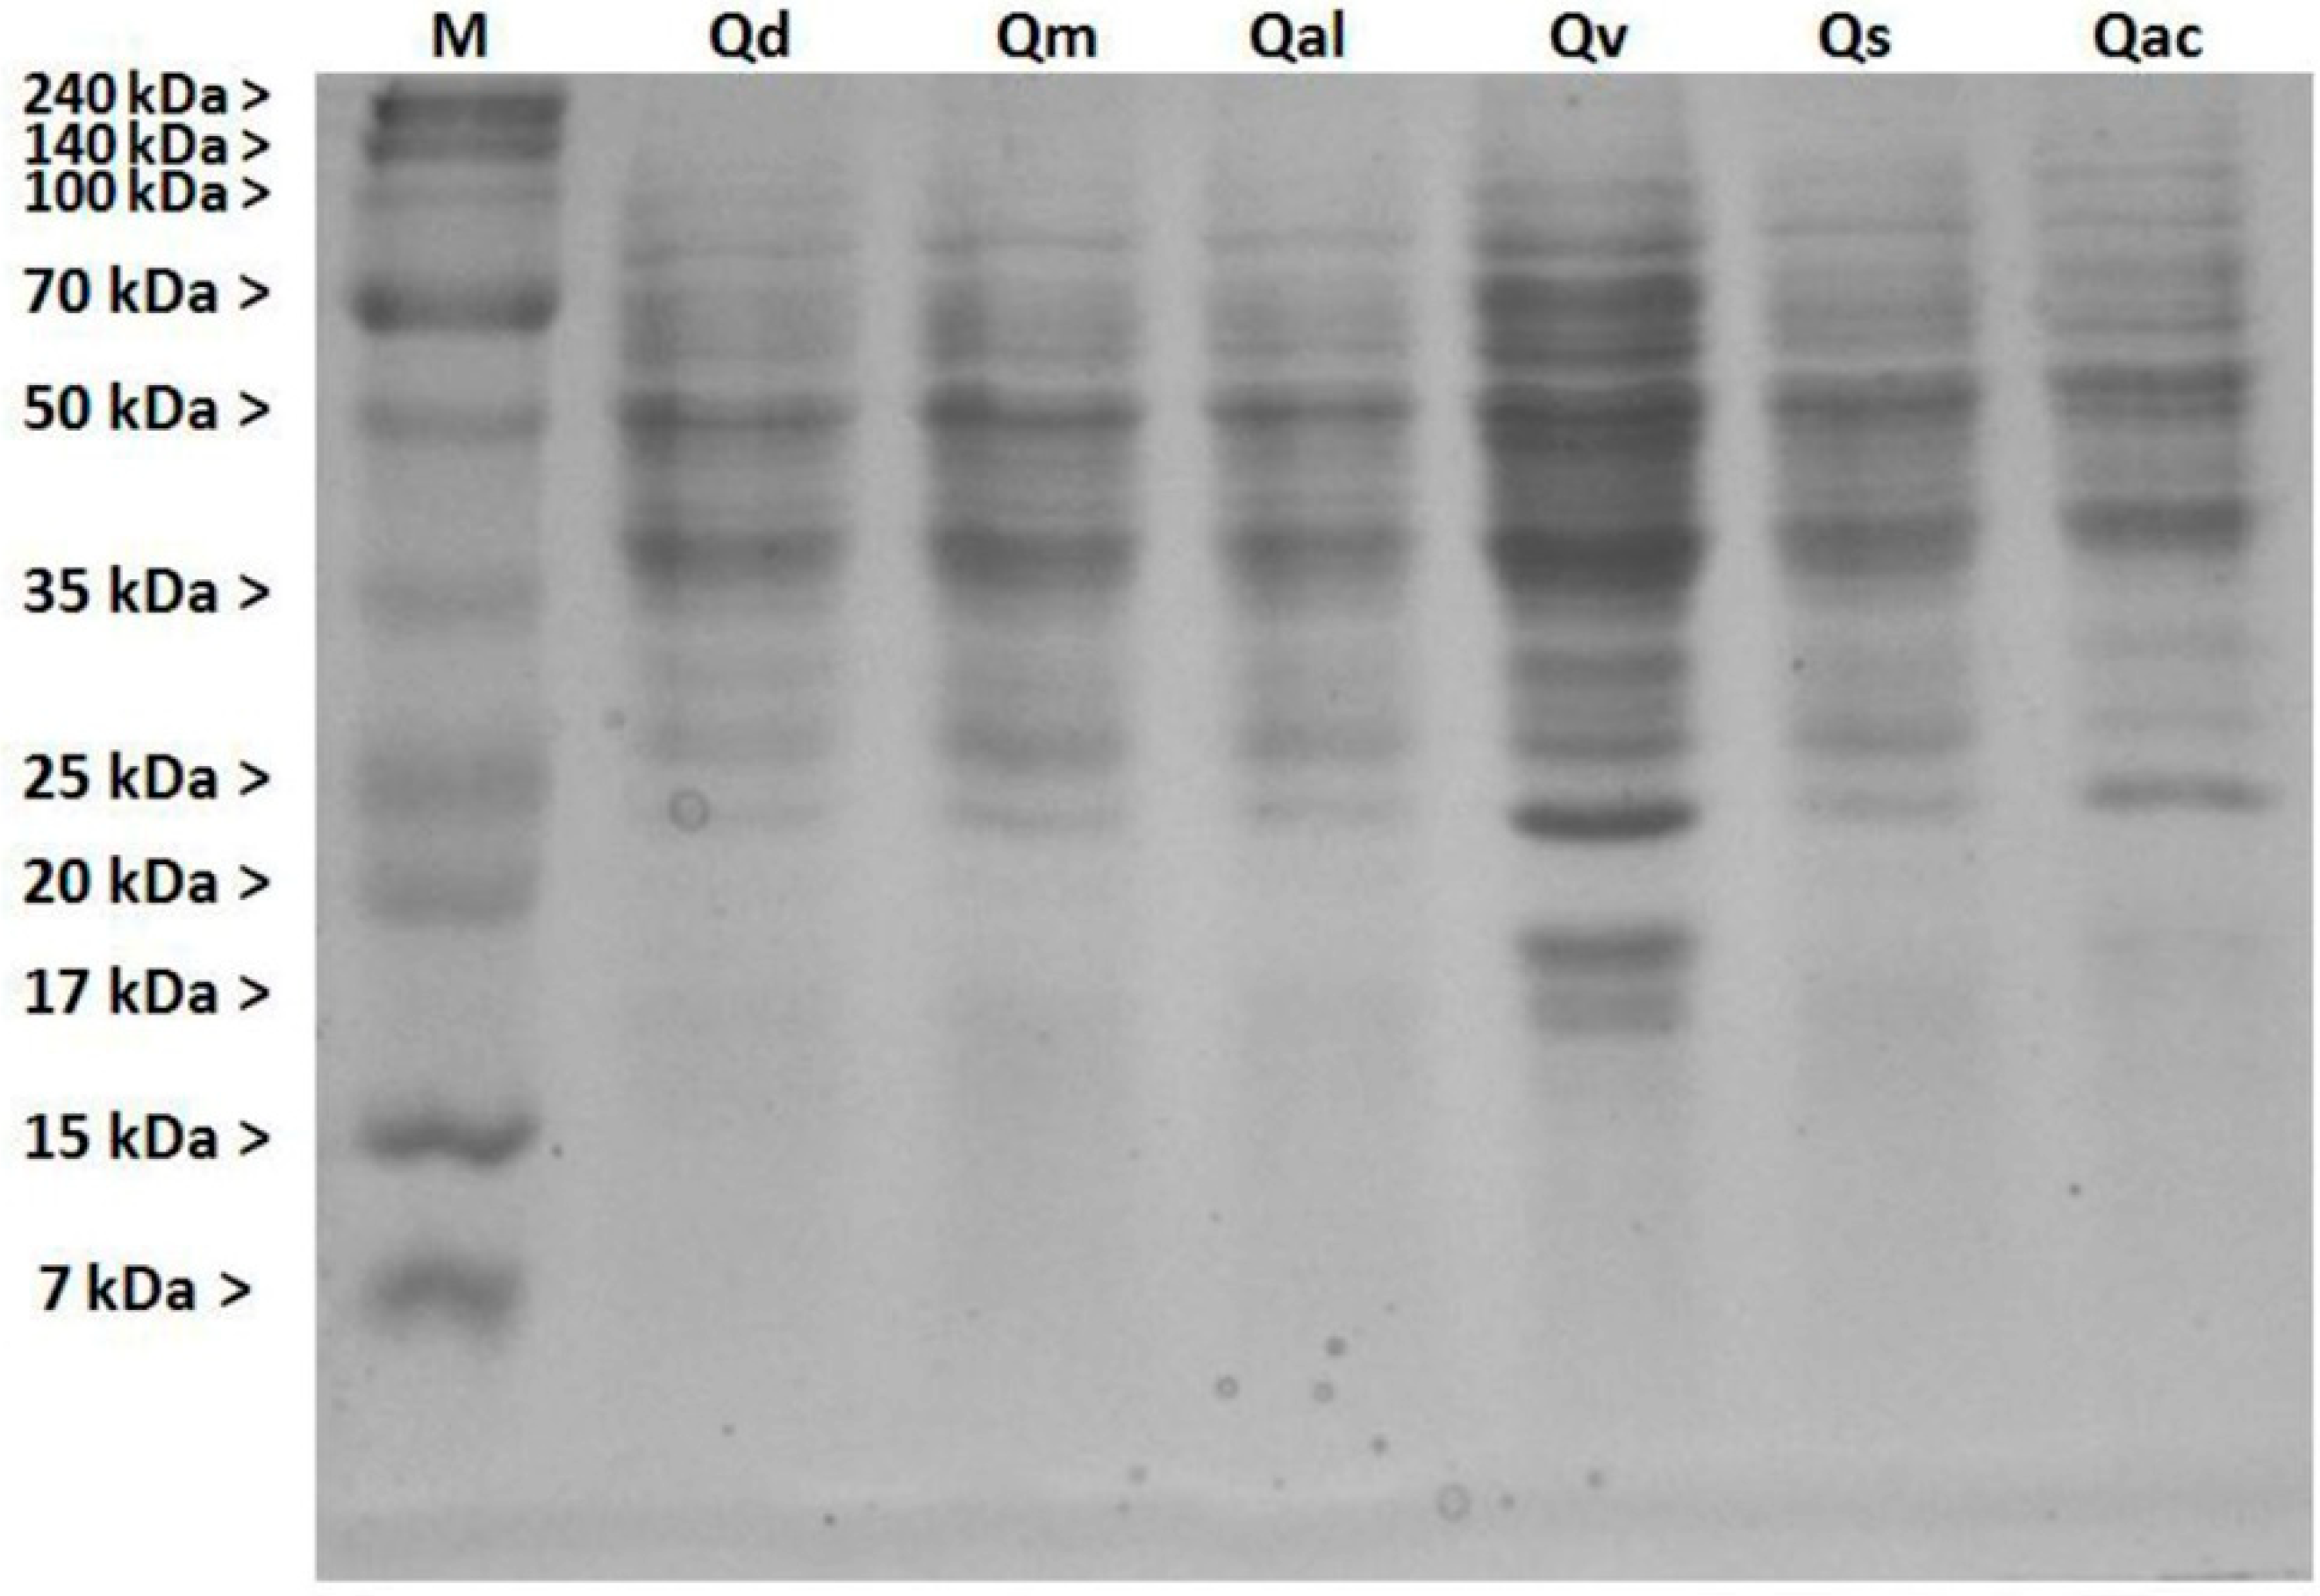
2.6. Soluble Protein Content

Total soluble protein was extracted and quantified by Bradford assay in 1 L of phosphate buffer saline (PBS) composed of 1 L of distilled water, 8 g of NaCl, 0.2 g of KCl, 1.44 g of Na2HPO4, 0.24 g of KH2PO4, and HCl [34]. Chemicals, except HCl, were dissolved in 900 mL distilled water and stirred on a magnetic stirrer for 2 h. Then, 10 N HCl was added to adjust pH to 7.4 and total solution volume adjusted to 1 L with distilled water. The solution was sterilized by autoclaving at 121 °C for 25 min. Autoclaved PBS was cooled overnight at room temperature. Fifty micrograms of pollen was defatted in 1 mL PBS (1:20 w/v) for 4 h at 4 °C while stirring with a magnetic stirrer. The sample tubes were centrifuged at 14,900× g for 30 min. The supernatant was filtered through a 45 μm Millipore syringe filter and centrifuged again [35]. Dye reagent concentrate (Bio-Rad Protein Assay Kit II) was diluted with PBS in a 1 to 4 ratio and filtered through an 11 μm Millipore filter (Whatman No. 1 filter). For protein standard, lyophilized bovine serum albumin (Bio-Rad Protein Assay Kit II) was diluted in PBS. Ten micrograms of standard or sample were placed into the microplate well, and 200 μg of dye reagent was added and incubated for at least 5 min. The absorbance values of the sample and standard were measured in a microplate (Bio Tek Instruments, Inc.) at 595 nm.
Solutions for 15% SDS-PAGE resolution and stocking gels were prepared by a protocol modified [36]. Six grams of SDS buffer and 20 g of extracted protein were mixed and warmed at 100 °C for 5 min. After heating, each sample was loaded onto the SDS gel and electrophoresed at 160 V for 70 min. After electrophoresis, the proteins were detected with Coomassie blue staining.

2.7. Statistical Analysis

All statistical analyses were performed using SPSS Statistics 22 software package (SPSS Inc., IBM Company Headquarters, Chicago, IL, USA). Statistically significant differences in size of pollen grains, thickness of endexine, and pollenkitt among Quercus species were tested by one-way ANOVA, assessed with Duncan’s test (p < 0.05).

3. Results

3.1. Flowering Phenology

Q. mongolica showed the earliest bud burst on Julian day 92 (April 1), whereas Q. acutissima had the latest bud burst on Julian day 103 (April 12). After bud burst, the catkin of Q. mongolica showed the most rapidly blooming catkin on Julian day 104 (phase F, April 13) in flower development. Q. aliena bloomed on Julian day 107 (April 16). Two days later, Q. serrata flowers bloomed on Julian day 109 (April 18), whereas Q. acutissima bloomed on Julian day 111 (April 20). Q. dentata was the latest flowering species, blooming on Julian day 119 (April 28). There was a 15-day time lag between onset of Q. mongolica and Q. dentata flowering phase F. Q. dentata showed relatively slow flowering (Figure 3).
The first observation of Quercus pollen was on Julian day 104 (April 13) and then was continuously observed until Julian day 136 (May 15). The highest dispersal of airborne pollen into the atmosphere was observed on Julian day 113 (April 22), as indicated in Figure 4. The last observation of Quercus flowers was on Julian day 119 (April 28), whereas oak pollen was continuously observed until Julian day 136 (May 15). Airborne pollen was observed about 2 weeks after flowering phase H, the senescence phase.

3.2. Size of Pollen Grains

The polar and equatorial axes were based on the measurements of at least 100 pollen grains, as detailed in Table 1. Various features of pollen grains were estimated by the following morphometric characteristics: pollen shape, polar axis length (PL), equatorial axis length (EL), and polar/equatorial length (PL/EL) ratio. The shapes of the pollen grains were suboblate, with polar axes ranging from 25.4 to 31.7 µm and equatorial axes ranging from 32.3 to 39.1 μm. Pollen of Q. mongolica was bigger than that of other species, with EL and PL of 39.1 µm and 31.7 µm, respectively. The pollen of Q. acutissima was the second largest, with an EL of 38.1 µm and PL of 29.6 µm. The pollen sizes of Q. variabilis, Q. dentata, and Q. aliena were similar, with EL values in the range of 33–34 µm. The size of Q. serrata pollen was smaller than that of other species, with an EL of 32.3 µm and PL of 26.5 µm. The PL length varied from less than 1 to 7 µm, but there were no significant differences between the two species at p < 0.001.
The PL/EL ratio was less than 1 in all species. Q. dentata pollen had a spherical shape, with a PL/EL ratio of 0.846. Q. aliena, Q. mongolica, and Q. serrata had similar PL/EL ratios. Q. acutissima and Q. variabilis showed lower PL/EL ratios than other Quercus species, and these species had oblate pollen grains. The PL/EL ratio of Q. dentata was significantly higher than those of Q. aliena, Q. mongolica, and Q. variabilis at p < 0.001.

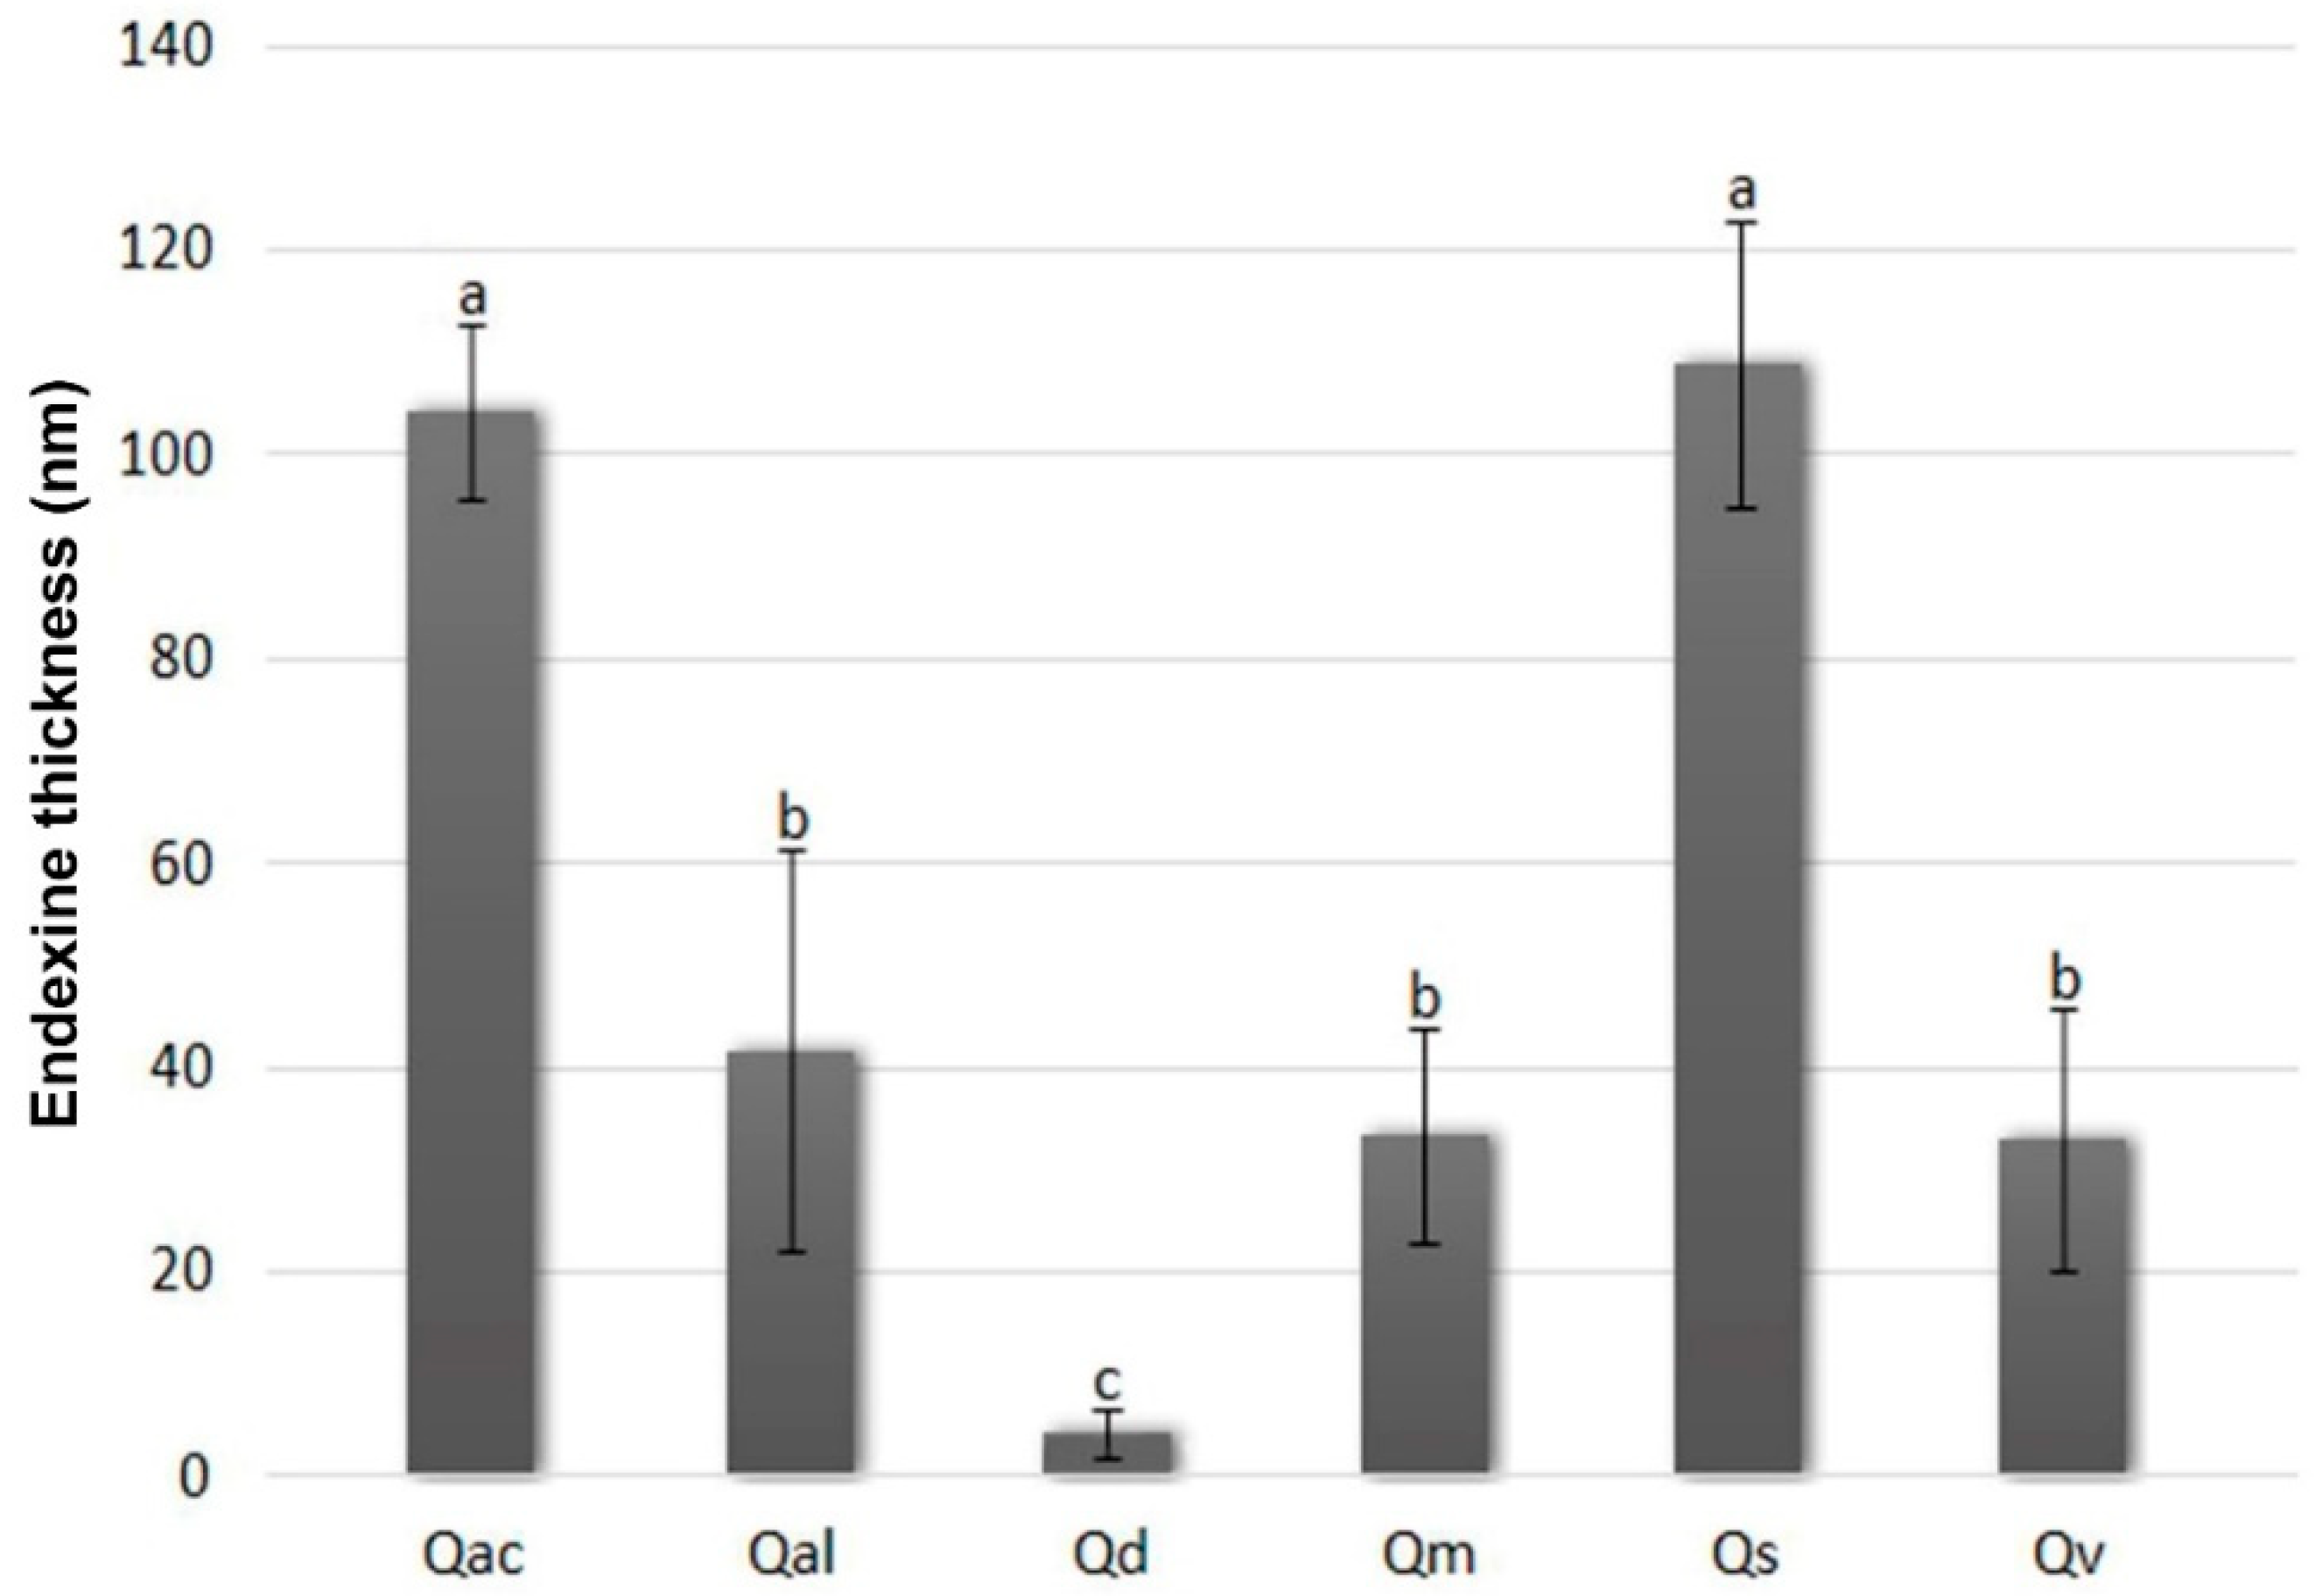
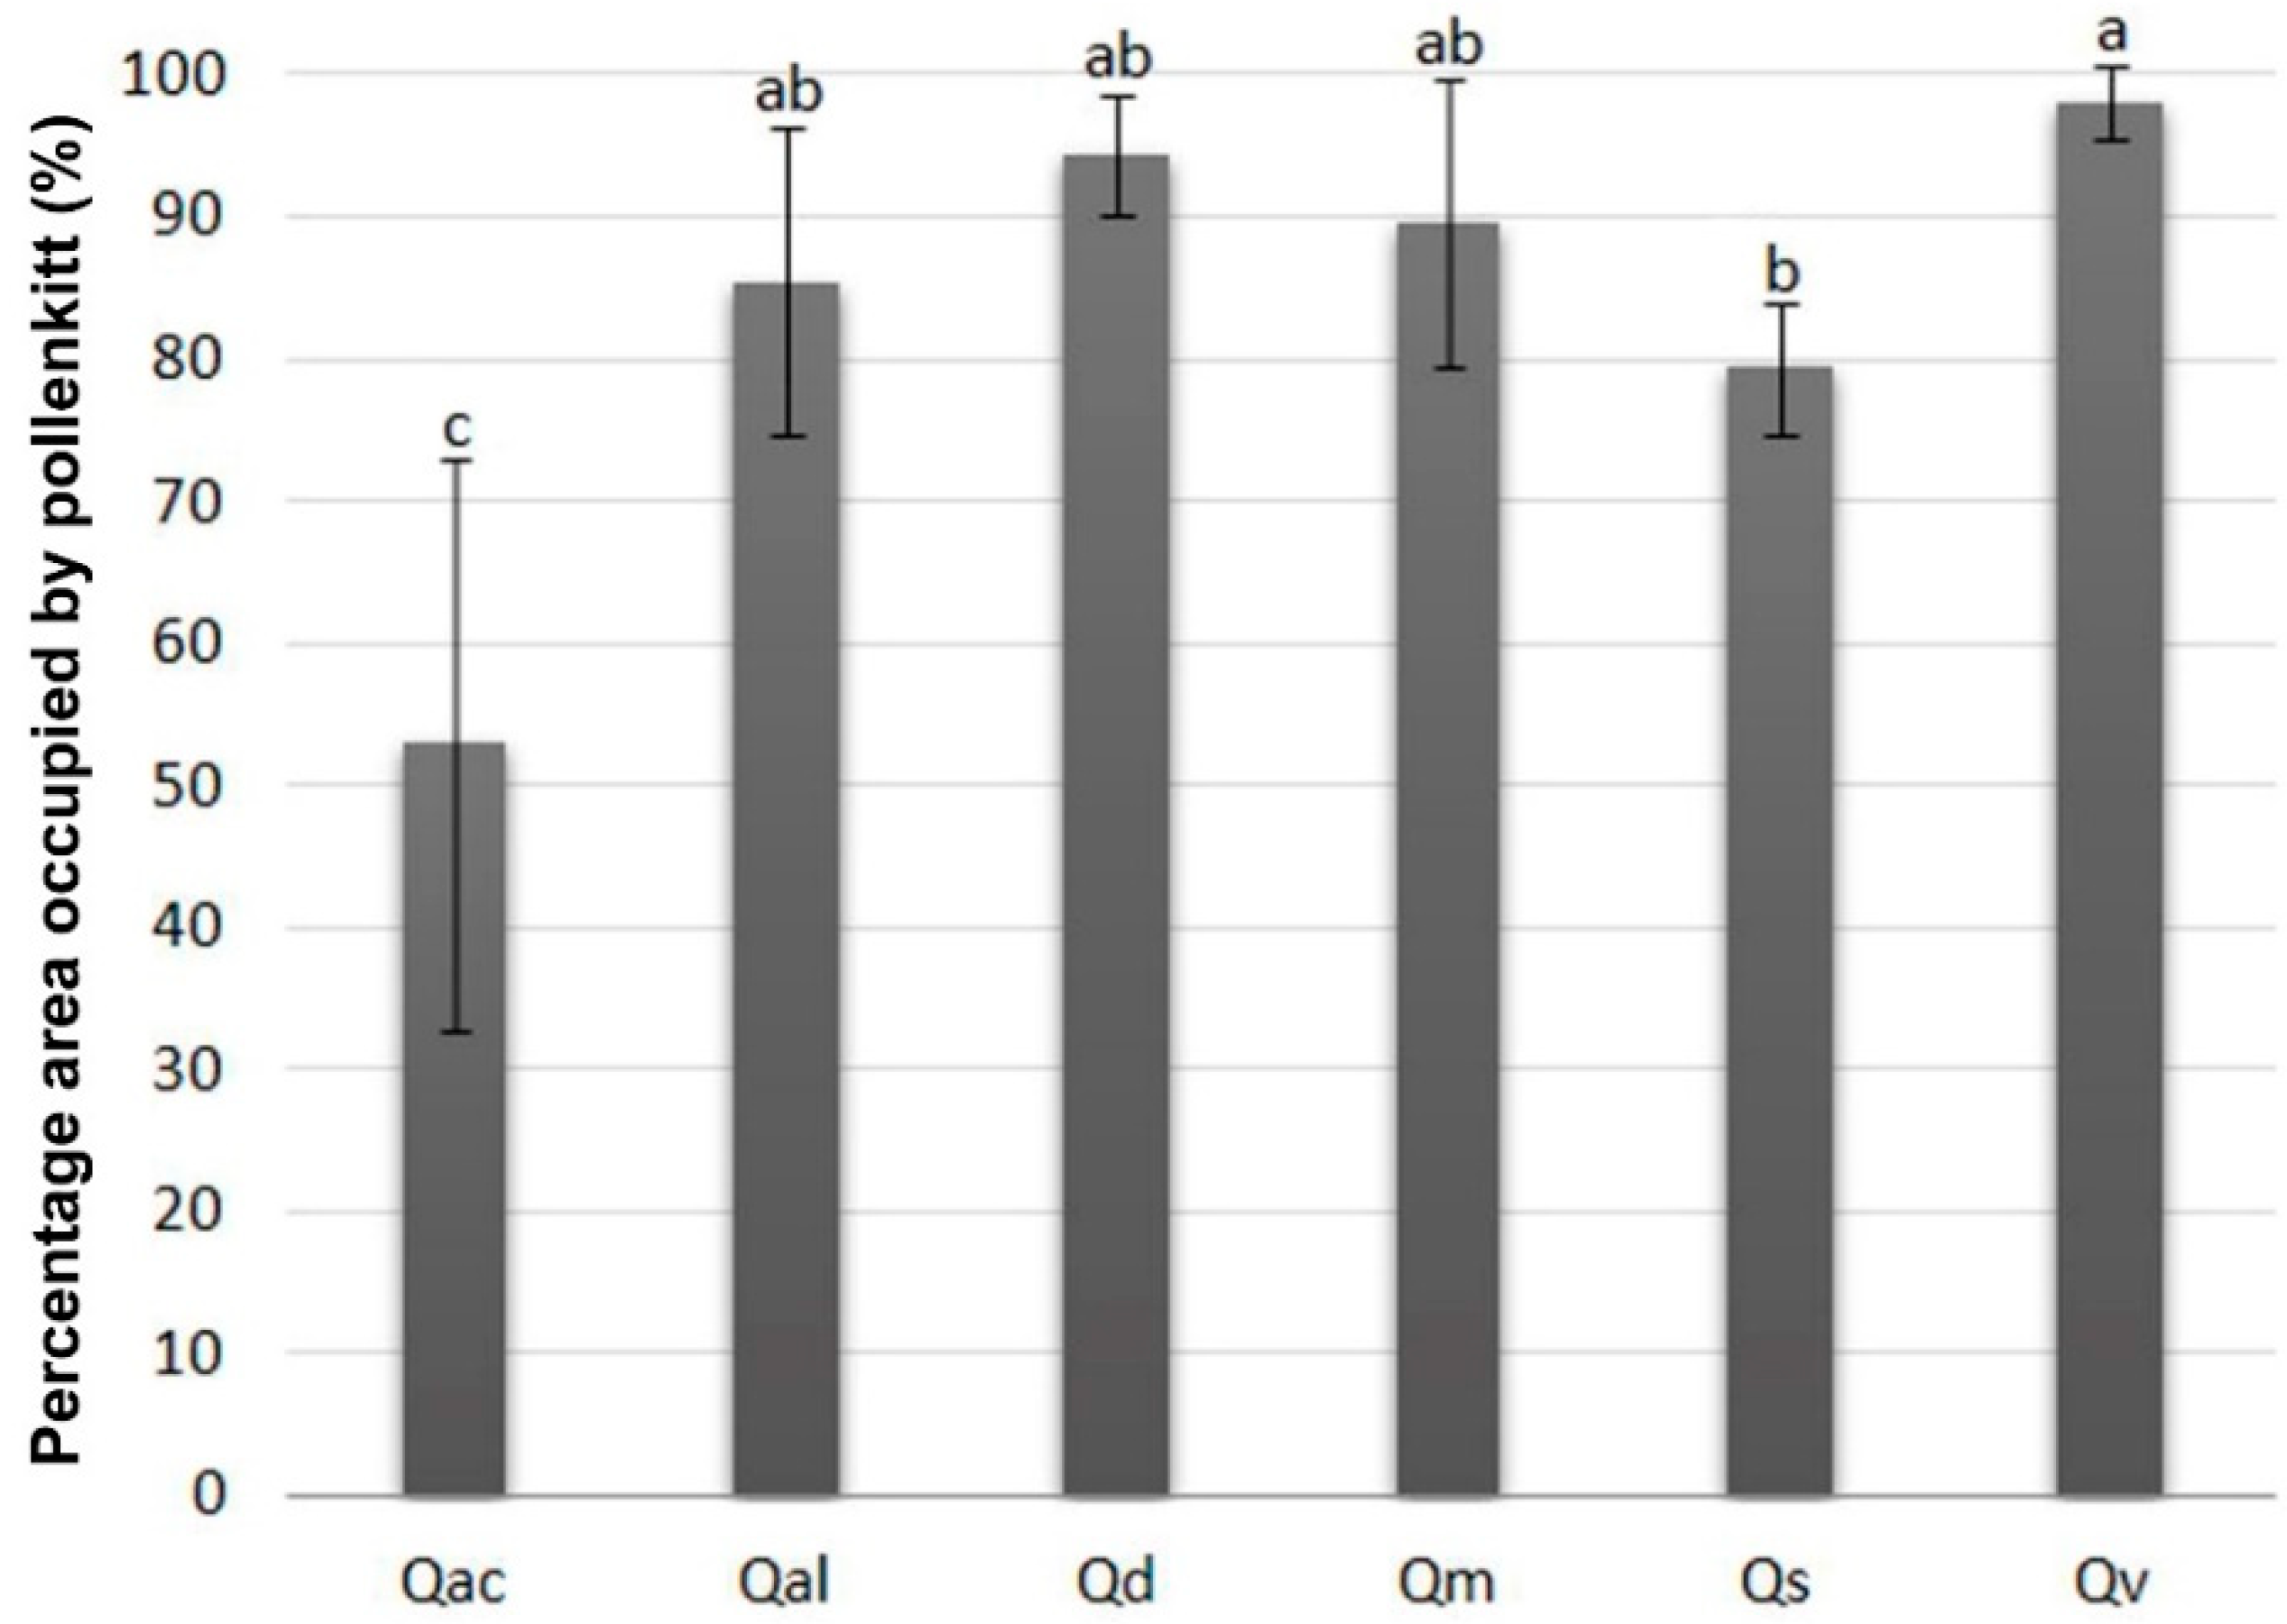
3.3. Specificity of Pollen Endexine Thickness

Q. mongolica, Q. aliena, Q. variabilis, Q. serrata, and Q. acutissima did not show substantial differences in the morphological structure of the pollen exine. Specifically, these species showed exine ultrastructures such as tectum, columellae, and a foot layer. Conversely, the endexine layer of Q. dentata was coarsely laminated or fragmented (Figure 5). There were significant differences in pollen endexine thickness depending on species. Specifically, the endexine thicknesses of Q. acutissima and Q. serrata were 104.27 µm and 108.96 µm, respectively, which were significantly greater than those of Q. aliena, Q. mongolica, and Q. variabilis at 41.68 µm, 33.41 µm, and 33.17 µm, respectively. The lowest value of Q. mongolica was 3.2 times lower than that of Q. serrata (Figure 6).
In the exine layer, the percentage of area occupied by pollenkitt was 98% in Q. variabilis. The percentages of pollenkitt in Q. aliena, Q. dentata, and Q. mongolica were 87%, 88%, and 94%, respectively. Q. variabilis, Q. aliena, Q. dentata, and Q. mongolica showed different areas of occupation, but the differences were not significant. The percentage of pollenkitt for Q. serrata was 79%, whereas that for Q. acutissima was 52% (Figure 7). The area occupied by pollenkitt in Q. variabilis was significantly larger than that of Q. serrata or Q. acutissima (p < 0.05).

3.4. Soluble Protein Contents of Pollen

There was no statistically significant difference in soluble protein content among the Quercus species. Pollen of Q. dentata had a total soluble protein content of 33.51 μg·mL−1 (data not shown), highest among the measured values. Q. mongolica pollen had 32.39 μg·mL−1 of soluble protein, and Q. serrata had 31.75 μg·mL−1. Pollen of Q. aliena and Q. variabilis had 31.16 μg·mL−1 and 30.16 μg·mL−1 total soluble protein, respectively. Q. acutissima pollen had the smallest amount of protein, 29.91 μg·mL−1. In SDS-PAGE, the positions of the protein bands were similar in the six different Quercus species (Figure 8), indicating similar proteins in their pollen. Protein bands with a molecular weight of 17 kDa were found in all Quercus species. However, there was a difference in thickness of the protein bands. Q. variabilis had a stronger 17 kDa band than other species. The 25 kDa protein band of Q. acutissima and Q. variabilis was stronger than that of the four other oak species. Q. acutissima had a different protein band pattern between 25–35 kDa.

4. Discussion

Airborne pollen can be dispersed over hundreds (even thousands) of kilometers from the source, causing significant ecological, evolutionary, and clinical effects [37]. Pollen is the most important factor in effective reproduction on plants, but it is also a major cause of seasonal allergy-related diseases (allergic rhinitis, conjunctivitis, bronchial asthma, etc.) and airborne particulate pollutants affecting public health [38]. For allergic patients, the most effective way to prevent allergic reactions is to reduce time spent outside when a large amount of pollen is in the air [39]. For this reason, there have been many studies to develop pollen calendars that indicate dates of high airborne levels of pollen associated with allergies [40,41,42,43].
According to [44], the male flower starts to emit pollen from flowering phase F. On the basis of this, it can be assumed that the Quercus species that emit pollen at the peak of the pollen season (Julian day 113, April 22) are Q. serrata, Q. aliena, and Q. acutissima. The authors in [45] showed that airborne pollen was observed from the pre-flowering season in Olea europaea, and the greatest airborne concentration occurred at the time of flowering. Furthermore, they reported that weather conditions during the pre-flowering season affected the onset of the flowering. Phenological observations conducted in eastern Romania revealed that the length of the male flowering period was about 4 to 6 days in Quercus spp., from April 20–25 [46]. Airborne pollen was intensively observed from April 19 to May 5 in a 2009–2010 study conducted in Ulsan, Korea [47]. Quercus pollen was present in large amounts for 5 to 6 days in April and May when the florets opened.
Pollen morphology and ultrastructure play a significant role in characterization of the pollen grains. Table 1 shows morphological features of pollen shape, polar axis length (PL), equatorial axis length (EL), and polar/equatorial length (PL/EL) ratio. In a previous study [48], the size of the Quercus pollen was about 39 µm, which was larger than the pollen observed in this study. Conversely, another study reported a measure of about 28 µm [30], which was relatively small compared to the present study. In a study of pollen size of Quercus in Korea, the mean PL value ranged from 25 to 49 µm, and that of EL was 22 to 39 µm, with very large variation in pollen size (Table 1). In a recent study on Quercus pollen emission and transport models, the size of oak pollen was set at 31 µm [49].
Due to the potential distributions of allergenic species with climate change, pollen allergy syndrome will play an important issue for human health in the coming decades [16]. Subdivision of the pollen size of species and further studies will help increase model accuracy. For instance, small and lightweight pollen has the potential for long-distance pollen dispersal, because of aerodynamic behavior such as size, shape, density, and terminal settling velocity, and is a trigger for allergic reactions at a noticeable level [50]. A similar trend has been observed in Zea mays [51], where pollen speed ranged from 21 cm/s for pollen grains of 76–80 µm to 32 cm/s for pollen grains of 103–106 µm. In that study, pollen migration speed of Quercus was slowest (7.87 cm/s) in Q. serrata and fastest (9.47 cm/s) in Q. mongolica under no wind. However, factors other than size and weight that affect the velocity of pollen, such as photoperiod, temperature, and pollen density, were not considered. Because of the different sizes of pollen depending on species, pollen dispersal speed and distance will vary by species.
Furthermore, previous studies in pollen dispersal have suggested that pollen transport depends not only on meteorological variations (even pollutants) but also on biological rhythm [52,53,54]. Despite its lightness, anemochorous pollen is more easily affected by wind than entomophilous pollen. Moreover, the surface of anemochorous pollen grains is relatively smooth compared to that of entomophilous pollen. The pollen grains of wind-pollinated plants have small amounts of pollenkitt in the exine layer, with the amount of pollenkitt affecting the dispersal abilities of the pollen grains [9]. Across previous studies [10,11,12,13], there is clear and consistent evidence that high allergenic pollens have relatively less pollenkitt. The stickiness of pollenkitt results in agglomeration of several pollens into one mass [9,11,12,55]. Pollen with a small amount of pollenkitt is more easily affected by wind than that with a large amount. From this point of view, the pollens of Q. acutissima and Q. serrata can be transported farther than those of Q. variabilis, Q. mongolica, Q. dentata, and Q. aliena (Figure 6 and Figure 7).
Normally, pollen structure is supported by a solid outer wall known as the exine. Once airborne pollens are placed in a lipid-rich stigma or encounter rain, the pollen will absorb the medium and swell [56,57]. Furthermore, the proteins in the outer wall or inside the pollen are extremely water-soluble. Thereby, intracellular proteins are released from the pollen through the aperture. An exceptionally thick intine surrounded beneath the exine becomes swollen and ruptured in contact with water, leading to breakdown of the sporopollenin-filled thin exine. Even if the exine is not destroyed, that of swollen pollen is susceptible to damage [58,59]. The exine usually consists of two layers, the outer ectexine and the inner endexine. Previous studies [10,58] showed that the endexine layer of major allergen pollens was not detectable, indicating that it may be easier for the outer wall to break down and release the allergenic protein.
“Que a 1”, with a molecular weight of 17 kDa (Figure 8), is the only identified protein among oak allergens. Quercus species are estimated to have several other allergenic proteins; however, the characteristics of each allergenic protein have not been studied. The electrophoresis results showed variability in the appearance of protein bands of Quercus spp., indicating differences in pollen proteins depending on species. Furthermore, air pollutant substances such as O3, NO2, and CO can affect tree proteins [60]. The effect of atmospheric environment on pollen protein was different by species. Effects of air pollution on Ostrya carpinifolia, Platanus spp., and Q. robur pollen protein were significant. However, there was no significant effect on the pollen grains of Carpinus betulus and Acer negundo [61,62]. Future studies on the interaction between airborne pollen concentrations and particulate matter on the allergenic potential of pollen proteins are needed. Furthermore, non-uniform spatial conditions such as climatic heterogeneity are strongly linked with pollen production and pollen dispersal patterns, which are known to affect pollen allergenic activity. In particular, oak pollen-related allergic symptoms are concentrated during the dispersal seasons from April to May. Thus, understanding the link between onset and intensity of pollen release and climatic factors is important for public health [63].

5. Conclusions

When the anther starts to dehisce, pollen is released from the male flower. The pollen of Quercus spp. persisted for 32 days in the air, and anther dehiscence occurs in phase F. Airborne pollen was observed about 2 weeks after flowering phase H, the senescence phase. The highest concentration of airborne pollen was from Julian day 111 (April 20) to Julian day 115 (April 24), during which time Q. serrata, Q. aliena, and Q. acutissima emitted large amounts of pollen. The size of Quercus spp. ranged from 32 to 38 µm, with significant differences among species. The pollen shape in all investigated Quercus species was oblate. Dispersal speed and travel distance of pollen were affected by size. The endexines were thicker in Q. acutissima and Q. serrata compared with other Quercus species. Pollen exines, including endexine, played a role in maintaining the structure of the pollen. When the exine was stable, the pollen was be easily disturbed by physical or chemical elements. Notably, intracellular allergy proteins were not easily released. The amount of pollenkitt in the pollen exine was small in Q. acutissima and Q. serrata. Pollen with a small amount of pollenkitt did not clump together and may not adhere well to surfaces such as walls or leaves. Therefore, it can be inferred that pollen with large amounts of pollenkitt will move further than pollen with small amounts of pollenkitt (Figure 9). In electrophoresis of pollen proteins, Q. variabilis had the strongest band in 17 kDa, a supposed major allergen, which belongs to the same group with “Que a 1”, the characterized allergy protein in Q. alba.

Author Contributions

Conceptualization, S.Y.W.; methodology, I.K.; validation, S.Y.W. and M.J.K.; formal analysis, I.K. and J.K.L.; investigation, Y.L., S.P., and H.K.; resources, K.-A.L.; data curation, I.K.; writing—original draft preparation, I.K.; writing—review and editing, M.J.K.; visualization, M.J.K.; supervision, S.Y.W.; project administration, Y.L.; funding acquisition, S.Y.W. All authors have read and agreed to the published version of the manuscript.

Funding

This research was funded by Basic Science Research Program through the National Research Foundation of Korea (NRF), grant number No. 2018R1D1A1A02044683.

Acknowledgments

This research was funded by Basic Science Research Program through the National Research Foundation of Korea (NRF), grant number No. 2018R1D1A1A02044683.

Conflicts of Interest

The authors declare no conflict of interest. The funders had no role in the design of the study; in the collection, analyses, or interpretation of data; in the writing of the manuscript; or in the decision to publish the results.

References

  1. Korea Forest Service. 2019 Statistical Yearbook of Forestry; Korea Forest Service: Daejeon, Korea, 2019; p. 164. [Google Scholar]
  2. Pilar, C.D.; Gabriel, M.M. Phenological pattern of fifteen Mediterranean phanaerophytes from shape Quercus ilex communities of NE-Spain. Plant Ecol. 1998, 139, 103–112. [Google Scholar] [CrossRef]
  3. Boavida, L.C.; Silva, J.P.; Feijó, J.A. Sexual reproduction in the cork oak (Quercus suber L.). II. Crossing intra-and interspecific barriers. Sex. Plant Reprod. 2001, 14, 143–152. [Google Scholar] [CrossRef]
  4. Rocheta, M.; Sobral, R.; Magalhães, J.; Amorim, M.I.; Ribeiro, T.; Pinheiro, M.; Conceição Egas, C.; Leonor Morais-Cecílio, L.; Costa, M.M. Comparative transcriptomic analysis of male and female flowers of monoecious Quercus suber. Front. Plant Sci. 2014, 5, 599. [Google Scholar] [CrossRef] [PubMed] [Green Version]
  5. Lee, D.G. Ecological Management of Forests; Seoul National University Press: Seoul, Korea, 2012; pp. 179–193. [Google Scholar]
  6. Lee, C.S.; Cho, H.J.; Yi, H. Stand dynamics of introduced black locust (Robinia pseudoacacia L.) plantation under different disturbance regimes in Korea. For. Ecol. Manag. 2004, 189, 281–293. [Google Scholar] [CrossRef]
  7. Kim, H.S.; Lee, S.M.; Song, H.K. Actual vegetation distribution status and ecological succession in the Deogyusan National Park. Korean J. Environ. Ecol. 2011, 5, 37–46. [Google Scholar]
  8. Park, H.J.; Lim, H.S.; Park, K.H.; Lee, J.H.; Park, J.W.; Hong, C.S. Changes in allergen sensitization over the last 30 years in Korea respiratory allergic patients: A single-center. Allergy Asthma Immunol. Res. 2014, 6, 434–443. [Google Scholar] [CrossRef]
  9. Edlund, A.F.; Swanson, R.; Preuss, D. Pollen and stigma structure and function: The role of diversity in pollination. Plant Cell 2004, 16, 84–97. [Google Scholar] [CrossRef] [Green Version]
  10. Diethart, B.; Sam, S.; Weber, M. Walls of allergenic pollen: Special reference to the endexine. Grana 2007, 46, 164–175. [Google Scholar] [CrossRef]
  11. Culley, T.M.; Weller, S.G.; Sakai, A.K. The evolution of wind pollination in angiosperms. Trends Ecol. Evol. 2002, 17, 361–369. [Google Scholar] [CrossRef]
  12. Petersen, A.; Dresselhaus, T.; Grobe, K.; Becker, W.M. Proteome analysis of maize pollen for allergy-relevant components. Proteomics 2006, 6, 6317–6325. [Google Scholar] [CrossRef]
  13. Lin, H.; Gomez, I.; Meredith, J.C. Pollenkitt wetting mechanism enables species-specific tunable pollen adhesion. Langmuir 2013, 29, 3012–3023. [Google Scholar] [CrossRef] [PubMed]
  14. Ziska, L.H.; Makra, L.; Harry, S.K.; Bruffaerts, N.; Hendrickx, M.; Coates, F.; Saarto, A.; Thibaudon, M.; Oliver, G.; Damialis, A.; et al. Temperature-related changes in airborne allergenic pollen abundance and seasonality across the northern hemisphere: A retrospective data analysis. Lancet Planet Health 2019, 3, e124–e131. [Google Scholar] [CrossRef] [Green Version]
  15. D’Amato, G.; Cecchi, L.; Bonini, S.; Nunes, C.; Annesi-Maesano, I.; Behrendt, H.; Liccardi, G.; Popov, T.; Van Cauwenberge, P. Allergenic pollen and pollen allergy in Europe. Allergy 2007, 62, 976–990. [Google Scholar] [CrossRef] [PubMed]
  16. Lake, I.R.; Jones, N.R.; Agnew, M.; Goodess, C.M.; Giorgi, F.; Hamaoui-Laguel, L.; Semenov, M.A.; Solomon, F.; Storkey, J.; Vautard, R.; et al. Climate change and future pollen allergy in Europe. Environ. Health Perspect. 2017, 125, 385–391. [Google Scholar] [CrossRef] [PubMed]
  17. Singer, B.D.; Ziska, L.H.; Frenz, D.A.; Gebhard, D.E.; Straka, J.G. Increasing Amb a 1 content in common ragweed (Ambrosia artemisiifolia) pollen as a function of rising atmospheric CO2 concentration. Funct. Plant Biol. 2005, 32, 667–670. [Google Scholar] [CrossRef]
  18. Anenberg, S.C.; Weinberger, K.R.; Roman, H.; Neumann, J.E.; Crimmins, A.; Fann, N.; Martinich, J.; Kinney, P.L. Impacts of oak pollen on allergic asthma in the United States and potential influence of future climate change. GeoHealth 2017, 1, 80–92. [Google Scholar] [CrossRef] [Green Version]
  19. Yoon, M.G.; Kim, M.; Jin, H.J.; Shin, Y.S.; Park, H.S. Identification of immunoglobulin E binding components of two major tree pollens, birch and alder. Allergy Asthma Respir. Dis. 2013, 1, 216–220. [Google Scholar] [CrossRef]
  20. Hong, C.S. Pollen allergy plants in Korea. Allergy Asthma Respir. Dis. 2015, 3, 237–252. [Google Scholar] [CrossRef]
  21. Heath, M.D.; Collis, J.; Batten, T.; Hutchings, J.W.; Swan, N.; Skinner, M.A. Molecular, proteomic and immunological parameters of allergens provide inclusion criteria for new candidates within established grass and tree homologous groups. World Allergy Organ. J. 2015, 8, 1–11. [Google Scholar] [CrossRef] [Green Version]
  22. Hoffmann-Sommergruber, K. Pathogenesis-related (PR)-proteins identified as allergens. Biochem. Soc. Trans. 2002, 30, 930–935. [Google Scholar] [CrossRef] [Green Version]
  23. Park, K.J.; Kim, H.; Kim, K.R.; Oh, J.W.; Lee, S.Y.; Choi, Y.J. Characteristics of regional distribution of pollen concentration in Korean Peninsula. Korean J. Agric. For. Meteorol. 2008, 10, 167–176. [Google Scholar] [CrossRef]
  24. Smouse, P.E.; Dyer, R.J.; Westfall, R.D.; Sork, V.L. Two-generation analysis of pollen flow across a landscape. I. Male gamete heterogeneity among females. Evolution 2001, 55, 260–271. [Google Scholar] [CrossRef] [PubMed]
  25. Garcıa-Mozo, H.; Galán, C.; Aira, M.J.; Belmonte, J.; de la Guardia, C.D.; Fernández, D.; Gutierrez, A.M.; Rodriguez, F.J.; Trigo, M.M.; Dominguez-Vilches, E. Modelling start of oak pollen season in different climatic zones in Spain. Agric. For. Meteorol. 2002, 110, 247–257. [Google Scholar] [CrossRef]
  26. Panahi, P.; Pourmajidian, M.R.; Pourhashemi, M. Pollen morphology of Quercus (subgenus Quercus, section Quercus) in Iran and its systematic implication. Acta Soc. Bot. Pol. 2012, 81, 33–41. [Google Scholar] [CrossRef] [Green Version]
  27. Codina, R.; Lockey, R.F. Pollen used to produce allergen extracts. Ann. Allergy Asthma Immunol. 2017, 118, 148–153. [Google Scholar] [CrossRef] [PubMed]
  28. Solomon, W.R.; Burge, H.R.; Boise, J.R.; Becker, M. Comparative particle recoveries by the retracting rotorod, rotoslide and burkard spore trap sampling in a compact array. Int. J. Biometeorol. 1980, 24, 107–116. [Google Scholar] [CrossRef]
  29. Park, H.J.; Lee, J.H.; Park, K.H.; Kim, K.R.; Han, M.J.; Choe, H.; Oh, J.W.; Hong, C.S. A six-year study on the changes in airborne pollen counts and skin positivity rates in Korea: 2008–2013. Yonsei Med. J. 2016, 57, 714–720. [Google Scholar] [CrossRef] [Green Version]
  30. Wrońska-Pilarek, D.; Danielewicz, W.; Bocianowski, J.; Maliński, T.; Janyszek, M. Comparative pollen morphological analysis and its systematic implications on three European Oak (Quercus L., Fagaceae) species and their spontaneous hybrids. PLoS ONE 2016, 11, e0161762. [Google Scholar] [CrossRef]
  31. Morris, J.K. A formaldehyde glutaraldehyde fixative of high osmolality for use in electron microscopy. J. Cell Biol. 1965, 27, 137–139. [Google Scholar]
  32. Spurr, A.R. A low-viscosity epoxy resin embedding medium for electron microscopy. J. Ultrastruct Res. 1969, 26, 31–43. [Google Scholar] [CrossRef]
  33. de Souza, E.H.; Souza, F.V.D.; Rossi, M.L.; Brancalleão, N.; da Silva-Ledo, C.A.; Martinelli, A.P. Viability, storage and ultrastructure analysis of Aechmea bicolor (Bromeliaceae) pollen grains, an endemic species to the Atlantic forest. Euphytica 2015, 204, 13–28. [Google Scholar] [CrossRef]
  34. Bradford, M.M. A rapid and sensitive method for the quantitation of microgram quantities of protein utilizing the principle of protein-dye binding. Anal. Biochem. 1976, 72, 248–254. [Google Scholar] [CrossRef]
  35. Sousa, R.; Duque, L.; Duarte, A.J.; Gomes, C.R.; Ribeiro, H.; Cruz, A.; da Silva, J.C.G.E.; Abreu, I. In vitro exposure of Acer negundo pollen to atmospheric levels of SO2 and NO2: Effects on allergenicity and germination. Environ. Sci. Technol. 2012, 46, 2406–2412. [Google Scholar] [CrossRef] [PubMed] [Green Version]
  36. Harlow, E.D.; Lane, D. A Laboratory Manual New York: Cold Spring Harbor Laboratory; Cold Spring Harbor Laboratory Press: New York, NY, USA, 1998; p. 579. [Google Scholar]
  37. Bogawski, P.; Borycka, K.; Grewling, Ł.; Kasprzyk, I. Detecting distant sources of airborne pollen for Poland: Integrating back-trajectory and dispersion modelling with a satellite-based phenology. Sci. Total Environ. 2019, 689, 109–125. [Google Scholar] [CrossRef]
  38. McInnes, R.N. Pollen, Allergens, and Human Health. In Oxford Research Encyclopedia of Environmental Science; Oxford University Press: Oxford, UK, 2019; pp. 1–38. [Google Scholar]
  39. Scialla, T.; Wanner, A. Fundamentals of Asthma Treatment. Pulmão RJ 2012, 21, 33–40. [Google Scholar]
  40. Lo, F.; Bitz, C.M.; Battisti, D.S.; Hess, J.J. Pollen calendars and maps of allergenic pollen in North America. Aerobiologia 2019, 35, 613–633. [Google Scholar] [CrossRef] [Green Version]
  41. McInnes, R.N.; Hemming, D.; Burgess, P.; Lyndsay, D.; Osborne, N.J.; Skjøth, C.A.; Thomas, S.; Vardoulakis, S. Mapping allergenic pollen vegetation in UK to study environmental exposure and human health. Sci. Total Environ. 2017, 599, 483–499. [Google Scholar] [CrossRef] [Green Version]
  42. Oh, J.W.; Lee, H.B.; Kang, I.J.; Kim, S.W.; Park, K.S.; Kook, M.H.; Kim, B.S.; Baek, H.S.; Kim, J.H.; Lee, D.J.; et al. The revised edition of Korean calendar for allergenic pollens. Allergy Asthma Immunol. Res. 2012, 4, 5–11. [Google Scholar] [CrossRef] [Green Version]
  43. Camacho, I.C. Airborne pollen in Funchal city, (Madeira Island, Portugal)-first pollinic calendar and allergic risk assessment. Ann. Agric. Environ. Med. 2015, 22, 608–613. [Google Scholar] [CrossRef] [Green Version]
  44. Gómez-Casero, M.T.; Galán, C.; Domínguez-Vilches, E. Flowering phenology of Mediterranean Quercus species in different locations (Córdoba, SW Iberian Peninsula). Acta Bot. Malac. 2007, 32, 127–146. [Google Scholar]
  45. Aguilera, F.; Valenzuela, L.R. Study of the floral phenology of Olea europaea L. in Jaén province (SE Spain) and its relation with pollen emission. Aerobiologia 2009, 25, 217–225. [Google Scholar] [CrossRef]
  46. Chesnoiu, E.N.; Șofletea, N.; Curtu, A.L.; Toader, A.; Radu, R.; Enescu, M. Bud burst and flowering phenology in a mixed oak forest from Eastern Romania. Ann. For. Res. 2009, 52, 199–206. [Google Scholar]
  47. Choi, S.H.; Jung, I.Y.; Kim, D.Y.; Kim, Y.H.; Lee, J.H.; Oh, I.B.; Choi, K.R. Seasonal distribution of airborne pollen in Ulsan, Korea in 2009–2010. Korean J. Environ. Ecol. 2011, 34, 371–379. [Google Scholar] [CrossRef] [Green Version]
  48. Moon, H.K.; Kong, M.J.; Song, J.H.; Kim, S.Y.; Kim, J.S.; Jung, E.H.; Park, C.H.; Lee, B.Y.; Hong, S.P. Morphological characteristics of major airborne pollen in Korea peninsula. J. Species Res. 2015, 4, 159–168. [Google Scholar] [CrossRef] [Green Version]
  49. Lim, Y.K.; Kim, K.R.; Cho, C.; Kim, M.; Choi, H.S.; Han, M.J.; Oh, I.B.; Kim, B.J. Development of a Oak Pollen Emission and Transport Modeling Framework in Korea. Atmosphere 2015, 25, 221–233. [Google Scholar] [CrossRef] [Green Version]
  50. Celenk, S. Detection of reactive allergens in long-distance transported pollen grains: Evidence from Ambrosia. Atmos. Environ. 2019, 209, 212–219. [Google Scholar] [CrossRef]
  51. Aylor, D.E. Settling speed of corn (Zea mays) pollen. J. Aerosol. Sci. 2002, 33, 1601–1607. [Google Scholar] [CrossRef]
  52. Tseng, Y.T.; Kawashima, S.; Kobayashi, S.; Takeuchi, S.; Nakamura, K. Forecasting the seasonal pollen index by using a hidden Markov model combining meteorological and biological factors. Sci. Total Environ. 2020, 698, 134246. [Google Scholar] [CrossRef]
  53. Tseng, Y.T.; Kawashima, S. Applying a pollen forecast algorithm to the Swiss Alps clarifies the influence of topography on spatial representativeness of airborne pollen data. Atmos. Environ. 2019, 212, 153–162. [Google Scholar] [CrossRef]
  54. Williams, C.G. How meso-scale pollen dispersal and its gene flow shape gene conservation decisions. New For. 2017, 48, 217–224. [Google Scholar] [CrossRef]
  55. Oteros, J.; Bartusel, E.; Alessandrini, F.; Núñez, A.; Moreno, D.A.; Behrendt, H.; Schmidt-Weber, C.; Traidl-Hoffmann, C.; Buters, J. Artemisia pollen is the main vector for airborne endotoxin. J. Allergy Clin. Immunol. 2019, 143, 369–377. [Google Scholar] [CrossRef] [PubMed] [Green Version]
  56. Traidl-Hoffmann, C.; Kasche, A.; Menzel, A.; Jakob, T.; Thiel, M.; Ring, J.; Behrendt, H. Impact of pollen on human health: More than allergen carriers? Int. Arch. Allergy Immunol. 2003, 131, 1–13. [Google Scholar] [CrossRef] [PubMed]
  57. Wang, Q.; Nakamura, S.; Lu, S.; Xiu, G.; Nakajima, D.; Suzuki, M.; Sakamoto, K.; Miwa, M. Release behavior of small sized daughter allergens from Cryptomeria japonica pollen grains during urban rainfall event. Aerobiologia 2012, 28, 71–81. [Google Scholar] [CrossRef]
  58. Dahl, Å. Pollen lipids can play a role in allergic airway inflammation. Front. Immunol. 2018, 9, 2816. [Google Scholar] [CrossRef]
  59. Visez, N.; Chassard, G.; Azarkan, N.; Naas, O.; Sénéchal, H.; Sutra, J.P.; Poncet, P.; Choël, M. Wind-induced mechanical rupture of birch pollen: Potential implications for allergen dispersal. J. Aerosol. Sci. 2015, 89, 77–84. [Google Scholar] [CrossRef]
  60. Silva, M.; Ribeiro, H.; Abreu, I.; Cruz, A.; da Silva, J.E. Effects of CO2 on Acer negundo pollen fertility, protein content, allergenic properties, and carbohydrates. Environ. Sci. Pollut. Res. 2015, 22, 6904–6911. [Google Scholar] [CrossRef]
  61. Ribeiro, H.; Duque, L.; Sousa, R.; Abreu, I. Ozone effects on soluble protein content of Acer negundo, Quercus robur and Platanus spp. pollen. Aerobiologia 2013, 29, 443–447. [Google Scholar] [CrossRef]
  62. Cuinica, L.G.; Abreu, I.; da Silva, J.C.E. In vitro exposure of Ostrya carpinifolia and Carpinus betulus pollen to atmospheric levels of CO, O3, and SO2. Environ. Sci. Pollut. Res. 2014, 21, 2256–2262. [Google Scholar] [CrossRef]
  63. Toro, R.; Córdova, A.; Canales, M.; Mardones, P. Trends and threshold exceedances analysis of airborne pollen concentrations in Metropolitan Santiago Chile. PLoS ONE 2015, 10, e0123077. [Google Scholar] [CrossRef]
Figure 1. Location of the experimental site (Baebongsan Neighborhood Park and Suwon) and land use of surrounded areas. Baebongsan Neighborhood Park is located in northeast Seoul, Korea, and is surrounded by a residential district.
Forests 11 00232 g001
Figure 2. Schematic illustration of nine phenological stages from male flowers of Quercus (Fagaceae) in Korea. (A) Winter bud; (B) bud burst; (C) catkin development; (D) catkin elongation; (E) maturation of catkin; (F) start of flowering; (G) full flowering; (H) senescence; (I) catkin fall.
Forests 11 00232 g002
Figure 3. Lengths of flowering stages in oak species (Quercus acutissima; Quercus aliena; Quercus dentata; Quercus mongolica; Quercus serrata). Abbreviations: (C) catkin development; (D) catkin elongation; (E) maturation of catkin; (F) start of flowering; (G) full flowering; (H) senescence; (I) catkin fall.
Forests 11 00232 g003
Figure 4. Daily emission of Quercus pollen in the spring. The x-axis represents the Julian day, and the y-axis represents the number of pollen grains collected during the day in the Burkard trap.
Forests 11 00232 g004
Figure 5. Structure of Quercus pollen walls under TEM. (A) Q. dentata, (B) Q. mongolica, (C) Q. aliena, (D) Q. variabilis, (E) Q. serrata, (F) Q. acutissima. Abbreviations: c, collumella; e, endexine; i, intine; p, pollenkitt; t, tectum. Scale bars represent 200 nm.
Forests 11 00232 g005
Figure 6. Endexine thickness of oak pollen grains. Abbreviations: Qac, Q. acutissima; Qal, Q. aliena; Qd, Q. dentata; Qm, Q. mongolica; Qs, Q. serrata; Qv, Q. variabilis. Different letters above bars along the x-axis denote statistically significant differences among Quercus species at p < 0.05.
Forests 11 00232 g006
Figure 7. Percentage of occupied area by pollenkitt, the pollen coat covering the outer layer of pollen grains. Abbreviations: Qac, Q. acutissima; Qal, Q. aliena; Qd, Q. dentata; Qm, Q. mongolica; Qs, Q. serrata; Qv, Q. variabilis. Different letters above bars along the x-axis denote statistically significant differences among Quercus species at p < 0.05.
Forests 11 00232 g007
Figure 8. Coomassie blue-stained SDS-PAGE containing protein extracts in Quercus pollen. Abbreviations: M, marker; Qd, Q. dentata; Qm, Q. mongolica; Qal, Q. aliena; Qv, Q. variabilis; Qs, Q. serrata; Qac, Q. acutissima.
Forests 11 00232 g008
Figure 9. Effects of flowering phenology and pollen characteristics on Quercus pollen allergy.
Forests 11 00232 g009
Table 1. Shape and size of Quercus pollen grains.
SpeciesDiameter of Pollen Grain (μm)PL/EL RatioShape
EL (μm)PL (μm)
Q. acutissima38.12 ± 2.03 a29.63 ± 1.64 b0.78 cSuboblate
Q. aliena34.37 ± 2.94 b28.21 ± 1.76 c0.83 bSuboblate
Q. dentata34.33 ± 2.14 b29.01 ± 1.92 b0.85 aSuboblate
Q. mongolica39.06 ± 2.35 a31.72 ± 1.77 a0.81 bSuboblate
Q. serrata32.32 ± 1.61 c26.47 ± 1.11 d0.82 bSuboblate
Q. variabilis33.40 ± 1.94 b25.42 ± 1.83 e0.76 cSuboblate
Data are presented as the mean ± standard deviation (n = 100). For each of the traits for pollen grain size, different superscripts within columns indicate significant differences among species according to Duncan’s test (p < 0.05). Abbreviations: EL, equatorial axis length; PL, polar axis length; PL/EL ratio, polar/equatorial length ratio.

