Article

Soil Available Phosphorus Loss Caused by Periodical Understory Management Reduce Understory Plant Diversity in a Northern Subtropical Pinus massoniana Plantation Chronosequence

1
College of Horticulture and Forestry Sciences/Hubei Engineering Technology Research Center for Forestry Information, Huazhong Agricultural University, Wuhan 430070, China
2
ECNU-Alberta Joint Lab for Biodiversity Study, Tiantong Forest Ecosystem National Observation and Research Station, School of Ecology and Environmental Sciences, East China Normal University, Shanghai 200241, China
*
Authors to whom correspondence should be addressed.
Forests 2020, 11(2), 231; https://doi.org/10.3390/f11020231
Submission received: 10 December 2019 / Revised: 2 February 2020 / Accepted: 13 February 2020 / Published: 19 February 2020

Abstract

:
Clearing of understory plants is a common management method in plantation forests, but its long-term impact on soil properties and understory plant diversity is still poorly understood. In order to uncover the potential relationship between understory diversity and soil properties, we categorized understory plants into herbs and shrubs, and took soil depth into consideration. We measured the soil variables and investigated the understory plant diversity in four stand age-classes (9-year-old for young, 18-year-old for intermediate, 28-year-old for near-mature, and 48-year-old for mature) in a Pinus massoniana plantation. We aimed to examine how the diversity of herbs and shrubs changed with stand succession and to determine which of the three soil depths (0–10 cm, 10–20 cm, 20–40 cm) had the strongest explanation for the understory plant diversity. Furthermore, structural equation modeling (SEM) was performed to assess the direct and indirect effect of understory clearing and stand age on understory diversity. We found that understory clearing influenced the trend of diversity of herbs and shrubs with stand age, and understory diversity showed a strong correlation with soil physical properties in all three soil layers. The soil properties in the 10–20 cm soil layer related with the diversity of herbs and shrubs most, while the 20–40 cm soil layer properties related with them the least. Understory clearing reduced soil available phosphorus (AP). Understory clearing and stand age were found to benefit understory plant diversity directly and decreased the understory diversity indirectly via AP. Consequently, to improve our understanding of the impact of understory clearing and stand age on biodiversity, we should take into account its direct and indirect effects.

1. Introduction

Plantation forests are one of the main types of forests in China, and they have been expanding rapidly in recent decades [1]. The plantation forest area is expected to triple worldwide by the end of the century [2]. The expansion of plantation forests has been recognized to benefit biodiversity conservation [2,3], and the ecosystem services of plantation forests may function better if the forest is managed properly [4,5]. As plantation forests are typically composed of one tree species, the plant diversity of these forests mainly consists of understory plants [6]. These understory plants are important for water and soil conservation [7], energy flow, and material cycling [6,8,9]. Therefore, there is a need to understand the potential factors that could affect the understory plant diversity in the plantation forest ecosystem.
Soil provides nutrients, water, and space for plants, and therefore plays a key role in the forest ecosystem [10]. Soil properties are influenced by plants, and soil properties in turn affect the growth and composition of plants. For example, different plants have various demands for soil nutrients, plants then produce different litter, and finally the litter decomposes and changes the soil chemical content [11]. Human activities, climate, parent material, and topographic factors can influence the vertical and horizontal spatial heterogeneity of soil [12,13]. The vegetation cover and forest vertical structure have also been found to affect the physical properties of soil [14]. In turn, the heterogeneity of soil properties can influence plant composition [15,16]. In addition, recent studies found that N deposition [17,18] and P limitation [19,20] were vital factors for plant diversity in some areas. However, studies investigating the relationship between understory plant diversity and soil nutrients in plantation forests have been limited, and the studies on relations between different soil depths and diversity are even more rare [21].
Most plantations are mono-cultures and poor in diversity at the beginning of the succession. The impact of ecosystem succession on plant diversity is an open question in the literature, but many Chinese studies in plantations have shown that the change of understory diversity in plantation forest along stand age follows a unimodal pattern to some time scale [22,23,24]. The age of plantation can affect the understory plants in multiple ways, such as understory available light, soil properties, and litter. Therefore, it is difficult to predict understory vegetation diversity based on the chronosequence.
Management has massive impacts on plantation forests through multiple dimensions. Thinning and understory clearing are two common management methods in plantations. The former is often used to control the fuel load, promote the quality of the trees planted [25,26], and acquire additional timber, while the latter is usually used to reduce fire risk and to reduce the resource competition [27]. Stand density can strongly influence the understory vegetation [28], and many studies have found that understory diversity usually decreases with stand density at a certain scale [29,30]. Periodical understory clearing is a common anthropogenic disturbance for plantation forests worldwide [31,32], but its impacts on understory diversity are still controversial. On one hand, understory clearing may have a negative impact on biodiversity in the short term because it causes a significant amount of damage and death to plants and may lead to species loss in the end [33,34]. On the other hand, understory clearing can be considered a disturbance that creates heterogeneity at the landscape scale and provides openings for nearby species or underrepresented species [27,34]. Moreover, long-term understory clearing may lead to P loss [35], which would produce unpredictable impacts on understory diversity. Consequently, the effects of understory management on biodiversity are still poorly understood.
Diversity and composition of understory plants in plantation forests have been widely studied [36,37]. However, most of these studies focused on the whole community of understory plants instead of dividing them into a herb layer and a shrub layer. Considering the distinction of the root systems between herb species and shrub species, we hypothesized that there is a soil depth section that could maximally explain the diversity of herbs and shrubs. Soil properties from this layer might have stronger relation with understory plant diversity. In order to test the hypothesis, we measured soil physicochemical properties in three soil layers (0–10 cm, 10–20 cm, and 20–40 cm) to uncover whether understory herb diversity and shrub diversity depended on different soil depths. We also studied the relation between forestry factors and understory plant diversity. Consequently, we specifically proposed the following three hypotheses: (1) understory plant diversity will increase with stand age in plots in which vegetation is not removed but will not increase in plots in which vegetation is cleared; (2) soil properties in different depth have different relation with understory diversity, while herb diversity is more related to 0–10 cm soil depth while shrub is more related to 10–20 cm soil depth according to our observations of their root length; and (3) understory clearing will influence the understory plant diversity indirectly via changing the soil P or N content. We will then further explore the potential mechanism underlying the impact of understory clearing on understory plant diversity. In order to test our hypotheses and answer these questions, we chose Pinus massoniana plantations as our research objective. P. massoniana, having good timber quality and strong sun tolerance [38], is a good pioneer afforestation species and is the most widely planted afforestation tree species in southern China, therefore studying the understory plant diversity in P. massoniana plantation is of important significance.

2. Materials and Methods
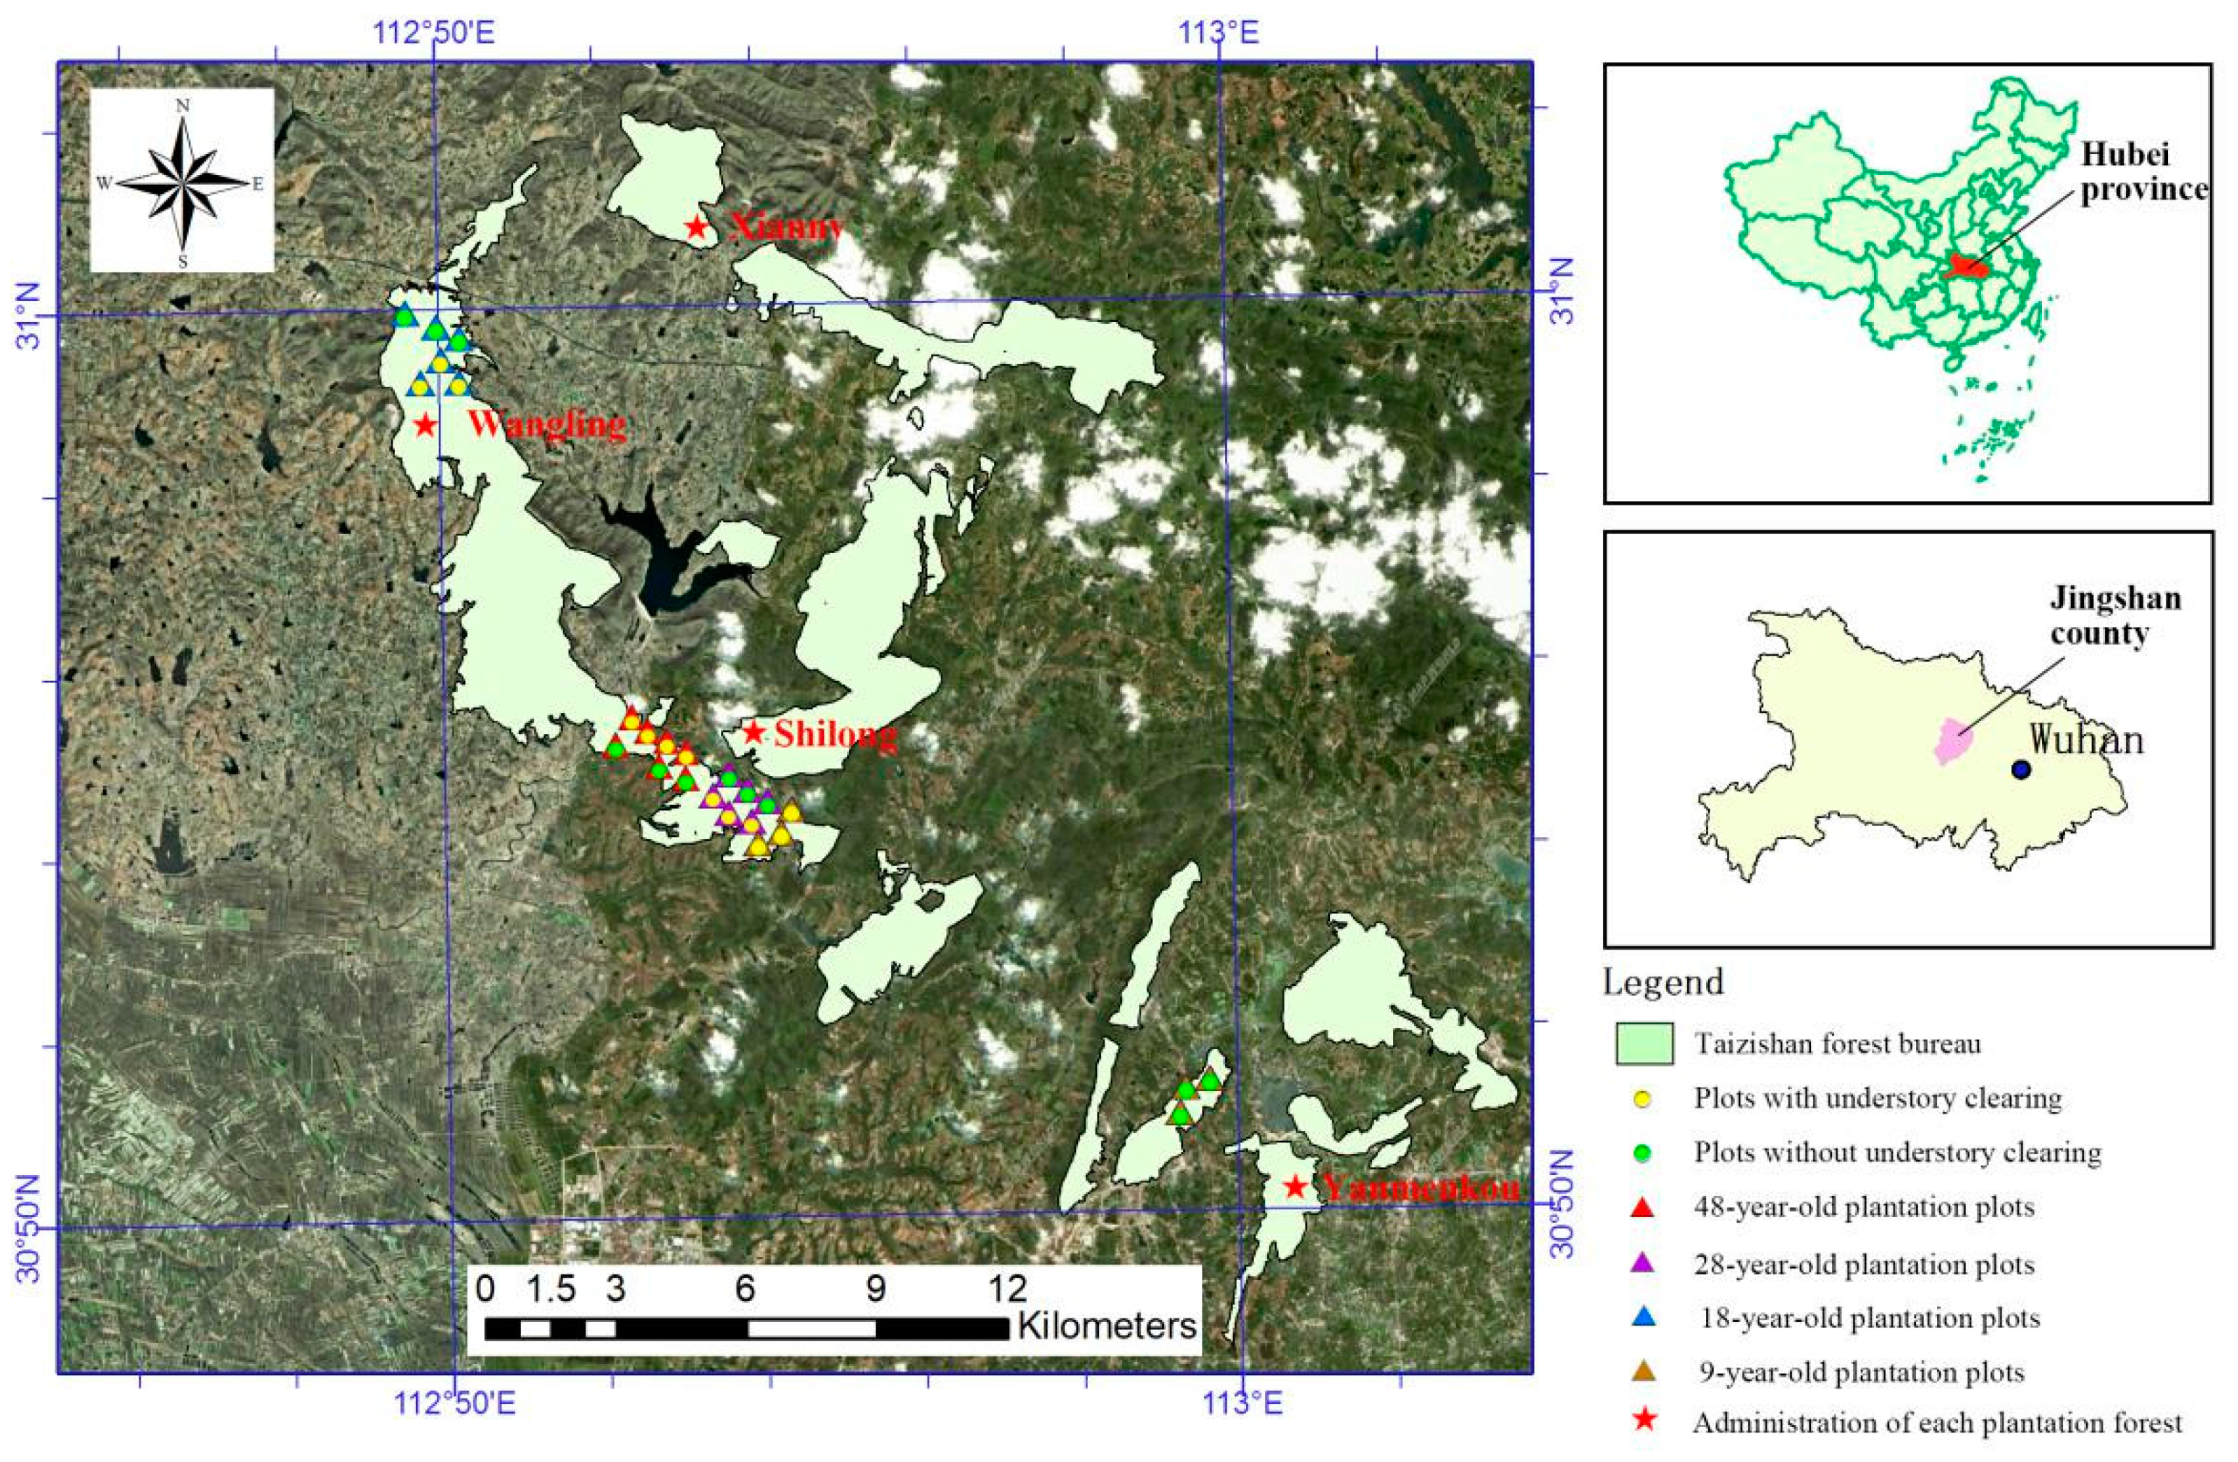
2.1. Study Site

The study was conducted in the Taizishan forest bureau (112°48′45″–113°03′45″ E, 30°48′30″–31°02′30″ N). It’s located in Jingshan county, Hubei province, central China. There are four plantations in this area: Shilong, Wangling, Xiannv, and Yanmenkou forest farms. These plantations are discontinuously distributed in this area (Figure 1). Taizishan is in a subtropical monsoon humid climate zone. The summer and autumn represent the rainy season, and there is drought in the winter and spring seasons. The annual average temperature is 16.4 °C, and January is the coldest month with an average temperature of 2.6 °C. The extreme minimum temperature on record is −19.6 °C. The frost-free period spans 240 days. July is the hottest month, with an average temperature of 28.8 °C, and the extreme maximum temperature on record is 39.2 °C. The annual average rainfall in this area is 1094.6 mm. Soil in this region is mainly yellow/brown soil with a typical soil depth of 40–60 cm.
The forest bureau was established in 1957, and timber production was the main objective until more than a decade ago. The most important management of the bureau is thinning and understory clearing. The staff in the bureau cut the pines selectively, based on the principal of “cut the big trees and retain the small trees.” The first thinning is usually conducted at the stand age of 10 to 15 years, depending on the growth status of the trees. After that, the plantation will experience thinning at approximately 10-year intervals, until mature (about 50-year-old for P. massoniana). Thus, the stand density decreased over time. Thinning is a primary management, which is applied to all of the pine plantation. Unlike thinning, understory clearing is only used at some sites to reduce fire risk and to improve the driving visibility on both sides of the logging roads. It’s conducted by a kind of machine which could cut the above-ground part of the understory plants, mostly conducted every 5 years. At the earlier stage the clearing job was conducted by choppers and sickles, which had similar effect on understory plants. All of our plots with understory clearing management were cleared 2–3 years prior to sampling in 2017.

2.2. Plot Settings and Investigation

We conducted the field investigation and soil sampling in 2017. In order to study the plantation understory vegetation dynamics over time, we chose four stand ages (9-, 18-, 28-, and 48-year-old) to present four age classes of P. massoniana plantations (young forest, intermediate forest, near-mature forest and mature forest). We set six plots (30 m × 30 m) in each age class, with three in forests with understory clearing and three in forests with no understory clearing. Exceptionally, we used four plots for the 48-year-old class forest with understory clearing. Therefore, there were 25 plots in total. The information of stand characteristics of each age class is presented in Table 1.
Due to the fragment of the whole area, and the irregular distribution of the P. massoniana, we couldn’t make randomized replicates in our study. Still, we tried our best to minimize the topographical distinction of our plots when choosing the plots.
The understory plants were categorized into shrubs and herbs during the field investigation. According to the work of ForestBIOTA [39] and the actual condition of our study area, we made our definition of shrubs and herbs. Shrubs were defined as any species with a woody stem, typically taller than 0.5 m. Herbs were defined as any species with herbaceous stems, and they are often shorter than 0.5 m. Rosa laevigata Michx was the only liana in our plot, and was classified as a shrub due to its long and woody stem.

2.3. Soil Collection and Measurement

In each plot, three sites were randomly selected for collecting soil samples in April 2017, and each soil sampling included three soil layers (0–10 cm, 10–20 cm and 20–40 cm). The litter and humus layers were removed before the soil sampling. For each soil layer, approximately 500 g of soil was collected for chemical properties. A soil core with a diameter of 8 cm was taken from each layer to determine physical properties at each site. All trees in the plots were counted and measured. DBH and height were measured for all of the trees with DBH greater than 2 cm. In August 2017, the understory vegetation was investigated. We set five quadrats (5 m × 5 m) in each plot—located near the four corners and the center—to investigate the understory plants and to measure light transmittance. Light transmittance was measured and calculated by the HemiView (Delta-T devices Ltd., Cambridge, UK) system.
The chemical properties of the soil, including organic matter (OM), total nitrogen (TN), available nitrogen (AN), total phosphorus (TP), available phosphorus (AP), and pH were tested in lab. The physical properties, including maximum moisture capacity (MaxMC), minimum moisture capacity (MinMC), capillary water capacity (CWC), capillary pore (CP), non-capillary pore (NCP), total porosity (TPo), and soil density (SD) were tested via the wreath knife method, according to the Chinese national forestry standard LY-1215-1999.

2.4. Statistical Analyses

The diversity of understory herbs and shrubs was estimated using the Hill number (Shannon), richness and evenness (Shannon), which are widely used indices that are able to describe the alpha diversity. We used Analysis of Variance (ANOVA) to test the distinction of diversity indices between different age classes and understory treatments, and Pearson correlation to test their relationship between diversity indices and soil properties. Because the soil variables were too many and some of them were correlated, we extracted the principal components of the soil factors in each layer to perform regression. The principal components of soil factors were used as predictor variables and the Hill number (Shannon) was used as response. Principal component extraction was performed by the “psych” package. Structural equation modelling (SEM) was used to explore the potential mechanism. All of the rare data were standardized before analysis. The stand age and understory clearing were used as independent variables, and the Hill number (Shannon) of shrubs and herbs were used as dependent variables. The SEM were fitted and analyzed using the “sem” function in the “lavaan” package [40]. The comparative fit index (CFI) and Tucker–Lewis index (TLI) were used to examine the adequacy of our SEM model. The CFI and TLI are less affected by the sample size, ranging from 0 to 1. The model will be considered as a acceptable model if the value >0.9. All analyses were conducted with the R statistical software, version 3.4.0 [41].

3. Results

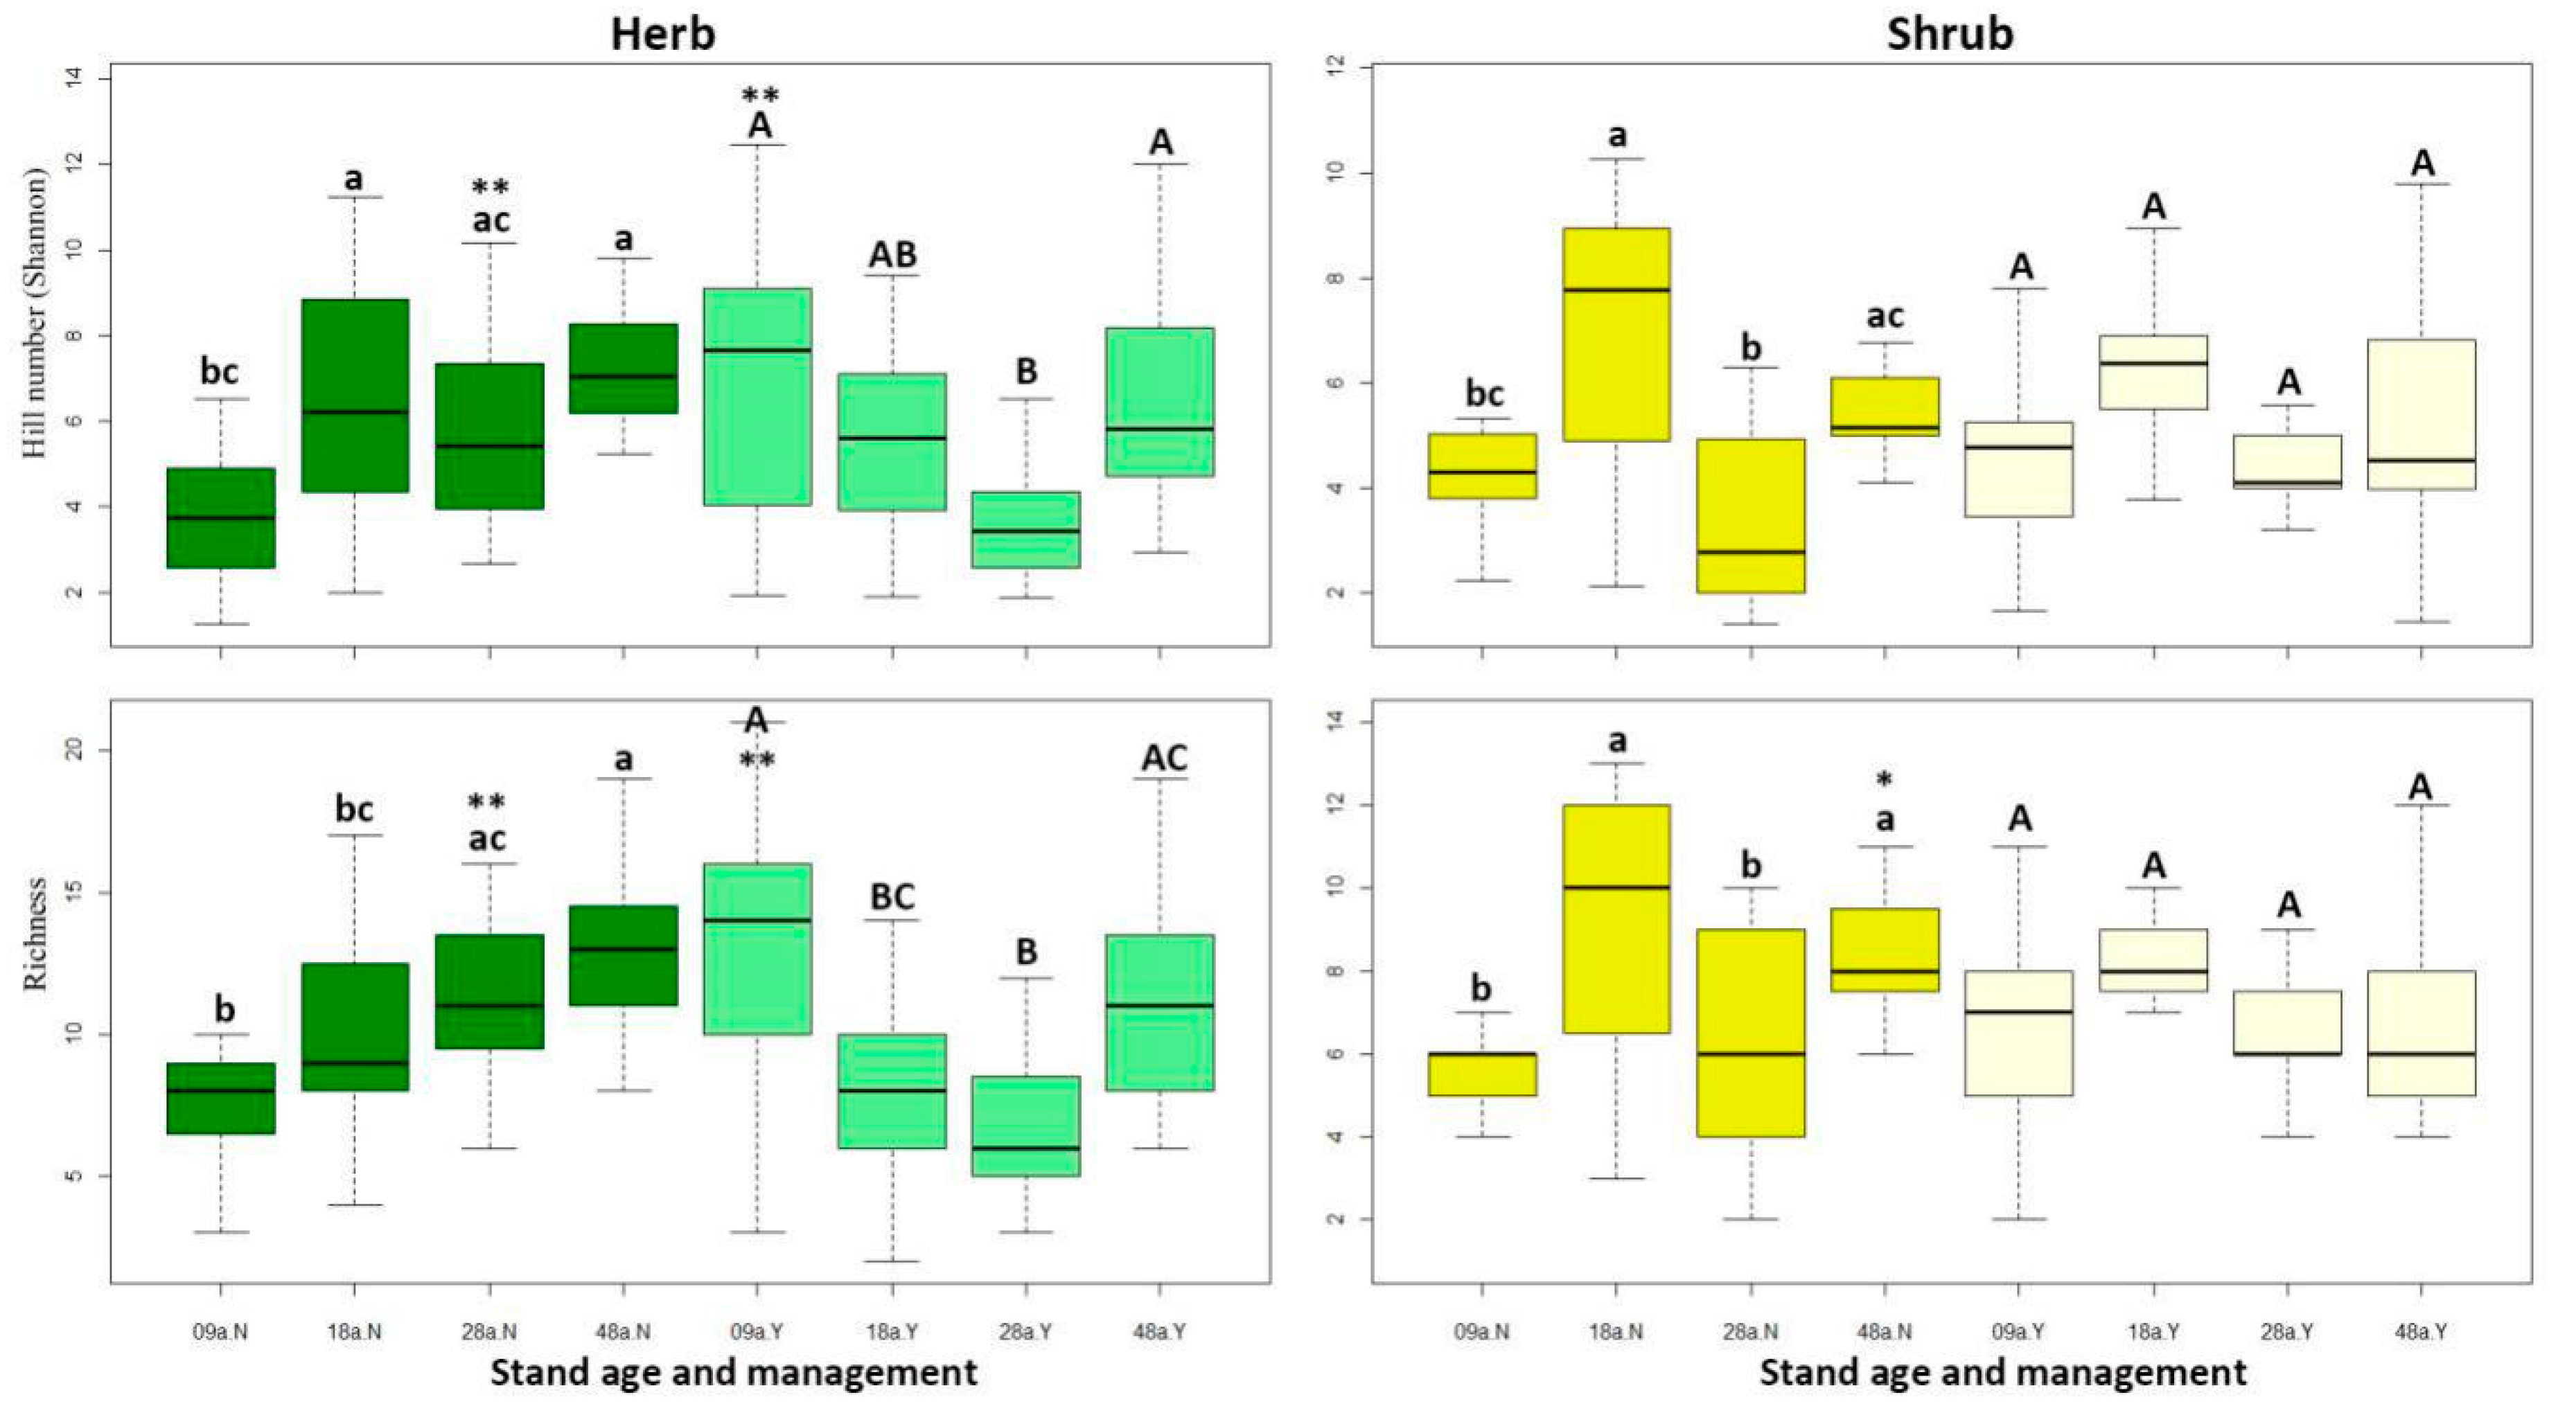
3.1. Influence of Stand Age and Understory Clearing on Understory Diversity

A total of 144 understory species were recorded across the 25 plots, which included 81 herb species and 63 shrub species. We measured the diversity by the indices of Hill number (Shannon) and richness (number of species). The diversity indices of herb and shrub were calculated and are presented in Figure 2. For herbs in the no clearing group, the medians showed that the herbs in the 48-year-old mature plantation plots exhibited the highest diversity while the herbs in the 9-year-old young plantation plots had the lowest diversity. Among understory clearing groups, the young stand age plots had the highest diversity and 28-year-old plots had the lowest diversity. For shrubs in plots with no understory clearing, the 18-year-old plots had the highest diversity and the 9-year-old had the lowest diversity in their medians. In plots with understory clearing, there were no significant differences in shrub diversity between the all four age classes.
The two-way ANOVA showed that stand age had a marked influence on the diversity of shrubs and herbs, but understory management had no significant influence on either shrubs or herbs (Table 2). However, the interaction of understory management and stand age showed significant impacts on the diversity of herbs (p < 0.01), and almost significant impacts on the diversity of shrubs (p < 0.1).

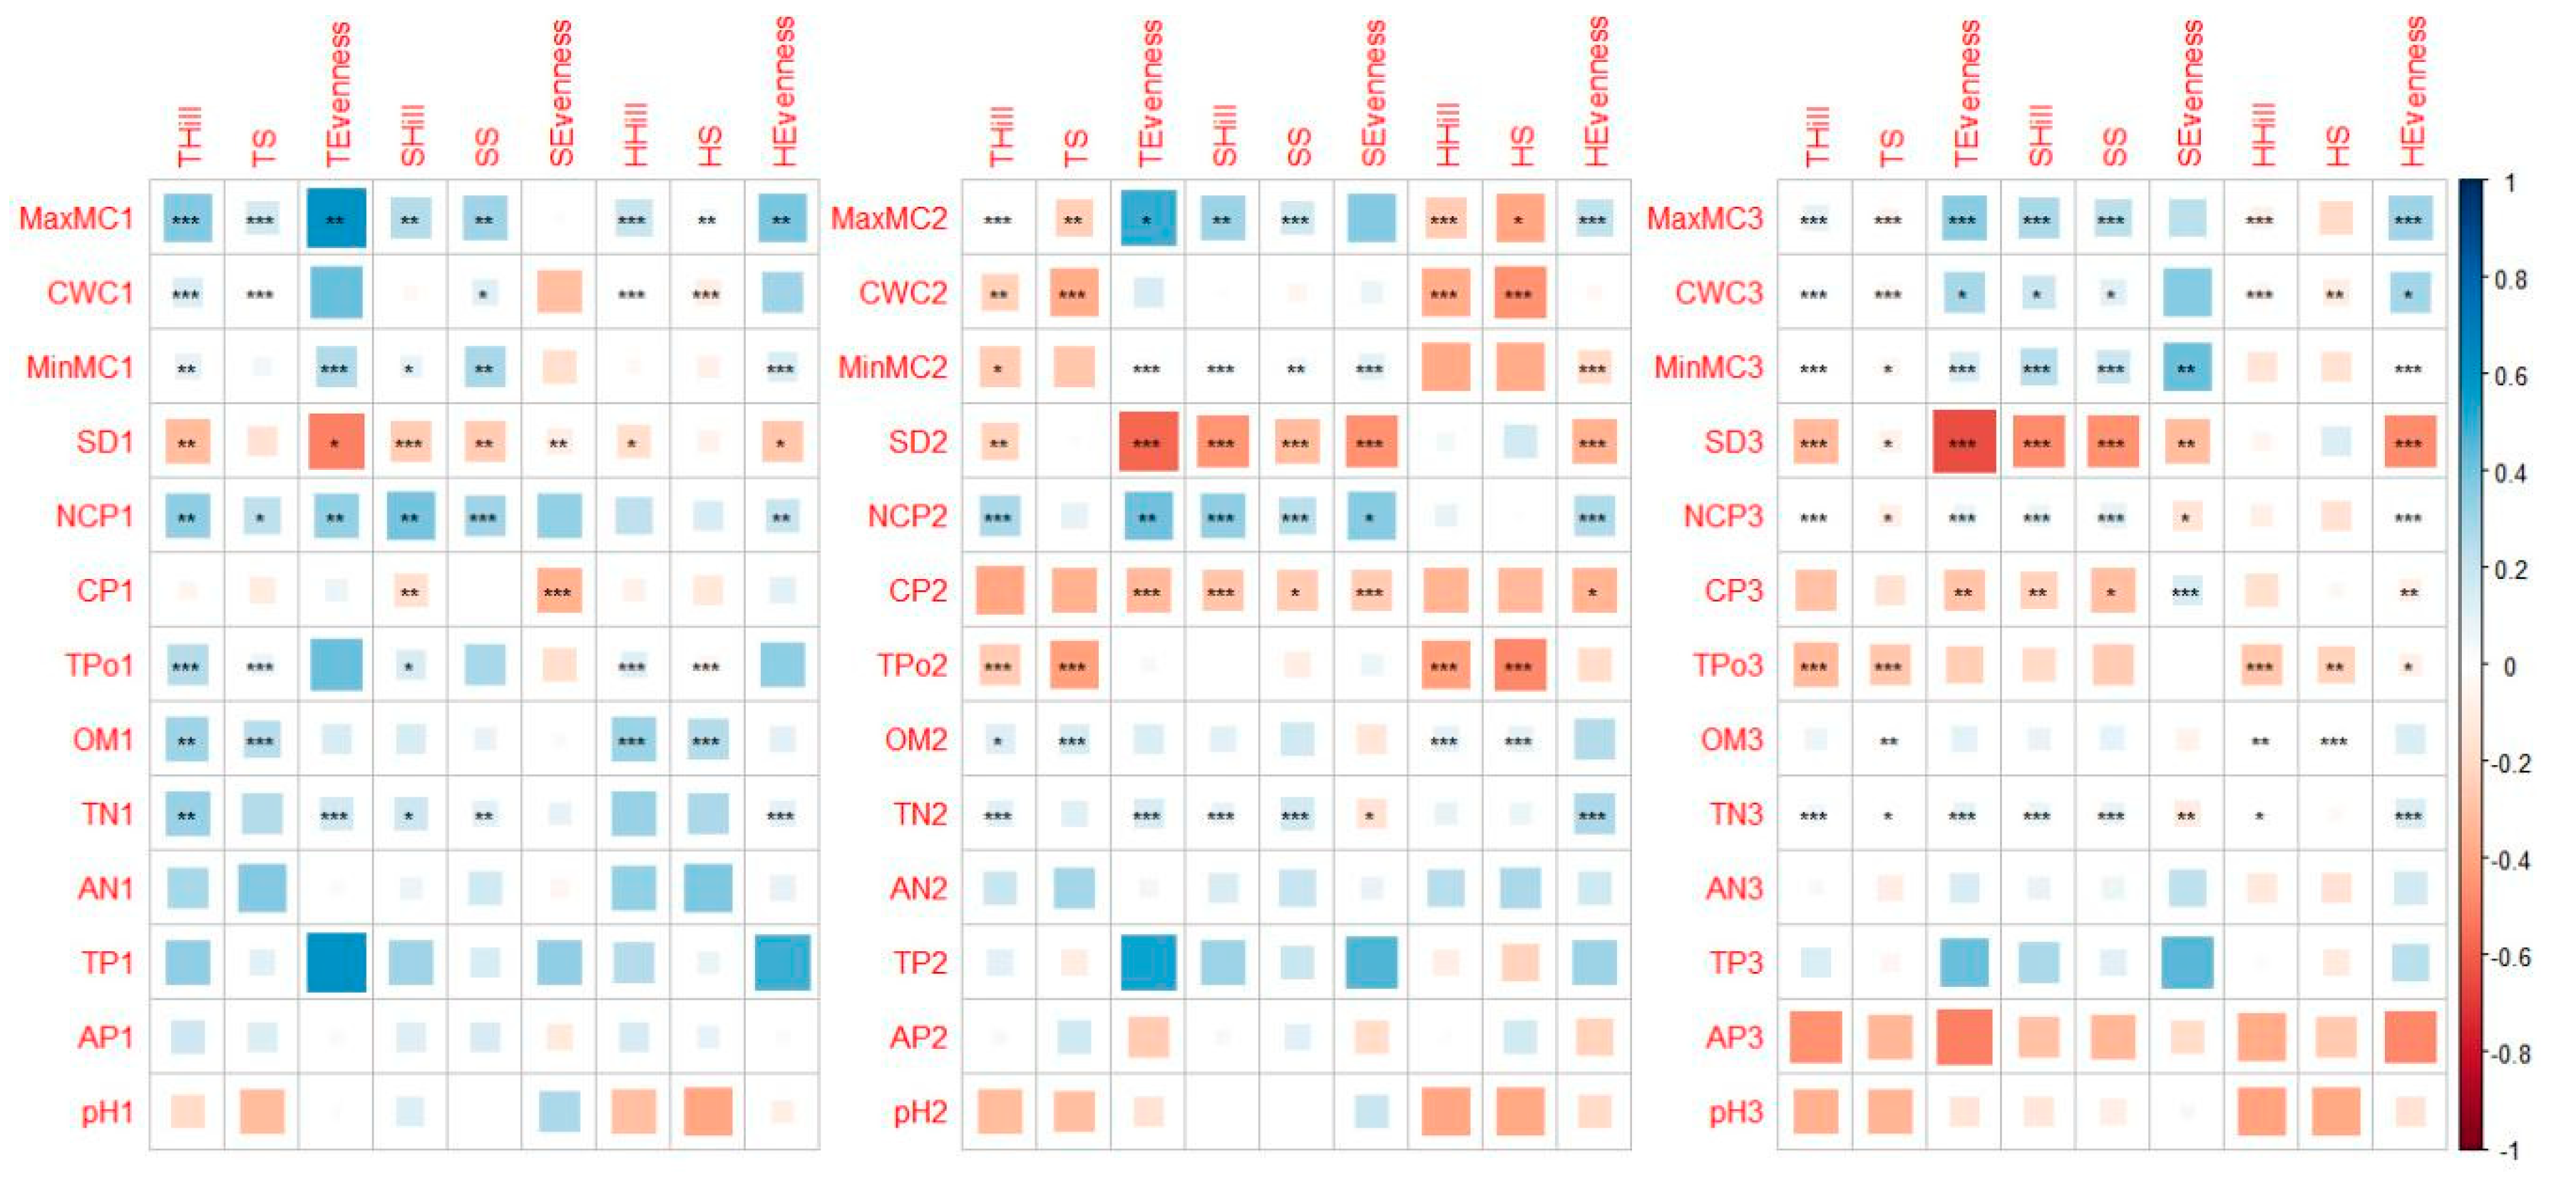
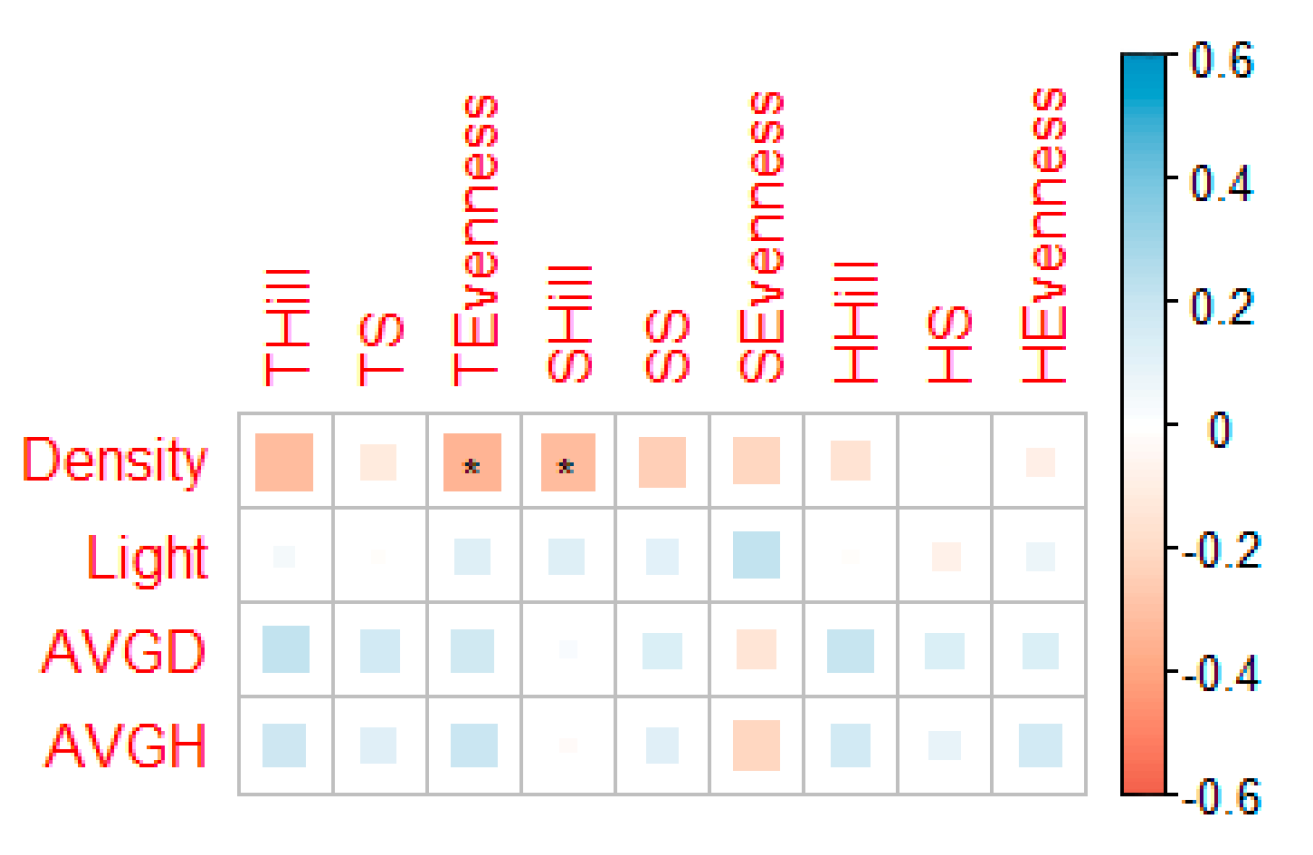
3.2. Relation Between Soil, Forest Factors, and Understory Vegetation Diversity

The correlation plot shows that there were stronger correlations between physical properties and diversity indices (Figure 3). As for chemical properties, only the OM and TN exhibited notable correlations. There were 38, 39, and 46 marked correlations between physical properties and diversity indices in soil layer 1, layer 2, and layer 3, respectively, and 9, 10, and 11 correlations between chemical properties and diversity indices in soil layer 1, layer 2, and layers 3, respectively. However, only 14, 19, and 12 soil properties had both marked and relatively high correlation coefficients (|r| ≥ 0.3) with diversity in each soil layer, respectively.
We used the principal components of soil properties in each layer as the explanatory variables and the Hill number (Shannon) as the response to perform linear regression. Four principal components were extracted from the soil property data in each layer. The principal components could explain 85%, 79%, and 73% of the soil properties to the first, second, and third layer, respectively. The R2 of the linear regression were used to describe the strength of explanation (Figure 4). The results showed that the R2 of herb diversity marginally increased from layer 1 to layer 2, but it decreased in layer 3. The R2 of shrub diversity increased in layer 2 but decreased in layer 3. The second soil layer had the maximum R2 in both herb and shrub models, and the third layer had the minimum explanatory power for herb and shrub diversity. The soil properties might account for more of the diversity of shrubs, but they exhibited less explanatory power for herb diversity.
Moreover, we used a correlation analysis to test the relation between forest factors and diversity indices (Figure 5). We defined stand density (Densiy for short), light transmittance (Light for short), average DBH (AVGD for short), and average tree height (AVGH for short) as the forestry factors. The results of the correlation showed that only stand density had a significant negative correlation with total evenness and shrub Hill number (Shannon). The linear regression also showed that these forestry factors explain less than 0.05 (R2 = 0.0487) of the Hill number (Shannon).

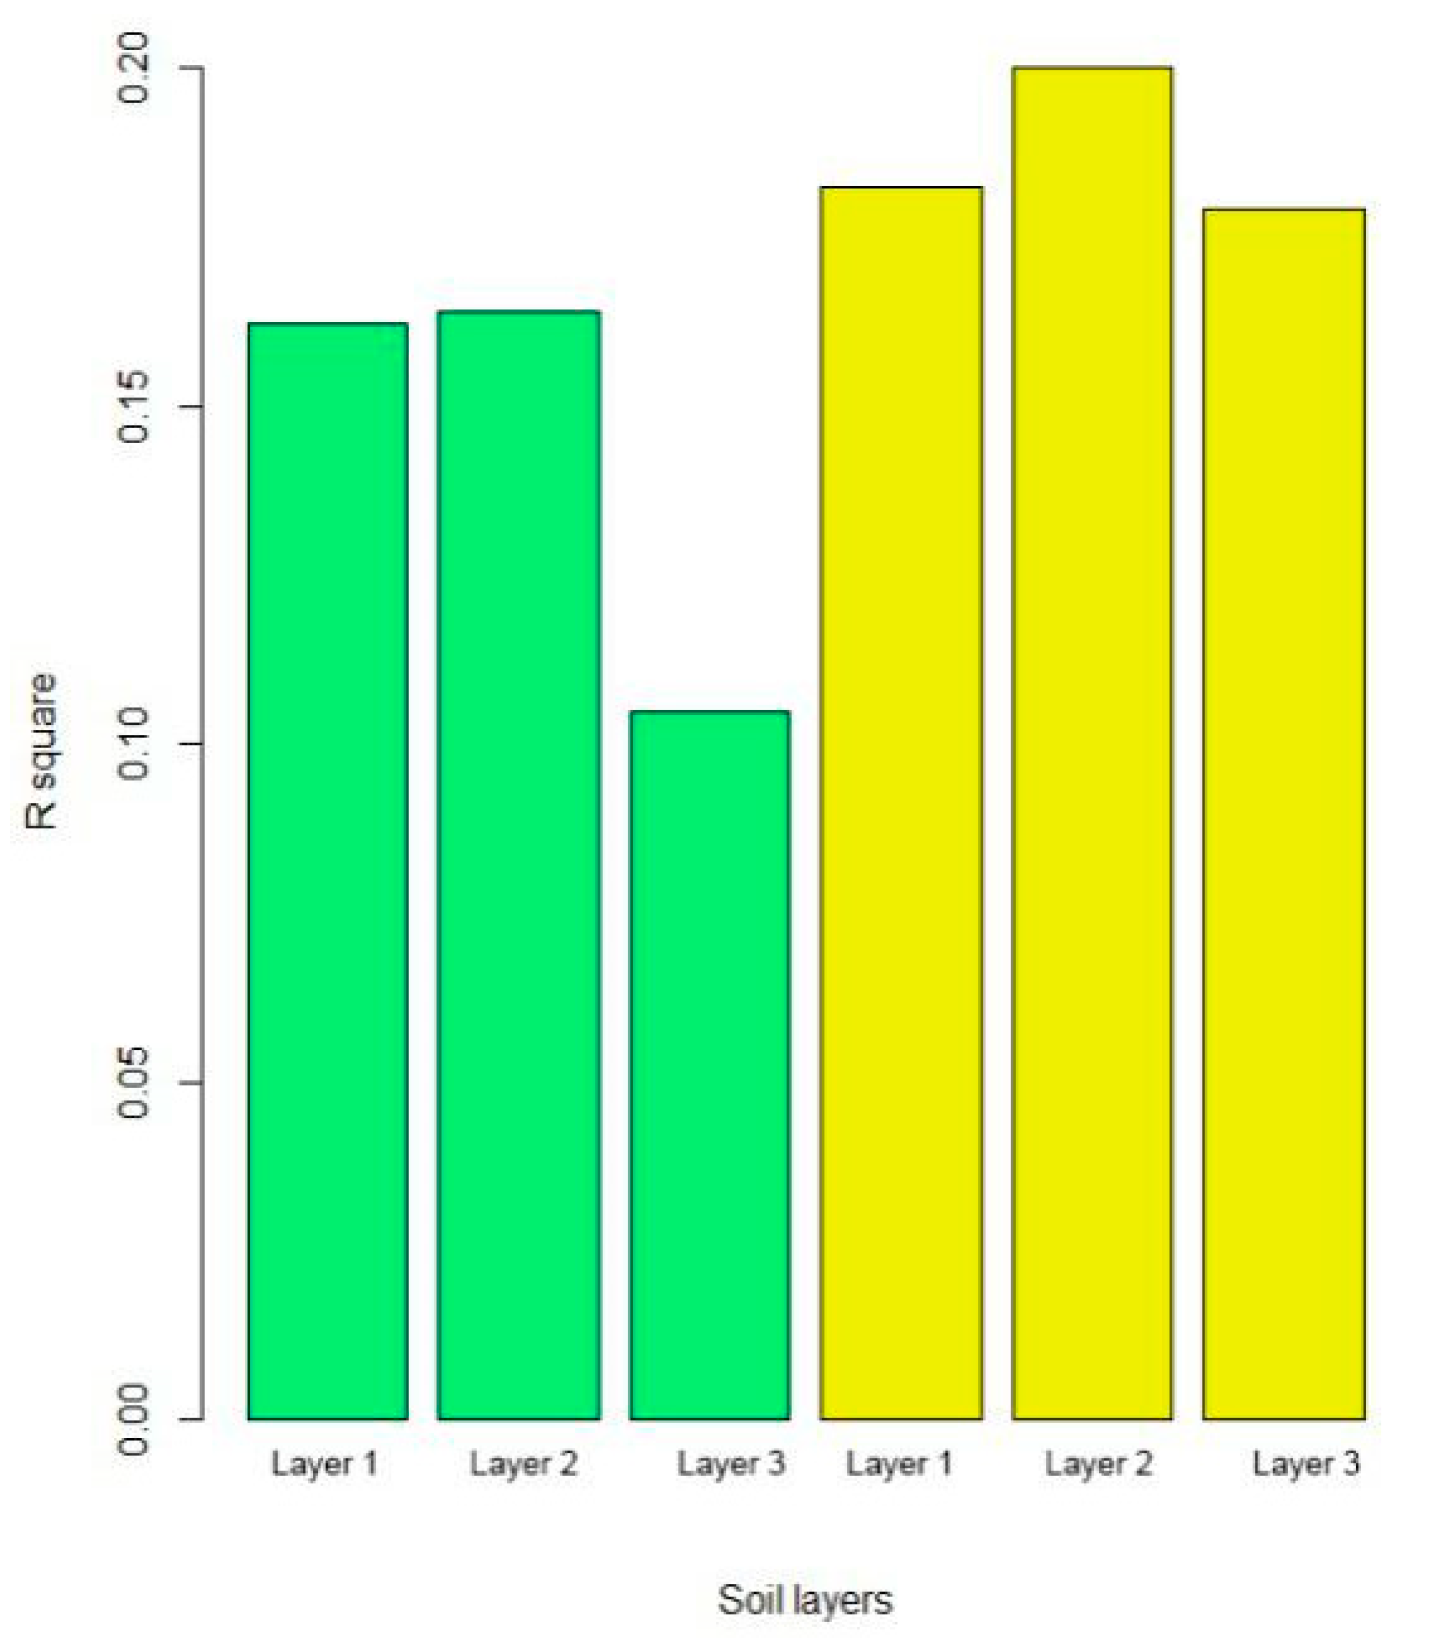
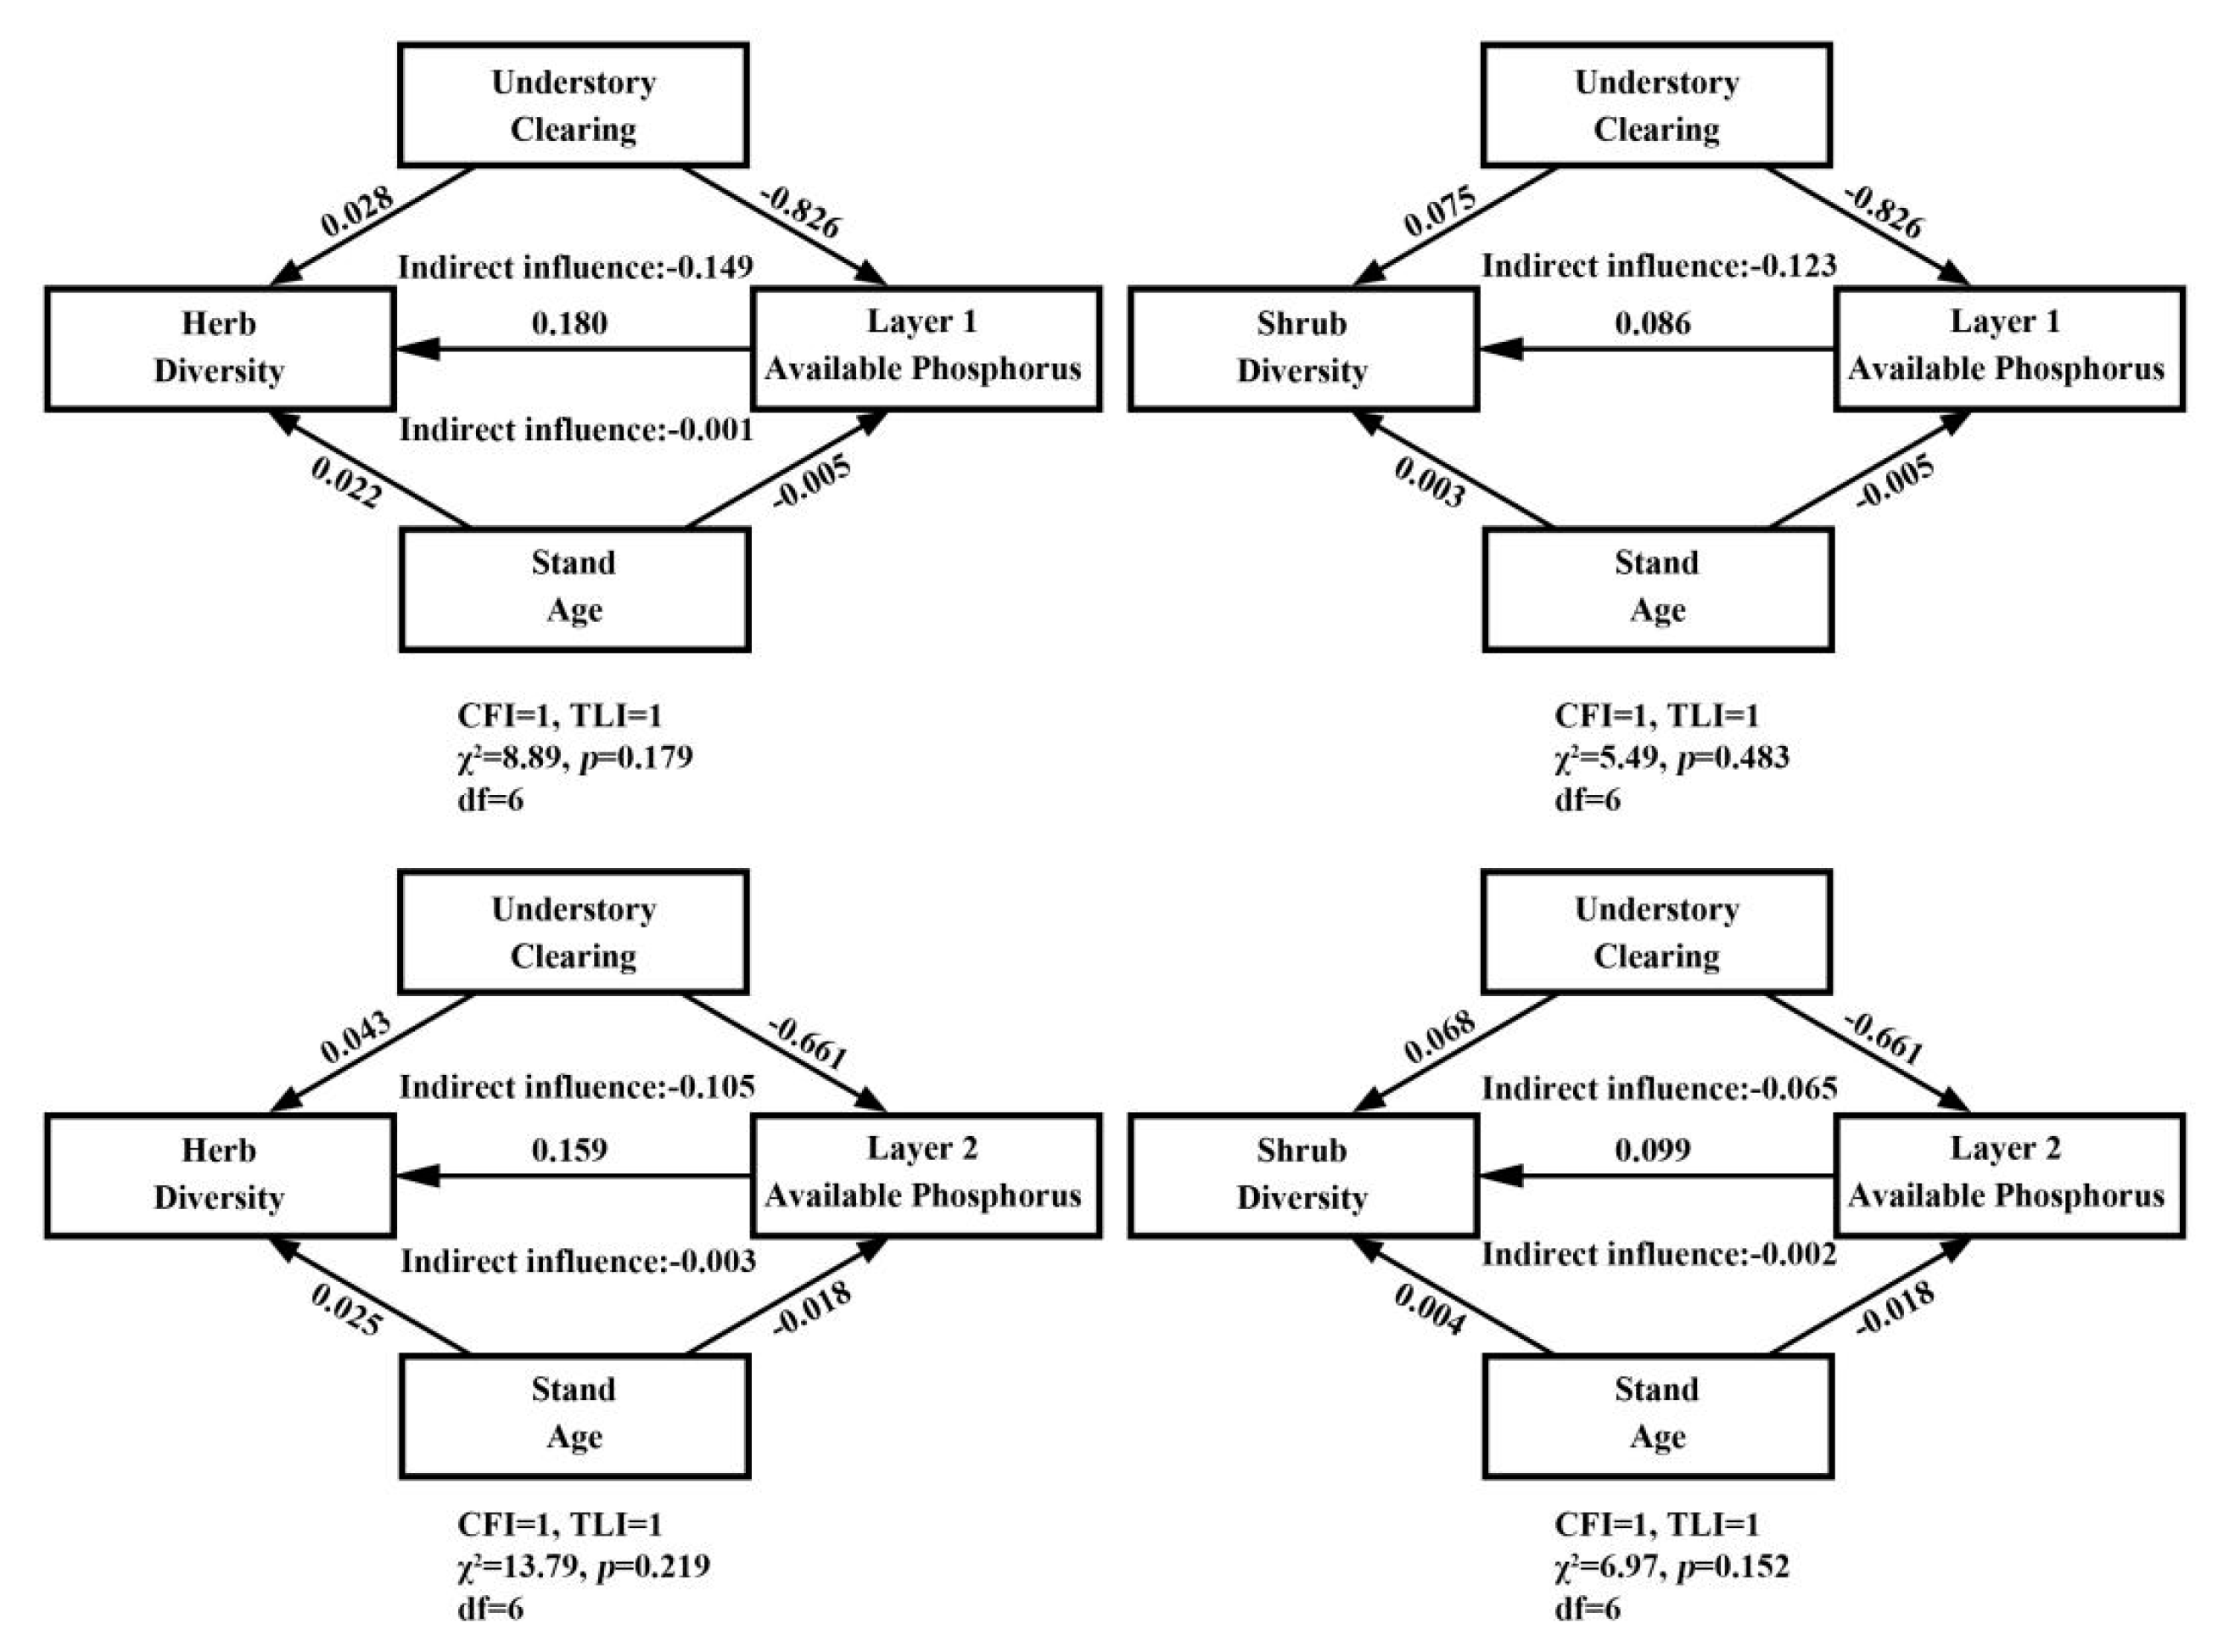
3.3. Structural Equation Modeling

We used ANOVA to test for significant differences in soil properties between plots with understory clearing and plots without understory clearing. The results showed that the AP in layer 2 (p < 0.001) and layer 3 (p < 0.01), as well as pH in layer 2 (p < 0.05) exhibited significant differences. The other soil properties showed little difference between the management group and no management group. Due to the significant difference of soil AP, we believed that the AP was the key factor to the understory diversity.
The SEM model were used (Figure 6) to explore how understory management and stand age influenced the understory plant diversity via soil AP. The Hill number (Shannon) was used to describe the diversity in SEM. The results of SEM showed that both the understory management and stand age had negative effects on soil AP. The AP then caused a positive effect on diversity of herbs and shrubs. The analysis generally showed that understory management and stand age had a direct positive effect on understory diversity, but it also had a negative indirect effect on understory diversity via AP.

4. Discussion

4.1. Influence of Forest Factors and Understory Management on Understory Diversity

The understory vegetation diversity was significantly influenced by stand age, and the herb diversity increased with stand age in non-management groups. This partly supports Hypothesis 1. However, only the herb diversity in the group without understory management showed an increasing trend, and the shrub diversity in the group with understory management showed no significant differences along stand age. The other groups showed little regularity. The herb diversity pattern implies that the disturbance (e.g., understory clearing) might interrupt the trend of increasing herb diversity with stand age. Generally speaking, the modelling of understory diversity is still difficult, and it is even more difficult in forests with human activities. Our study also confirmed that understory shrubs and herbs exhibited differential responses even under same environment conditions [42]. This suggests that this separation into shrubs and herbs is necessary when studying understory plant diversity.
There is little correlation between the forest factors and understory vegetation diversity. Many previous studies believed that stand density had an effect on understory diversity [28,30], but this effect was mostly mediated via light [43]. There was a periodical thinning management in our study area. This means that while the canopy of P. massoniana keeps growing, the canopy area may actually exhibit little change due to the thinning. Our light transmittance data also support this idea, as the light transmittance in the four age classes surprisingly exhibited no notable differences. This may be part of the reason why the shrub diversity lacked regularity and why the understory diversity had little correlation with stand density.
In addition, there was limited distinction between cleared and non-cleared groups in the same age class. A significant difference was found between the 9-year-old and 28-year-old groups for herbs, but these groups were not in the converse treatment. For shrubs, the only significant difference was in richness within the 48-year-old group. This result differs from many other studies [27,44,45]. Researchers believed that the understory management can promote understory diversity because the above-ground vegetation clearing can weaken the dominance of tall plant species that have directly suppressed a larger pool of smaller and competitively inferior species directly [45]. Our investigation on understory vegetation was performed 2–3 years after the latest clearing management, a short time period compared to the other studies. Therefore, the understory community may still be recovering, and the effects of understory management may not be fully realized. Moreover, most of the management plots and the non-management plots were close to each other (only the 9-year-old plots had significant distances between different treatments, as shown in Figure 1). This enhances the ability of species to disperse between plots. This may be an alternative reason to explain the negligible difference in understory species diversity after understory clearing is conducted.

4.2. Relation Between Soil Factors and Understory Diversity

As a resource of mineral nutrition and water for plants, soil is an important factor to understory plant diversity [42]. The results of the analysis showed that the diversity indices were more closely correlated with soil physical properties than chemical properties. Only OM and TN had marked correlations with some of the diversity indices. The total nitrogen content (1.32 g/kg) in our plots did not reach the average total nitrogen content (1.39 g/kg) of yellow/brown soil in China [46]. This suggests that nitrogen was limited in this area. The insufficiency of nitrogen might limit the growth of dominant species and improve the understory diversity by weakening the dominance [35]. The soil’s physical properties have strong relationships with water supply, air/heat exchange, and the efficiency of nutrition absorption [10], and all of these factors are highly correlated with plant growth. According to a recent study about plant diversity and soil physical properties, plant diversity was able to benefit soil physical properties [47]. This could explain the strong bond between understory diversity and soil physical properties, and further demonstrates the importance of understory diversity in forest ecosystems.
The contribution of soil layers partly supports our second hypothesis. The results show that the 0–10 cm and 10–20 cm soil layers exhibited the highest explanatory power for herb diversity, that is, herb diversity was mainly related to the properties in 0–20 cm soil layer. The results for shrubs show that shrub diversity was mostly related to the properties in 10–20 cm soil layer, while the 0–10 cm and 20–40 cm soil layers had less correlation with shrubs. A study conducted by Goebes et al. [21] reported that 16 cm was a critical depth for explaining plant productivity and community assembly. Our results basically agree with their conclusion. However, the 16 cm sampling was not practical in field work. We therefore suggest a sampling of 10–20 cm soil depth.

4.3. SEM Analysis on Available Phosphorus

Phosphorus is a key driver of diversity in many studies [48,49,50], and phosphorus was strongly influenced by understory clearing and stand age. A previous study also found a decrease in exchangeable phosphorus caused by long-term hay cutting [35]. The study hypothesized that the long-term removal of above-ground biomass depleted phosphorus. Additionally, some of the plants can release enzymes to dissolve inorganic phosphorus and generate phosphatase to discharge organically combined phosphorus [51]. The cutting operation causes massive plant damage or even death, and it might hamper these biochemical activities and decrease AP. However, the mechanism underlying reductions in soil AP and pH after understory clearings is still an interesting and open question.
Our results agree that AP has an effect on plant diversity. However, the understory management had a stronger and direct effect on shrub and herb diversity in most of the SEM models, which means that the direct effect and the indirect effect of understory management might neutralize each other. These findings might provide an explanation for the lack of a significant correlation between understory biodiversity and soil AP (Figure 3) and could explain why the understory clearing had little effect on understory diversity (Table 2). Our findings also indicate that understory management affects the understory biodiversity via changing soil properties, which supports our third hypothesis.
The SEM showed that soil AP exhibited a positive relation with both shrub and herb diversity. Soil AP was essential to plant growth, meaning the decrease of soil AP caused by periodical understory clearing may limit the growth and distribution to some plants with higher phosphorus demand. Consequently, the decline of soil AP lead to the decrease of understory diversity.
Understory clearing had a direct and positive effect on understory plant diversity. This result implies that the hurt on plants by understory clearing can recover quickly and benefit the understory diversity, most likely by weakening the dominant species [35]. Both of the understory clearing and stand age contribute directly and positively to the diversity of herbs and shrubs. However, they also had a negative indirect effect via soil AP, making their impacts complicated. The soil AP in the 10–20 cm soil (which was the most relevant layer to understory diversity) has decreased (Figure 7) in the last fifty years. We believe the understory diversity will decrease if the understory clearing continues because the pressure of phosphorus limitation on plants will be growing.

5. Conclusions

Our study demonstrates that the diversity of herbs and shrubs respondeds differently to understory clearing along stand age in a P. massoniana plantation. The understory clearing influenced the herb diversity, but it did not have a consistent impact on the shrub diversity. A strong correlation between soil physical properties and understory plant diversity was found in our study. The results of the regression analysis showed that the second layer (10–20 cm) of soil had the highest contribution to both shrub and herb diversity.
There was a negative effect of the understory clearing on soil AP, and there was a positive effect of AP on the diversity of both shrubs and herbs found in the SEM. This indicates that the understory clearing and stand age both had an indirect negative effect on understory biodiversity. However, the understory clearing and stand age could also directly increase the understory biodiversity. These indirect and direct effects of understory clearing and stand age might offset each other to some extent, and so their net results did not produce a large variation between understory clearing and non-clearing groups, or young and old groups in this study.
These findings will hopefully contribute to plantation forest management and understory plant diversity conservation, as well as improve our understanding of the biodiversity dynamics in subtropical P. massoniana plantations. The potential mechanism underlying the correlation between understory management and soil phosphorus in this study should be explored further in the future.

Author Contributions

D.D. and A.A. designed the study; D.D., A.A., and X.H. were in charge of the data collection; D.D. analyzed the data and drafted the paper; Y.L. and M.T. subsequently contributed to writing and revising; Z.Z. and Y.L. reviewed and edited the final version of paper; M.T. and C.W. acquired the funding. All authors have read and agreed to the published version of the manuscript.

Funding

This research was funded by the National Key R&D Programs of China grant number 2017YFC0505603, 2016YFD0600201.

Acknowledgments

We express our deepest gratitude to Taizishan Forestry Administration Bureau of Hubei province for providing support and permission to conduct this research. The authors sincerely acknowledge the efforts of Kuirong Zheng, Chucai Peng, Qiang Song, Feixia Ding, Yiran Li, Xin Hong, Yang Xiang and Xinyu Li in data collection. We are grateful to Wei He and Zhaogui Yan for guidance and technical support. Finally, we thank LetPub (www.letpub.com) for its linguistic assistance during the preparation of this manuscript and the research platform support from the Long-term Track Research Program of Forest Ecological Station in Three Gorges Reservoir Region (Zigui) of the Yangtze River, China.

Conflicts of Interest

The authors declare no conflict of interest.

References

  1. Chen, C.; Park, T.; Wang, X.; Piao, S.; Xu, B.; Chaturvedi, R.K.; Fuchs, R.; Brovkin, V.; Ciais, P.; Fensholt, R.; et al. China and India lead in greening of the world through land-use management. Nat. Sustain. 2019, 2, 122–129. [Google Scholar] [CrossRef] [PubMed]
  2. Brockerhoff, E.G.; Jactel, H.; Parrotta, J.A.; Ferraz, S.F.B. Role of eucalypt and other planted forests in biodiversity conservation and the provision of biodiversity-related ecosystem services. Forest Ecol. Manag. 2013, 301, 43–50. [Google Scholar] [CrossRef]
  3. Brockerhoff, E.G.; Jactel, H.; Parrotta, J.A.; Ferraz, S.F.B. Plantation forests and biodiversity: Oxymoron or opportunity? Biodivers. Conserv. 2008, 17, 925–951. [Google Scholar] [CrossRef]
  4. Ohsawa, M.; Shimokawa, T. Extending the rotation period in larch plantations increases canopy heterogeneity and promotes species richness and abundance of native beetles: Implications for the conservation of biodiversity. Biol. Conserv. 2011, 144, 3106–3116. [Google Scholar] [CrossRef]
  5. Tyler, N.; McFadden, R.D. Opening the silvicultural toolbox: A new framework for conserving biodiversity in Chilean timber plantations. Forest Ecol. Manag. 2018, 425, 75–84. [Google Scholar]
  6. Gilliam, F.S. The Ecological Significance of the Herbaceous Layer in Temperate Forest Ecosystems. BioScience 2007, 57, 845–858. [Google Scholar] [CrossRef]
  7. Nearing, M.A.; Jetten, V.; Baffaut, C.; Cerdan, O.; Couturier, A.; Hernandez, M.; Le Bissonnais, Y.; Nichols, M.H.; Nunes, J.P.; Renschler, C.S.; et al. Modeling response of soil erosion and runoff to changes in precipitation and cover. Catena 2005, 61, 131–154. [Google Scholar] [CrossRef]
  8. Muller, R.N.; Bormann, F.H. Role of Erythronium americanum Ker. in Energy Flow and Nutrient Dynamics of a Northern Hardwood Forest Ecosystem. Science 1976, 193, 1126–1128. [Google Scholar] [CrossRef]
  9. Small, C.J.; McCarthy, B.C. Relationship of understory diversity to soil nitrogen, topographic variation, and stand age in an eastern oak forest, USA. Forest Ecol. Manag. 2005, 217, 229–243. [Google Scholar] [CrossRef]
  10. Brevik, E.C.; Cerdà, A.; Mataix-Solera, J.; Pereg, L.; Quinton, J.N.; Six, J.; van Oost, K. The interdisciplinary nature of SOIL. Soil 2015, 1, 117–129. [Google Scholar] [CrossRef] [Green Version]
  11. Rolo, V.; López-Díaz, M.L.; Moreno, G. Shrubs affect soil nutrients availability with contrasting consequences for pasture understory and tree overstory production and nutrient status in Mediterranean grazed open woodlands. Nutr. Cycl. Agroecosys. 2012, 93, 89–102. [Google Scholar] [CrossRef]
  12. Finzi, A.C.; Canham, C.D.; Breemen, N.V. Canopy Tree–Soil Interactions Within Temperate Forests: Species Effects on pH and Cations. Ecol. Appl. 1998, 8, 447–454. [Google Scholar]
  13. Jobbagy, E.G.; Jackson, R.B. The vertical distribution of soil organic carbon and its relation to climate and vegetation. Ecol. Appl. 2000, 10, 423–436. [Google Scholar] [CrossRef]
  14. Ray, G.; Ochoa, C.G.; Deboodt, T.; Mata-Gonzalez, R. Overstory–Understory Vegetation Cover and Soil Water Content Observations in Western Juniper Woodlands: A Paired Watershed Study in Central Oregon, USA. Forests 2019, 10, 151. [Google Scholar] [CrossRef] [Green Version]
  15. Fu, B.J.; Liu, S.L.; Ma, K.M.; Zhu, Y.G. Relationships between soil characteristics, topography and plant diversity in a heterogeneous deciduous broad-leaved forest near Beijing, China. Plant. Soil 2004, 261, 47–54. [Google Scholar] [CrossRef]
  16. Kumar, P.; Chen, H.Y.H.; Thomas, S.C.; Shahi, C. Linking resource availability and heterogeneity to understorey species diversity through succession in boreal forest of Canada. J. Ecol. 2018, 106, 1266–1276. [Google Scholar] [CrossRef]
  17. Huang, L.; Zhu, W.; Ren, H.; Chen, H.; Wang, J. Impact of atmospheric nitrogen deposition on soil properties and herb-layer diversity in remnant forests along an urban–rural gradient in Guangzhou, southern China. Plant. Ecol. 2012, 213, 1187–1202. [Google Scholar] [CrossRef]
  18. Gao, Y.; Sun, S.; Xing, F.; Mu, X.; Bai, Y. Nitrogen addition interacted with salinity-alkalinity to modify plant diversity, microbial PLFAs and soil coupled elements: A 5-year experiment. Appl. Soil Ecol. 2019, 137, 78–86. [Google Scholar] [CrossRef]
  19. Laliberté, E.; Lambers, H.; Burgess, T.I.; Wright, S.J. Phosphorus limitation, soil-borne pathogens and the coexistence of plant species in hyperdiverse forests and shrublands. New Phytol. 2015, 206, 507–521. [Google Scholar] [CrossRef] [Green Version]
  20. Zemunik, G.; Turner, B.L.; Lambers, H.; Laliberté, E. Diversity of plant nutrient- acquisition strategies increases during long-term ecosystem development. Nat. Plants 2015, 1, 15050. [Google Scholar] [CrossRef]
  21. Goebes, P.; Schmidt, K.; Seitz, S.; Both, S.; Bruelheide, H.; Erfmeier, A.; Scholten, T.; Kuhn, P. The strength of soil-plant interactions under forest is related to a Critical soil Depth. Sci. Rep. 2019, 9, 8635. [Google Scholar] [CrossRef] [PubMed] [Green Version]
  22. Cui, N.; Zhang, D.; Liu, Y.; Zhang, J.; Ou, J.; Zhang, J.; Deng, C.; Wei, J. Plant diversity and soil physicochemical properties under different aged Pinus Massoniana plantation. Shengtaixue Zazhi 2014, 10, 2610–2617. [Google Scholar]
  23. Chao, L.; Hong, T.; Li, J.; Chen, C.; Hong, W.; Wu, C. Analyses on diameter class structure and species diversity of understory of artificial forest of Cunninghamia lanceolata with different forest ages in mid-subtropical region. J. Plant. Resour. Environ. 2015, 24, 88–96. [Google Scholar]
  24. Chen, X.; Zhao, A.; Zhang, J.; Zeng, H. Understory Plant Diversity and Environmental Characteristics of Different Age Pinus massoniana Plantations. J. Sichuan Agric. Univ. 2017, 35, 186–192, 233. [Google Scholar]
  25. Rytter, L.; Stener, L.-G. Productivity and thinning effects in hybrid aspen (Populus tremula L. × P. tremuloides Michx.) stands in southern Sweden. Forestry 2005, 78, 285–295. [Google Scholar] [CrossRef] [Green Version]
  26. Verschuyl, J.; Riffell, S.; Miller, D.; Wigley, T.B. Biodiversity response to intensive biomass production from forest thinning in North American forests—A meta-analysis. Forest Ecol. Manag. 2011, 261, 221–232. [Google Scholar] [CrossRef]
  27. Jiménez, M.N.; Spotswood, E.N.; Cañadas, E.M.; Navarro, F.B.; Verheyen, K. Stand management to reduce fire risk promotes understorey plant diversity and biomass in a semi-aridPinus halepensisplantation. Appl. Veg. Sci. 2015, 18, 467–480. [Google Scholar] [CrossRef]
  28. Ali, A.; Dai, D.; Akhtar, K.; Teng, M.; Yan, Z.; Urbina-Cardona, N.; Mullerova, J.; Zhou, Z. Response of understory vegetation, tree regeneration, and soil quality to manipulated stand density in a Pinus massoniana plantation. Glob. Ecol. Conserv. 2019, 20, e00775. [Google Scholar] [CrossRef]
  29. Misik, T.; Coll, E.K. Long-term response of understorey cover, basal area and diversity to stand density in a mixed oak forest on the Sikfokut plot in Hungary. J. For. Sci. 2013, 59, 319–327. [Google Scholar] [CrossRef] [Green Version]
  30. Chen, Y.; Cao, Y. Response of tree regeneration and understory plant species diversity to stand density in mature Pinus tabulaeformis plantations in the hilly area of the Loess Plateau, China. Ecol. Eng. 2014, 73, 238–245. [Google Scholar] [CrossRef]
  31. Agee, K.J.; Skinner, N.C. Basic principles of forest fuel reduction treatments. Forest Ecol. Manag. 2005, 211, 83–96. [Google Scholar] [CrossRef]
  32. Porto, M.; Correia, O.; Beja, P. Long-term consequences of mechanical fuel management for the conservation of Mediterranean forest herb communities. Biodivers. Conserv. 2011, 20, 2669–2691. [Google Scholar] [CrossRef]
  33. Decocq, G.; Valentin, B.; Toussaint, B.; Hendoux, F.; Saguez, R.; Bardat, J. Soil seed bank composition and diversity in a managed temperate deciduous forest. Biodivers. Conserv. 2004, 13, 2485–2509. [Google Scholar] [CrossRef]
  34. Santana, J.; Porto, M.; Reino, L.; Beja, P. Long-term understory recovery after mechanical fuel reduction in Mediterranean cork oak forests. Forest Ecol. Manag. 2011, 261, 447–459. [Google Scholar] [CrossRef]
  35. Sand-Jensen, K.; Jørgensen, H.; Larsen, J.R. Long-term influence of hay-cutting on plant species richness, biodiversity and soil fertility in a Danish fen. Ecol. Eng. 2019, 134, 93–100. [Google Scholar] [CrossRef]
  36. Thomas, S.C.; Halpern, C.B.; Falk, D.A.; Liguori, D.A.; Austin, K.A. Plant diversity in managed forests: Understory responses to thinning and fertilization. Ecol. Appl. 1999, 9, 864–879. [Google Scholar] [CrossRef]
  37. Brockerhoff, E.G.; Ecroyd, C.E.; Leckie, A.C.; Kimberley, M.O. Diversity and succession of adventive and indigenous vascular understorey plants in Pinus radiata plantation forests in New Zealand. Forest Ecol. Manag. 2003, 185, 307–326. [Google Scholar] [CrossRef]
  38. Bao, F.; Jiang, Z. Wood Properties of Main Tree Species from Plantation in China, 2nd ed.; China Forestry Publishing House: Beijing, China, 1998; pp. 56–82. [Google Scholar]
  39. Granke, O. Assessment of Ground Vegetation. In ForestBIOTA Work Report; Federal Research Centre for Forestry and Forest Products: Hamburg, Germany, 2006; pp. 1–20. [Google Scholar]
  40. Rosseel, Y. Lavaan: An R package for structural equation modeling. J. Stat. Softw. 2012, 48, 1–36. [Google Scholar] [CrossRef] [Green Version]
  41. R Development Core Team. R: A language and environment for statstical computing, Version 3.4.0.; R Foundation for Statistical Computing: Vienna, Austria, 2017. [Google Scholar]
  42. Poudel, D.R.; Chen, H.Y.H.; Kc, M.; Ge, Z.; Bown, H.E.; Ruan, H. Understory Vegetation Dynamics across a Poplar Plantation Chronosequence in Reclaimed Coastal Saline Soil. Forests 2019, 10, 764. [Google Scholar] [CrossRef] [Green Version]
  43. Eldegard, K.; Scholten, J.; Stokland, J.N.; Granhus, A.; Lie, M. The influence of stand density on bilberry (Vaccinium myrtillus L.) cover depends on stand age, solar irradiation, and tree species composition. For. Ecol. Manag. 2019, 432, 582–590. [Google Scholar] [CrossRef]
  44. Griffis, K.L.; Crawford, J.A.; Wagner, M.R.; Moir, W.H. Understory response to management treatments in northern Arizona ponderosa pine forests. Forest Ecol. Manag. 2001, 146, 239–245. [Google Scholar] [CrossRef]
  45. Seer, F.K.; Schrautzer, J. Status, future prospects, and management recommendations for alkaline fens in an agricultural landscape: A comprehensive survey. J. Nat. Conserv. 2014, 22, 358–368. [Google Scholar] [CrossRef]
  46. Zhang, C.; Yan, X.; Yang, J. Estimation of Nitrogen Reserves in Forest Soils of China. J. Southwest Agric. Univ. 2004, 26, 572–579. [Google Scholar]
  47. Gould, I.J.; Quinton, J.N.; Weigelt, A.; Deyn, G.B.D.; Bardgett, R.D. Plant diversity and root traits benefit physical properties key to soil function in grasslands. Ecol. Lett. 2016, 19, 1140–1149. [Google Scholar] [CrossRef] [PubMed]
  48. Lambers, H.; Raven, J.A.; Shaver, G.R.; Smith, S.E. Plant nutrient-acquisition strategies change with soil age. Trends Ecol. Evol. 2008, 23, 95–103. [Google Scholar] [CrossRef] [PubMed]
  49. Laliberté, E.; Grace, J.B.; Huston, M.A.; Lambers, H.; Teste, F.P.; Turner, B.L.; Wardle, D.A. How does pedogenesis drive plant diversity? Trends Ecol. Evol. 2013, 28, 331–340. [Google Scholar] [CrossRef] [PubMed] [Green Version]
  50. Davidson, E.A.; de Carvalho, C.J.R.; Vieira, I.C.G.; Figueiredo, R.D.; Moutinho, P.; Ishida, F.Y.; dos Santos, M.T.P.; Guerrero, J.B.; Kalif, K.; Saba, R.T. Nitrogen and phosphorus limitation of biomass growth in a tropical secondary forest. Ecol. Appl. 2004, 14, 150–163. [Google Scholar] [CrossRef] [Green Version]
  51. Li, H. Modern Plant Physiology, 3rd ed.; Higher Education Press: Beijing, China, 2012; pp. 62–83. [Google Scholar]
Figure 1. Satellite image of the study area.
Forests 11 00231 g001
Figure 2. Differences in Hill number (Shannon) and richness of the herb and shrub layers among four stand ages. Y means the plots have understory clearing management and N means the plots have no understory management. Separation of means was determined by a Tukey test where applicable. The letters indicate groups that are significantly different at p < 0.05. The lowercase letters indicate the group without understory clearing and the capital letters indicate the group with understory clearing. The “*/**” indicates a significant difference between understory treatments in same age class at p < 0.05 or p < 0.01 level.
Forests 11 00231 g002
Figure 3. Correlation between soil properties in each layer and diversity index. In column header, the first letter indicates the category of the understory plants, and the following word/letter indicates the indices of the diversity. “T” indicates the total understory, “S” indicates the shrub layer, and “H” indicates the herb layer. “Hill” means the Hill number (Shannon), “S” means the species number, and “Evenness” means the evenness (Shannon). Plot A, B, and C represent layer 1, layer 2, and layer 3, respectively. The “*, **, ***” indicates the p values of 0.05, 0.01, and 0.001, respectively.
Forests 11 00231 g003
Figure 4. The R2 of linear regression results between Hill number (Shannon) and soil properties in each soil layer. Green represents the herb and yellow represents the shrub.
Forests 11 00231 g004
Figure 5. Correlation between forestry factors and understory diversity indices.
Forests 11 00231 g005
Figure 6. Structural equation modeling (SEM) for herb and shrub diversity. The understory management and stand age were fitted as direct pathways of influence on understory vegetation diversity, while the soil was fitted as indirect pathways of influence on understory diversity. We used CFI, TLI, and χ2 to estimate the fitness of the SEM models. The p is the p-value of the χ2 test, and the df is the degree of freedom of the model. The indirect influence from understory management was above the arrow and the indirect influence from stand age was below the arrow. The indirect influence was not shown if the absolute value of the coefficient was smaller than 0.001.
Forests 11 00231 g006
Figure 7. The change of AP and pH in second soil (10–20 cm) along stand age.
Forests 11 00231 g007
Table 1. Stand characteristics in each age class. Data is reported as mean ± standard error.
Age Class/Age (Year)Understory TreatmentStand Density (Tree · ha−1)Height (m)DBH (cm)Light Transmittance (%)
Young/9Cleared3651.3 ± 392.85.74 ± 0.39.1 ± 0.735.1 ± 2.8
Intermediate/18Cleared1555.6 ± 239.111.4 ± 0.914.9 ± 0.233.6 ± 2.5
Near mature/28Cleared1195.7 ± 51.315.3 ± 0.621.6 ± 0.449.8 ± 3.5
Mature/48Cleared773.6 ± 91.816.8 ± 2.225.5 ± 2.948.2 ± 5.4
Young/9No-cleared3466.2 ± 366.34.4 ± 0.38.9 ± 0.628.9 ± 7.6
Intermediate/18No-cleared1455.3 ± 251.211.1 ± 0.515.4 ± 1.335.3 ± 4.9
Near mature/28No-cleared1247.6 ± 282.514.2 ± 0.720.5 ± 1.630.4 ± 9.9
Mature/48No-cleared1177.7 ± 143.215.8 ± 2.523.3 ± 2.334.2 ± 1.4
Table 2. Result of Two-way ANOVA. The “***” indicates a significant effect at p < 0.001 level.
CategoriesIndexStand AgeUnderstory ManagementInteraction
F-ValuepF-ValuepF-Valuep
HerbShannon6.78<0.001 ***0.820.375.42<0.001 ***
Richness5.29<0.001 ***2.200.148.61<0.001 ***
ShrubShannon6.97<0.001 ***0.020.892.460.06
Richness4.75<0.001 ***0.590.442.350.07

