Article

Geographical Gradients of Genetic Diversity and Differentiation among the Southernmost Marginal Populations of Abies sachalinensis Revealed by EST-SSR Polymorphism

1
Hokkaido Research Center, Forestry and Forest Products Research Institute, 7 Hitsujigaoka, Toyohira, Sapporo, Hokkaido 062-8516, Japan
2
Department of Forest Molecular Genetics and Biotechnology, Forestry and Forest Products Research Institute, 1 Matsunosato, Tsukuba, Ibaraki 305-8687, Japan
3
Forestry Research Institute, Hokkaido Research Organization, Koushunai, Bibai, Hokkaido 079-0166, Japan
4
Education and Research Center, The University of Tokyo Forests, Graduate School of Agricultural and Life Sciences, The University of Tokyo, 1-1-1 Yayoi, Bunkyo-ku, Tokyo 113-8657, Japan
*
Author to whom correspondence should be addressed.
Forests 2020, 11(2), 233; https://doi.org/10.3390/f11020233
Submission received: 17 December 2019 / Revised: 11 February 2020 / Accepted: 17 February 2020 / Published: 20 February 2020
(This article belongs to the Special Issue Genetics and Improvement of Forest Trees)

Abstract

:
Research Highlights: We detected the longitudinal gradients of genetic diversity parameters, such as the number of alleles, effective number of alleles, heterozygosity, and inbreeding coefficient, and found that these might be attributable to climatic conditions, such as temperature and snow depth. Background and Objectives: Genetic diversity among local populations of a plant species at its distributional margin has long been of interest in ecological genetics. Populations at the distribution center grow well in favorable conditions, but those at the range margins are exposed to unfavorable environments, and the environmental conditions at establishment sites might reflect the genetic diversity of local populations. This is known as the central-marginal hypothesis in which marginal populations show lower genetic variation and higher differentiation than in central populations. In addition, genetic variation in a local population is influenced by phylogenetic constraints and the population history of selection under environmental constraints. In this study, we investigated this hypothesis in relation to Abies sachalinensis, a major conifer species in Hokkaido. Materials and Methods: A total of 1189 trees from 25 natural populations were analyzed using 19 EST-SSR loci. Results: The eastern populations, namely, those in the species distribution center, showed greater genetic diversity than did the western peripheral populations. Another important finding is that the southwestern marginal populations were genetically differentiated from the other populations. Conclusions: These differences might be due to genetic drift in the small and isolated populations at the range margin. Therefore, our results indicated that the central-marginal hypothesis held true for the southernmost A. sachalinensis populations in Hokkaido.

1. Introduction

The spatial distribution of genetic variation provides essential information for conservation programs and management of forest tree species [1]. The geographic distribution center provides favorable biotic and abiotic environments for species persistence. On the contrary, peripheral populations are exposed to unfavorable environmental conditions and the populations at the range margin are smaller and more isolated from each other than those at the range core [2,3,4]. The central-marginal hypothesis states that marginal populations show lower genetic variation and higher differentiation than do central populations (see review [5,6]). The above evidence was obtained from a study of Scots pine [7] and silver fir (Abies alba), which showed a decline in gene diversity among the western margin populations [8].
Long-lived plant species are sessile organisms and their survival is attributed to their adaptation to the local environment. Such adaptation processes inevitably involve genetic changes in local populations [9]. However, genetic variation in a local population is influenced by phylogenetic constraints and the population history of selection under environmental constraints. Genetic markers are, therefore, useful for inferring the genetic structure of local populations. They are also useful for inferring adaptability to similar environments according to similarities in genetic characteristics, as geographic genetic variations reflect the results of selection and adaptation to the local environment [10].
Sub-boreal conifer species play an important role in the sustainability of its forest ecosystems across the northern hemisphere. Abies sachalinensis is a major sub-boreal conifer in East Asia. The geographical distribution of A. sachalinensis ranges from Sakhalin in the north, to the southern Kuril Islands in the east, and Hokkaido, the northernmost island of the Japanese Archipelago, in the south [11,12]. The species often occurs across a broad altitudinal range; namely, from sea level to 1500 m a.s.l. It is one of the major conifers of the montane forest in Hokkaido and often forms mixed forests with other conifers, such as Picea jezoensis, P. glehnii, and broadleaf species, such as Quercus mongolica var. crispula, Betula ermanii, Fagus crenata, and Tilia japonica. At its southern and western distribution, A. sachalinensis is scarce, whereas it is abundant in the northern and eastern regions [13,14]. However, the distribution center of A. sachalinensis, including genetic core populations, has not yet been determined to date.
The species has been known to show both regional geographic and altitudinal variations in morphological traits [15,16,17]. Kurahashi and Hamaya [15] earlier noticed a wide variety of altitudinal differences in growth traits. This phenomenon was later revealed to be the result of adaptation to the local environment of the establishment sites [18]. Ishizuka et al. [19] confirmed that the altitudinal gradient of the autumn phenology related to cold tolerance was genetically controlled. Further, Goto et al. [20] found natural selection at the QTL (quantitative trait loci) of phenological traits across altitudinal differences. Hatakeyama [16] reported that regional differences in morphological traits were closely related to the snow-related climatic conditions based on a common garden experiment. Further, Eiga [17] reported regional genetic clines in both the altitudinal differences and longitudinal range differences in cold tolerance in Hokkaido, which are attributable to the level of snow acclimation at the establishment sites. A longitudinal gradient was also observed in allozyme variations [21]. Moreover, Suyama et al. [22] suggested a single lineage based on the cpDNA sequence of A. sachalinensis among Hokkaido populations. However, due to the limited numbers of populations and loci, the regional genetic relationships among A. sachalinensis populations in Hokkaido have not yet been resolved.
In this study, we investigated regional geographic variations in A. sachalinensis in Hokkaido by EST-SSR polymorphism with a special emphasis on the southern range marginal population. We sought to answer two questions; is the central-marginal hypothesis applicable to A. sachalinensis? And does the environmental gradient affect genetic clines as indicated by Nagasaka et al. [21]?

2. Materials and Methods

We chose 25 natural populations of A. sachalinensis from across the island of Hokkaido and a total of 1189 mature individuals as sample trees (Figure 1, Table 1). Total DNA was extracted from 100 mg of fresh needle leaves by the DNeasy Plant Mini Kit (QIAGEN K. K., Tokyo, Japan).
We analyzed the previously reported 11 EST-SSR loci: Aat01, Aat02, Aat04, Aat05, Aat06, Aat08, Aat09, Aat10, Aat11, Aat13, Aat15 [23]. In addition, we developed 8 new EST-SSR markers from A. sachalinensis transcriptome data. All the transcript sequences (158,542) from TodoFirGene [24] were used as input for the CMIB (CD-HIT-EST, MISA, ipcress and BlastCLUST) pipeline [25] to obtain PCR primers for amplifying unique microsatellite sequences with the number of repeat units ≥ 6, 5, 4, 3, and 3 for di-, tri-, tetra-, penta-, and hexa-simple sequence repeats (SSRs), respectively. For each primer pair, genomic DNA from one individual was used to check PCR amplification. PCR reactions were carried out following the standard protocol included in the QIAGEN Multiplex PCR Kit (QIAGEN, Hilden, Germany). For the primer pairs that exhibited clear microsatellite peaks at the expected fragment length, the extracted DNA of 32 individuals of A. sachalinensis representative of the species’ range was used to evaluate EST-SSR polymorphism. Among them, 8 polymorphic markers, Egm1005, Egm14860, Egm16822, Egm26233, Egm4191, Egm4389, Egm5979, and Egm55338, were used for the following analysis. Genotyping data has been deposited in the TreeGenes Database under accession number TGDR252.
PCR was carried out with a Type-it Microsatellite PCR Kit (QIAGEN K. K., Tokyo, Japan). Fragment analyses were performed by ABI 3130-xl Genetic Analyzer, 600 LIZ size standard, and GENESCAN for Windows (Thermo Fischer Scientific, Tokyo, Japan).
We used GenoDive ver. 2.0b17 [26] to calculate the following genetic parameters; observed (HO), expected heterozygosity (HE), total heterozygosity (HT), inbreeding coefficient (GIS), genetic differentiation (G’ST), number of alleles (Na), effective number of alleles (Nef), and Nei’s genetic distance (D). Principal component analysis (PCA) was conducted to clarify the genetic relationship among populations using the same software. Four genetic diversity parameters; number of alleles, effective number of alleles, HE, and GIS, were then spatially interpolated by kriging [27] using R [28] and laid out on the contour map. A neighbornet phylogenetic tree based on Nei’s genetic distance was drawn using SplitsTree4 ver. 4.14.6 [29].
The climatic conditions for each population were estimated by the Mesh Climate Data 2000 [30]. We calculated the following environmental factors; WI, warmth index; CI, cold index; TMC, mean minimum temperature of the coldest month; PRS, precipitation in summer (May to September); PRW, precipitation in winter (October to April); MSD, maximum snow depth; WinSR, solar radiation in winter (October to April); SprSR, solar radiation in spring (May); SumSR, solar radiation in summer (June to August); and AutSR, solar radiation in autumn (September). Classification of four seasons for solar radiation was determined based on the regression coefficient (r > 0.7) between months (Table S1).

3. Results

The 19 EST-SSR loci used in this study were polymorphic, with the number of alleles ranging from 2 to 13 (Table S2). The genetic diversity (HE) of the 25 populations ranged from 0.313 to 0.424, and the overall HE was 0.398. The G’ST ranged from −0.105 to 0.110, and the overall value was 0.016 (Table S2). Each genetic diversity parameter, along with the 95% confidence interval for the 25 populations, is shown in Figure S1. The effective number of alleles and HE did not differ significantly among the populations. The number of alleles of P22 was significantly lower than those of P3, P4, P5, P12, P15, P17, P18, and P19, and the GIS of P21was significantly lower than that of P15 (Figure S1). The geographic patterns of genetic diversity were represented by contour diagrams (Figure 2). All four parameters showed longitudinal gradients; that is, the eastern populations showed higher values for the genetic diversity parameters (Figure 3). In addition, the four genetic parameters for each locus are shown in Figures S2–S5. Most of the loci showed eastward increases in genetic parameters, but several of them, for example, Aat09, Aat10, and Egm1005, showed opposite results for the effective number of alleles and HE (Figures S2 and S4).
Pairwise differentiation matrices between populations by GST (Table S3) revealed significant differentiation between the isolated populations (P19, P22) and southwestern populations (P20–21, P23–25) and the rest of the populations.
Principle component analysis by covariance matrix revealed that the plots of the geographically peripheral populations (P19 to P25) were in outlying positions on the first and second axis plane (Figure 4). The plots of the southern populations, in particular, showed smaller Co1 and larger Co2 scores (grouped within the dotted line in Figure 4). P19 and P21 showed the highest Co1 and the lowest Co2 scores, respectively. The other populations did not show any geographical clustering and were located at the center of the axis plane.
The phylogenetic relationships of the 25 populations are shown by neighbornet tree based on Nei’s genetic distances (Figure 5). The tree shows that the plots of the geographically peripheral populations (P19 to P25) were in outlying positions. Moreover, the southern populations were placed on the same branch (grouped within the dotted line in Figure 5). The southernmost population (P22) was located at the furthest position in the cluster made up of the southern populations. Other geographically peripheral populations, namely, P19 and P25, were clustered to individual branches and were differentiated from the central populations.
An environmental gradient along longitude was found among the climatic conditions for A. sachalinensis populations. The results from the correlation test (Table S4) and principal component analysis (Figure 6) between longitude and climatic conditions indicated negative correlations between longitude and winter precipitation (PRW), maximum snow depth (MSD), mean minimum temperature of the coldest month (TMC), and solar radiation in autumn (AurSR), as well as a positive correlation between longitude and solar radiation in winter (WinSR). Although PRW showed a significant p-value alone after Bonferroni correction (Table S4), the climatic conditions for the 25 populations studied along longitude can be assumed; thus, the eastern populations are characterized by less snow, colder winters, and more solar radiation in winter. On the contrary, the western populations have more snow, warmer winters, and less solar radiation in winter. We did not detect any relationship between solar radiation and precipitation in summer.
In addition, we detected significant relationships between Na and climatic environmental factors (Table S5). We observed that the number of alleles at 10 loci showed significant relationships with climatic factors, with seven of these loci showing significant relationships with more than two factors.

4. Discussion

Central populations are characterized by high genetic diversity due to a large effective population size. In contrast, peripheral populations are often characterized by a small effective population size. Our present results regarding genetic diversity parameters; namely, Na, Nef, and HE, were greater in the northeastern than in the southwestern populations (Figure 2a–c and Figure 3). This indicated that the distribution center of A. sachalinenesis in eastern Hokkaido has greater genetic diversity than do the southwestern peripheral populations. The species distribution model indicated that the suitable habitat for A. sachalinenesis was from central to eastern Hokkaido, and the marginal habitat was on the southwestern Oshima Peninsula [31]. Thus, the northern and eastern parts of Hokkaido can be regarded as the distribution center of this species, as corroborated by the cumulative volume of A. sachalinensis in previous studies [13,14]. The island of Hokkaido includes the southernmost distribution range of A. sachalinensis on its southwestern peninsula. Similar results were obtained for European silver fir, A. alba, which has a long pollen flow distance similar to A. sachalinensis and shows a decline in gene diversity in its western marginal populations [8]. Thus, the central-marginal hypothesis is supported in A. sachalinensis in this study.
On the one hand, the inbreeding coefficient, GIS, also showed the same gradient (Figure 2d and Figure 3). The reason for this tendency has not yet been clarified, but the same tendency has been reported in previous studies of marginal populations of the anemogamous species, Fagus crenata [4]; that is, the smaller the population, the lower the inbreeding coefficient.
Previous studies of A. sachalinensis revealed east-to-west longitudinal genetic clines in morphological traits, resistance against disease, tolerance against environmental conditions by provenance tests [16,17] and allozymes polymorphisms among natural populations [21]. The present study also revealed the same gradient in genetic parameters determined by EST-SSRs. Nagasaka et al. [21] detected significant east–west directional variation patterns in HE, effective number of alleles, and number of alleles based on 4 allozyme loci, and they regarded this variation to be due to temperature and precipitation. A longitudinal gradient in gene diversity can be attributable to the climatic factors at the establishment site [32]. A longitudinal gradient in climatic factors in Hokkaido might involve temperature and snow depth [17,33], with eastern Hokkaido being colder but having less accumulation of snow than southwestern Hokkaido. Okada et al. [34] revealed that the number of winter bud scales of A. sachalinensis differed between the eastern and western populations, and they inferred that this indicated a response to drought hardiness in the winter season. Eiga [17] indicated a longitudinal gradient in freezing resistance in seedlings. These morphological traits might result from the natural selection and adaptation to the local climate, which was one of the major causes of the longitudinal gradient in genetic diversity.
Our results showed that some environmental factors for the 25 populations showed a longitudinal gradient (Table S4, Figure 6). The relationships between the number of alleles and climatic factors were revealed to be significant for 10 EST-SSR loci (Table S5). Among them, the most highly correlated climatic factor was TMC, with the second most being PRW, while PRS and SumSR did not show any significance. This result indicated that the climate conditions in winter were more correlated to genetic traits than were those in summer. Specifically, colder temperatures, less snow, and more solar radiation in the winter and spring were indicative of a greater number of alleles within a population. Several loci were correlated with more than one climatic factor, such as Aat02, Egm26233, and Egm4389 with WI, TMC, and PRW. These climatic factors also showed longitudinal clines (Table S5). Thus, the specific relationships between loci and climate factors could be reflected in the regional differences in gene diversity observed in A. sachalinensis in this study.
Previous studies have revealed relationships between climatic conditions and gene diversity in natural populations of forest tree species. For example, associations between AFLP loci and temperature were observed in Fagus sylvatica [35] and Betula pendula [36]. Grivet et al. [37] found two SNPs that were correlated with temperature in Pinus pinaster and P. halepensis. Annotated EST-SSR loci in Eucalyptus gomphocephala showed clines in allele frequencies for climatic factors, such as solar radiation, potential evaporation, summer precipitation, and aridity [38]. Former studies of allozyme variation also revealed adaptive differentiation in conifer species (e.g., [39]). Not only allele frequencies but also the heterozygosity of an individual is often associated with fitness among a changing environment (e.g., [40]). Correlations have been reported between growth rate and heterozygosity in Populus tremuloides [41] and survivorship and heterozygosity in Picea jezoensis [42]. It has been observed that the heterozygosity of a population influences its productivity, fitness, and stability [40,43,44]. Indeed, genetic diversity was affected by many other factors, such as demographic history and genetic drift, and we have to wait for association analyses, such as the outlier test, to reveal the natural selection of certain alleles against the environment for A. sachalinensis.
Another interesting issue regarding the longitudinal gradient was the observed counteraction among individual loci (Figures S2–S4). Most of the loci showed higher genetic diversity in the eastern than in the western populations, but several loci showed an opposite trend. This might offer evidence of opposite selection or adaptation forces to the environmental gradient between different loci. Currently, we are not able to clarify this discrepancy, but it is likely that these loci were affected by the selective sweep of adaptive genes [45,46] as the loci used in this study were EST-SSR, whose primers were developed among the sequences in close proximity to expressed gene sequences.
STRUCTURE analysis [47] by F-model with 70,000 burn-in and 30,000 MCMC detected differences in the admixture coefficient between the southwestern and the other populations (Figure S6) but did not indicate any regionally specific ancestral clusters among the 25 populations. This might be attributable to the long pollen flow distance of anemogamous species such as A. sachalinensis. A long distance gene flow may result in gene mixture and lead to homogeneous gene pools among populations [48]. It is also known that two major spruce species in Hokkaido, P. jezoensis and P. glehnii, demonstrate homogeneous gene pools in Hokkaido [49,50]. In this regard, anemogamous conifer species can be said to generally show homogeneous gene pools among local populations in Hokkaido.
However, there is evidence of genetic differentiation between the southwestern populations and the rest of the populations. The results from PCA revealed that the southern peripheral populations were differentiated from the other central populations (Figure 4). Geographic isolation of some populations was reflected in the PCA. P20 is located in a volcanic region so that the forest soil is composed of volcanic ash or pumice as the base materials. Due to recent volcanic activity, the continuity of the species distribution might also be interrupted. P21 is located in a deep ravine at the tip of a peninsula and P19 in a coastal area, with both populations being isolated from other A. sachalinensis populations. Therefore, P19, P20, and P21 were plotted at the periphery of the PCA plane due to their geographic isolation (Figure 4).
The phylogenetic tree indicated that the six southernmost populations, P20 to P25, were differentiated from the other populations (Figure 5). These results indicated that the populations of the southernmost distribution were highly differentiated from the other populations. This finding is consistent with the previous studies based on morphological traits [34], allozyme variations [21], and organelle DNA haplotypes [51].
The high genetic divergence of southernmost populations may be also explained by the fossil pollen record in southwestern Hokkaido [52], which revealed that Abies, supposedly A. sachalinensis, that had dominated sub-boreal forests was completely replaced by cool temperate forest at the end of the last glacial period (10,000 yrs. BP), indicating that the southwestern populations became smaller and more isolated from each other at that time. Pairwise differentiation by GST indicated significantly high values in the southwestern populations (Table S3). These relic populations might have lost gene exchange with the distributional center. This would cause a genetic drift that affected the genetic structure of the small, isolated populations on the distribution periphery. In addition, southwestern Hokkaido is made up of a long, narrow peninsula, which can be a topographical barrier against the frequent exchange of individuals.
In conclusion, the central-marginal hypothesis that marginal populations show less genetic variation and higher differentiation than do central populations [4,5,6] was found to be relevant to natural populations of A. sachalinensis in Hokkaido, with the southwestern populations being highly differentiated from the other populations. In addition, the longitudinal genetic cline revealed by Nagasaka et al. [21] was supported by the 19 EST-SSR markers in this study. This cline may be related to adaptation to the environmental gradient in Hokkaido.

5. Conclusions

We analyzed the genetic diversity of 25 natural populations of a major sub-boreal conifer, Abies sachalinensis, including the species distribution range from its center to its southern margin. Nineteen EST-SSR loci were applied and revealed that the genetic diversity parameters were higher among the eastern populations and lower among the southwestern ones. This result supported the central-marginal hypothesis that the distribution center possesses higher gene diversity because the eastern populations are located in the core of species distribution. Phylogenetic analysis revealed that the marginal populations at the southern range limit showed further genetic distances from the central populations. The eastern to southwestern gradient of genetic diversity indicated a relationship to the species’ adaptation to certain environmental factors.

Supplementary Materials

The following are available online at https://www.mdpi.com/1999-4907/11/2/233/s1, Figure S1: Genetic diversity parameters for the 25 populations. Bars indicate the 95% confidence intervals, Figure S2: Relationships among number of alleles and longitude east. Lines indicate the least squares, Figure S3: Relationships among effective number of alleles and longitude east. Lines indicate the least squares, Figure S4: Relationships among HE and longitude east. Lines indicate the least squares, Figure S5: Relationships among GIS and longitude east. Lines indicate the least squares, Figure S6: STRUCTURE results from K = 2 to 4. Populations are arranged from SW (left) to NE (right), Table S1: Climatic conditions for the 25 populations of A. sachalinensis used in this study, Table S2: Gene diversity among 19 EST-SSR loci used in this study, Table S3: Pairwise differentiation matrices by GST (lower triangle) and p-values (upper triangle) between populations, Table S4: Correlation analysis between longitude and selected environmental factors for the 25 populations of A. sachalinensis, Table S5: Regression coefficients between environmental factors and the number of alleles for each locus.

Author Contributions

Conceptualization, G.S., K.K., and I.W.; methodology, K.K., U.K., and U.S.; formal analysis, K.K.; investigation, K.K., U.K., I.W., T.I., and G.S.; writing—original draft preparation, K.K.; writing—review and editing, G.S., K.K., U.K., I.W., T.I., and U.S. All authors have read and agree to the published version of the manuscript.

Funding

This research was funded by a Grant-in-Aid for Scientific Research from the Japan Society for the Promotion of Science, grant number 16H02554 and 16H06279 (PAGS).

Acknowledgments

We thank T. Kawahara and A. Takazawa for their technical support.

Conflicts of Interest

The authors declare no conflict of interest.

References

  1. Petit, R.J.; El-Mousadik, A.; Pons, O. Identifying populations for conservation on the basis of genetic markers. Conserv. Biol. 1998, 12, 844–855. [Google Scholar] [CrossRef]
  2. Brown, J.H. On the relationship between abundance and distribution of species. Am. Nat. 1984, 124, 255–279. [Google Scholar] [CrossRef]
  3. Sagarin, R.D.; Gaines, S.D. The ‘abundant centre’ distribution: To what extent is it a biogeographical rule? Ecol. Lett. 2002, 5, 137–147. [Google Scholar] [CrossRef]
  4. Kitamura, K.; Matsui, T.; Kobayashi, M.; Saitou, H.; Namikawa, K.; Tsuda, Y. Decline in gene diversity and strong genetic drift in the northward-expanding marginal populations of Fagus crenata. Tree Genet. Genomes. 2015, 11, 36. [Google Scholar] [CrossRef]
  5. Eckert, C.G.; Samis, K.E.; Lougheed, S.C. Genetic variation across species’ geographical ranges: The central-marginal hypothesis and beyond. Mol. Ecol. 2008, 17, 1170–1188. [Google Scholar] [CrossRef]
  6. Arnaud-Haond, S.; Teixeira, S.; Massa, S.I.; Billot, C.; Saenger, P.; Coupland, G.; Duarte, C.M.; Serrao, E.A. Genetic structure at range edge: Low diversity and high inbreeding in Southeast Asian mangrove (Avicennia marina) populations. Mol. Ecol. 2006, 15, 3515–3525. [Google Scholar] [CrossRef]
  7. Tóth, E.G.; Vendramin, G.G.; Bagnoli, F.; Cseke, K.; Höhn, M. High genetic diversity and distinct origin of recently fragmented Scots pine (Pinus sylvestris L.) populations along the Carpathians and the Pannonian Basin. Tree Genet. Genomes 2017, 13, 47. [Google Scholar]
  8. Dobrowolska, D.; Bončina, A.; Klumpp, R. Ecology and silviculture of silver fir (Abies alba Mill.): A review. J. For. Res. 2017, 22, 326–335. [Google Scholar] [CrossRef]
  9. Young, A.; Boyle, T.; Brown, T. The population genetic consequences of habitat fragmentation for plants. Trends Ecol. Evol. 1996, 11, 413–418. [Google Scholar] [CrossRef]
  10. Petit, R.J.; Bialozyt, R.; Garnier-Géré, P.; Hampe, A. Ecology and genetics of tree invasions: From recent introductions to Quaternary migrations. For. Ecol. Manag. 2004, 197, 117–137. [Google Scholar] [CrossRef]
  11. Tatewaki, M. Forest ecology of the islands of the north Pacific ocean. J. Fac. Agric. Hokkaido Univ. 1958, 50, 341–486. [Google Scholar]
  12. Kitamura, S.; Murata, G. Colored Illustrations of Woody Plants of Japan Volume II; Hoikusya Co., Ltd.: Osaka, Japan, 1979; p. 545. [Google Scholar]
  13. Matsuda, S. Distribution status of Abies sachalinensis and Picea jezoensis in the Hokkaido national forest. Hokkaido Ringyo Kaiho 1936, 34, 351–361. [Google Scholar]
  14. Matsui, T.; Kitamura, K.; Saito, H.; Namikawa, K.; Terazawa, K.; Haruki, M.; Itaya, A.; Honma, Y.; Miyoshi, Y.; Uchida, K.; et al. Habitat and vegetation of an outlying Fagus crenata population in its northern range limit at Rebunge Pass, Hokkaido. J. Phyto. Taxon. 2012, 59, 113–123. [Google Scholar]
  15. Kurahashi, A.; Hamaya, T. Variation of morphological characters and growth response of Saghalin fir (Abies sachalinensis) in different altitude. Bull. Tokyo Univ. For. 1981, 71, 101–151. [Google Scholar]
  16. Hatakeyama, S. Genetical and breeding studies on the regional differences of interprovenance variation in Abies sachalinensis Mast. Bull. Hokkaido For. Exp. Stn. 1981, 19, 1–91. [Google Scholar]
  17. Eiga, S. Ecological study on the freezing resisntace of Saghalin fir (Abies sachalinensis Mast.) in Hokkaido. Bull. For. Tree Breed. Inst. 1984, 2, 61–107. [Google Scholar]
  18. Ishizuka, W.; Goto, S. Modeling intraspecific adaptation of Abies sachalinensis to local altitude and responses to global warming, based on a 36-year reciprocal transplant experiment. Evol. Appl. 2012, 5, 229–244. [Google Scholar] [CrossRef]
  19. Ishizuka, W.; Ono, K.; Hara, T.; Goto, S. Use of intraspecific variation in thermal responses for estimating an elevational cline in the timing of cold hardening in a sub-boreal conifer. Plant Biol. 2015, 17, 177–185. [Google Scholar] [CrossRef]
  20. Goto, S.; Kajiya-Kanegae, H.; Ishizuka, W.; Kitamura, K.; Ueno, S.; Hisamoto, Y.; Kudoh, H.; Yasugi, M.; Nagano, A.J.; Iwata, H. Genetic mapping of local adaptation along the altitudinal gradient in Abies sachalinensis. Tree Genet. Genomes 2017, 13, 104. [Google Scholar] [CrossRef]
  21. Nagasaka, K.; Wang, Z.M.; Tanaka, K. Genetic variation among natural Abies sachalinensis population in relation to environmental gradients in Hokkaido, Japan. For. Genet. 1997, 4, 43–50. [Google Scholar]
  22. Suyama, Y.; Yoshimaru, H.; Tsumura, Y. Molecular phylogenetic position of Japanese Abies (Pinaceae) based on chloroplast DNA sequences. Mol. Phylogenetics Evol. 2000, 16, 271–277. [Google Scholar] [CrossRef] [PubMed]
  23. Postolache, D.; Leonarduzzi, C.; Piotti, A.; Spanu, I.; Roig, A.; Fady, B.; Roschanski, A.; Liepelt, S.; Vendramin, G.G. Transcriptome versus genomic microsatellite markers: Highly informative multiplexes for genotyping Abies alba Mill. and congeneric species. Plant Mol. Biol. Rep. 2014, 32, 750–760. [Google Scholar] [CrossRef]
  24. Ueno, S.; Nakamura, Y.; Kobayashi, M.; Terashima, S.; Ishizuka, W.; Uchiyama, K.; Tsumura, Y.; Yano, K.; Goto, S. TodoFirGene: Developing transcriptome resources for genetic analysis of Abies sachalinensis. Plant Cell Physiol. 2018, 59, 1276–1284. [Google Scholar] [CrossRef] [PubMed]
  25. Ueno, S.; Moriguchi, Y.; Uchiyama, K.; Ujino-Ihara, T.; Futamura, N.; Sakurai, T.; Shinohara, K.; Tsumura, Y. A second generation framework for the analysis of microsatellites in expressed sequence tags and the development of EST-SSR markers for a conifer, Cryptomeria japonica. BMC Genom. 2012, 13, 136. [Google Scholar] [CrossRef] [Green Version]
  26. Meirmans, P.G.; Van Tienderen, P.H. GENOTYPE and GENODIVE: Two programs for the analysis of genetic diversity of asexual organisms. Mol. Ecol. Notes. 2004, 4, 792–794. [Google Scholar] [CrossRef]
  27. Mase, S. Geostatistics and Kriging Method; Ohmsha: Tokyo, Japan, 2010. [Google Scholar]
  28. R Core Team. A Language and Environment for Statistical Computing; R Foundation for Statistical Computing: Vienna, Austria, 2016; Available online: https://www.R-project.org/ (accessed on 18 July 2018).
  29. Huson, D.H.; Bryant, D. Application of phylogenetic networks in evolutionary studies. Mol. Biol. Evol. 2006, 23, 254–267. [Google Scholar] [CrossRef]
  30. The Japan Meterological Agency. Mesh Climate Data 2000, CD-ROM; The Japan Meterological Agency: Tokyo, Japan, 2002. [Google Scholar]
  31. Tanaka, N.; Nakao, K.; Tsuyama, I.; Matsui, T. Assessing impact of climate warming on potential habitats of ten conifer species in Japan. AIRIES 2009, 14, 153–164. [Google Scholar]
  32. Conord, C.; Gurevitch, J.; Fady, B. Large-scale longitudinal gradients of genetic diversity: A meta-analysis across six phyla in the Mediterranean basin. Ecol. Evol. 2012, 2, 2600–2614. [Google Scholar] [CrossRef]
  33. Yokota, S. Scleroderris canker of Todo-fir in Hokkaido, Northern Japan. Eur. J. For. Path. 1975, 5, 13–21. [Google Scholar] [CrossRef]
  34. Okada, S.; Mukaide, H.; Sakai, A. Genetic variation in Saghalien fir from different areas of Hokkaido. Silvae Genet. 1973, 22, 1–2. [Google Scholar]
  35. Jump, A.S.; Hunt, J.M.; Martínez-Izquierdo, J.A.; Peñuelas, J. Natural selection and climate change: Temperature-linked spatial and temporal trends in gene frequency in Fagus sylvatica. Mol. Ecol. 2006, 15, 3469–3480. [Google Scholar] [CrossRef] [PubMed]
  36. Kelly, C.K.; Chase, M.W.; De Bruijn, A.; Fay, M.F.; Woodward, F.I. Temperature-based population segregation in birch. Ecol. Lett. 2003, 6, 87–89. [Google Scholar] [CrossRef]
  37. Grivet, D.; Sebastiani, F.; Alía, R.; Bataillon, T.; Torre, S.; Zabal-Aguirre, M.; Vendramin, G.G.; González-Martínez, S.C. Molecular footprints of local adaptation in two Mediterranean conifers. Mol. Biol. Evol. 2010, 28, 101–116. [Google Scholar] [CrossRef] [PubMed] [Green Version]
  38. Bradbury, D.; Smithson, A.; Krauss, S.L. Signatures of diversifying selection at EST-SSR loci and association with climate in natural Eucalyptus populations. Mol. Ecol. 2013, 22, 5112–5129. [Google Scholar] [CrossRef] [PubMed]
  39. Jump, A.S.; Peñuelas, J. Running to stand still: Adaptation and the response of plants to rapid climate change. Ecol. Lett. 2005, 8, 1010–1020. [Google Scholar] [CrossRef]
  40. Jump, A.S.; Marchant, R.; Peñuelas, J. Environmental change and the option value of genetic diversity. Trends Plant Sci. 2009, 14, 51–58. [Google Scholar] [CrossRef] [PubMed]
  41. Mitton, J.B.; Grant, M.C. Observations on the ecology and evolution of quaking aspen, Populus tremuloides, in the Colorado front range. Am. J. Bot. 1980, 67, 202–209. [Google Scholar] [CrossRef] [Green Version]
  42. Okada, M.; Kitamura, K.; Lian, C.; Goto, S. The effects of multilocus heterozygosity on the longevity of seedlings established on fallen logs in Picea jezoensis and Abies sachalinensis. Open J. For. 2015, 5, 422–430. [Google Scholar]
  43. Leimu, R.; Mutikainen, P.I.A.; Koricheva, J.; Fischer, M. How general are positive relationships between plant population size, fitness and genetic variation? J. Ecol. 2006, 94, 942–952. [Google Scholar] [CrossRef]
  44. Mitton, J.B.; Grant, M.C. Associations among protein heterozygosity, growth rate, and developmental homeostasis. Annu. Rev. Ecol. Syst. 1984, 15, 479–499. [Google Scholar] [CrossRef]
  45. Smith, J.M.; Haigh, J. The hitch-hiking effect of a favourable gene. Genet. Res. 1974, 23, 23–35. [Google Scholar] [CrossRef] [PubMed] [Green Version]
  46. Kado, T.; Yoshimaru, H.; Tsumura, Y.; Tachida, H. DNA variation in a conifer, Cryptomeria japonica (Cupressaceae sensu lato). Genetics 2003, 164, 1547–1559. [Google Scholar] [PubMed]
  47. Pritchard, J.K.; Stephens, M.; Donnelly, P. Inference of Population Structure Using Multilocus Genotype Data. Genetics 2000, 155, 945. [Google Scholar] [PubMed]
  48. Leonarduzzi, C.; Piotti, A.; Spanu, I.; Vendramin, G.G. Effective gene flow in a historically fragmented area at the southern edge of silver fir (Abies alba Mill.) distribution. Tree Genet. Genomes 2016, 12, 95. [Google Scholar] [CrossRef]
  49. Iwaizumi, M.G.; Aizawa, M.; Watanabe, A.; Goto, S. Highly polymorphic nuclear microsatellite markers reveal detailed patterns of genetic variation in natural populations of Yezo spruce in Hokkaido. J. For. Res. 2015, 20, 301–307. [Google Scholar] [CrossRef] [Green Version]
  50. Aizawa, M.; Yoshimaru, H.; Takahashi, M.; Kawahara, T.; Sugita, H.; Saito, H.; Sabirov, R.N. Genetic structure of Sakhalin spruce (Picea glehnii) in northern Japan and adjacent regions revealed by nuclear microsatellites and mitochondrial gene sequences. J. Plant Res. 2015, 128, 91–102. [Google Scholar] [CrossRef]
  51. Hayashi, E.; Ubukata, M.; Iizuka, K.; Itahana, N. Genetic differentiation of organelle DNA polymorphisms in Sakhalin fir from Hokkaido. For. Genet. 2000, 7, 31–38. [Google Scholar]
  52. Takiya, M.; Hagiwara, N. Vegetational history of Mt. Yokotsudake, southwestern Hokkaido, since the Last Glacial. Quat. Res. 1997, 36, 217–234. [Google Scholar] [CrossRef] [Green Version]
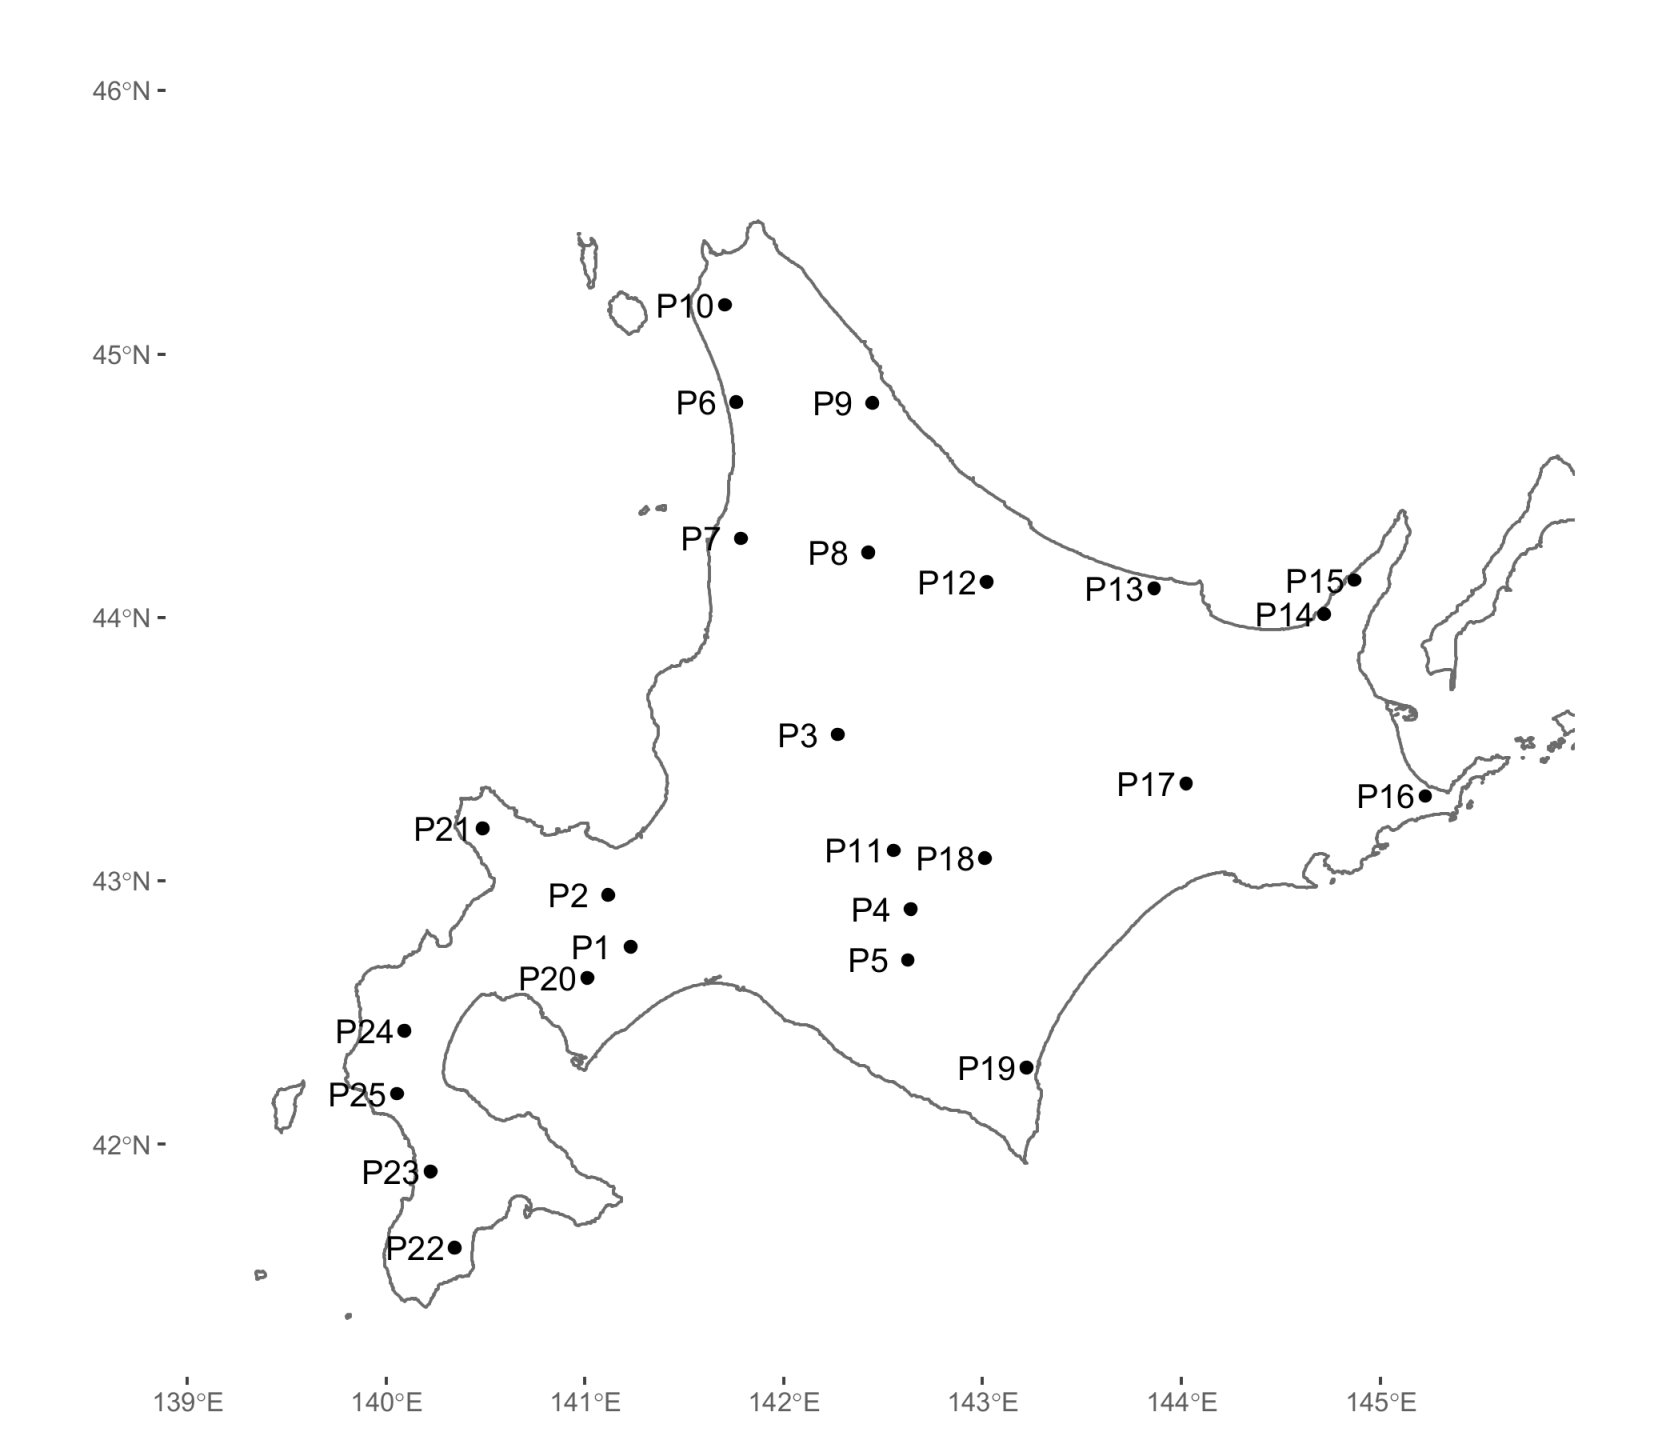
Figure 1. Locations of the 25 natural populations of Abies sachalinensis used in this study.
Forests 11 00233 g001
Figure 2. Spatial contour maps of four genetic parameters, the number of alleles (a), effective number of alleles (b), HE (c), and GIS (d), measured for the 25 natural populations. Dots indicate study sites (cf., Table 1, Figure 1).
Forests 11 00233 g002
Figure 3. Relationships among genetic parameters and longitude east. Lines indicate the least squares.
Forests 11 00233 g003
Figure 4. Principle component analysis based on the covariance matrix of the 25 populations. The first (Co1) and second (Co2) axes’ % of variances are in parentheses. Southern range populations are grouped by the dotted line.
Forests 11 00233 g004
Figure 5. Neighbornet tree among the 25 populations based on Nei’s genetic distances. Southern range populations are grouped by the dotted line.
Forests 11 00233 g005
Figure 6. Principal component analysis using longitude and selected environmental factors for 25 populations of A. sachalinensis.
Forests 11 00233 g006
Table 1. Study sites of Abies sachalinensis populations in Hokkaido, northern Japan.
Population IDLongitude East (°)Latitude North (°)Alt 1 (m)N 2Nttl_a 3Na 4Nef 5HOHEGIS
P1141.236542.769180044683.5791.8150.3850.383−0.006
P2141.120142.966358048663.4741.9750.3790.4100.074
P3142.322143.568530050753.9471.8710.3830.4010.044
P4142.685142.900393047753.9471.9280.4080.4170.021
P5142.665642.707270048733.8421.9620.4190.418−0.003
P6141.808044.8361546703.6841.8620.3560.3820.067
P7141.825544.31879048713.7371.9780.3940.4090.038
P8142.498644.258128548723.7891.9640.4190.409−0.025
P9142.535644.825526048673.5261.9080.3920.386−0.016
P10141.752145.20641048663.4741.9160.3890.3950.014
P11142.603343.125036043683.5791.9300.3870.3960.024
P12143.121844.136525048764.0002.0000.3990.4220.054
P13144.002544.093020048733.8421.9030.3950.4000.014
P14144.891243.96767348703.6841.9650.3760.4110.085
P15145.059544.090710047774.0531.9160.3550.3990.110
P16145.373143.25882048703.6841.8880.3820.4070.062
P17144.132143.348295048774.0531.9750.3770.4160.093
P18143.075243.087475048753.9471.9040.3920.4090.041
P19143.262042.28817348753.9472.0220.3800.4240.102
P20141.012442.651845048693.6321.8870.3930.4020.023
P21140.467843.218320048623.2631.9340.4250.385−0.105
P22140.339741.62399048472.4741.7680.3120.3130.001
P23140.213541.913247048623.2631.8030.3790.374−0.014
P24140.072742.446862048673.5261.8970.3890.3930.010
P25140.037942.207310048663.4741.9390.3780.3840.017
Overall 1189 0.3860.3980.030
1 Altitude, 2 number of individuals analyzed, 3 total number of alleles, 4 number of alleles, 5 effective number of alleles.

