Prioritizing Invasive Forest Plant Management Using Multi-Criteria Decision Analysis in Minnesota, USA


Abstract
:1. Introduction
2. Materials and Methods
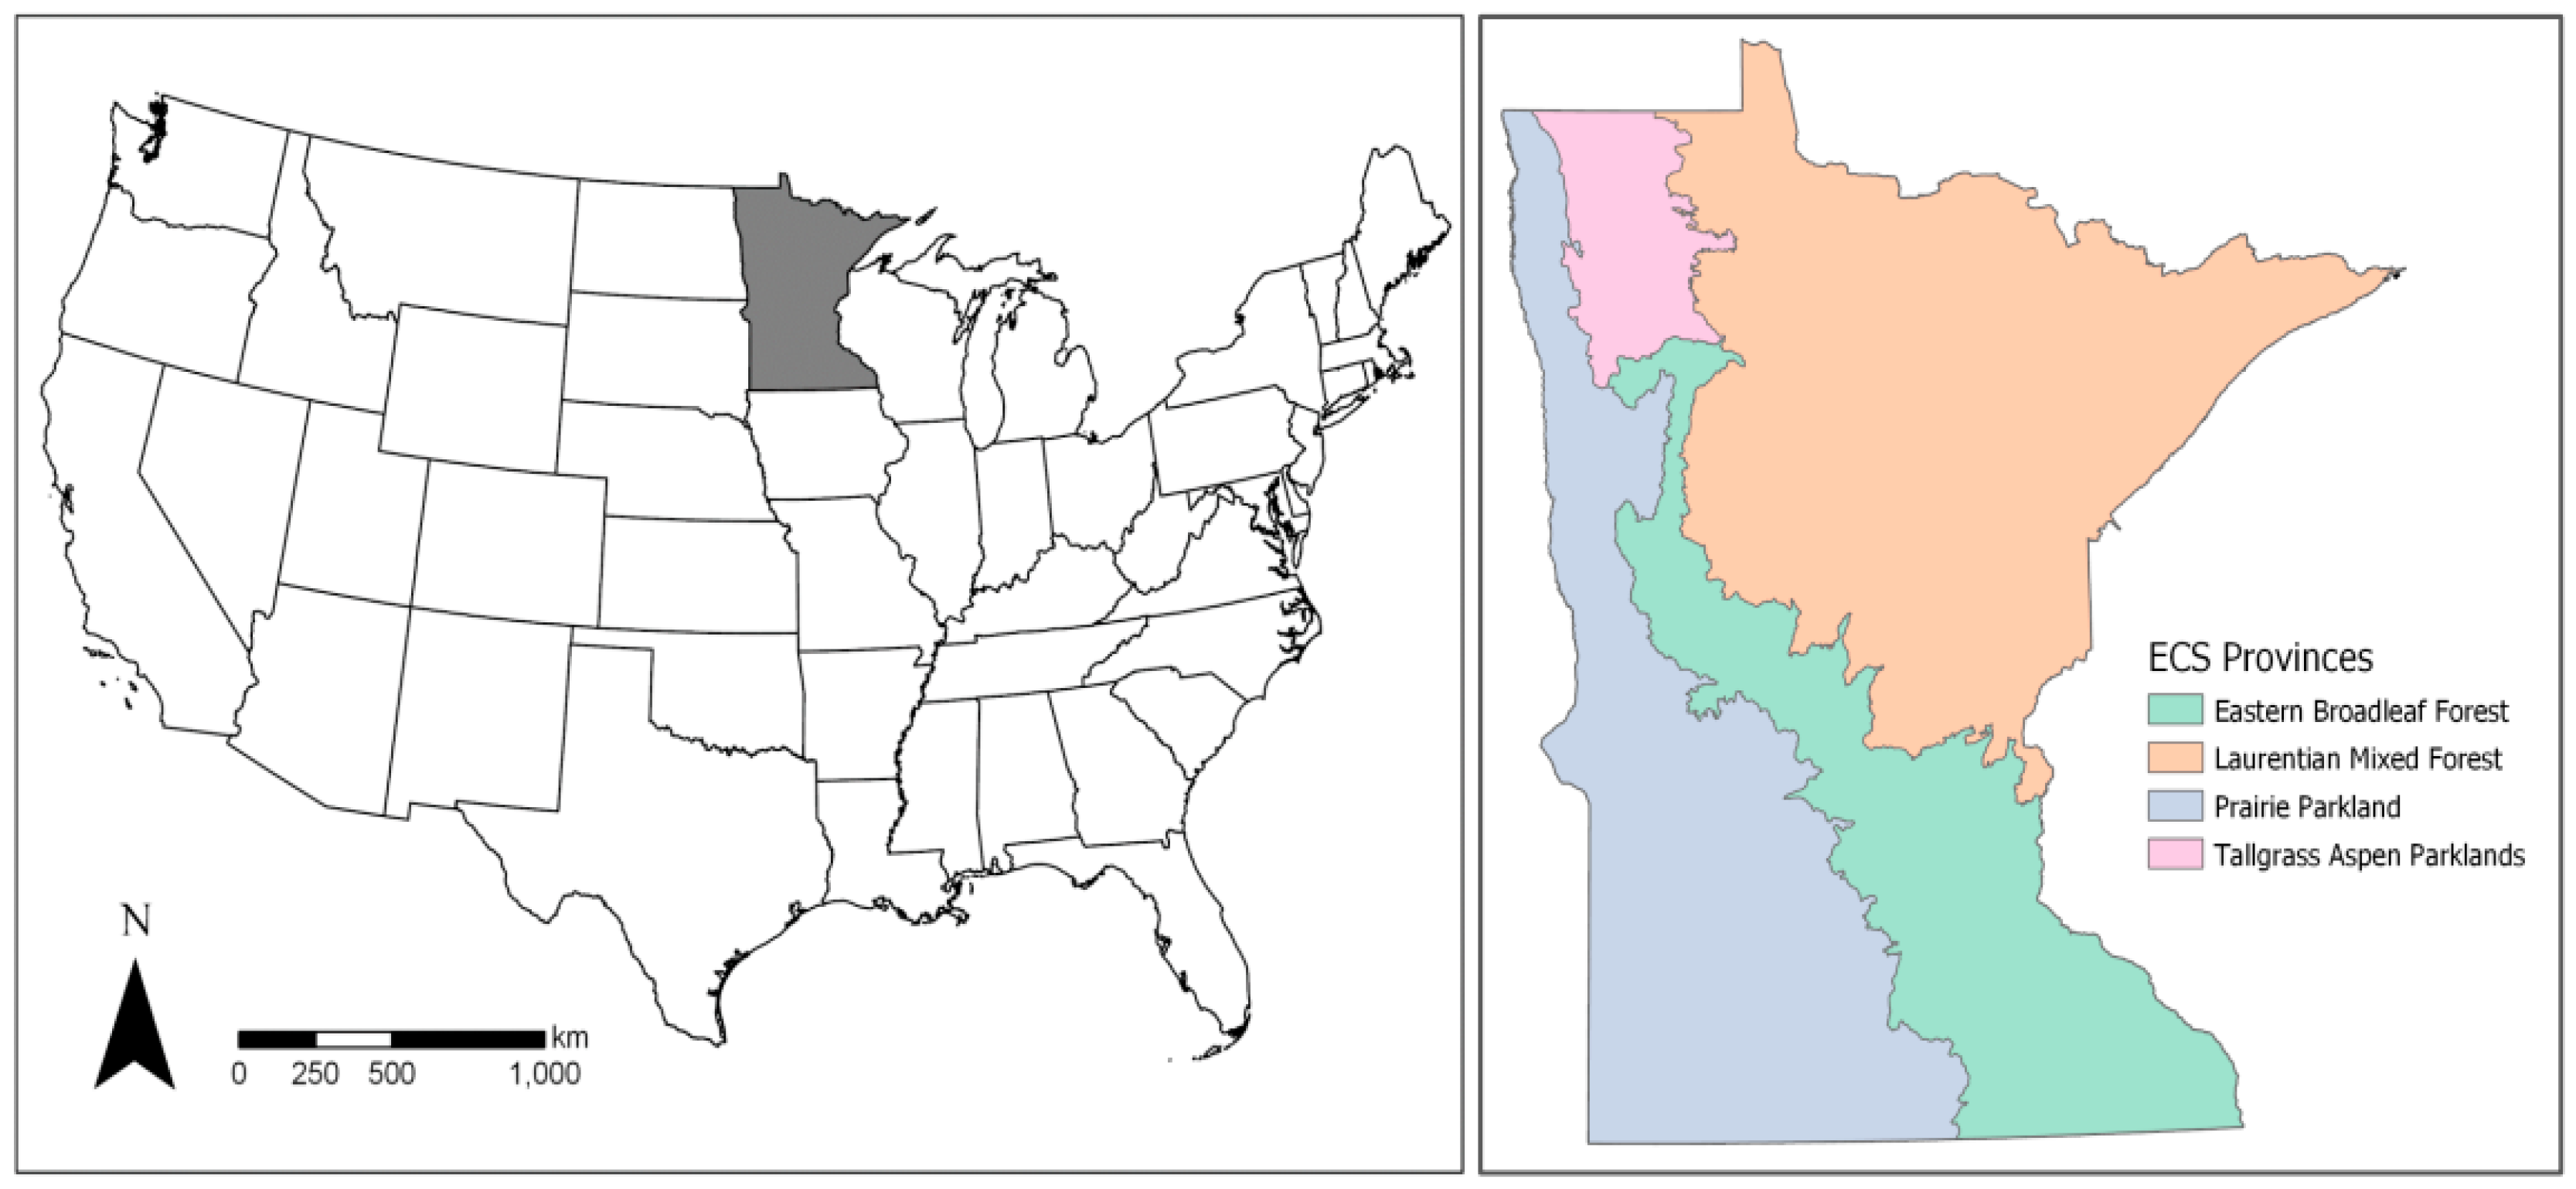
2.1. Study Area and Species
2.2. Data and Processing
2.3. Analysis
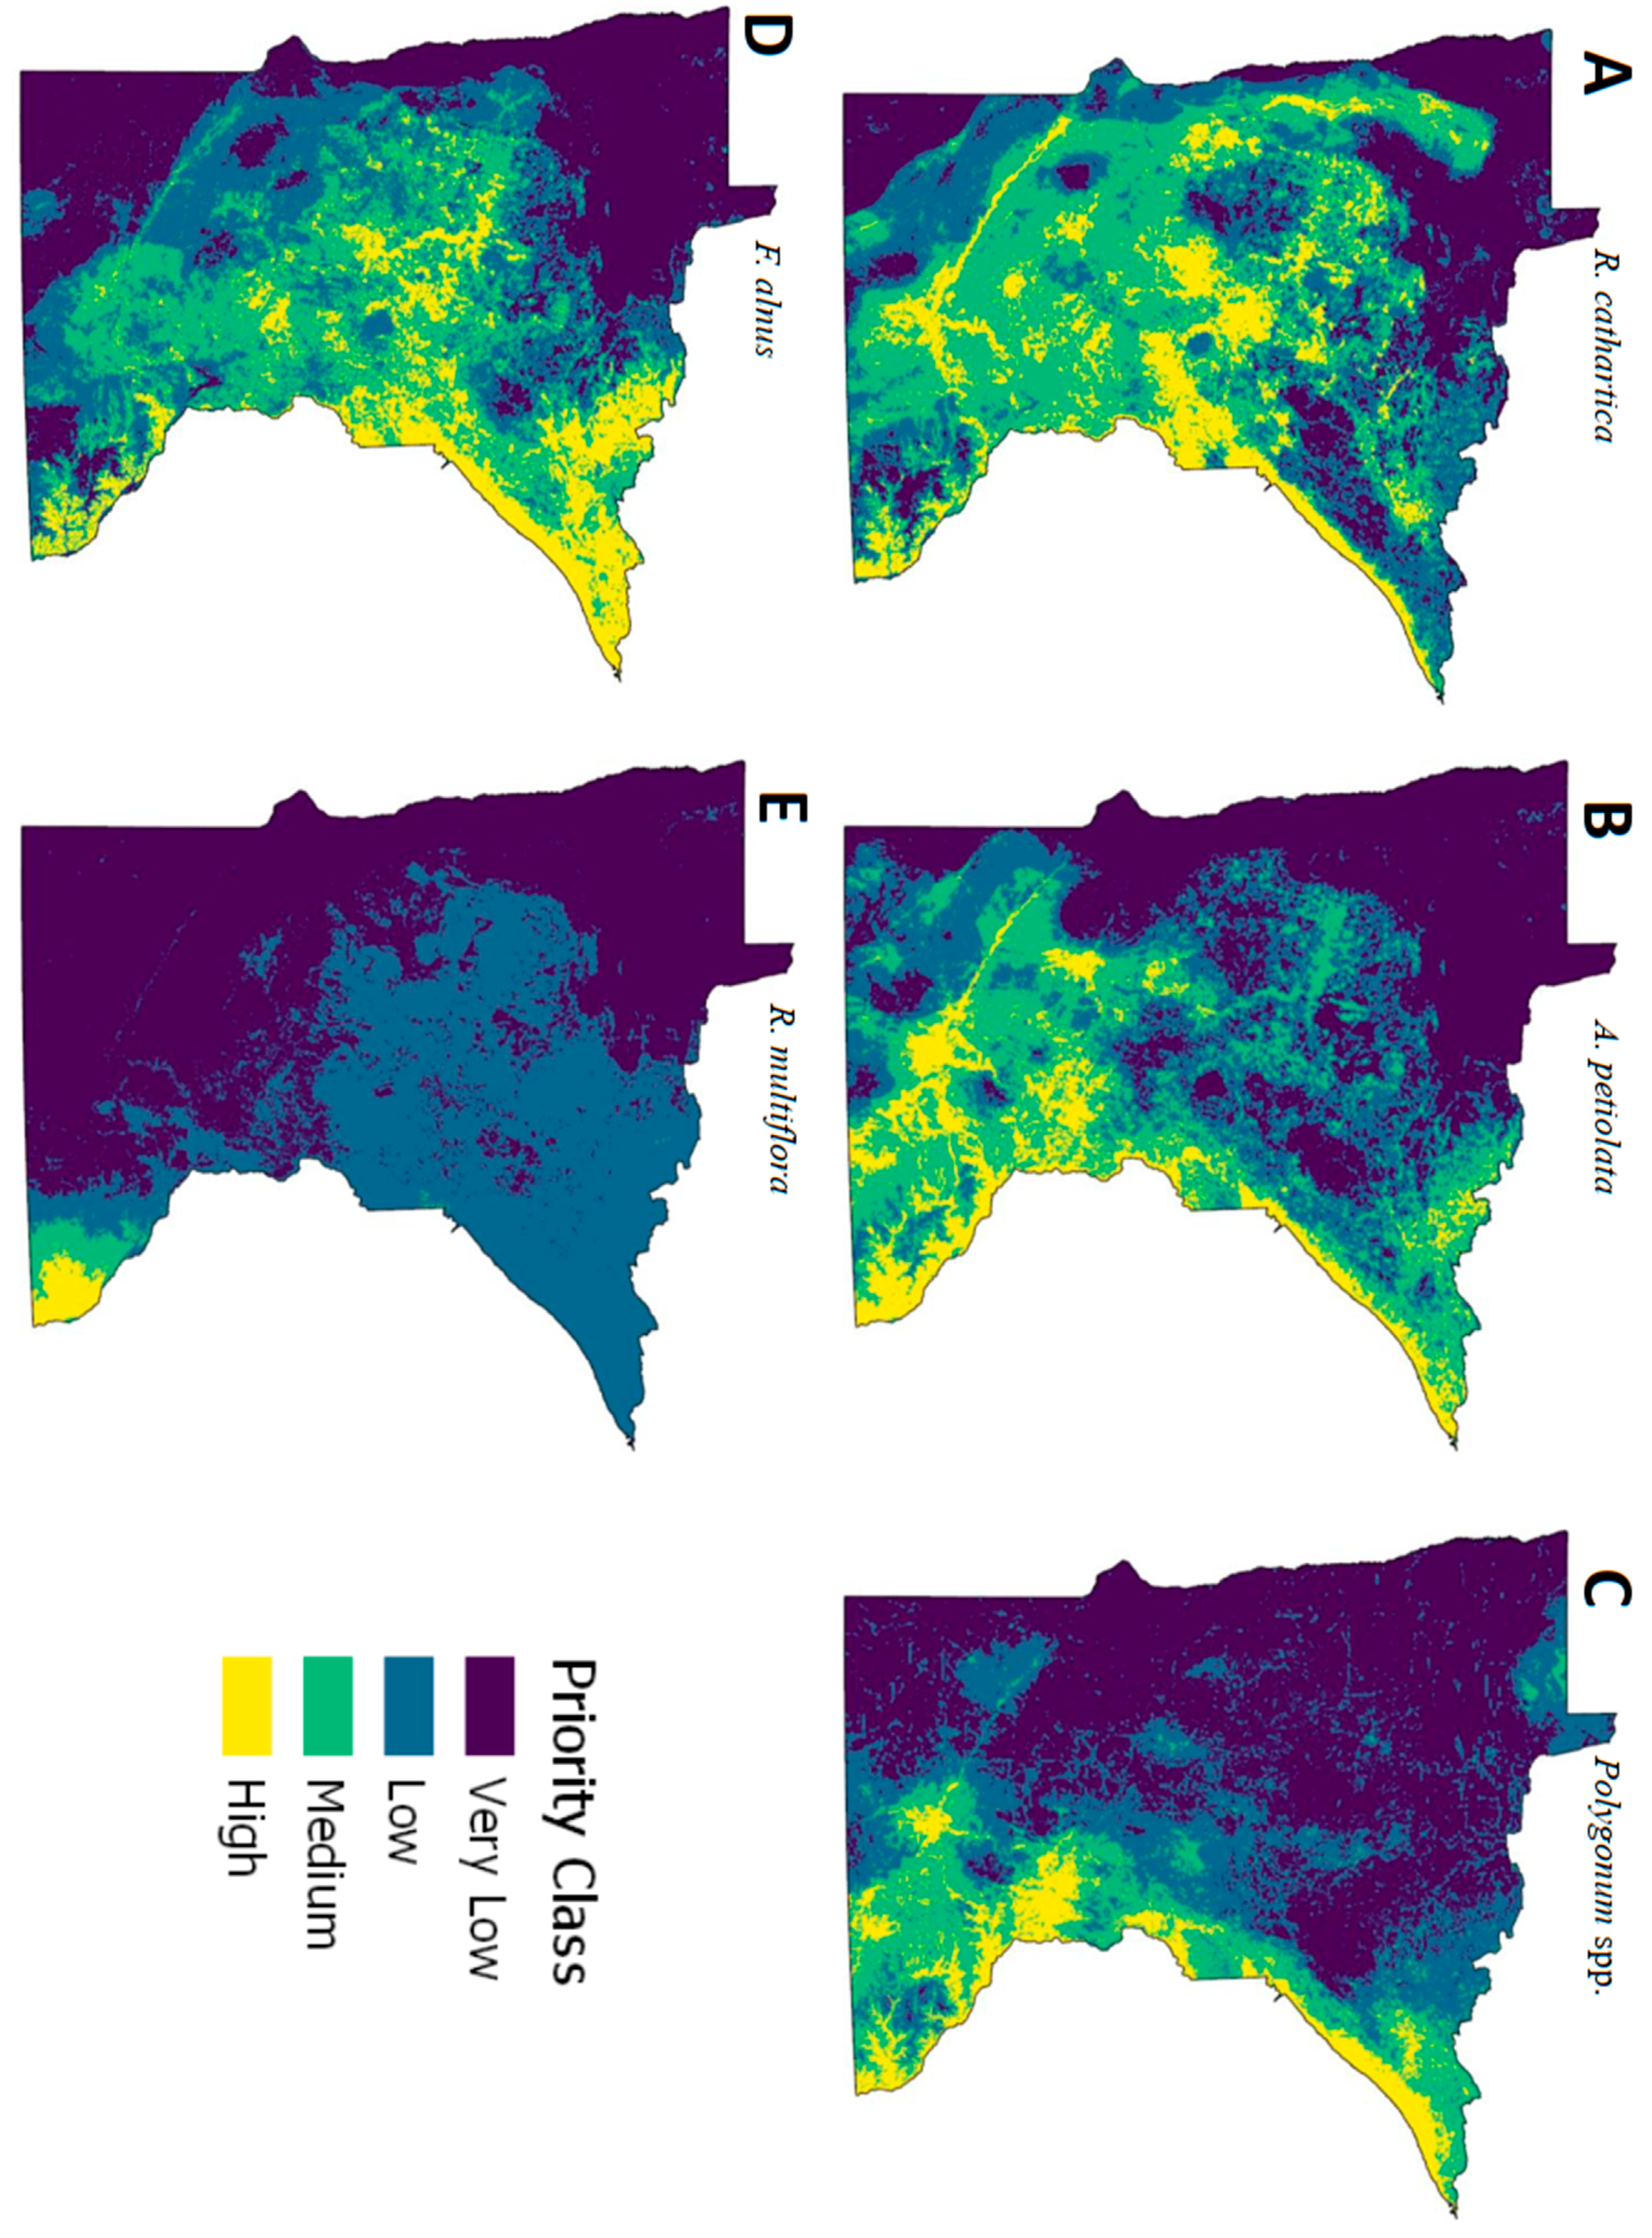
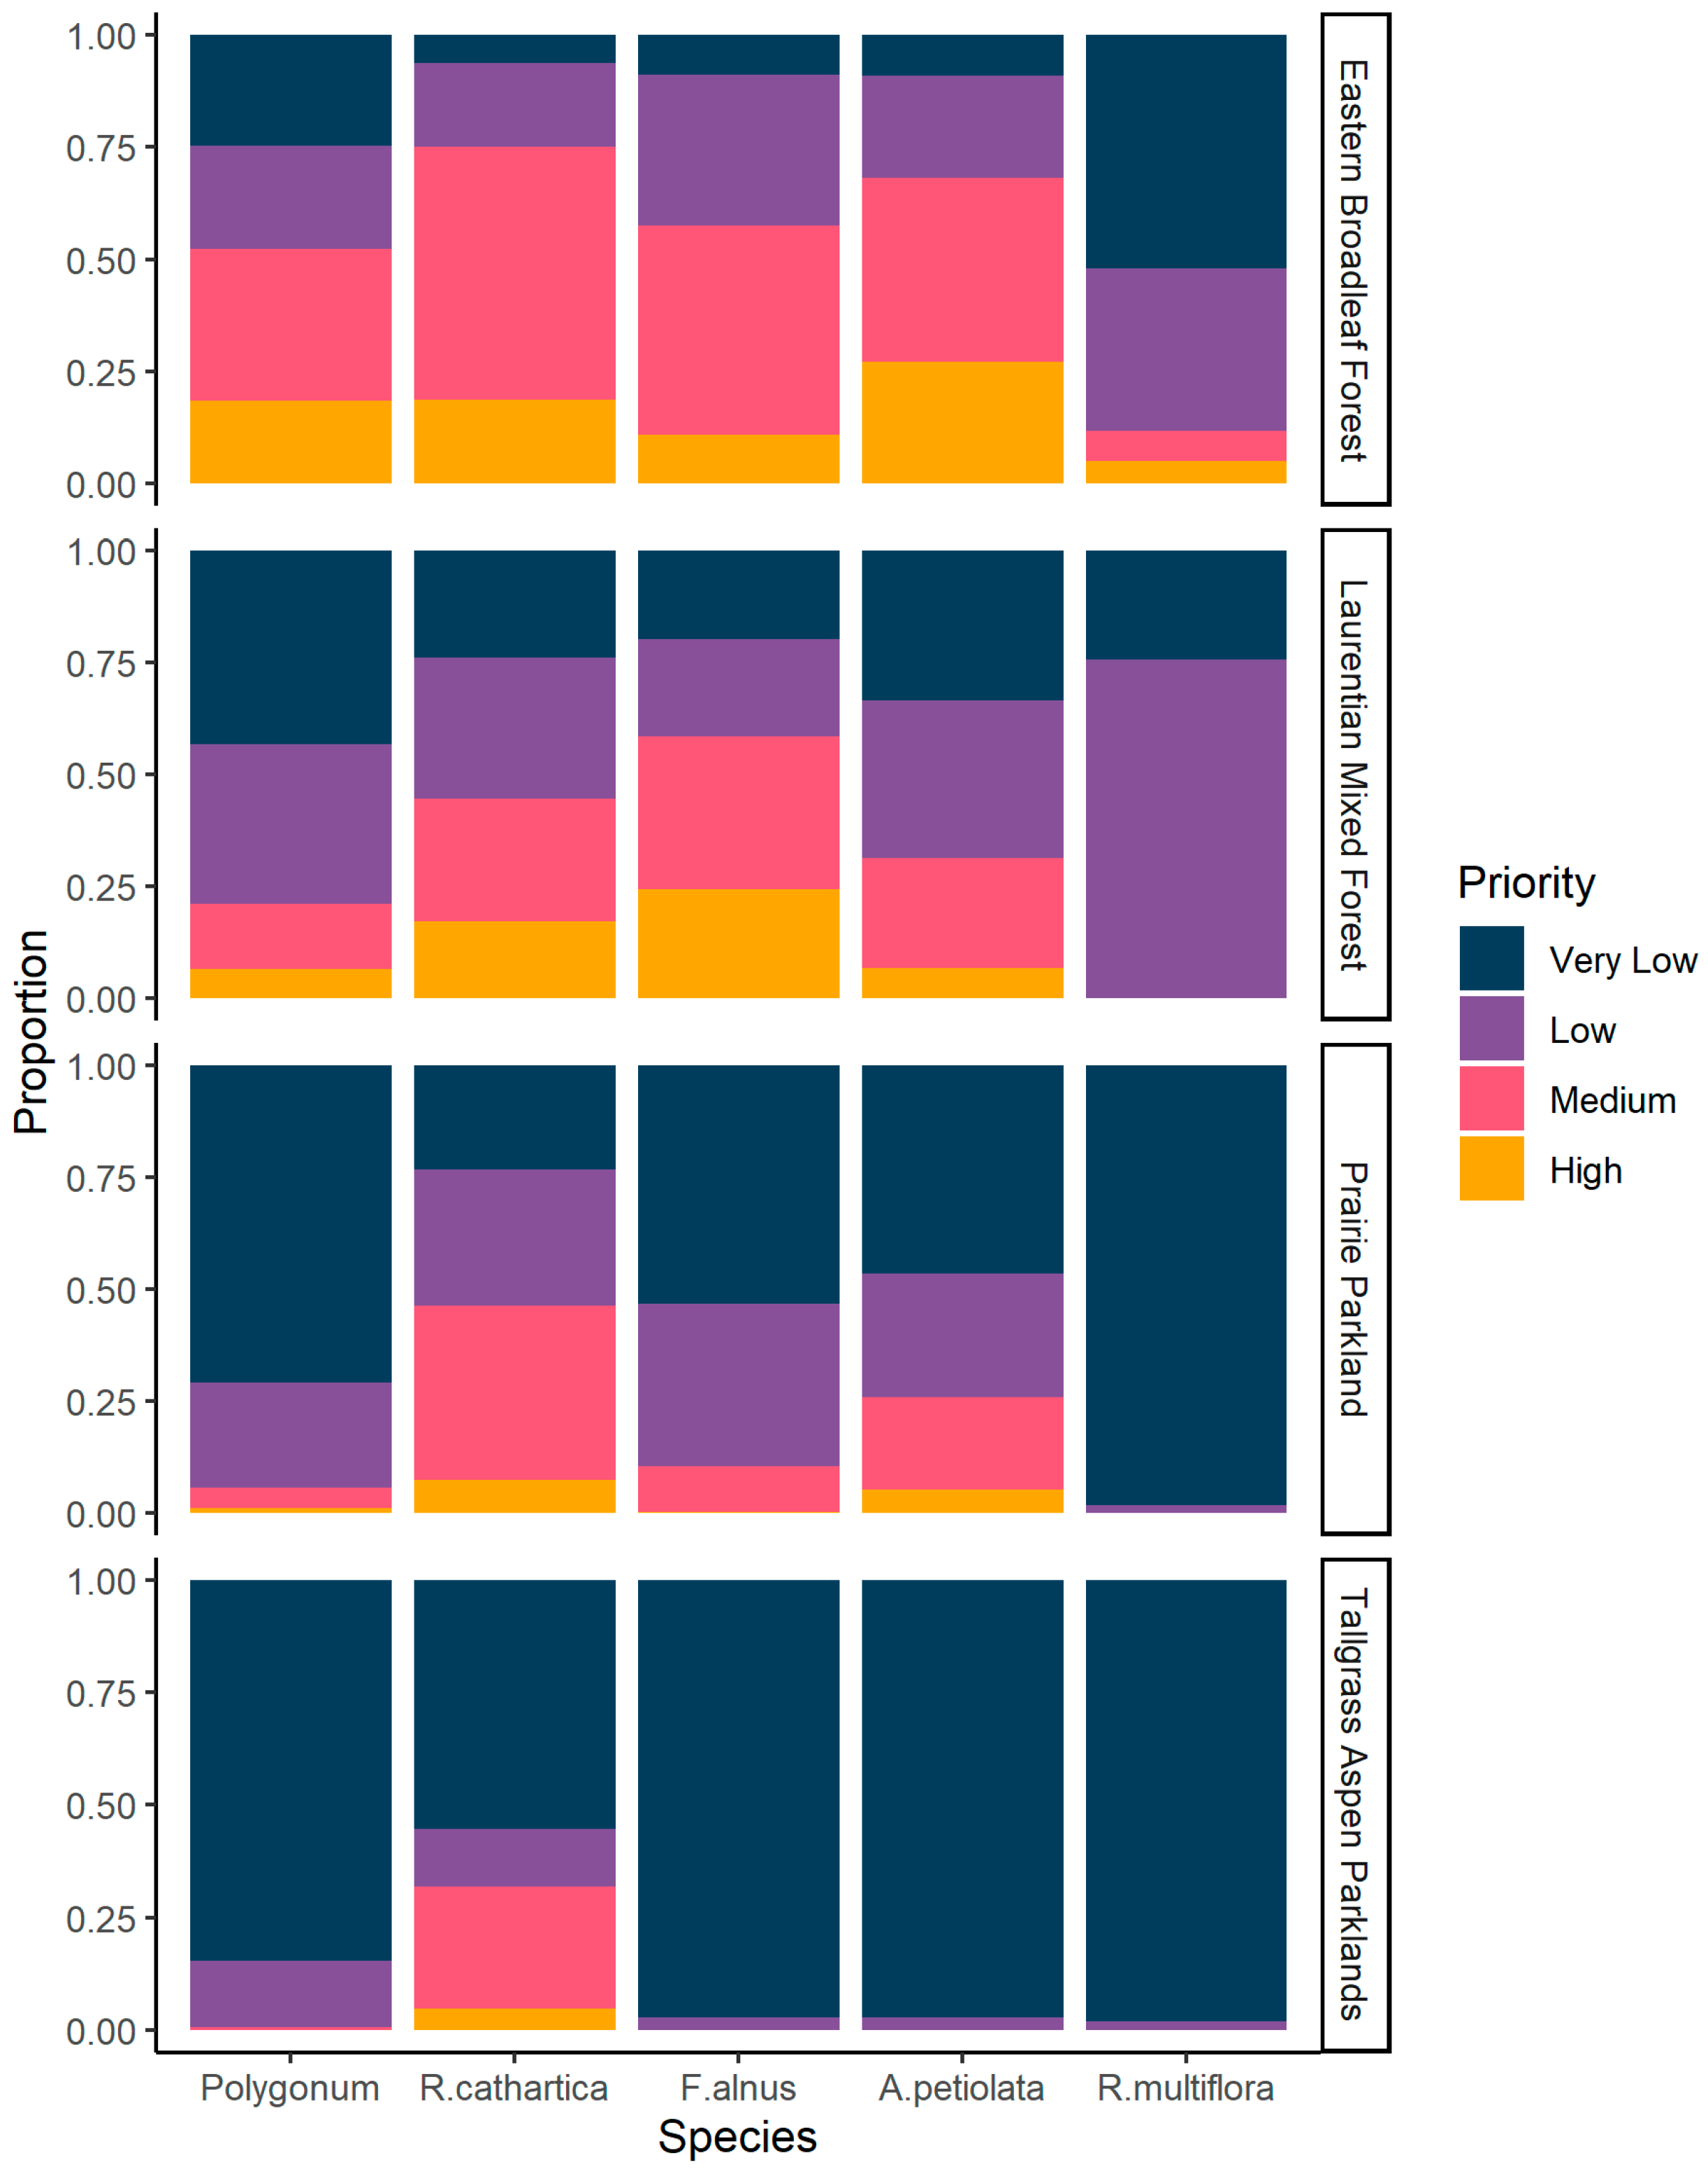
3. Results
4. Discussion
5. Conclusions
Supplementary Materials
Author Contributions
Funding
Acknowledgments
Conflicts of Interest
References
- Pimentel, D.; Zuniga, R.; Morrison, D. Update on the environmental and economic costs associated with alien-invasive species in the United States. Ecol. Econ. 2005, 52, 273–288. [Google Scholar] [CrossRef]
- Chornesky, E.A.; Bartuska, A.; Aplet, G.; Britton, K. Science Priorities for Reducing the Threat of Invasive Species to Sustainable Forestry. Bioscience 2005, 55, 335–348. [Google Scholar] [CrossRef] [Green Version]
- Holmes, T.P.; Aukema, J.E.; von Holle, B.; Liebhold, A.; Sills, E. Economic impacts of invasive species in forest past, present, and future. Year Ecol. Conserv. Biol. 2009, 1162, 18–38. Available online: https://www.fs.usda.gov/treesearch/pubs/36267 (accessed on 6 September 2019).
- Vilà, M.; Espinar, J.L.; Hejda, M.; Hulme, P.E.; Jarošík, V.; Maron, J.L.; Pergl, J.; Schaffner, U.; Sun, Y.; Pyšek, P. Ecological impacts of invasive alien plants: A meta-analysis of their effects on species, communities and ecosystems. Ecol. Lett. 2011, 14, 702–708. [Google Scholar] [CrossRef]
- LeDoux, C.B.; Martin, D.K. Proposed BMPs for Invasive Plant Mitigation during Timber Harvesting Operations; USFS NRS General Technical Report; USFS: Washington, DC, USA, 2013. [CrossRef]
- Saaty, R.W. The analytic hierarchy process-what it is and how it is used. Math. Model. 1987, 9, 161–176. [Google Scholar] [CrossRef] [Green Version]
- Anderson, L.G.; Rocliffe, S.; Haddaway, N.R.; Dunn, A.M. The Role of Tourism and Recreation in the Spread of Non-Native Species: A Systematic Review and Meta-Analysis. PLoS ONE 2015, 10, e0140833. [Google Scholar] [CrossRef]
- Mejía, C.V.; Brandt, S. Utilizing environmental information and pricing strategies to reduce externalities of tourism: The case of invasive species in the Galapagos. J. Sustain. Tour. 2017, 25, 763–778. [Google Scholar] [CrossRef]
- Windmuller-Campione, M.A.; Russell, M.B.; Sagor, E.; D’Amato, A.W.; Ek, A.R.; Puettmann, K.J.; Rodman, M.G. The Decline of the Clearcut: 26 Years of Change in Silvicultural Practices and Implications in Minnesota. J. For. 2020, 118, 244–259. [Google Scholar] [CrossRef]
- Reinhardt, J.R.; Russell, M.B.; Senay, S.; Lazarus, W. Assessing the current and potential future distribution of four invasive forest plants in Minnesota, U.S.A., using mixed sources of data. Sci. Rep. 2020, 10, 12738. [Google Scholar] [CrossRef]
- Miles, P.D.; Crocker, S.J.; Nelson, M.D.; Woodall, C.W. Minnesota Forests 2013; USFS NRS General Technical Report 104; USFS: Washington, DC, USA, 2016. [CrossRef]
- MDA: Minnesota Department of Agriculture. Minnesota Noxious Weed List. 2018. Available online: https://www.mda.state.mn.us/plants-insects/minnesota-noxious-weed-list (accessed on 15 September 2020).
- Reinhardt, J.; Russell, M.; Lazarus, W.; Chandler, M.; Senay, S. Status of Invasive Plants and Management Techniques in Minnesota: Results from a 2018 Survey 1 Staff Paper Series No. 253 Department of Forest Resources. 2019. Available online: www.forestry.umn.edu/publications/staff-paper-series (accessed on 6 September 2019).
- Bargeron, C.T.; Moorhead, D.J. EDDMapS—Early detection and distribution mapping system for the southeast exotic pest plant council. Wildl. Weeds 2007, 10, 4–8. [Google Scholar]
- Kurtz, C.M. An assessment of invasive plant species monitored by the Northern Research Station Forest Inventory and Analysis Program, 2005 through 2010. Gen. Tech. Rep. 2013. [Google Scholar] [CrossRef] [Green Version]
- Hijmans, R.J.; Cameron, S.E.; Parra, J.L.; Jones, P.G.; Jarvis, A. Very high resolution interpolated climate surfaces for global land areas. Int. J. Climatol. 2005, 25, 1965–1978. [Google Scholar] [CrossRef]
- NRCS: Natural Resources Conservation Service; U.S. Department of Agriculture; Soil Survey Staff. “Web Soil Survey”. 2019. Available online: https://websoilsurvey.sc.egov.usda.gov/?referrer=Citation.htm-HomeLink1 (accessed on 1 April 2020).
- USGS: U.S. Geological Survey. USGS National Elevation Dataset (NED). 2016. Available online: https://www.sciencebase.gov/catalog/item/5825a0c3e4b01fad86db66dc (accessed on 5 April 2020).
- Breiman, L. Random Forests. Mach. Learn. 2001, 45, 5–32. [Google Scholar] [CrossRef] [Green Version]
- Silverman, B.W. Density Estimation for Statistics and Data Analysis; CRC Press: Boca Raton, FL, USA, 1986; Volume 26. [Google Scholar]
- Han, W.; Yang, Z.; Di, L.; Mueller, R. CropScape: A Web service based application for exploring and disseminating US conterminous geospatial cropland data products for decision support. Comput. Electron. Agric. 2012, 84, 111–123. [Google Scholar] [CrossRef]
- Lazarus, W. Notes on Sources and Calculations of the Costs and Benefits in the Economic Model. Part of: Minnesota Tactical Invasive Plant Management Plan, Minnesota Department of Agriculture. 2020. Unpublished. Available online: https://z.umn.edu/2020wl_tpem (accessed on 1 May 2020).
- R Core Team. R: A Language and Environment for Statistical Computing. Vienna, Austria. 2019. Available online: https://www.r-project.org/ (accessed on 3 January 2020).
- Jenks, G.F. The data model concept in statistical mapping. Int. Yearb. Cartogr. 1967, 7, 186–190. [Google Scholar]
- Wilson, D.C.; Ek, A.R. Imputing plant community classifications for forest inventory plots. Ecol. Indic. 2017, 80, 327–336. [Google Scholar] [CrossRef]
- Heimpel, G.E.; LeeE, F.; DouglasA, L.; KeithR, H.; KimA, H.; Zeynep, S.; MarkK, A.; Kongming, W. European buckthorn and Asian soybean aphid as components of an extensive invasional meltdown in North America. Biol. Invasions 2010, 12, 2913–2931. [Google Scholar] [CrossRef]
- Fagan, M.; Peart, D. Impact of the invasive shrub glossy buckthorn (Rhamnus frangula L.) on juvenile recruitment by canopy trees. For. Ecol. Manag. 2004, 194, 95–107. [Google Scholar] [CrossRef]
- Knight, K.S. Factors that Influence Invasion Success of Two Woody Invaders o f Forest Understories. 2006. Available online: https://search.proquest.com/docview/305308190?pq-origsite=gscholar (accessed on 6 September 2019).
- Klionsky, S.M.; Amatangelo, K.L.; Waller, D.M. Above- and Belowground Impacts of European Buckthorn (Rhamnus cathartica) on Four Native Forbs. Restor. Ecol. 2011, 19, 728–737. [Google Scholar] [CrossRef]
- Mascaro, J.; Schnitzer, S.A. Dominance by the introduced tree Rhamnus cathartica (common buckthorn) may limit aboveground carbon storage in Southern Wisconsin forests. For. Ecol. Manag. 2011, 261, 545–550. [Google Scholar] [CrossRef] [Green Version]
- Frappier, B.; Eckert, R.T.; Lee, T.D. Potential Impacts of the Invasive Exotic Shrub Rhamnus Frangula L. (Glossy Buckthorn) on Forests of Southern New Hampshire. Northeast. Nat. 2003, 10, 277–296. [Google Scholar] [CrossRef]
- Frappier, B.; Eckert, R.T.; Lee, T.D. Experimental Removal of the Non-indigenous Shrub Rhamnus frangula (Glossy Buckthorn): Effects on Native Herbs and Woody Seedlings. Northeast. Nat. 2004, 11, 333–342. [Google Scholar] [CrossRef]
- Bibaud, H.A.; Ducey, M.J.; Simmons, M.J.; McCarthy, H.C.; Bibaud, R.N.; Lee, T.D. Factors limiting the success of invasive glossy buckthorn (Frangula alnus) in New Hampshire’s eastern white pine–hardwood forests. For. Ecol. Manag. 2020, 474, 118345. [Google Scholar] [CrossRef]
- Haines, D.F.; Aylward, J.A.; Frey, S.D.; Stinson, K.A. Regional Patterns of Floristic Diversity and Composition in Forests Invaded by Garlic Mustard (Alliaria petiolata). Northeast. Nat. 2018, 25, 399–417. [Google Scholar] [CrossRef]
- Myers, C.V.; Anderson, R.C. Seasonal Variation in Photosynthetic Rates Influences Success of an Invasive Plant, Garlic Mustard (Alliaria petiolata). Am. Midl. Nat. 2003, 150, 231–245. [Google Scholar] [CrossRef]
- Whigham, D.F. Ecology of Woodland Herbs in Temperate Deciduous Forests. Annu. Rev. Ecol. Evol. Syst. 2004, 35, 583–621. [Google Scholar] [CrossRef] [Green Version]
- Stinson, K.; Kaufman, S.; Durbin, L.; Lowenstein, F. Impacts of Garlic Mustard Invasion on a Forest Understory Community. Northeast. Nat. 2007, 14, 73–88. [Google Scholar] [CrossRef]
- Sanford, N.L.; Harrington, R.A.; Fownes, J.H. Survival and growth of native and alien woody seedlings in open and understory environments. For. Ecol. Manag. 2003, 183, 377–385. [Google Scholar] [CrossRef]
- Stewart, J.R.; Graves, W.R. Photosynthesis and growth of Rhamnus caroliniana during drought and flooding: Comparisons to the invasive Rhamnus cathartica. HortScience 2004, 39, 1278–1282. [Google Scholar] [CrossRef] [Green Version]
- Knight, K.S.; Kurylo, J.S.; Endress, A.G.; Stewart, J.R.; Reich, P.B. Ecology and ecosystem impacts of common buckthorn (Rhamnus cathartica): A review. Biol. Invasions 2007, 9, 925–937. [Google Scholar] [CrossRef]
- Schmidt, K.A.; Whelan, C.J. Effects of Exotic Lonicera and Rhamnus on Songbird Nest Predation. Conserv. Biol. 1999, 13, 1502–1506. [Google Scholar] [CrossRef]
- McKinney, A.M.; Goodell, K. Shading by invasive shrub reduces seed production and pollinator services in a native herb. Biol. Invasions 2010, 12, 2751–2763. [Google Scholar] [CrossRef]
- Beerling, D.J.; Bailey, J.P.; Conolly, A.P. Fallopia Japonica (Houtt.) Ronse Decraene. J. Ecol. 1994, 82, 959. [Google Scholar] [CrossRef]
- Urgenson, L.S.; Reichard, S.H.; Halpern, C.B. Community and ecosystem consequences of giant knotweed (Polygonum sachalinense) invasion into riparian forests of western Washington, USA. Biol. Conserv. 2009, 142, 1536–1541. [Google Scholar] [CrossRef]
- Claeson, S.M.; Bisson, P.A. Passive Reestablishment of Riparian Vegetation Following Removal of Invasive Knotweed (Polygonum). Invasive Plant Sci. Manag. 2013, 6, 208–218. [Google Scholar] [CrossRef]
- Kurtz, C.M.; Hansen, M.H. An Assessment of Multiflora Rose in Northern U.S. Forests; USFS Research Note 182; USFS: Washington, DC, USA, 2013.


| Common Name | Scientific Name | MN Status 1 | Estimated Current Distribution (km2) 2 | Attributes |
|---|---|---|---|---|
| Common buckthorn | Rhamnus cathartica | Restricted | 111,098 | Tall shrub commonly found on upland sites; thrives in forest understories and excludes native vegetation. |
| Glossy buckthorn | Frangula alnus | Restricted | 107,152 | Multi-stemmed shrub that commonly invades forested wetlands. |
| Multiflora rose | Rosa multiflora | Restricted | 10,274 | Shrub that commonly invades disturbed forests and roadsides. |
| Garlic mustard | Alliaria petiolata | Restricted | 34,988 | Herbaceous biennial commonly found in shaded areas of moist forests. |
| Knotweeds | Polygonum spp. | Control | 34,545 | Large perennial plants with non-woody stems; typically grows in moist soils along rivers and streams. |
| Criteria | Weight |
|---|---|
| Distribution estimates | 0.401 |
| Proximity to areas of conservation interest | 0.237 |
| Economic benefit of treatment | 0.196 |
| Known report density | 0.086 |
| Proximity to trails | 0.081 |
| ECS Province | Area (km²) | R. Cathartica | F. Alnus | A. Petiolata | Polygonum spp. | R. Multiflora | K-W χ2 | p |
|---|---|---|---|---|---|---|---|---|
| Eastern Broadleaf Forest | 47,932 | 2.88 ± 0.78 | 2.59 ± 0.80 | 2.86 ± 0.92 | 2.46 ± 1.05 | 1.65 ± 0.81 | 116,214.5 | <0.001 |
| Laurentian Mixed Forest | 93,804 | 2.38 ± 1.03 | 2.63 ± 1.06 | 2.04 ± 0.92 | 1.84 ± 0.90 | 1.76 ± 0.43 | 115,294.8 | <0.001 |
| Prairie Parkland Province | 65,095 | 2.3 ± 0.91 | 1.57 ± 0.68 | 1.85 ± 0.93 | 1.36 ± 0.63 | 1.02 ± 0.13 | 214,296.6 | <0.001 |
| Tallgrass Aspen Parklands | 11,751 | 1.81 ± 0.99 | 1.03 ± 0.16 | 1.03 ± 0.16 | 1.16 ± 0.38 | 1.02 ± 0.14 | 33,777.42 | <0.001 |
| PAD Class | Area (km²) | R. Cathartica | A. Petiolata | F. Alnus | Polygonum spp. | R. Multiflora | K-W χ2 | p |
|---|---|---|---|---|---|---|---|---|
| Designation | 215 | 2.73 ± 0.51 | 3.57 ± 0.5 | 1.79 ± 0.7 | 3.81 ± 0.39 | 1.82 ± 0.38 | 1893.11 | <0.001 |
| Forest Service | 11,495 | 2.41 ± 0.81 | 2.75 ± 0.76 | 3.38 ± 0.75 | 2.47 ± 0.98 | 1.97 ± 0.17 | 39,508.32 | <0.001 |
| National Park Service | 552 | 2.09 ± 0.6 | 3.02 ± 0.6 | 3.69 ± 0.55 | 1.97 ± 0.54 | 1.99 ± 0.07 | 4300.25 | <0.001 |
| Non-Governmental Organization | 221 | 2.26 ± 1.15 | 1.57 ± 0.87 | 1.77 ± 1.02 | 1.49 ± 0.83 | 1.33 ± 0.51 | 225.39 | <0.001 |
| State Department of Natural Resources | 22,578 | 2.02 ± 1.08 | 1.74 ± 0.97 | 2.13 ± 1.15 | 1.65 ± 0.89 | 1.56 ± 0.55 | 8444.32 | <0.001 |
| U.S. Fish and Wildlife Service | 2119 | 2.48 ± 0.93 | 1.66 ± 0.95 | 1.89 ± 0.95 | 1.5 ± 0.84 | 1.29 ± 0.58 | 4724.31 | <0.001 |
| Unknown/Other | 30 | 1.87 ± 1.16 | 1.75 ± 1 | 1.8 ± 1.04 | 1.99 ± 0.85 | 1.31 ± 0.46 | 22.27 | <0.001 |
| NPC | Area (km²) | R. Cathartica | F. Alnus | A. Petiolata | Polygonum spp. | R. Multiflora | K-W χ2 | p |
|---|---|---|---|---|---|---|---|---|
| WMn82 | 1113 | 2.51 ± 1.15 | 1.89 ± 0.93 | 2.42 ± 1.08 | 1.83 ± 0.85 | 1.57 ± 0.5 | 96.63 | <0.001 |
| CMX | 1095 | 2.02 ± 1.07 | 1.71 ± 0.9 | 2 ± 1.17 | 1.63 ± 0.92 | 1.38 ± 0.49 | 42.21 | <0.001 |
| FDn43 | 955 | 2.61 ± 1.05 | 3.1 ± 0.81 | 3.65 ± 0.56 | 3.17 ± 0.88 | 1.99 ± 0.11 | 851.86 | <0.001 |
| MHn44 | 700 | 1.94 ± 1.12 | 1.69 ± 1.03 | 2.02 ± 1.18 | 1.75 ± 0.96 | 1.5 ± 0.57 | 116.98 | <0.001 |
| MHc26 | 695 | 3.59 ± 0.56 | 2.94 ± 0.54 | 3.6 ± 0.53 | 1.53 ± 0.87 | 1.99 ± 0.09 | 3613.41 | <0.001 |
| MHn35 | 692 | 3.33 ± 0.65 | 2.55 ± 0.64 | 3.42 ± 0.64 | 1.68 ± 0.76 | 2 ± 0.17 | 3752.43 | <0.001 |
| FPn82 | 518 | 1.63 ± 0.82 | 1.32 ± 0.55 | 2.03 ± 0.99 | 1.41 ± 0.61 | 1.52 ± 0.5 | 354.31 | <0.001 |
| APn81 | 487 | 2.14 ± 1.07 | 1.75 ± 0.77 | 2.65 ± 1.05 | 1.91 ± 0.92 | 1.74 ± 0.44 | 361.86 | <0.001 |
| MHc36 | 389 | 3.8 ± 0.47 | 2.69 ± 0.71 | 3.45 ± 0.58 | 2.22 ± 0.62 | 1.98 ± 0.15 | 1041.82 | <0.001 |
| FPn73 | 360 | 2.14 ± 1.11 | 1.76 ± 0.87 | 2.38 ± 1.14 | 1.78 ± 0.81 | 1.58 ± 0.49 | 91.21 | <0.001 |
| APn80 | 348 | 1.53 ± 0.76 | 1.38 ± 0.6 | 2.18 ± 1.02 | 1.54 ± 0.74 | 1.61 ± 0.49 | 204.46 | <0.001 |
| FPn63 | 311 | 1.7 ± 0.89 | 1.61 ± 0.84 | 2.05 ± 1.11 | 1.78 ± 1 | 1.5 ± 0.5 | 40.19 | <0.001 |
| MHc37 | 299 | 3.33 ± 0.7 | 2.46 ± 0.54 | 3.17 ± 0.6 | 1.07 ± 0.25 | 1.95 ± 0.22 | 347.93 | <0.001 |
| WFn55 | 289 | 2.7 ± 1.2 | 2.12 ± 1.01 | 2.65 ± 1.2 | 1.94 ± 0.86 | 1.69 ± 0.48 | 145.16 | <0.001 |
| MHn45 | 284 | 3.05 ± 0.95 | 3.42 ± 0.63 | 3.88 ± 0.34 | 3.62 ± 0.79 | 2 ± 0 | 106.63 | <0.001 |
| FDc34 | 283 | 3.3 ± 0.72 | 2.61 ± 0.59 | 3.45 ± 0.64 | 1.4 ± 0.51 | 1.98 ± 0.13 | 1284.90 | <0.001 |
| APn91 | 277 | 2.1 ± 1.13 | 1.57 ± 0.78 | 2.35 ± 1.08 | 1.63 ± 0.84 | 1.63 ± 0.48 | 222.17 | <0.001 |
| UPs13 | 261 | 2.61 ± 1.03 | 2.24 ± 1.07 | 1.85 ± 1.01 | 1.64 ± 1.06 | 1.44 ± 0.85 | 218.62 | <0.001 |
| MHs38 | 253 | 3.61 ± 0.62 | 3.32 ± 0.94 | 3.06 ± 0.8 | 2.31 ± 1.1 | 1.77 ± 0.78 | 122.16 | <0.001 |
| OPn92 | 243 | 2.5 ± 1.03 | 1.75 ± 0.71 | 2.7 ± 0.91 | 1.44 ± 0.59 | 1.68 ± 0.47 | 504.06 | <0.001 |
| MHs37 | 242 | 3.59 ± 0.62 | 3.91 ± 0.29 | 3.64 ± 0.61 | 3.48 ± 0.68 | 3.07 ± 0.86 | 149.47 | <0.001 |
| OPp91 | 231 | 1.5 ± 0.88 | 1.06 ± 0.33 | 1.06 ± 0.34 | 1.43 ± 0.54 | 1.02 ± 0.13 | 373.79 | <0.001 |
| WFn64 | 209 | 2.71 ± 0.99 | 2.13 ± 0.94 | 3.05 ± 0.91 | 2.04 ± 0.94 | 1.87 ± 0.34 | 404.97 | <0.001 |
| FDn32 | 208 | 2.4 ± 1.16 | 2.55 ± 1.09 | 3.05 ± 1.33 | 2.79 ± 0.98 | 1.71 ± 0.45 | 103.31 | 0.000 |
| WFn53 | 194 | 2.14 ± 1.03 | 2.1 ± 1.08 | 2.69 ± 1.21 | 2.2 ± 1.14 | 1.7 ± 0.46 | 87.82 | <0.001 |
| FDs37 | 193 | 3.4 ± 0.72 | 3.16 ± 0.76 | 3.42 ± 0.6 | 2.14 ± 0.95 | 1.74 ± 0.44 | 364.96 | <0.001 |
| MHn46 | 169 | 2.95 ± 1.02 | 2.21 ± 1 | 2.96 ± 1.03 | 2 ± 0.97 | 1.88 ± 0.45 | 310.16 | <0.001 |
| FDc24 | 166 | 2.78 ± 0.84 | 2.19 ± 0.62 | 3.12 ± 0.7 | 1.4 ± 0.49 | 1.92 ± 0.27 | 754.32 | <0.001 |
| WFw54 | 166 | 1.46 ± 0.73 | 1.07 ± 0.27 | 1.13 ± 0.4 | 1.37 ± 0.58 | 1.01 ± 0.07 | 227.78 | <0.001 |
| OPn91 | 157 | 1.03 ± 0.21 | 1.02 ± 0.14 | 1.05 ± 0.34 | 1.72 ± 0.87 | 1.03 ± 0.16 | 162.36 | <0.001 |
Publisher’s Note: MDPI stays neutral with regard to jurisdictional claims in published maps and institutional affiliations. |
© 2020 by the authors. Licensee MDPI, Basel, Switzerland. This article is an open access article distributed under the terms and conditions of the Creative Commons Attribution (CC BY) license (http://creativecommons.org/licenses/by/4.0/).
Share and Cite
Reinhardt, J.R.; Russell, M.B.; Lazarus, W.F. Prioritizing Invasive Forest Plant Management Using Multi-Criteria Decision Analysis in Minnesota, USA. Forests 2020, 11, 1213. https://doi.org/10.3390/f11111213
Reinhardt JR, Russell MB, Lazarus WF. Prioritizing Invasive Forest Plant Management Using Multi-Criteria Decision Analysis in Minnesota, USA. Forests. 2020; 11(11):1213. https://doi.org/10.3390/f11111213
Chicago/Turabian StyleReinhardt, Jason R., Matthew B. Russell, and William F. Lazarus. 2020. "Prioritizing Invasive Forest Plant Management Using Multi-Criteria Decision Analysis in Minnesota, USA" Forests 11, no. 11: 1213. https://doi.org/10.3390/f11111213