Article

The Short-Term Impact of Different Silvicultural Thinnings on Soil Nematode and Microarthropod Biodiversity in Artificial Black Pine Stands

1
CREA—Research Centre for Plant Protection and Certification, Via di Lanciola 12/A, Cascine del Riccio, 50125 Florence, Italy
2
Department of Agricultural Sciences, University of Naples Federico II, Via Università 100, 80055 Portici, Naples, Italy
3
CREA—Research Centre for Politics and Bioeconomy, Via Lombardia 7, I-65012 Cepagatti, PE, Italy
4
CNR—IBE (National Research Council-Institute of BioEconomy), Via Madonna del Piano 10, I-50019 Sesto Fiorentino, Florence, Italy
5
CNR—Institute of Biosciences and BioResources (IBBR), Via Madonna del Piano 10, I-50019 Sesto Fiorentino, Florence, Italy
6
CREA—Research Centre for Forestry and Wood, I-52100 Arezzo, Italy
*
Author to whom correspondence should be addressed.
Forests 2020, 11(11), 1212; https://doi.org/10.3390/f11111212
Submission received: 19 October 2020 / Revised: 5 November 2020 / Accepted: 16 November 2020 / Published: 18 November 2020
(This article belongs to the Special Issue Application of Innovative Silvicultural Treatments in Pine Forests)

Abstract

:
Soil invertebrates represent almost a quarter of the total diversity of living organisms and their activity affects the entire soil ecological process. The choice of adequate thinning systems may differently affect soil nematode and microarthropod biodiversity in artificial black pinewoods. In this work, the results of the impact of different thinnings on the structure of nematode and microarthropod communities was reported. In a short-term experiment, thinning from below and selective thinning were compared to unmanaged stands to provide indications at the regional scale in central Italy. Soil nematode and microarthropod biodiversity was explored by examining community structure, assessing biodiversity. The interaction between environmental variables (crown volume, Photosynthetically Active Radiation, soil texture, soil temperature, and moisture) with taxa abundance of nematodes and microarthropods were also reported. The results indicated that the effects of thinning practices were temporary and varied between years. Soil nematode community shifted during the first and third years of thinning managements only in the Pratomagno site, while soil microarthropod community shifted in both sites only in the second year. The total nematode abundance was minimally affected by thinning practices, while the nematode community composition showed a decrease of omnivores and predators in the first years. Soil indicators showed inconsistent results. In microarthropods, mites and collembola were the least affected by thinning in terms of abundance and species biodiversity, while eu-edaphic taxa of Chilopoda, Diplopoda, and Pauropoda were not influenced by thinning, hemi-edaphic and epi-edaphic taxa of Coleoptera, Diptera, Hymenoptera, Tysanoptera, and Hemiptera were negatively affected. Soil indicators such as Shannon-Weiner and Simpson indices and soil biological quality (QBS-ar) improved in thinning from below in both sites. Soil temperature and moisture were the main driving factors in affecting soil nematode and microarthropods communities. Thinning from below probably allowed a more rapid recovery than selective thinning.

1. Introduction

Soil is a habitat characterized by high biodiversity and abundance of organisms, including invertebrates [1,2]. In natural ecosystems, soil mesofauna, belonging mainly to the phyla Arthropoda and Nematoda, is involved in recycling nutrients as a supporting ecosystem service. In fact, it increases the availability of soil mineral elements such as nitrogen, phosphorus, and potassium, which are essential for growth and development of all organisms [3,4]. Arthropods contribute to the turnover of organic matter as they decompose it by feeding on dead plant and animal tissues. Moreover, they transform these organic materials into a substrate more easily degradable by microorganisms, at the same time, regulating microbial populations. These organisms also affect porosity, aeration, infiltration, and distribution of organic matter within the soil [5]. On the other hand, nematodes enrich the soil in nutrient elements by excretion and play an important regulatory role by feeding on bacteria, fungi, and plants. Furthermore, microarthropods and nematodes establish synergistic interactions at various trophic levels (mainly by predation) that are essential in the maintenance of the homeostatic capacities and productive potentials of ecosystems [6].
Reforestation with black pine, established since the beginning of the 1970s along the Apennine ridge, provided a first cover of pioneer species in degraded areas at risk of erosion [7]. In such monospecific plantations, silvicultural practices are essential as they increase the mechanical stability of trees and accelerate the transition of forest stands to more dynamic, diverse, and complex forest ecosystems. A good forest management can contribute to decomposition efficiency, favoring the abundance and the biodiversity of soil organisms [8]. Silvicultural treatments such as thinning increase both the vertical and horizontal stand structural diversity of plants, modifying the canopy cover and enhancing the rate of light, water, and temperature at the soil level [9,10]. Currently, the choice of adequate thinning systems might differently affect the decomposition process in artificial black pinewoods.
Despite the importance of nematodes and microarthropods in forest ecosystems, relatively little attention has been given to the impact of thinning on their abundance and community structure, particularly in black pine wood stands. Several authors reported that pinewood areas subjected to thinning managements had a very similar range of nematode and microarthropod taxa compared with the unmanaged ones, but that the abundance of some taxa was often reduced, such as in the case of springtails, mites, and beetles [11,12].
Therefore, we can hypothesize that the thinning impact does not affect the total abundance of microarthropods and nematodes and that the major changes occur instead in the community composition in the first period due to changes of soil temperature and moisture. Even if the temporal factor is expected to play a key role in the community dynamics, few studies have been designed, thus far, to investigate the evolution of soil nematode and microarthropod communities after thinning. In fact, several authors have shown, on other plants, the existence of an annual variability in the effects of different management practices [13,14].
The main purpose of the present work was to assess the effects of thinning on soil nematode and microarthropod communities. The consequences of two different thinnings were evaluated in two black pine wood stands in central Italy. In particular, the impact of managements was tested over time to assess: (i) shifts in forest parameters, (ii) changes in abundance of nematode and microarthropod taxa, (iii) biodiversity of soil nematode and microarthropod communities, and (iv) the interaction between environmental variables and soil nematode and microarthropod communities.

2. Materials and Methods

2.1. Study Sites and Treatments Description

Both experimental sites were located in two unmanaged artificial black pine plantations in Tuscany (central Italy). The Pratomagno site is located in the central Apennines (north-eastern Tuscany) and is characterized by an adult high forest (age: 59 years) consisting primarily of black pines (83.4% of total trees/ha and 86% of total basal area/ha), with scattered Abies alba Mill. and occasionally broadleaf species such as Fagus sylvatica L., Fraxinus ornus L., and Quercus cerris L. [15]. Soils are shallow to moderately deep, with a high content of organic matter in the surface horizon A, with many rock fragments (coarse gravel, pebbles, and stones) throughout the profile. They have a predominantly loam and sandy loam texture, non-calcareous, extremely to moderately acid (pH between 4.0 and 5.5), with moderately low base saturation, and are sometimes excessively drained. The bulk density of the surface horizons has values between 0.90 and 1.20 (g/cm3), highlighting a high porosity of the soils that guarantees high water permeability and a moderate available water capacity (AWC). From a taxonomic point of view [16], the soils belong to Lithic Humudepts: coarse loamy, mixed, super-active, mesic, and to Typic Humudepts: coarse loamy, mixed, super-active, mesic. The Amiata site is instead situated in Val D’Orcia (southern Tuscany) and consists of a young high forest (age: 44 years) dominated by black pine (91.3% and 97.3% of total trees and basal area, respectively), and to a lesser extent, by Quercus pubescens Wild. and Q. cerris covering the remaining 10% of the area [15]. Soils are deep, with a moderate content of organic matter in the surface horizon A, scarcely gravelly to gravelly in depth, with a predominantly clay loam and clayey texture, from weakly to moderately calcareous, weakly alkaline (pH between 7.2 and 7.9), with very high base saturation, well-drained, and somewhat poorly drained. The bulk density of the surface horizons has values between 1.30 and 1.56 (g/cm3), highlighting a low porosity of the soils composed mainly of small pores. From a taxonomic point of view [16], the soils belong to Typic Eutrudepts: fine loamy, mixed, active, mesic, and to Aquic Eutrudepts: fine, mixed, active, mesic. In each site, 20 ha homogeneously covered by black pine stand were selected [17] (Supplementary Materials Table S1).
The same experimental design was applied in each site to compare two different thinnings with unmanaged stands (control, CTR):
  • Thinning from below (TB)—only dominated, small, or standing dead trees were harvested (negative selection) in the forest.
  • Selective thinning (ST)—(i) selection of 100 trees per hectare based on the quality of phenotype, i.e., its mechanical stability and vigor (candidate trees), (ii) making candidate trees free from their direct competitors, i.e., all the surrounding trees limiting the full crown growth of the candidate tree. The average number of candidate trees was around 100 trees per hectare. The density of 100 trees per hectare (10 m, the average distance between trees) came from the analysis of crown development patterns of black pine in the absence of lateral competition and by experimental data measured for this purpose. The aim of selective thinning was to leave free space available to the crowns of candidate trees. Selective thinning, changing both the horizontal and vertical layering, originates the stand structure variation [18].
In each stand, nine-squared macro-plots of 1 ha were chosen for the trial (three for each treatment) and marked on the ground (Figure 1). Treatments were randomly selected. The thinning was carried out in summer 2015.

2.2. Sampling Design

Samplings were carried out before treatments and for three years after treatments (2016–2018) to evaluate the effects on forest parameters. In May, for three years after treatments (2016–2018), samplings were collected to monitor changes in the structure of nematode and microarthropod communities under selected management systems. Three points marked by pickets on the ground were randomly selected in each macro-plot (Figure 1). Then, concentric circular plots of 10 m radium for nematode and microarthropod analysis and 15 m radium for dendrometric and structural assessment were defined, as reported by Cantiani and Marchi [19]. For each plot, three replicate samples were collected (three samples/macro-plot/year/location) for a total of 162 samples.

2.3. Soil Parameters

Soils were investigated with a pedological survey conducted following national methodologies [20,21,22] and according to some soil studies and regional inventories [23,24] (Tuscany Region—Regional soil database). Soil characteristics were described by twenty-seven Edelman auger holes for each experimental area and soil samples were collected on the surface horizons in each macro-plot; for each representative plot, three soil profiles were dug, sampled, and described in all horizons. The standard chemical parameters were analyzed for all samples under laboratory conditions. Bulk density was determined with core method retention curve with Richards apparatus and hydraulic conductivity with a field permeameter [25].

2.4. Meteorological Parameters

To acquire data on the main meteorological and hydrological parameters of the sample areas, two meteorological stations (Davis Vantage) were installed at the beginning of the project, complete with the main sensors (rain, temperature, humidity, solar radiation, wind) and six Dataloggers (Decagon Em50 and Em50G) for the hourly measurement of soil moisture and temperature at two depths of 10 and 30 cm (capacitive probes, Decagon 5TM and 10HS). The meteorological stations were located outside the forest at a distance of about 300–400 m from the experimental plots, the humidity and soil temperature sensors were instead positioned in each of the three representative plots of the silvicultural treatments (thinning from below, selective thinning, and unmanaged stand).
For the climatic characterization of the experimental areas, the weather stations of the Regional Hydrological Service most representative for these areas (Vallombrosa (FI) and Villa Cognola (AR) for the Pratomagno area and Castiglion d’Orcia (SI) for the Amiata area) were selected to carry out climatological calculations for a period of at least twenty years.

2.5. Forest Parameters

In each area (i.e., Monte Amiata and Pratomagno), the forest structure of each circular plot was recorded using a custom version of the FieldMap® technology composed by a Trupulse360B connected to a portable tablet with Bluetooth connection. During in-field works, each tree was numbered progressively and geo-referenced using a polar coordinate system (horizontal distance from the center of the circular plot and degrees from the north), subsequently converted into metric planar coordinates [19].
For all trees, the following variables were measured: (a) the diameter at 1.30 m height (DBH; Diameter at Breist Height) using diameter measurement tape, (b) total height, height of first living whorl, and height at maximum crown width using Vertex III, (c) the mean crown radius using the vertical sighting method [26] as the quadratic mean of eight crown radii, selected to be representative of the crown perimeter and without any prefixed scheme (e.g., North, North East, East, etc.), (d) the crown radius at crown base base to calculate the total crown volume i.e. the space occupied by the canopy [9], and (e) the total PAR (Photosynthetically Active Radiation i.e. the amount of light available for photosynthesis) on the ground using ceptometers (AccuPAR model PAR-80 and LP-80—Decagon Devices Inc., Pullman, WA, USA). Then, the total basal area and the total standing volume were calculated for each plot. Single-tree volumes were calculated using the most recent Italian national forest inventory equations [27].

2.6. Soil Nematode Community Analysis

In each plot, three soil samples were collected at a depth of 15 cm in the top layer of bulk soil using a hand auger, and then mixed to form a composite sample. Each sample was placed into a sterile plastic bag, labelled, and stored in a cold chamber at 4 °C. Nematodes were isolated from 100 mL of each soil sample using the cotton-wood filter extraction method for 48 h at room temperature, approximately 20 °C. Each nematode suspension was sieved through a 25 µm mesh and the nematodes were mounted on temporary slides. Specimens were then identified at high magnification to genus or family level using the keys of Mai [28], Bongers [29], and Marinari-Palmisano and Vinciguerra [30]. Taxonomic families were assigned to a trophic grouping based on Yeates et al. [31] and Okada et al. [32]. Nematode communities were characterized using the: (i) absolute abundance of individuals, (ii) richness determined by counting the number of taxa, (iii) biodiversity indices (H, Shannon-Weiner index; D, Simpson index), and (iv) maturity (MI) and Plant Parasitic (PPI) indices according to Bongers [33], and the food web indicators (EI, enrichment index; SI, structure index; CI, channel index) according to Ferris et al. [34]. In addition, the presence of entomopathogenic nematodes (EPNs) was assessed using the Galleria bait method (n = 9 samples for each year) [35,36]. Dead larvae were placed on modified White traps [37] and emerging infective juveniles (IJs) were examined and measured using a light microscope at up to 1000x magnification and identified to the species level using morphological and morphometric characters based on Nguyen and Hunt [38].

2.7. Soil Microarthropod Analysis

Three soil samples were collected close to the previous ones (see above) in each plot using a special 10 cm3 corer for mesofauna sampling, as reported by Parisi et al. [39]. Microarthropods were extracted using modified Berlese-Tullgren funnels following the standard methodology [39]. The edaphic microarthropod communities were characterized using the: (i) individual abundance, (ii) richness determined by counting the number of taxa, (iii) biodiversity indices (H, Shannon-Weiner index; D, Simpson index), and (iv) soil biological quality, QBS-ar index, according to Parisi et al. [39] in order to evaluate the soil biological quality by organism adaptation to the edaphic habitat.

2.8. Statistical Analysis

One-way analysis of variance (ANOVA) (post-hoc Tukey’s test) was performed to evaluate the effects of different silvicultural treatments in terms of the main dendrometric and forest structural parameters. To evaluate an overall outcome, two-way ANOVA was carried out to assess management and year effects on indicators of nematode and microarthropod structure communities. When the F-test was significant at p < 0.05, means were compared by the Student-Newman-Keuls test using the CoStat software package (https://www.Cohorn.com/costat.html). In addition, nematode and microarthropod communities were compared by multivariate analysis with the PAST (PAleonthological STatistics) statistical software package [40] (https://folk.uio.no/ohmmer/past). Nematode and microarthropod communities were compared using analysis of similarities (ANOSIM), multidimensional scaling (MDS), and SIMPER (Similarity Percentage) analysis based on the Bray–Curtis similarity index with the nearest-neighbor method in accordance with Clark [41]. The abundance data of nematodes and microarthropods were transformed using square root transformation. Bonferroni correction was applied. Canonical Correspondence Analysis (CCA) was carried out in order to link taxa abundance of nematodes and microarthropods with forest variables (e.g., trees per hectare, basal area, standing volume, quadratic mean diameter, mean height, canopy volume, PAR) and soil physical variables (e.g., soil texture, soil temperature, moisture). Only significant environmental axes have been taken into account and represented by vectors. The statistical significance of relationships between nematode and microarthropod communities and environmental variables was assessed by a permutation test of both the first ordination axis and the combination of the first and second axes.

3. Results

3.1. Meteorological and Hydrological Parameters

The weather stations of the Regional Hydrological service and those set up in the study areas were compared (Supplementary Table S2). In the Pratomagno area, temperature as well as quantity and distribution of rainfall recorded for 2016 were in line with averages measured in the last twenty years, 2017 was instead characterized by a very dry and hot spring–summer period, while 2018 was characterized by a very humid spring and a drought, but not a particularly hot summer. For the Amiata area, 2016 was wetter and cooler, with no summer water deficit, while 2017 was drier and warmer than usual in both spring and summer. Moreover, 2018 was a rainy year, but not particularly hot in both spring and summer.
Temperature and humidity of the soil within the forests varied according to distribution of trees in space, shape, and degree of canopy closure. These are among the main factors that influence gas exchanges with the atmosphere, light interception and photosynthetic capacity levels, interception of rains, as well as temperature regime.
Water content of the soil in the experimental areas (Supplementary Figure S1) was always positively correlated with crown volume, especially for the sensors located in thinned stands. The canopy protected the soil from solar radiation, reducing air temperature and consequently evaporation. In the very rainy and humid winter months, the water content of the soil did not show significant differences between the treatments. From late spring to summer, the differences became larger and the soil of the thinned woods was drier than the unmanaged stands. In the summer months, the water content of the soil subjected to thinning was much lower (about 10%) than the control soil, and this gap depended on the intensity of the summer drought.
As regards soil temperature, results showed that, in the thinned stands, summer temperatures were higher than those recorded in the control areas, while winter temperatures were lower (Supplementary Materials Figure S1). Therefore, the forest showed the ability to mitigate extreme temperatures in both winter and summer seasons at both sites.

3.2. Effects of Silvicultural Treatments on Forest Structure and Dendrometrical Parameters

The two thinning systems determined a very different modification of forest structure, even though they involved a similar reduction in terms of number of trees (trees ha−1). In particular, selective thinning acted in a more incisive way at the crown level and the canopy cover reduction determined a greater increase of PAR. As shown in Table 1, in the Amiata study area, 413% and 133% PAR increases were measured after selective thinning and thinning from below, respectively. Similarly, in the Pratomagno study area, 232% and 87% PAR increases were recorded after selective thinning and traditional practice, respectively.

3.3. Similarity Analysis on Soil Nematode and Microarthropod Communities

Two-way ANOSIM analysis on taxa abundance showed significant differences per management and sites only for microarthropods (Nematodes: management R −0.03, p < 0.80; site R 0.04, p < 0.18; Microarthropods: management R 0.02, p < 0.04; site R 0.22, p < 0.0001).
Thirty-three different genera, belonging to seventeen plant-parasitic and free-living nematode families, were identified in soil samples collected in the two sites. The proportion of the nematodes in the feeding groups was similar under different managements in both sites. The free-living nematodes involved in the mineralization of organic matter (bacterial and fungal feeders) were the most representative groups, while the abundance of predators (mainly belonging to Mononchidae and to a lesser extent to Discolaimidae and Seinuridae families) was low. Plant-parasitic nematodes belonging to the families Paratylenchidae, Anguinidae, Telotylenchidae, Hoplolaimidae, Pratylenchidae, Criconematidae, and Longidoridae also showed low abundance and strong variability. As regards the entomopathogenic nematodes, a low rate of infection on G. mellonella was detected. Only 11.1% of soil samples were positive to EPNs and only in CTR in the Pratomagno site. Based on morphological characteristics, the isolated nematodes were identified as Steinernema carpocapsae (Weiser) belonging to the family Steinernematidae. The year-by-year data evaluation, based on MDS analysis on taxa nematode abundance, showed a spatial separation between TB and the other two managements in Pratomagno (Figure 2). One-way ANOSIM analysis confirmed that significant differences were found in 2016 and 2018 (Table 2).
The analysis of the family abundance to the average Bray–Curtis dissimilarity among these managements using SIMPER showed 32.19% and 37.45% of average dissimilarity in 2016 and 2018, respectively. In 2016, differences were mainly due to the higher proportion of Dorylaimidae, Seinuridae, and Longidoridae in CTR than thinning managements, while in the last year of the survey, a higher number of taxa and an increase in the abundance of the Dorylaimidae family was found in TB (Supplementary Tables S3 and S4). Family break-down of similarity showed that 10 and 9 families for 2016 and 2018 respectively, accounted for 95% of this similarity. Although in 2016, a spatial separation was highlighted between ST and the other managements in the Amiata site, no significant differences were found using the one-way ANOSIM analysis (Figure 2 and Table 2). However, in both thinning types, Dorylaimidae families decreased in terms of abundance in 2017.
Nineteen different taxa of microarthropods were identified in soil samples collected from the two sites. In general, only mites and springtails were prominent over years while the other taxa showed a very low abundance. Oribatids represented only 6–7% of the whole mite population in both sites and the springtails were mostly represented by hemi-edaphic forms belonging to Poduromorpha and Entomobryomorpha groups. The total abundance was higher in Amiata than in Pratomagno and a strong variability among years and managements were found. The MDS analysis on taxa microarthropod abundance showed a partial spatial separation in both sites only in 2017 (Figure 3). Using one-way ANOSIM, a small but significant difference was found, and the SIMPER analysis showed 36.9% and 34.39% of average dissimilarity in the Pratomagno and Amiata sites, respectively (Table 2). These differences were mainly due to the higher proportion of mites and springtails in CTR than thinning managements, in both sites. Family break-down of similarity showed that 11 and 13 families for Pratomagno and Amiata respectively, accounted for 95% of this similarity (Supplementary Tables S5 and S6). For other taxa, the eu-edaphic taxa were similar among different managements in both sites, while the abundance of hemi-edaphic and epi-edaphic taxa decreased in thinned managements.

3.4. Soil Nematode and Microarthropod Indicators

The averages of nematode index values according to the management and year are reported in Table 3. In general, biodiversity indices (S and D) were not significant. The MI values ranged between 1.9 (ST and CTR in Pratomagno site) and 2.2 (CTR in Amiata), indicating the presence of generalist and opportunistic species. However, no difference was shown for MI between managements in both sites, while the PPI was significantly lower in ST than in other managements in the Pratomagno site. The food web indices showed significant values only in the Amiata site, and EI and CI were higher in ST and CTR, respectively. No difference was found for SI in both sites. Furthermore, in most cases, the community indices exhibited a significant temporal shift. In both sites, MI, CI, and H decreased in 2017, while EI and D increased in the same year. PPI instead showed a decreasing trend during the three years of monitoring in the Pratomagno site.
The averages of indices according to the management and year were also reported. In general, the selected indices evidenced low values, indicating degraded environments, particularly in the Pratomagno site (Table 4). However, the Shannon-Weiner index significantly increased in TB in both sites, while the Simpson index was higher in CTR and ST in the Pratomagno and Amiata sites, respectively. Conversely, QBS-ar showed that only TB increased soil biology quality in the Pratomagno site. In both sites, the annual shift was evident.

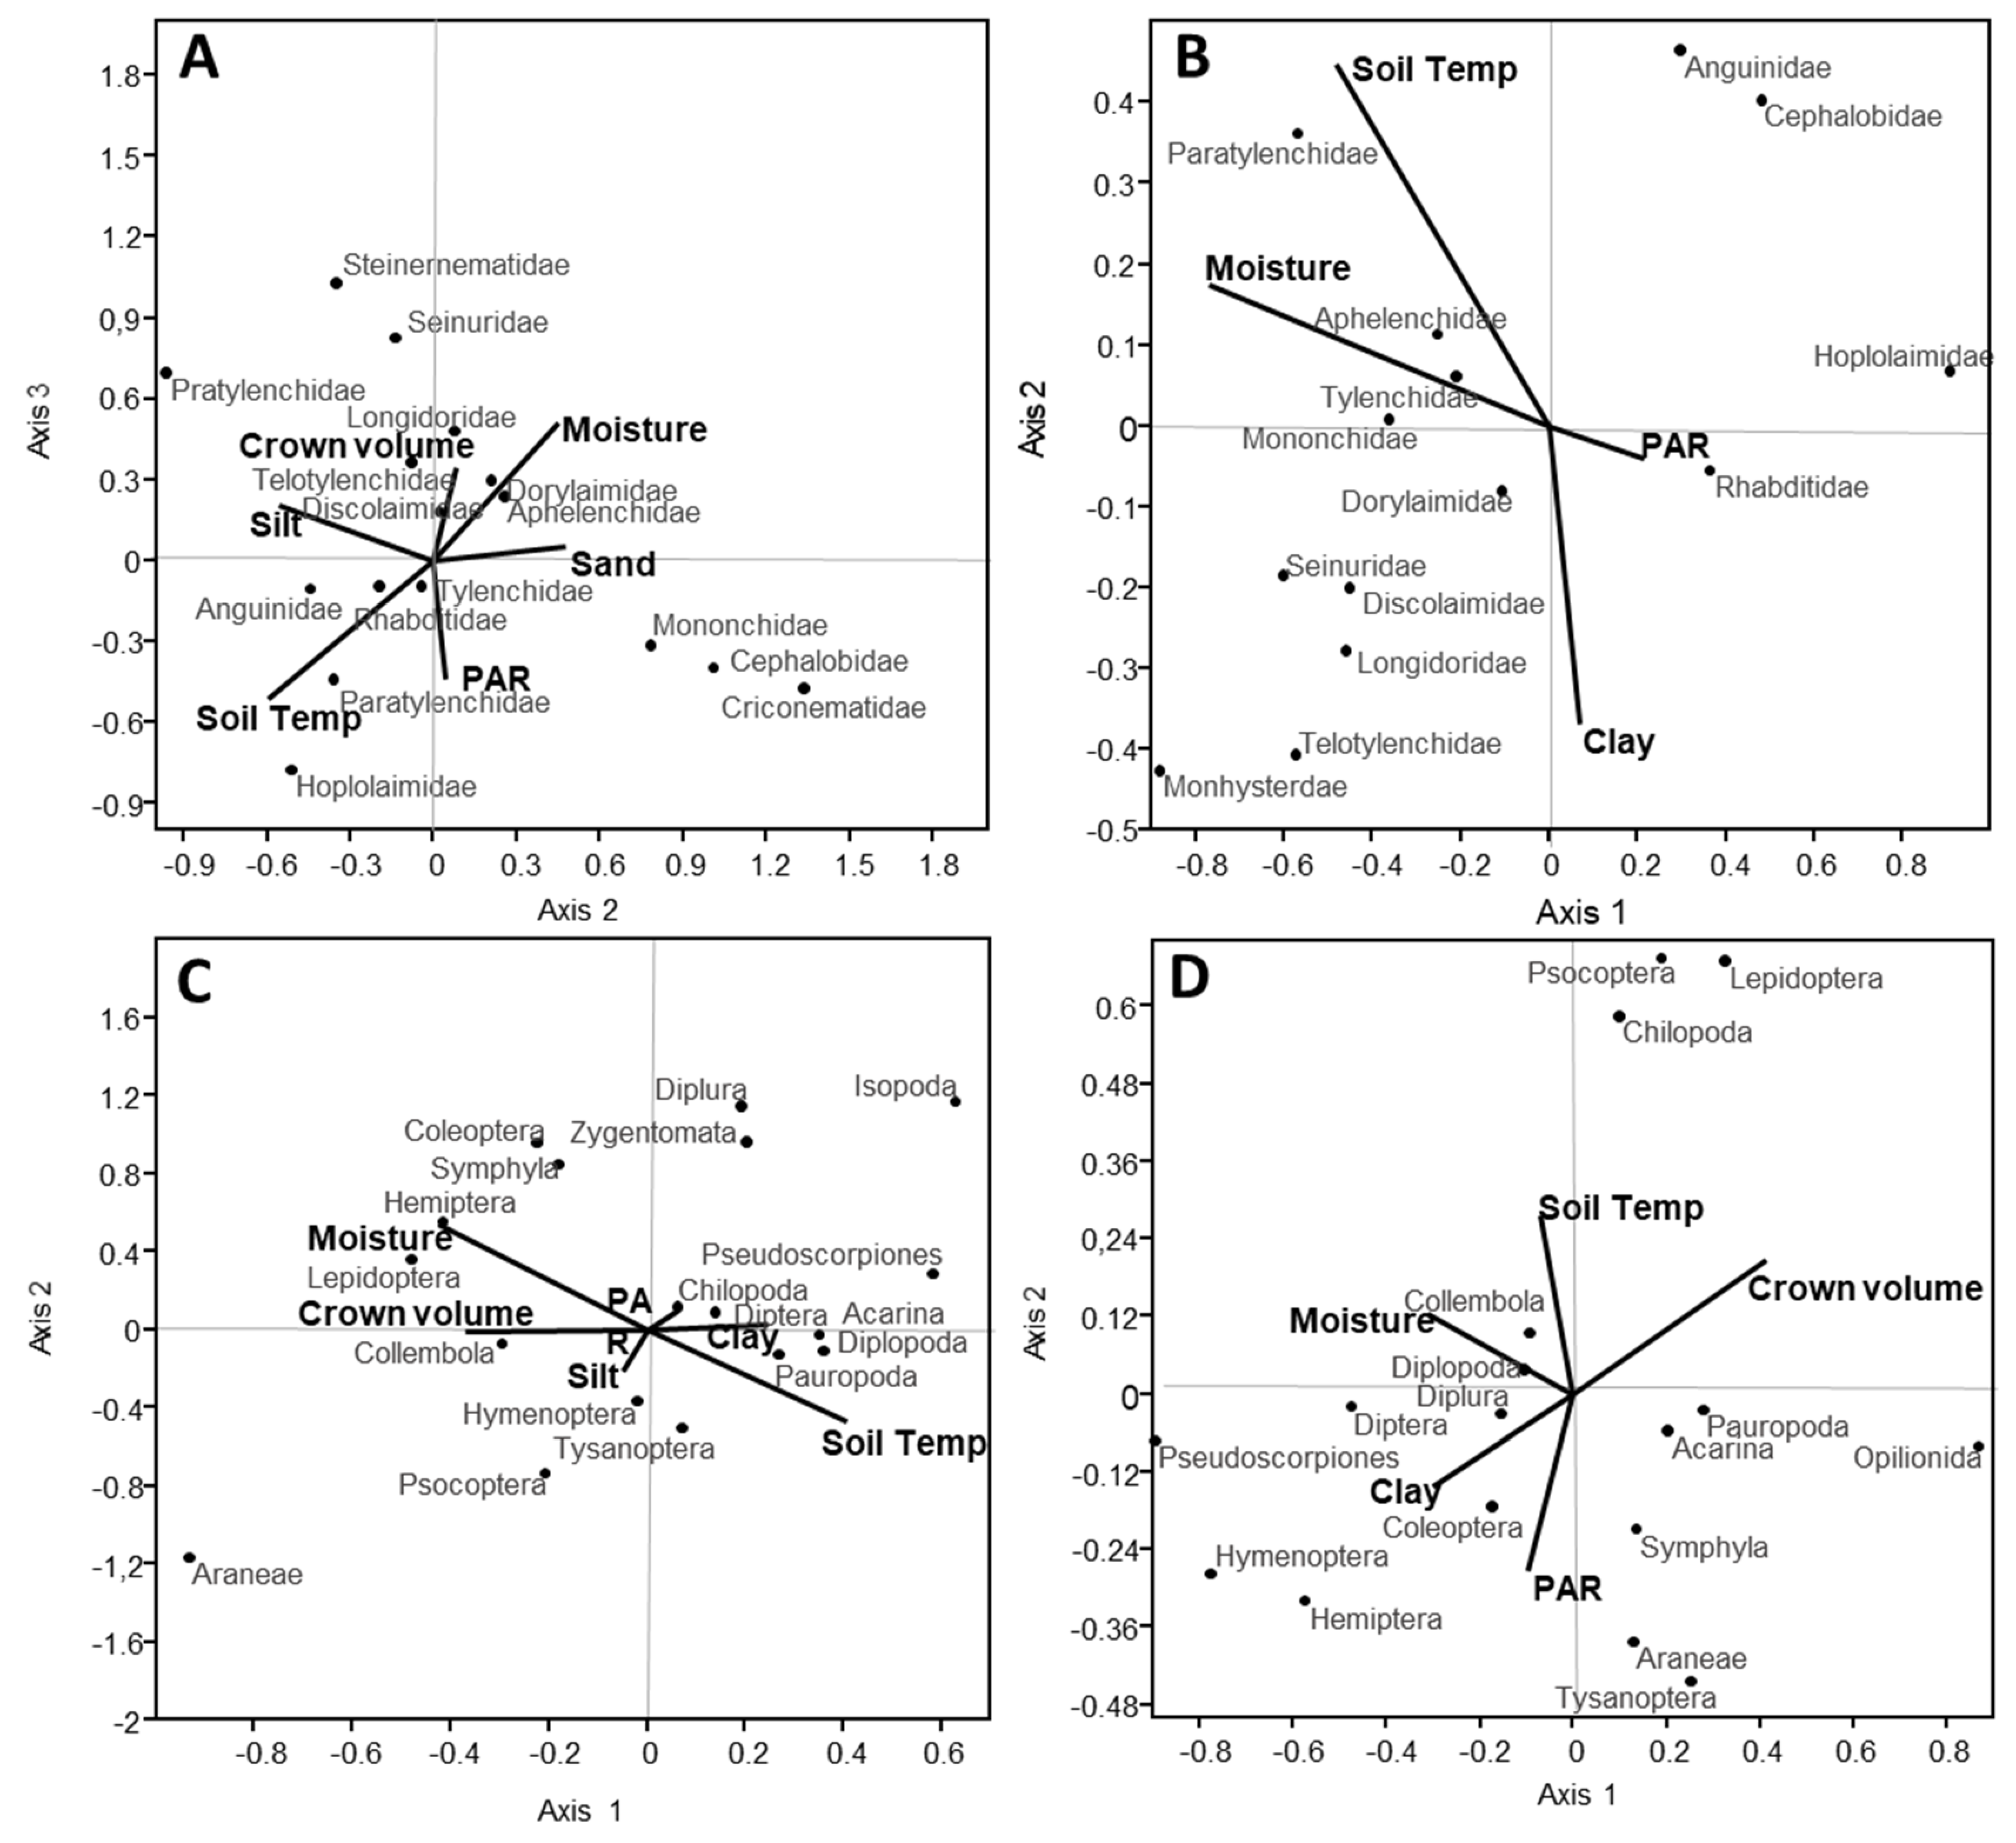
3.5. Relationship among Soil and Forest Variables on Nematode and Microarthropod Community Structure

The CCA, conducted between nematode taxa abundance and environmental variables, evidenced that abundance of nematode taxa was mainly influenced by hydro-climatic parameters and physical properties in both sites (Figure 4). Moreover, the most abundant families, such as Rhabditidae, Tylenchidae, Dorylaimidae, and Aphelenchidae, were poorly affected by environmental parameters. In Pratomagno, axis 2 was dominated by soil temperature (−0.60), silt (−0.56), sand (0.47), and moisture (0.45), while axis 3 was dominated by moisture (0.51), soil temperature (−0.51), PAR (−0.44), and crown volume (0.34). The families of Mononchidae, Cephalobidae, and Criconematidae were positively influenced by sand and moisture. Finally, the families of Seinuridae and Steinernematidae were positively influenced by crown volume and moisture, while the Hoplolaimidae family was positively affected by soil temperature and PAR. In Amiata, axis 1 was driven by moisture (−0.77), soil temperature (−0.48), and PAR (0.21). The family of Monhysteridae was positively influenced by moisture and soil temperature, while the Hoplolaimidae family was negatively affected.
Instead, the CCA, performed between taxa microarthropod and environmental variables, evidenced that abundance of arthropod taxa was mainly influenced by soil temperature and moisture as well as crown volume in both sites (Figure 4). Moreover, the most abundant taxa such as Acarina and Collembola were poorly affected by environmental parameters. In Pratomagno, axis 1 was dominated by soil temperature (0.41), moisture (−0.42), and crown volume (−0.37), while axis 2 was dominated by moisture (0.54) and soil temperature (−0.46). The families of Isopoda and Pseudoscorpiones were positively influenced by soil temperature, while Araneae was positively affected by moisture and crown volume. Finally, the taxa of Diplura, Zygentomata, Coleoptera, and Symphyla were positively influenced by moisture and to a much lesser degree by PAR, while Psocoptera was positively affected by soil temperature and to a much lesser extent by silt. In Amiata, axis 1 was driven by crown volume (0.41), moisture (0.31), and clay (0.30). The Opilionida was positively influenced by crown volume, and Pseudoscorpiones and Hymenoptera by moisture and clay.
The biplot of CCA conducted between soil nematode indicators and environmental variables showed that MI, PPI, EI, SI, H, and D were the least influenced by the environmental gradient established within the study plots (Figure 5). In Pratomagno, axis 1 was dominated by sand (0.38) and soil temperature (0.29); BI, which was the most distant from the origin and thus varied the most within this gradient, was positively influenced by sand and to a lesser extent by PAR. In Amiata, axis 1 was dominated by moisture (0.61), soil temperature (0.43), and silt (0.30), and CI was affected by moisture, soil temperature, and, to a lesser extent, by silt.
Instead, the biplot of CCA performed between soil microarthropod indicators and environmental variables showed that QBS-ar was not influenced by the environmental gradient established within the study plots (Figure 5). In Pratomagno, axis 1 was dominated by silt (0.36), moisture (0.25), and clay (0.24), while axis 2 was dominated by moisture (0.44) and soil temperature (−0.33). D, which was the most distant from the origin and thus varied the most within this gradient, was positively related to silt and, to a lesser degree, to crown volume. In Amiata, axis 1 was dominated by moisture (0.49), crown volume (−0.43), and clay (0.31), while axis 2 was dominated by soil temperature (0.46), clay (−0.33), and sand (0.29). H, which was the most distant from the origin and thus varied the most within this gradient, was affected by moisture.

4. Discussion

The selected sites represented different climatic areas and allowed a full evaluation of thinning effectiveness on a regional scale. The two selected climatic areas were classified as Csa and Csb (Köppen Climate Classification) for Pratomagno and Amiata, respectively. Furthermore, these sites were located at different elevations and latitudes and were composed by different age stands. Soil mesofauna was influenced by a combination of factors including floristic composition, soil physico-chemical characteristics, latitude, and elevation [42,43]. In fact, the two sites showed different nematode and microarthropod abundance of taxa [17]. Nonetheless, richness and values of biodiversity indicators were similar and evidenced that these sites were still degraded before thinning. After removing the tree canopy, higher levels of solar radiation reached forest ground, organic matter input patterns were altered, and temperature and moisture fluctuation increased in the top 10 cm of soil [11,44]. For this reason, this study was designed to evaluate the effects on invertebrate dwelling in the upper 10 cm.

4.1. Effect of Thinnings on Soil Nematode and Microarthropod Community Structures

The thinning determined a modification of the spatial structure of the vertical layer of the stand. However, this change occurred in a different way when comparing the two tested managements. The selective thinning, whose purpose was to benefit the candidate trees, freeing their crown from direct competition of other plant competitors, acts above all in the upper layer removing dominant or co-dominant trees. This generates, in the years immediately after the intervention, a different modification of the horizontal structure of the stands. Differently, the thinning from below (where only dominated, damaged, or ill trees are harvested) leads to an increase in light regime on the ground, which is more homogeneously distributed on the ground. After the selective thinning (which concentrates the harvest only around the candidate plants), the decrease in PAR is more pronounced because the competing plants in the dominant plane have a high canopy volume. Consequently, the distribution of light at ground level is also more irregular due to the alternating presence of micro-gaps and brim cover [45,46].
The reforestation with black pine along the Apennine ridge was established in degraded areas at risk of erosion to provide a first cover consisting of pioneer species. The global thinning effects were minimal: during the three years of the survey, soil nematode communities showed no variation for management and site, while the microarthropod communities showed minimal changes for management and limited differences per site.
The effects of thinning practices were only temporary and varied from year to year. As shown by MDS, the soil nematode community shifted during the first and third years of thinning managements only in the Pratomagno site, while the soil microarthropod community shifted in both sites only in 2017.
In agreement with Bird et al. [5] as well as Peck and Niwa [12], the total abundance of nematodes was minimally affected by thinning practices. Instead, the nematode community composition showed a more evident shift. Generally, bacterial and fungal feeder nematodes were moderately affected by these practices, while omnivores and predators were more negatively influenced. Forge and Simard [47] and Sohlenius [48] found similar results after clear-cutting. Indeed, as already reported by Huhta et al. [11], the effect of thinning and clear-cutting is similar, but varies in the intensity of its impact since it is transitory in the first years.
The different thinning practices had only a negligible influence on the plant-parasitic nematode assemblage. In particular, the individuals belonging to the Longidoridae family decreased, but only in the first year (2016) in the Pratomagno site. Regarding entomopathogenic nematodes, only individuals of Steinernema carpocapsae were isolated in CTR in the Pratomagno site, despite the high number and diversity of EPNs found in the Italian pinewoods [49]. This species was found in the same plot, in accordance with De Luca et al. [50], who reported that EPN populations are both spatially and temporally extremely patchy, within and among sites.
Several authors reported discordant results on the abundance of microarthropods due to thinning. In line with Huhta et al. [11] and Bird et al. [5], microarthropod abundance decreased in the second year after thinning in Pratomagno. Instead, in accordance with Peck and Niwa [12], no variation in abundance was reported in the Amiata site. These opposite results could be explained considering that the impact of canopy reduction in thinning could also be influenced by site characteristics such as elevation and soil properties. In this study, the reduction of microarthropod abundance was only evident in the site located at higher elevation and with acid soil. However, in this site, in the first year after thinning, a higher number of taxa was recorded in the selective thinning due to the new environmental conditions. Mites and collembola, the numerically dominant taxa, were the least affected by thinning in terms of abundance and species diversity. This is in contrast with what was reported by Bird et al. [5], but in line with what was found by Peck et al. [12] about springtails. By contrast, significant differences were found among the other taxa in relation to the soil depth at which they live [39]. The eu-edaphic group, mainly Chilopoda, Diplopoda, and Pauropoda, was never influenced by thinning in both sites, while the hemi-edaphic group, mainly Coleoptera, and the epi-edaphic group, Diptera, Hymenoptera, Tysanoptera, and Hemiptera, were only negatively affected by thinning [11].
In general, nematode and microarthropod indicator values were low, confirming that these soils are often degraded and have low biodiversity [48]. Although, these results only reflect short-term changes in response to thinning, and biodiversity and soil quality were scarcely affected. Moreover, even though Shannon-Weiner and Simpson indices showed significant differences, their overall results for nematodes were relatively inconsistent. By contrast, soil biological quality indicators evidenced some changes. In Pratomagno, PPI revealed a decrease in selective thinning due to the reduction of individuals belonging to the Longidoridae family. In Amiata, the highest levels of solar radiation and the highest temperature range and rainfall on soil among the surveyed plots produced the highest EI value in thinned managements (especially in thinning from below) due to the increase of r-strategy nematodes. However, at the same time, they caused the lowest CI values due to a reduction of fungal feeder nematodes higher than that of the bacterial ones. Regarding microarthropods, both biodiversity (H, D) and soil biological quality (QBS-ar) indicators evidenced an improvement in thinning from below in both sites. Thinning from below, which is less intense with a more homogeneous amount of sunlight on the soil, probably allowed a more rapid recovery than selective thinning [51].
Soil nematode and microarthropod indicators also showed an annual shift in both sites, but with a different trend. As already reported by Landi et al. [52], nematodes MI, EI, CI, and D were affected by rainfall: the lowest values of MI and CI and the highest values of EI and D were recorded in the drought year (2017). In fact, the colonizer species were favored during the drought year (particularly those belonging to the Rhabditidae family); at the same time, many species remained inactive and this increased the dominance effects. However, SI was not affected, indicating that the soil nematode structure remained stable. By contrast, in both sites, QBS-ar values for microarthropods increased in the drought year (2017). This result indicates that microarthropods could benefit more from soil temperature than from moisture.

4.2. Environmental Parameters Influencing Soil Nematode and Microarthropod Structure

In general, the most abundant taxa, such as Rhabditidae and Tylenchidae for nematodes and mites and collembola for microarthropods, were not influenced by the parameters explored in this study. In fact, these taxa are widely distributed in the world and well adapted to every latitude and altitude. Thus, we suggest that their total abundance was only moderately affected by thinning practices.
In both sites, hydro-climatic parameters played a major role in influencing soil nematode and microarthropod communities [53]. As expected, several nematode families could benefit from the increase in soil moisture. In the Pratomagno site characterized by loam soil, the soil moisture positively affected the families Cephalobidae, Mononchidae, Criconematidae, Seinuridae, and Steinernematidae. For the latter two, the crown volume, higher in the unmanaged stand than the thinned ones, also contributed to enhance their growth. On the contrary, in the Amiata site characterized by silty clay loam soil, only the Monhysteridae family was positively affected by soil moisture and soil temperature. As previously reported by Baujard and Martiny [54], the hoplolaimids are positively affected by temperature up to 34 °C, while the low moisture levels cause quiescence by anhydrobiosis. This behavior may explain why a temperature increase due to thinning benefited the Hoplolaimidae family in Pratomagno (a site characterized by higher elevation and lower temperatures), while the increase of temperature and moisture negatively affected the same family in the Amiata site (located at a lower elevation and characterized by higher temperatures and clay-rich soils).
Mackay et al. [53] and Špaldoňová and Frouz [55] asserted that soil temperature has a greater effect on microarthropod populations than soil moisture. Our study confirmed their results only in the Pratomagno site for the taxa Isopoda, Pseudoscorpiones, and Psocoptera [55,56,57]. Conversely, the taxa Araneae, Diplura, Zygentomata, Coleoptera, and Symphyla appeared more influenced by soil moisture in the same site [58,59,60,61]. Moreover, the combination of soil moisture and heavy soil positively affected the taxa Pseudoscorpiones and Hymenoptera in the Amiata site. This result, in contrast with Villarreal et al. [57], might be explained in terms of reduced water availability in soil rich with clay.
Weak correlations were found between nematode and microarthropod community indices and environmental parameters. In nematodes, a positive correlation between both loam texture and PAR with BI was found in Pratomagno, while soil temperature and moisture improved CI in Amiata. These correlations suggest that PAR in soil with loam texture enhanced the basal food web represented by cp 2 bacterial and fungal feeders (nematode with high colonization ability), while the increase of soil hydroclimatic parameters (soil temperature and moisture) benefited the fungal channel more than the bacterial one in Amiata. As regards microarthropods, QBS-ar located at the origin of the plot indicated no reduction in taxonomic richness. Therefore, different values in Shannon-Weiner and Simpson indices could be attributed only to variation in community evenness. The unmanaged forest, where a higher amount of crown volume is still present due to the lack of tree removal, showed a dominance of some taxa in Pratomagno, whereas the increase of soil moisture in a heavy soil, such as those in Amiata, enhanced soil biodiversity.

5. Conclusions

Several decades after the establishment of black pine forests, these ecosystems still showed a low biodiversity for soil nematodes. The biodiversity indices evidenced a degraded soil environment in which colonizing species were dominant. On the other hand, QBS-ar values for microarthropods were consistent with those usually measured in forest environments at the Amiata site, while they were lower in the Pratomagno site.
At temperate latitudes, the thinning caused only a negligible and transitory loss of biodiversity. Nematodes were affected only in the first two years after thinning with a predator reduction in both sites. However, during the three years of monitoring, the nematode indicators remained quite constant. As regards microarthropods, the Shannon-Weiner index and the QBS-ar increased in thinning from below in both sites. On the other hand, in selective thinning, a loss of biodiversity was found, particularly in the hemi-edaphic microarthropods beetles. The extreme climatic conditions created by a more intense thinning, soil temperature, and moisture were key factors in affecting soil nematode and microarthropods communities. These results show that forest management by thinning may improve mesofauna biodiversity. In fact, thinning from below improved nematode and microarthropod biodiversity even in the short term. We can hypothesize that selective thinning might enhance mesofauna biodiversity in a longer period.

Supplementary Materials

The following are available online at https://www.mdpi.com/1999-4907/11/11/1212/s1, Figure S1: Soil water content and soil temperature measured in three plots with three treatments. A, C, Pratomagno site; B, D, Amiata site; Table S1: Climate, soil, and main forest stand characteristics of two artificial black pine plantations, Pratomagno and Amiata, located in Tuscany (central Italy) before thinning (2015). Table S2: Comparison between weather stations in Pratomagno and Amiata sites. Stations of Regional Hydrological service were located at Villa Cognola (rain) and Vallombrosa (temp) for the Pratomagno site and at Castiglio d’Orcia for the Amiata site. Table S3: SIMPER analysis (TB = Thinning from below, ST = Selective thinning, CTR = Control without thinning) on the abundance of nematode taxa (number of nematodes/ml of soil) in Pratomagno site in 2016. Standard errors (±) are reported. Table S4: SIMPER analysis (TB = Thinning from below, ST = Selective thinning, CTR = Control without thinning) on the abundance of nematode taxa (number of nematodes/ml of soil) in Pratomagno site in 2018. Standard errors (±) are reported. Table S5: SIMPER analysis (TB = Thinning from below, ST = Selective thinning, CTR = Control without thinning) on the abundance of nematode taxa (number of microarthropods/dm3 of soil) in Pratomagno site in 2017. Standard errors (±) are reported. Table S6: SIMPER analysis (TB = Thinning from below, ST = Selective thinning, CTR = Control without thinning) on the abundance of nematode taxa (number of microarthropods/dm3 of soil) in Pratomagno site in 2016. Standard errors (±) are reported.

Author Contributions

S.L. designed the experiment for nematodes and microarthropods, collected and processed the data, and wrote the manuscript; G.d., F.B., G.M., S.S., and G.T., analyzed sampling of nematodes and microarthropods and contributed to manuscript writing; P.F.R., supervised data collection for nematodes and microarthropods and contributed to manuscript writing; U.D.S. and M.M., analyzed sampling of forest parameters and contributed to manuscript writing; L.G., analyzed and processed data for hydroclimatic parameters; P.C., brought the basic ideas, designed the experiment, supervised data collection, and contributed to manuscript writing. All authors have read and agreed to the published version of the manuscript.

Funding

This work was supported by the EU’s LIFE+ “Nature and biodiversity” program through the SelPiBio LIFE project (Innovative silvicultural treatments to enhance soil biodiversity in artificial black pine stands, i.e., LIFE13 BIO/IT/000282) for demonstration of innovative silvicultural treatments in artificial black pine stands.

Conflicts of Interest

The authors declare no conflict of interest.

References

  1. Schaefer, M.; Schauermann, J. The soil fauna of beech forests: Comparison between a mull and a moder soil. Pedobiologia 1990, 34, 299–314. [Google Scholar]
  2. Giller, K.E.; Beare, M.H.; Lavelle, P.; Izac, A.-M.; Swift, M.J. Agricultural intensification, soil biodiversity and agroecosystem function. Appl. Soil Ecol. 1997, 6, 3–16. [Google Scholar] [CrossRef]
  3. Irshad, U.; Villenave, C.; Brauman, A.; Plassard, C. Grazing by nematodes on rhizosphere bacteria enhances nitrate and phosphorus availability to Pinus pinaster seedlings. Soil Biol. Biochem. 2011, 43, 2121–2126. [Google Scholar] [CrossRef]
  4. Salome, C.; Coll, P.; Lardo, E.; Villenave, C.; Blanchart, E.; Hinsinger, P.; Marsden, C.; Le Cadre, E. Relevance of use-invariant soil properties to assess soil quality of vulnerable ecosystems: The case of Mediterranean vineyards. Ecol. Indic. 2014, 43, 83–93. [Google Scholar] [CrossRef]
  5. Bird, S.B.; Coulson, R.N.; Fisher, R.F. Changes in soil and litter arthropod abundance following tree harvesting and site preparation in a loblolly pine (Pinus taeda L.) plantation. For. Ecol. Manag. 2004, 202, 195–208. [Google Scholar] [CrossRef]
  6. Roversi, P.F.; Nannelli, R. Arthropods and Nematodes: Functional Biodiversity in Forest Ecosystems. In Forest Ecosystems–More than Just Trees; Blanco, J.A., Lo, Y.-H., Eds.; INTECH: London, UK, 2012; pp. 29–52. [Google Scholar]
  7. Marchi, M.; Chiavetta, U.; Cantiani, P. Assessing the mechanical stability of trees in artificial plantations of Pinus nigra JF Arnold using the LWN tool under different site indexes. Ann. Silvic. Res. 2017, 41, 48–53. [Google Scholar]
  8. Torras, O.; Saura, S. Effects of silvicultural treatments on forest biodiversity indicators in the Mediterranean. For. Ecol. Manag. 2008, 255, 3322–3330. [Google Scholar] [CrossRef]
  9. Pretzsch, H. Forest dynamics, growth, and yield. In Forest Dynamics, Growth and Yield; Springer: Berlin/Heidelberg, Germany, 2009; pp. 1–39. [Google Scholar]
  10. Kuehne, C.; Weiskittel, A.R.; Fraver, S.; Puettmann, K.J. Effects of thinning-induced changes in structural heterogeneity on growth, ingrowth, and mortality in secondary coastal Douglas-fir forests. Can. J. For. Res. 2015, 45, 1448–1461. [Google Scholar] [CrossRef] [Green Version]
  11. Huhta, V.; Karppinen, E.; Nurminen, M.; Valpas, A. Effect of silvicultural practices upon Arthropos, Annelid and Nematode populations in coniferous forest soil. Ann. Zool. Fenn. 1967, 4, 87–145. [Google Scholar]
  12. Peck, R.W.; Niwa, C.G. Longer-term effects of selective thinning on microarthropod communities in a late-successional coniferous forest. Environ. Entomol. 2005, 34, 646–655. [Google Scholar] [CrossRef]
  13. Hokazono, S.; Hayashi, K. Variability in environmental impacts during conversion from conventional to organic farming: A comparison among three rice production systems in Japan. J. Clean. Prod. 2012, 28, 101–112. [Google Scholar] [CrossRef]
  14. Landi, S.; Papini, R.; d’Errico, G.; Barzanti, G.P.; Roversi, P.F. Nematode indicators as integrative measures of soil condition during conversion from conventional to organic rice production in Italy: A case study. Biol. Agric. Hortic. 2018, 34, 141–153. [Google Scholar] [CrossRef]
  15. Cantiani, P. Il diradamento selettivo. In Accrescere Stabilità e Biodiversità in Boschi Artificiali di Pino Nero. Manuale Tecnico SelPiBioLife; Compagnia delle Foreste: Arezzo, Italy, 2016. [Google Scholar]
  16. United States Department of Agriculture. Soil Survey Staff Keys to Soil Taxonomy, 12th ed.; Natural Resources Conservation Service: Washington, DC, USA, 2014.
  17. Barbato, D.; Perini, C.; Mocali, S.; Bacaro, G.; Tordoni, E.; Maccherini, S.; Marchi, M.; Cantiani, P.; De Meo, I.; Bianchetto, E.; et al. Teamwork makes the dream work: Disentangling cross-taxon congruence across soil biota in black pine plantations. Sci. Total Environ. 2019, 656, 659–669. [Google Scholar] [CrossRef] [PubMed]
  18. Marchi, M.; Paletto, A.; Cantiani, P.; Bianchetto, E.; De Meo, I. Comparing thinning system effects on ecosystem services provision in artificial black pine (Pinus nigra JF Arnold) forests. Forests 2018, 9, 188. [Google Scholar] [CrossRef] [Green Version]
  19. Cantiani, P.; Marchi, M. A spatial dataset of forest mensuration collected in black pine plantations in central Italy. Ann. For. Sci. 2017, 74, 50. [Google Scholar] [CrossRef]
  20. Costantini, E.A.C. Linee Guida dei Metodi di rilevamento e Informatizzazione dei dati Pedologici; CRA-ABP: Firenze, Italy, 2007; p. 296. [Google Scholar]
  21. MiPAAF; Osservatorio Nazionale Pedologico; Marcello Pagliai. Metodi di Analisi Fisica del Suolo; Ministero per le Politiche Agricole e Forestali: Rome, Italy, 1998; p. 400. ISBN 8846404262. [Google Scholar]
  22. MiPAAF. Official Methods of Soil Chemical Analysis; Gazzetta Ufficiale Supplemento Ordinario No. 248; Istituto Poligrafico e Zecca dello Stato: Rome, Italy, 1999. [Google Scholar]
  23. Calzolari, C.; Sartori, G.; Magaldi, D. I suoli argillosi a nord di Campiglia d’Orcia (Siena); Quaderni di scienza del suolo, Vol. II-National Research Council: Florence, Italy, 1989. [Google Scholar]
  24. Gardin, L.; Vinci, A. Carta dei Suoli della Regione Toscana in Scala 1: 250.000. Available online: http://sit.lamma.rete.toscana.it/websuoli/ (accessed on 17 November 2020).
  25. Reynolds, W.D.; Elrick, D.E. A method for simultaneous in situ measurement in the vadose zone of field-saturated hydraulic conductivity, sorptivity and the conductivity-pressure head relationship. Groundw. Monit. Remediat. 1986, 6, 84–95. [Google Scholar] [CrossRef]
  26. Pretzsch, H.; Biber, P.; Uhl, E.; Dahlhausen, J.; Rötzer, T.; Caldentey, J.; Koike, T.; Van Con, T.; Chavanne, A.; Seifert, T.; et al. Crown size and growing space requirement of common tree species in urban centres, parks, and forests. Urban For. Urban Green. 2015, 14, 466–479. [Google Scholar] [CrossRef] [Green Version]
  27. Tabacchi, G.; Di Cosmo, L.; Gasparini, P. Aboveground tree volume and phytomass prediction equations for forest species in Italy. Eur. J. For. Res. 2011. [Google Scholar] [CrossRef]
  28. Mai, W.F. Pictorial Key to Genera of Plant-Parasitic Nematodes. In Nematode Identification and Expert System Technology; Fortuner, R., Ed.; Nato ASI Series (Series A: Life Sciences); Springer: Boston, MA, USA, 1988; Volume 7, pp. 31–34. [Google Scholar]
  29. Bongers, T. De Nematoden van Nederland: Een Identificatietabel voor de in Nederland Aangetroffen Zoetwater-en Bodembewonende Nematoden; Koninklijke Nederlandse Natuurhistorische Vereniging: Zeist, The Netherlands, 1988. [Google Scholar]
  30. Marinari-Palmisano, A.; Vinciguerra, M. Classificazione dei nematodi. In Nematologia Agraria Generale e Applicata; Ambrogioni, L., d’Errico, F.P., Greco, N., Marinari-Palmisano, A., Roversi, F.P., Eds.; Soc. Italiana di Nematologia: Bari, Italy, 2014; pp. 23–42. [Google Scholar]
  31. Yeates, G.W.; Bongers, T.D.; De Goede, R.G.M.; Freckman, D.W.; Georgieva, S.S. Feeding habits in soil nematode families and genera—An outline for soil ecologists. J. Nematol. 1993, 25, 315–331. [Google Scholar]
  32. Okada, H.; Harada, H.; Kadota, I. Fungal-feeding habits of six nematode isolates in the genus Filenchus. Soil Biol. Biochem. 2005, 37, 1113–1120. [Google Scholar] [CrossRef]
  33. Bongers, T. The maturity index: An ecological measure of environmental disturbance based on nematode species composition. Oecologia 1990, 83, 14–19. [Google Scholar] [CrossRef] [PubMed]
  34. Ferris, H.; Bongers, T.; De Goede, R.G.M. A framework for soil food web diagnostics: Extension of the nematode faunal analysis concept. Appl. Soil Ecol. 2001, 18, 13–29. [Google Scholar] [CrossRef]
  35. Bedding, R.A.; Akhurst, R.J. A simple technique for the detection of insect paristic rhabditid nematodes in soil. Nematologica 1975, 21, 109–110. [Google Scholar] [CrossRef]
  36. Landi, S.; Pennacchio, F.; Papini, R.; d’Errico, G.; Torrini, G.; Strangi, A.; Barabaschi, D.; Roversi, P.F. Evaluation of sheep grazing effects on nematode community, insect infestation and soil fertility in sweet chestnut orchards: A case of study. Redia 2016, 99, 117. [Google Scholar]
  37. Kaya, H.K.; Stock, P. Techniques in insect nematology. In Manual of Techniques in Insect Pathology; Lacey, L.A., Ed.; Academic Press: London, UK, 1997; pp. 281–324. [Google Scholar]
  38. Nguyen, K.; Hunt, D. Entomopathogenic Nematodes: Systematics, Phylogeny and Bacterial Symbionts; Brill: Leiden, The Netherlands, 2007. [Google Scholar]
  39. Parisi, V.; Menta, C.; Gardi, C.; Jacomini, C.; Mozzanica, E. Microarthropod communities as a tool to assess soil quality and biodiversity: A new approach in Italy. Agric. Ecosyst. Environ. 2005, 105, 323–333. [Google Scholar] [CrossRef]
  40. Hammer, O.; Harper, D.A.T.; Ryan, P.D. Past version 1.95: Paleontological Statistical Software Package for Education and Data Analysis. Paleontología Electrónica 2001, 4, 9. [Google Scholar]
  41. Clarke, K.R. Non-parametric multivariate analysis of changes in community structure. Aust. J. Ecol. 1993, 18, 117–143. [Google Scholar] [CrossRef]
  42. Jiang, Y.; Yin, X.; Wang, F. Composition and Spatial Distribution of Soil Mesofauna along an Elevation Gradient on the North Slope of the Changbai Mountains, China. Pedosphere 2015, 25, 811–824. [Google Scholar] [CrossRef]
  43. Lazzaro, L.; Mazza, G.; d’Errico, G.; Fabiani, A.; Giuliani, C.; Inghilesi, A.F.; Lagomarsino, A.; Landi, S.; Lastrucci, L.; Pastorelli, R. How ecosystems change following invasion by Robinia pseudoacacia: Insights from soil chemical properties and soil microbial, nematode, microarthropod and plant communities. Sci. Total Environ. 2018, 622, 1509–1518. [Google Scholar] [CrossRef]
  44. Bird, G.A.; Chatarpaul, L. Effect of forest harvest on decomposition and colonization of maple leaf litter by soil microarthropods. Can. J. Soil Sci. 1988, 68, 29–40. [Google Scholar] [CrossRef]
  45. Becagli, C.; Puletti, N.; Chiavetta, U.; Cantiani, P.; Salvati, L.; Fabbio, G. Early impact of alternative thinning approaches on structure diversity and complexity at stand level in two beech forests in Italy. Ann. Silvic. Res. 2013, 37, 55–63. [Google Scholar]
  46. Di Salvatore, U.; Tonti, D.; Chiavetta, U.; Cantiani, P.; Fabbio, G.; Becagli, C.; Bertini, G.; Sansone, D.; Skudnik, M.; Kobal, M. ManFor C.BD sites and the drivers of forest functions. Ital. J. Agron. 2016, 11, 64–95. [Google Scholar]
  47. Forge, T.; Simard, S. Structure of nematode communities in forest soils of southern British Columbia: Relationships to nitrogen mineralization and effects of clearcut harvesting and fertilization. Biol. Fertil. Soils 2001, 34, 170–178. [Google Scholar]
  48. Sohlenius, B. Influence of clear-cutting and forest age on the nematode fauna in a Swedish pine forest soil. Appl. Soil Ecol. 2002, 19, 261–277. [Google Scholar] [CrossRef]
  49. Tarasco, E.; Clausi, M.; Rappazzo, G.; Panzavolta, T.; Curto, G.; Sorino, R.; Oreste, M.; Longo, A.; Leone, D.; Tiberi, R. Biodiversity of entomopathogenic nematodes in Italy. J. Helminthol. 2014, 89, 359–366. [Google Scholar] [CrossRef]
  50. De Luca, F.; Clausi, M.; Troccoli, A.; Curto, G.; Rappazzo, G.; Tarasco, E. Entomopathogenic nematodes in Italy: Occurrence and use in microbial control strategies. In Nematode Pathogenesis of Insects and Other Pests; Springer: Berlin/Heidelberg, Germany, 2015; pp. 431–449. [Google Scholar]
  51. Bird, S.; Coulson, R.N.; Crossley, D.A., Jr. Impacts of silvicultural practices on soil and litter arthropod diversity in a Texas pine plantation. For. Ecol. Manag. 2000, 131, 65–80. [Google Scholar] [CrossRef]
  52. Landi, S.; d’Errico, G.; Simoncini, S.; L’Abate, G.; Priori, S. Nematode communities as indicators of soil quality in vineyard system: A case of study in degraded areas. EQA-Int. J. Environ. Qual. 2018, 31, 41–46. [Google Scholar] [CrossRef]
  53. Mackay, W.P.; Silva, S.; Lightfoot, D.C.; Pagani, M.I.; Whitford, W.G. Effect of increased soil moisture and reduced soil temperature on a desert soil arthropod community. Am. Midl. Nat. 1986, 116, 45–56. [Google Scholar] [CrossRef]
  54. Baujard, P.; Martiny, B. Ecology and pathogenicity of the Hoplolaimidae (Nemata) from the sahelian zone of West Africa. 2. Laboratory studies on Scutellonema cavenessi Sher, 1964. Fundam. Appl. Nematol. 1995, 18, 335–346. [Google Scholar]
  55. Špaldoňová, A.; Frouz, J. Decomposition of Forest Litter and Feces of Armadillidium vulgare (Isopoda: Oniscidea) Produced from the Same Litter Affected by Temperature and Litter Quality. Forests 2019, 10, 939. [Google Scholar] [CrossRef] [Green Version]
  56. Throne, J.E.; Flinn, P.W. Distribution of psocids (Psocoptera) in temperature gradients in stored wheat. J. Stored Prod. Res. 2013, 55, 27–31. [Google Scholar] [CrossRef]
  57. Villarreal, E.; Martínez, N.; Ortiz, C.R. Diversity of Pseudoscorpiones (Arthropoda: Arachnida) in two fragments of dry tropical forest in the colombian Caribbean region. Caldasia 2019, 41, 139–151. [Google Scholar] [CrossRef]
  58. Edwards, C.A. The ecology of symphyla part III. Factors controlling soil distributions. Entomologia Experimentalis et Applicata 1961, 4, 239–256. [Google Scholar] [CrossRef]
  59. Mitrovski-Bogdanovic, A.; Blesic, B. Seasonal dynamics of Campodeidae (Diplura) in an oak forest in Kragujevac (Serbia). Acta Entomologica Serbica 2007, 12, 1–10. [Google Scholar]
  60. Shakir, M.M.; Ahmed, S. Seasonal abundance of soil arthropods in relation to meteorological and edaphic factors in the agroecosystems of Faisalabad, Punjab, Pakistan. Int. J. Biometeorol. 2015, 59, 605–616. [Google Scholar] [CrossRef]
  61. Tsafack, N.; Xie, Y.; Wang, X.; Fattorini, S. Influence of Climate and Local Habitat Characteristics on Carabid Beetle Abundance and Diversity in Northern Chinese Steppes. Insects 2020, 11, 19. [Google Scholar] [CrossRef] [Green Version]
Figure 1. Experimental design in the black pine plantations and macro-plots and sampling plots performed in Pratomagno and Amiata sites.
Forests 11 01212 g001
Figure 2. MDS analysis based on Bray–Curtis similarity index of nematode community abundance from soil samples in 2016, 2017, and 2018 in Pratomagno and Amiata sites. Stress tests (S) are reported. Symbols represent different managements: TB (thinning from below) in dark green; ST (selective thinning) in hell green; CTR (control without thinning) in brown.
Forests 11 01212 g002
Figure 3. MDS analysis based on Bray–Curtis similarity index of microarthropod community abundance from soil samples in 2016, 2017, and 2018 in the Pratomagno and Amiata sites. Stress tests (S) are reported. Symbols represent different managements: TB (thinning from below) in dark green; ST (selective thinning) in hell green; CTR (control without thinning) in brown.
Forests 11 01212 g003
Figure 4. Scatter plots of Canonical Correspondence Analysis (CCA) ordination showing relationships between soil and forest properties and taxa abundance. Nematodes: Pratomagno (A), percentage explained was 28.6% for axis 2 (p < 0.007) and 19.4% for axis 3 (p < 0.001), Amiata (B), percentage explained was 70.0% for axis 1 (p > 0.05) and was not significant for axis 2. Microarthropods: Pratomagno (C), percentage explained was 54.5% for axis 1 (p < 0.03) and 25.2% for axis 2 (p < 0.001), Amiata (D), percentage explained was 70.6% for axis 1 (p < 0.04) and was not significant for axis 2.
Forests 11 01212 g004
Figure 5. Scattered plots of CCA ordination showing relationships between soil and forest properties and nematode and microarthropod indicators. MI, maturity index; PPI, plant parasitic index; BI, basal index; EI, enrichment index; SI, structure index; CI, channel index; QBS-ar, Soil biological quality-arthropods; H, Shannon-Weiner index; D, Simpson index. Nematodes: Pratomagno (A), percentage or variance explained was 84.3% for axis 1 (p < 0.05) and was not significant for axis 2, Amiata (B), percentage or variance explained was 78.0% for axis 1 (p < 0.05) and was not significant for axis 2. Microarthropods: Pratomagno (C), percentage or variance explained was 66.3% for axis 1 (p < 0.02) and 33.7% for axis 2 (p < 0.001), Amiata (D), percentage or variance explained was 79.5% for axis 1 (p < 0.03) and 20.5% for axis 2 (p < 0.03).
Forests 11 01212 g005
Table 1. Effects of silvicultural treatments for the main dendrometric and structural parameters in terms of percentage variations (* indicates statistically significant differences in the Tukey’s Test with p-value below 0.05).
SiteTreatmentN. Trees per haBasal AreaStanding VolumeQuadratic Mean DiameterMean HeightCrown VolumePAR
PratomagnoThinning from below−35.9% (*)−22.6% (*)−19.3% (*)+9.55%−4.18%−11.3% (*)+87%
Selective thinning−30.8% (*)−29.4% (*)−29.7% (*)0.00%+0.53%−21.2% (*)+232%
AmiataThinning from below−30.4% (*)−19.7% (*)−18.7% (*)−6.75%+2.23%−24.4% (*)+133%
Selective thinning−34.3% (*)−31.9% (*)−30.7% (*)+2.00%+1.09%−11.2% (*)+413%
Table 2. General analysis of similarities (ANOSIM) result table for nematode and microarthropod abundances in the Pratomagno and Amiata sites from 2016 to 2018 (post-treatment). Significant values are reported in bold.
YearNematodesMicroarthropods
PratomagnoAmiataPratomagnoAmiata
RpRpRpRp
20160.360.04−0.230.860.030.200.050.13
20170.160.370.130.240.110.020.070.05
20180.170.05−0.010.47−0.030.68−0.040.86
Table 3. Effect of different managements on soil nematode indices. TB, thinning from below; ST, selective thinning; CTR, control without thinning; MI, maturity index; PPI, plant parasitic index; EI, enrichment index; SI, structure index; CI, channel index; H, Shannon-Weiner index; D, Simpson index. Standard errors (±) are reported. Different letters indicate significant differences at p < 0.05. Significant differences are highlighted in bold.
ManagementYearSignificant Effect
TBSTCTR201620172018MYM + Y
Pratomagno
MI2.1 ± 0.21.9 ± 0.11.9 ± 0.22.3 ± 0.1 a1.6 ± 0.1 b2.1 ± 0.1 ab0.360.0020.31
PPI2.7 ± 0.3 a2.2 ± 0.1 b2.7 ± 0.3 a3.1 ± 0.3 a2.4 ± 0.04 b2.1 ± 0.1 b0.020.00050.02
EI89.4 ± 2.093.6 ± 1.592.0 ± 2.693.9 ± 1.4 a96.1 ± 1.0 a85.0 ± 1.5 b0.100.000010.56
SI83.5 ± 4.574.8 ± 10.479.7 ± 6.091.1 ± 2.677.5 ± 5.869.4 ± 10.00.700.650.65
CI8.0 ± 1.96.0 ± 1.67.7 ± 2.64.1 ± 0.8 b3.4 ± 0.8 b14.1 ± 1.8 a0.500.000010.67
H1.5 ± 0.11.3 ± 0.11.2 ± 0.21.5 ± 0.1 a1.0 ± 0.2 b1.5 ± 0.1 a0.160.010.72
D0.3 ± 0.040.4 ± 0.040.4 ± 0.050.3 ± 0.02 b0.5 ± 0.04 a0.3 ± 0.02 b0.180.00060.90
Amiata
MI2.0 ± 0.22.1 ± 0.22.2 ± 0.12.3 ± 0.1 a1.7 ± 0.1 b2.4 ± 0.1 a0.560.0040.77
PPI2.4 ± 0.22.1 ± 0.052.2 ± 0.12.3 ± 0.12.3 ± 0.12.2 ± 0.20.250.960.96
EI88.1 ± 3.3 a79.9 ± 5.3 ab74.0 ± 6.8 b82.4 ± 3.7 a93.4 ± 2.2 a66.2 ± 7.0 b0.050.00030.04
SI78.8 ± 4.870.6 ± 5.373.6 ± 6.874.9 ± 6.576.6 ± 6.571.4 ± 3.80.640.830.68
CI11.4 ± 3.3 b18.2 ± 4.524.9 ± 7.4 a17.6 ± 3.7 b5.9 ± 2.1 c31.0 ± 6.3 a0.040.00020.02
H1.3 ± 0.11.3 ± 0.11.3 ± 0.11.3 ± 0.03 a1.1 ± 0.04 b1.4 ± 0.1 a0.790.0020.55
D0.4 ± 0.040.3 ± 0.030.4 ± 0.030.4 ± 0.020.5 ± 0.030.3 ± 0.030.330.0010.03
Table 4. Effect of different managements (M) on soil microarthropod indices through the years (Y). TB, thinning from below; ST, selective thinning; CTR, control without thinning; QBS-ar, soil biological quality-arthropods; H, Shannon-Weiner index; D, Simpson index. Standard errors (±) are reported. Different letters indicate significant differences at p < 0.05. Significant differences are highlighted in bold.
ManagementYearSignificant Effect
TBSTCTR201620172018MYM + Y
Pratomagno
QBS-ar99.8 ± 7.6 a82.0 ± 2.9 b88.9 ± 7.479.3 ± 16.6 b101.0 ± 5.4 a90.3 ± 7.50.050.030.06
H1.3 ± 0.04 a1.1 ± 0.11.0 ± 0.1 b1.3 ± 0.1 a1.2 ± 0.05 b0.9 ± 0.1 b0.020.010.16
D0.3 ± 0.02 b0.4 ± 0.10.5 ± 0.05 a0.4 ± 0.05 b0.4 ± 0.03 b0.5 ± 0.05 a0.040.020.36
Amiata
QBS-ar123.0 ± 8.2123.8 ± 4.4136.8 ± 9.7127.7 ± 5.3144.2 ± 7.7 a111.7 ± 6.4 b0.260.0080.42
H1.3 ± 0.1 a1.1 ± 0.1 b1.2 ± 0.051.3 ± 0.1 a1.1 ± 0.03 b1.1 ± 0.1 b0.020.010.16
D0.3 ± 0.03 b0.5 ± 0.03 a0.4 ± 0.050.3 ± 0.05 b0.5 ± 0.02 a0.4 ± 0.04 a0.030.020.16
Publisher’s Note: MDPI stays neutral with regard to jurisdictional claims in published maps and institutional affiliations.

