
The Characteristic of
Abstract
:1. Introduction
2. Materials and Methods
3. Results
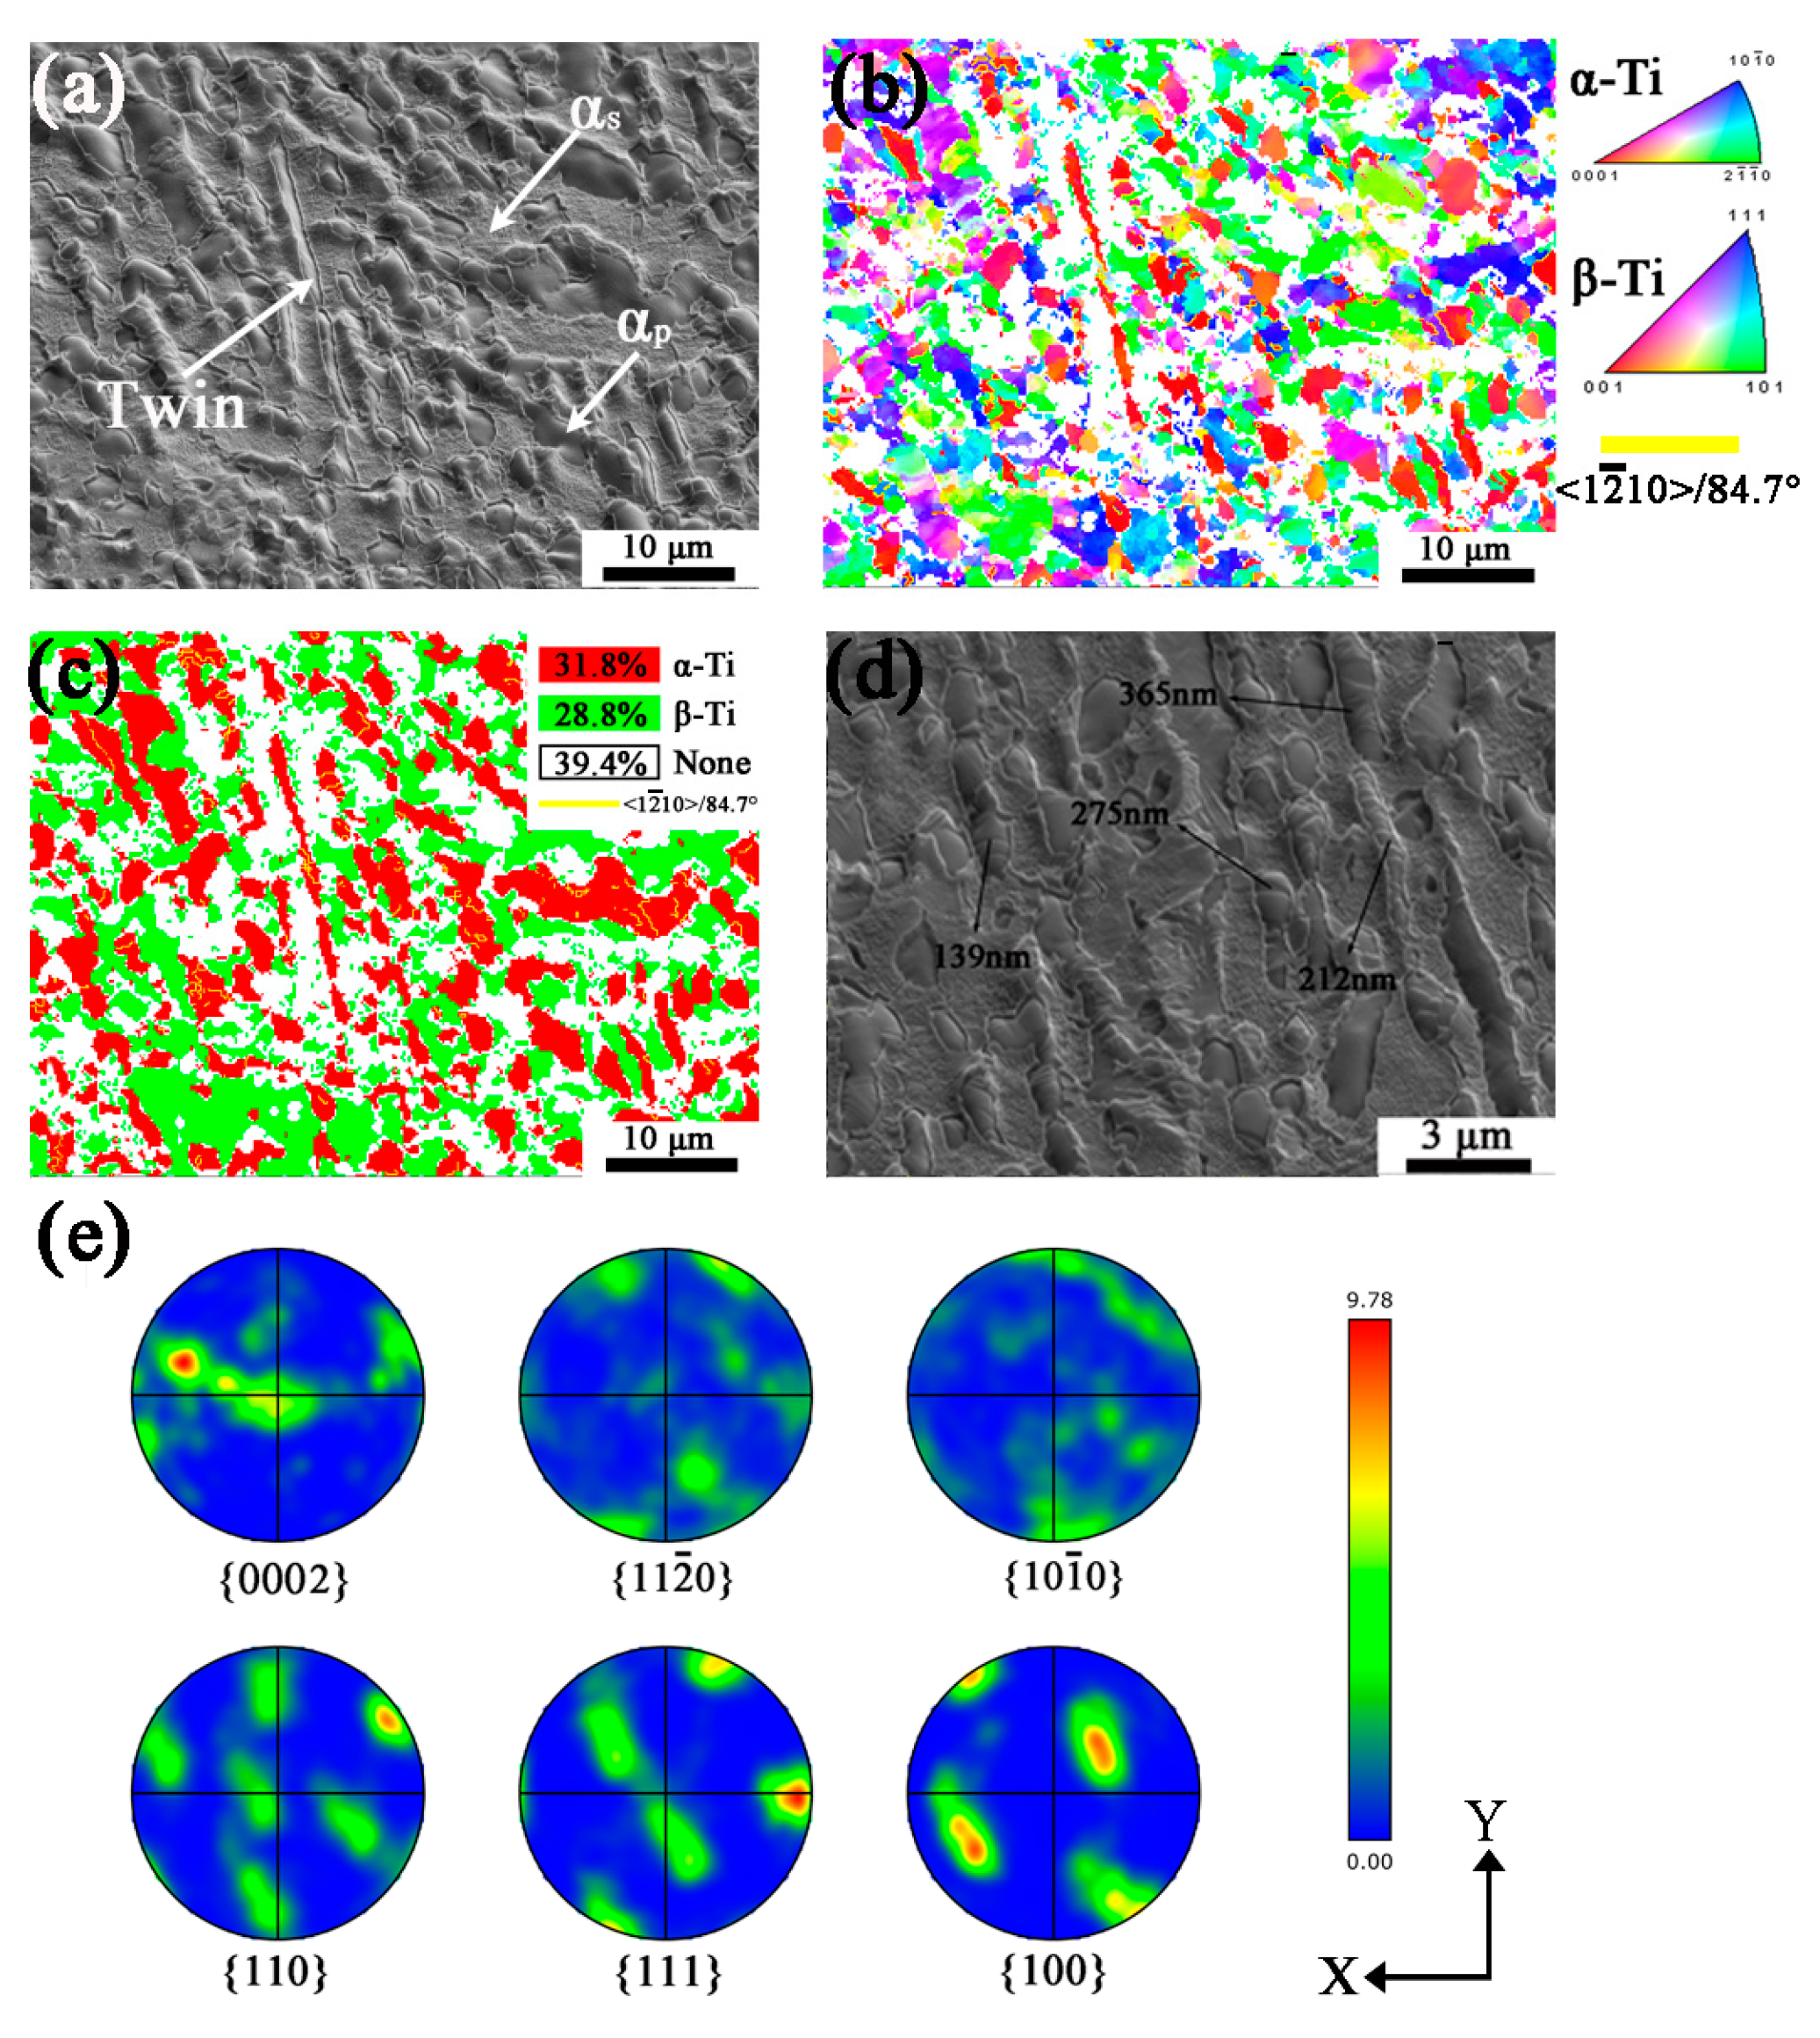
3.1. Initial Microstructure
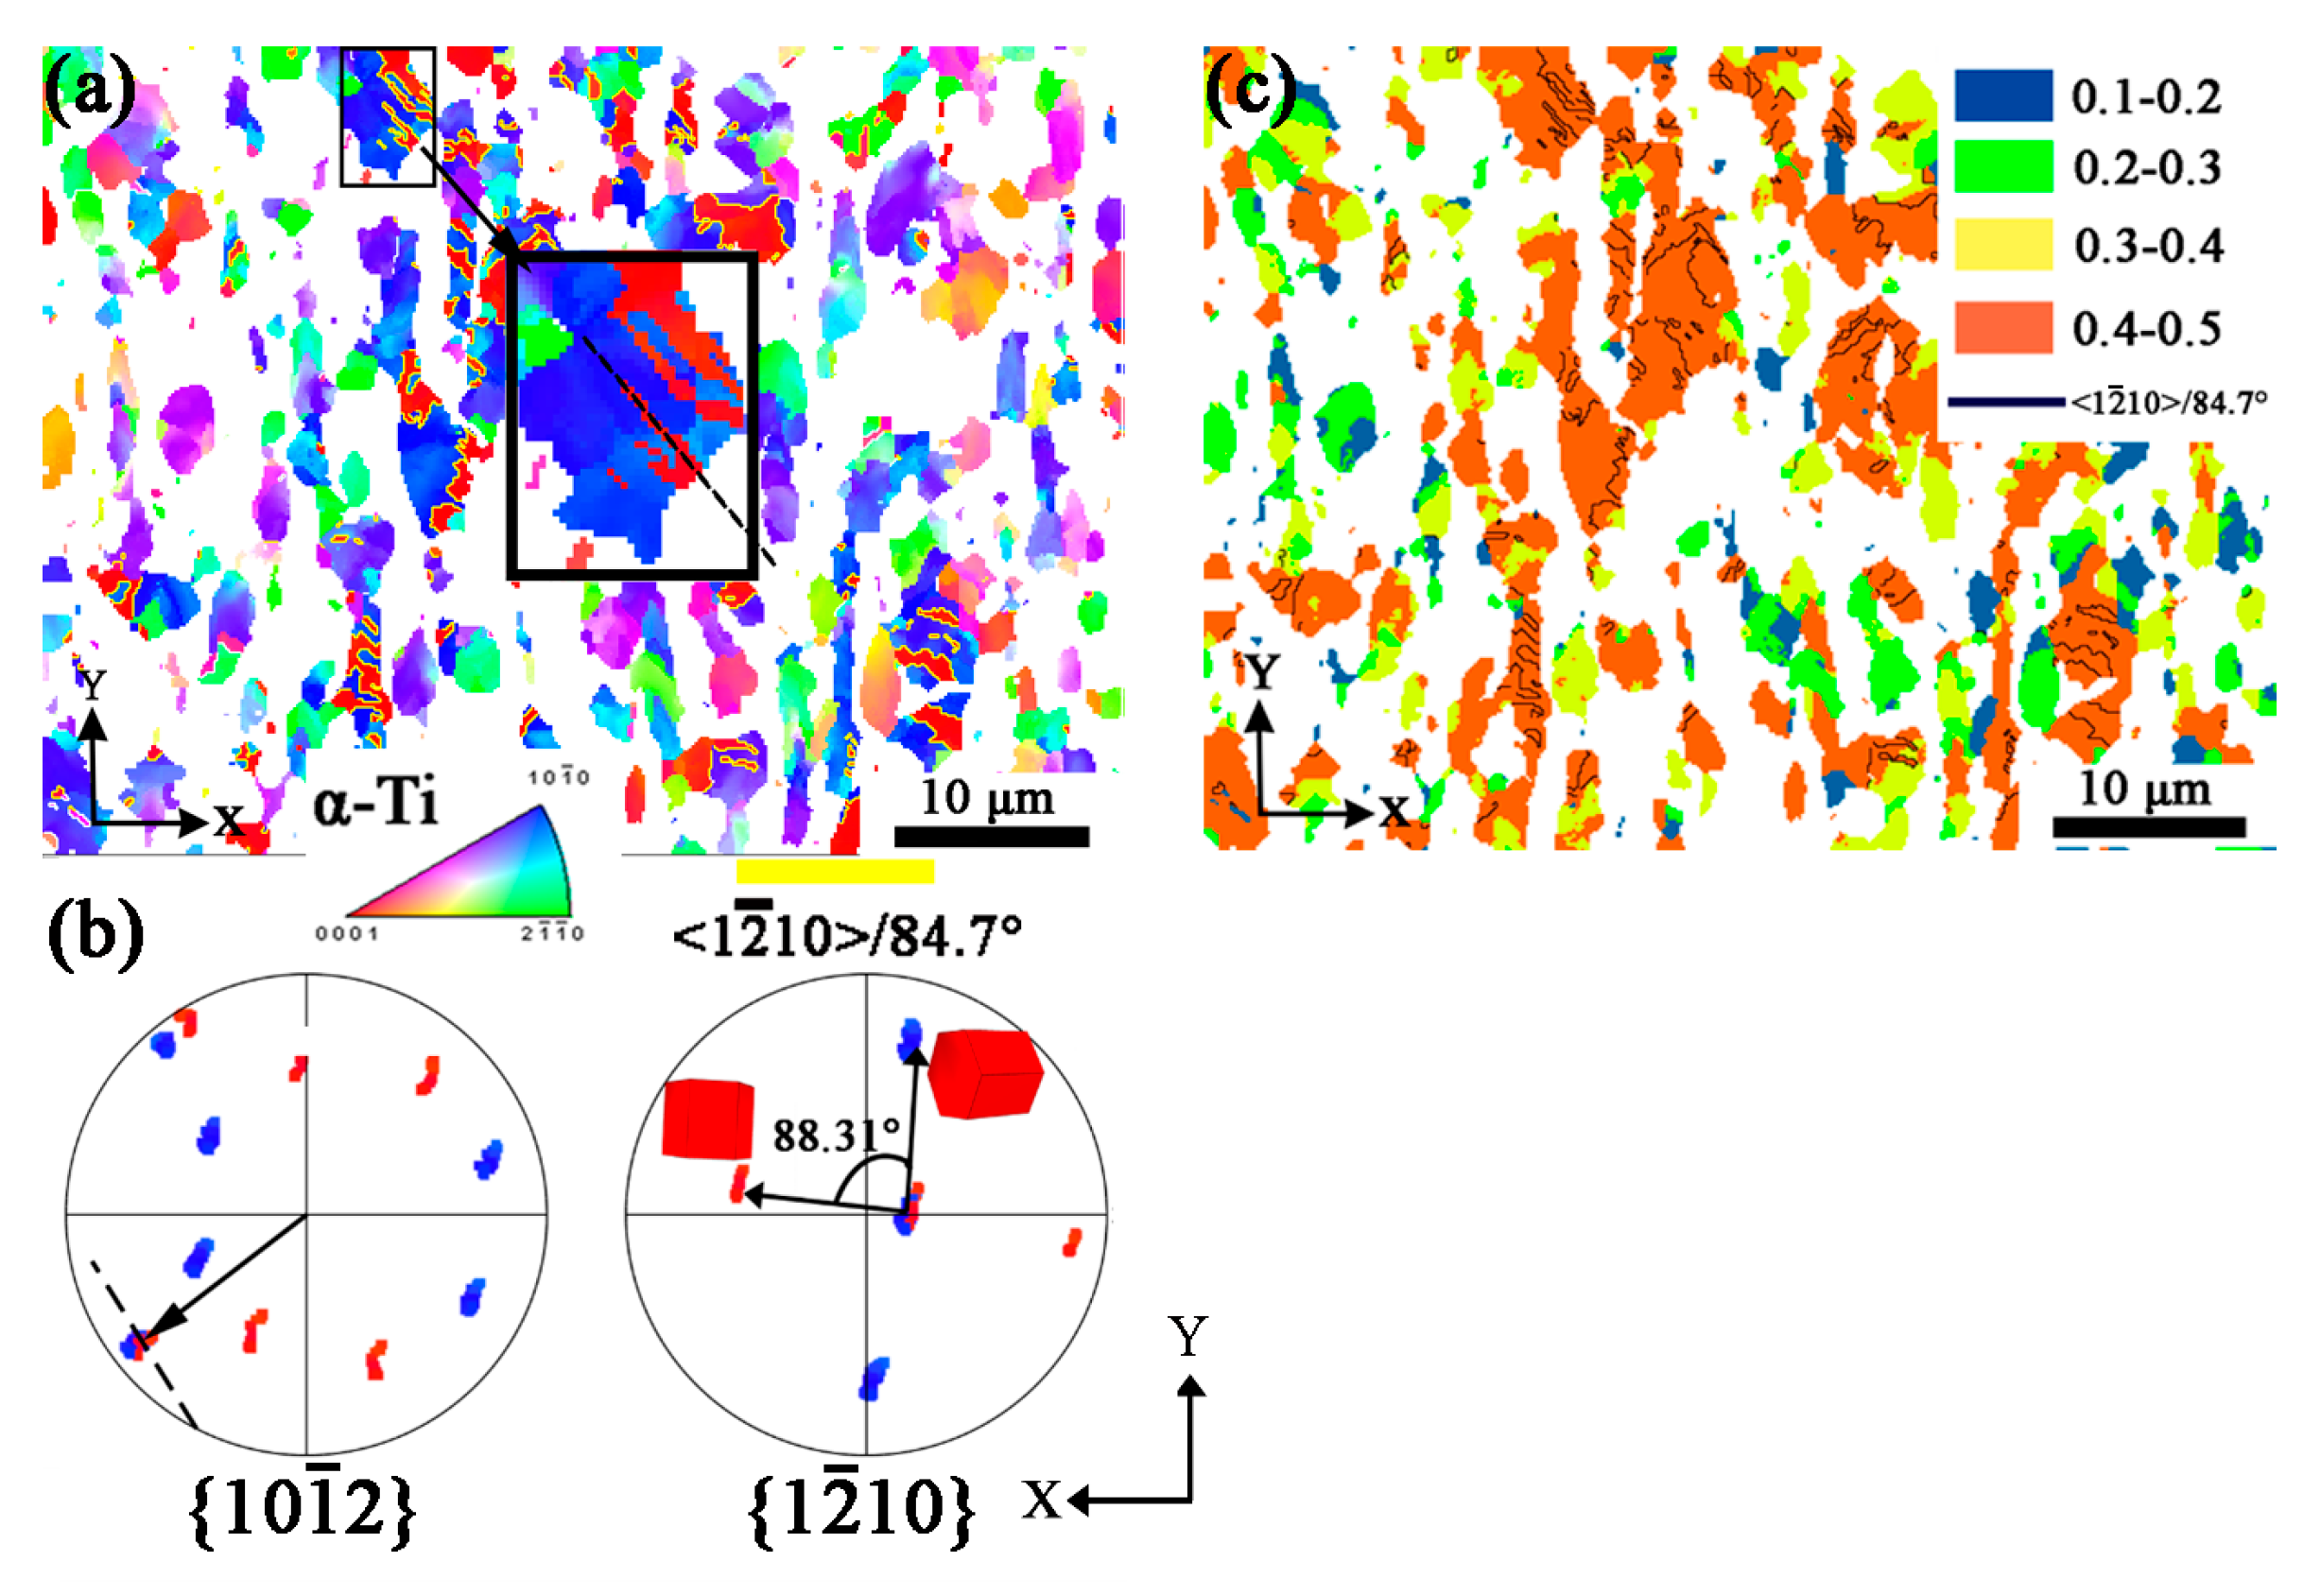
3.2. Microstructure of LD Specimen
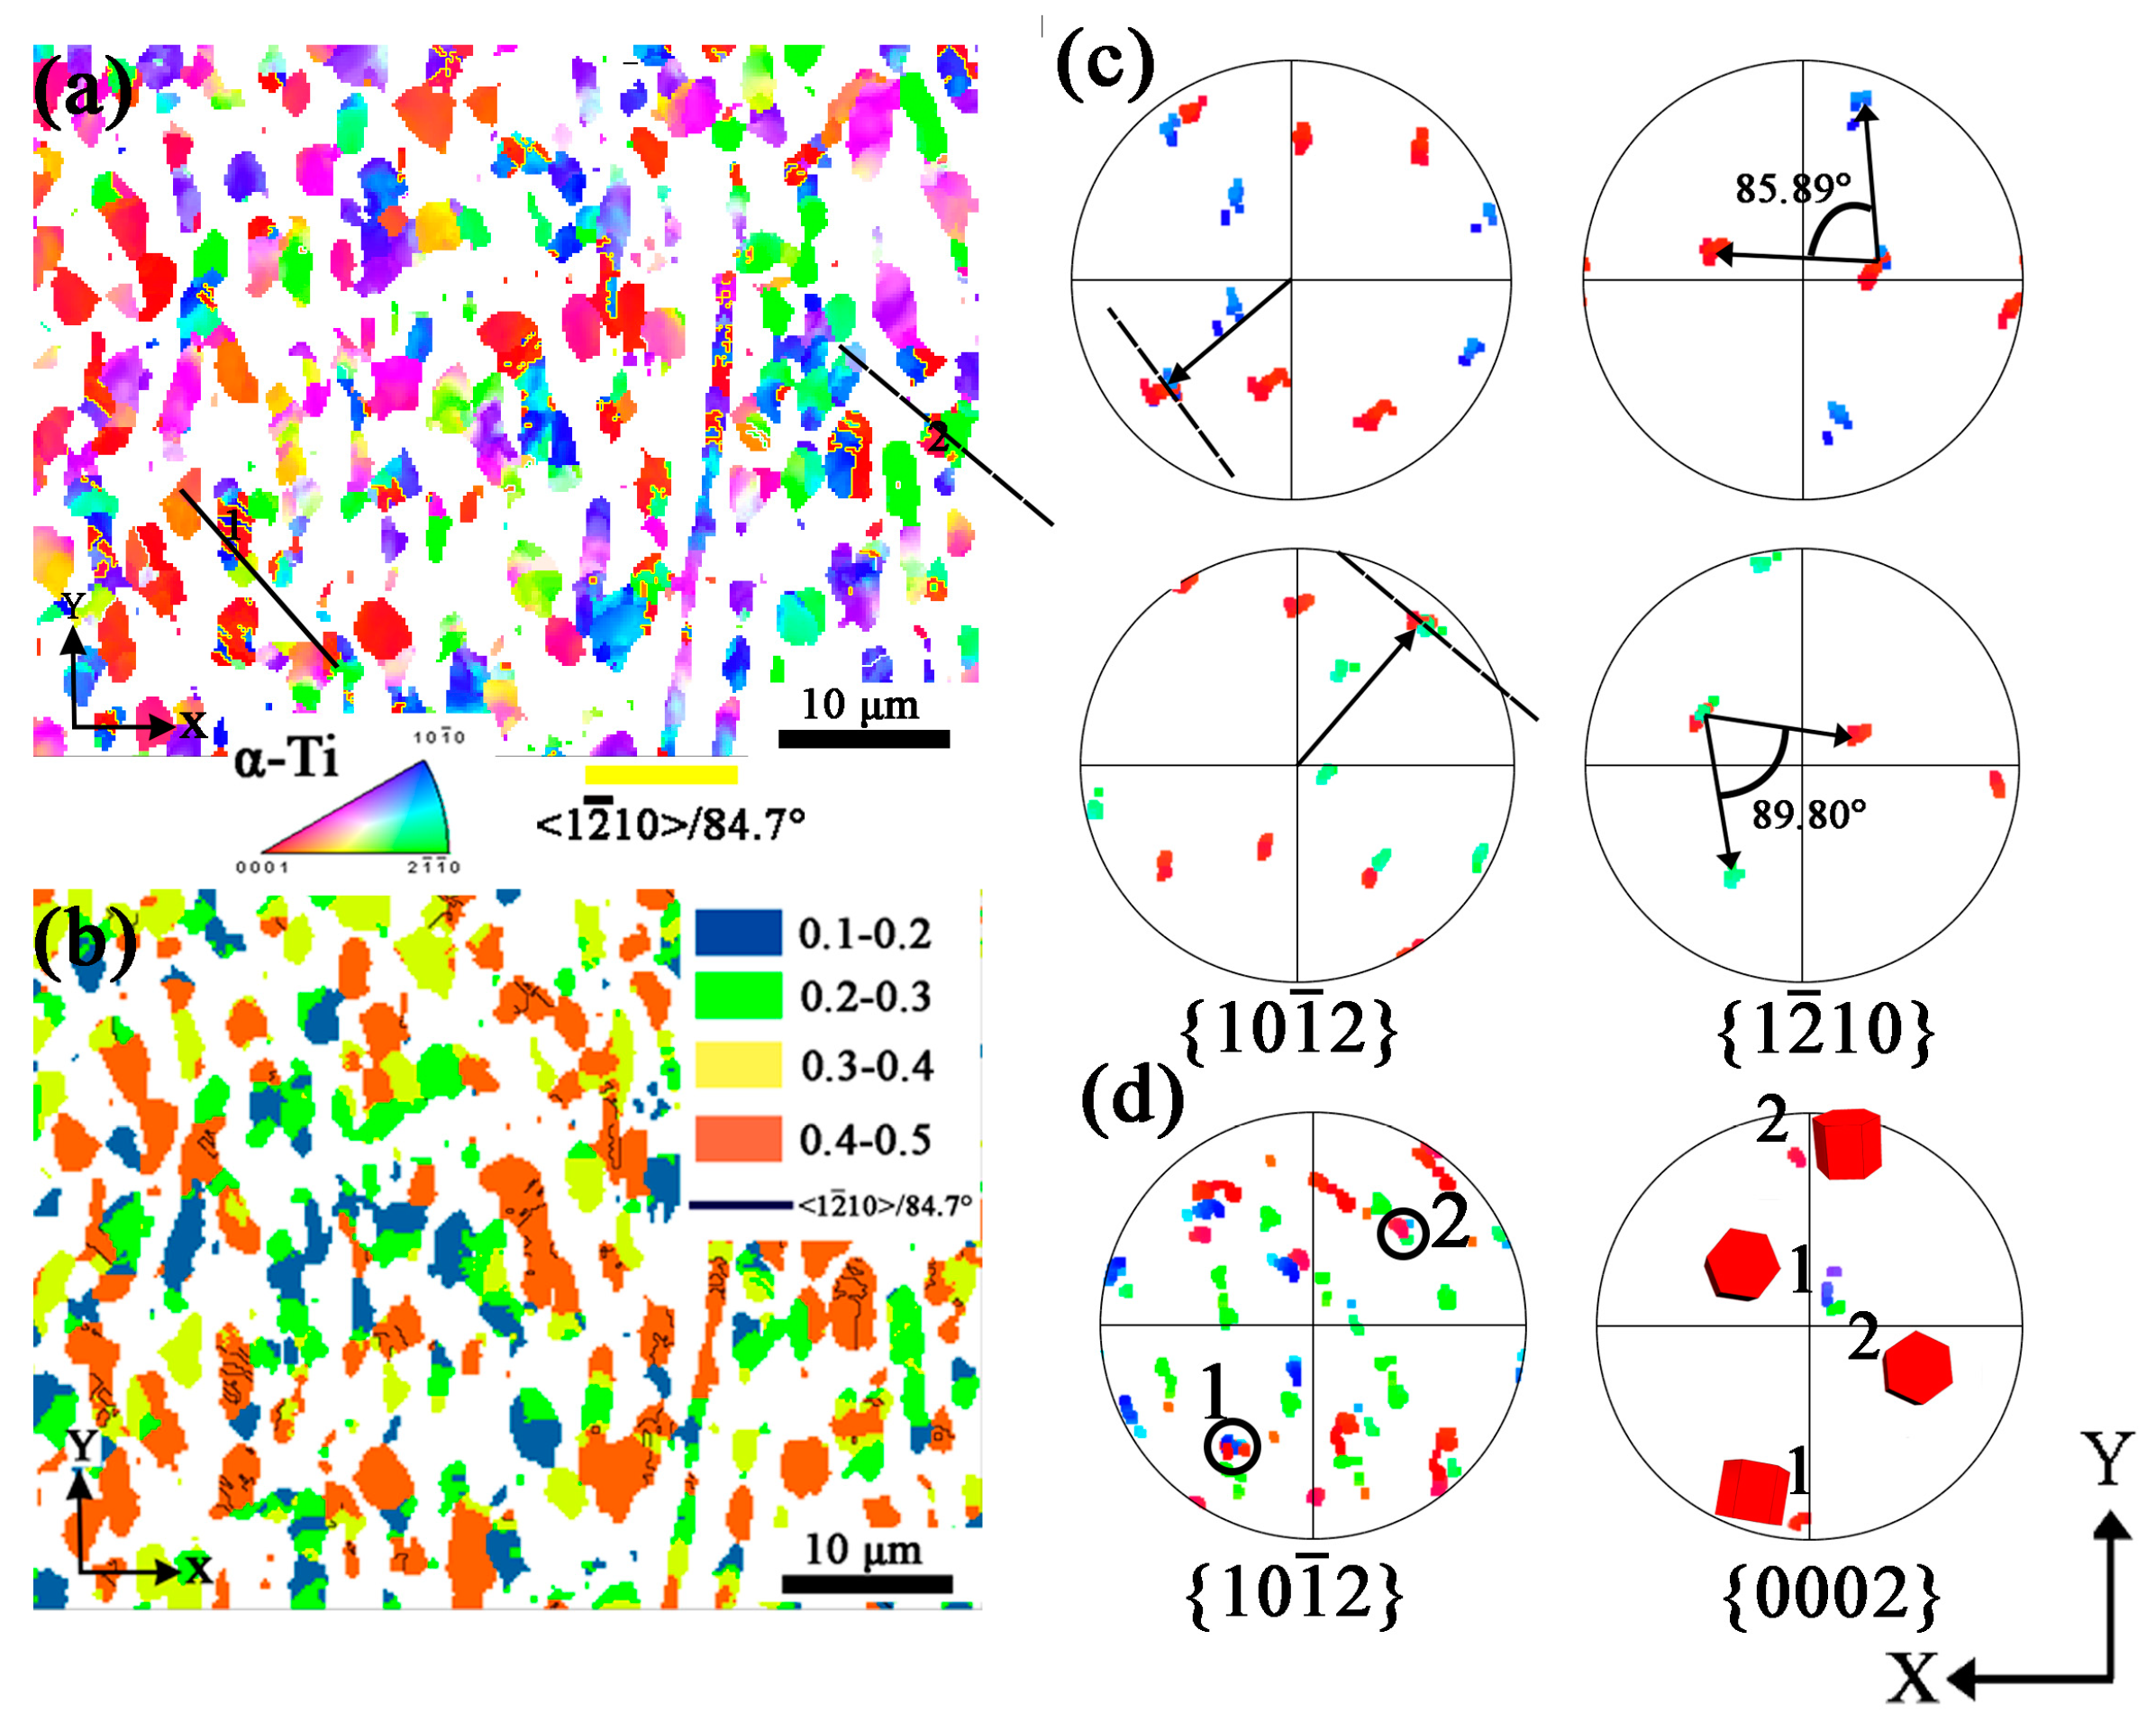
3.3. Microstructure of MD Specimen
3.4. Microstructure of HD Specimen
4. Discussion
4.1. Twin Types
4.2. () Twins in LD Specimen
4.3. () Twins in MD Specimen
4.4. () Twins in HD Specimen
4.5. Twinning Preferentially on Account of Grain Size
4.6. Twin Variant Selection
5. Conclusions
- (1)
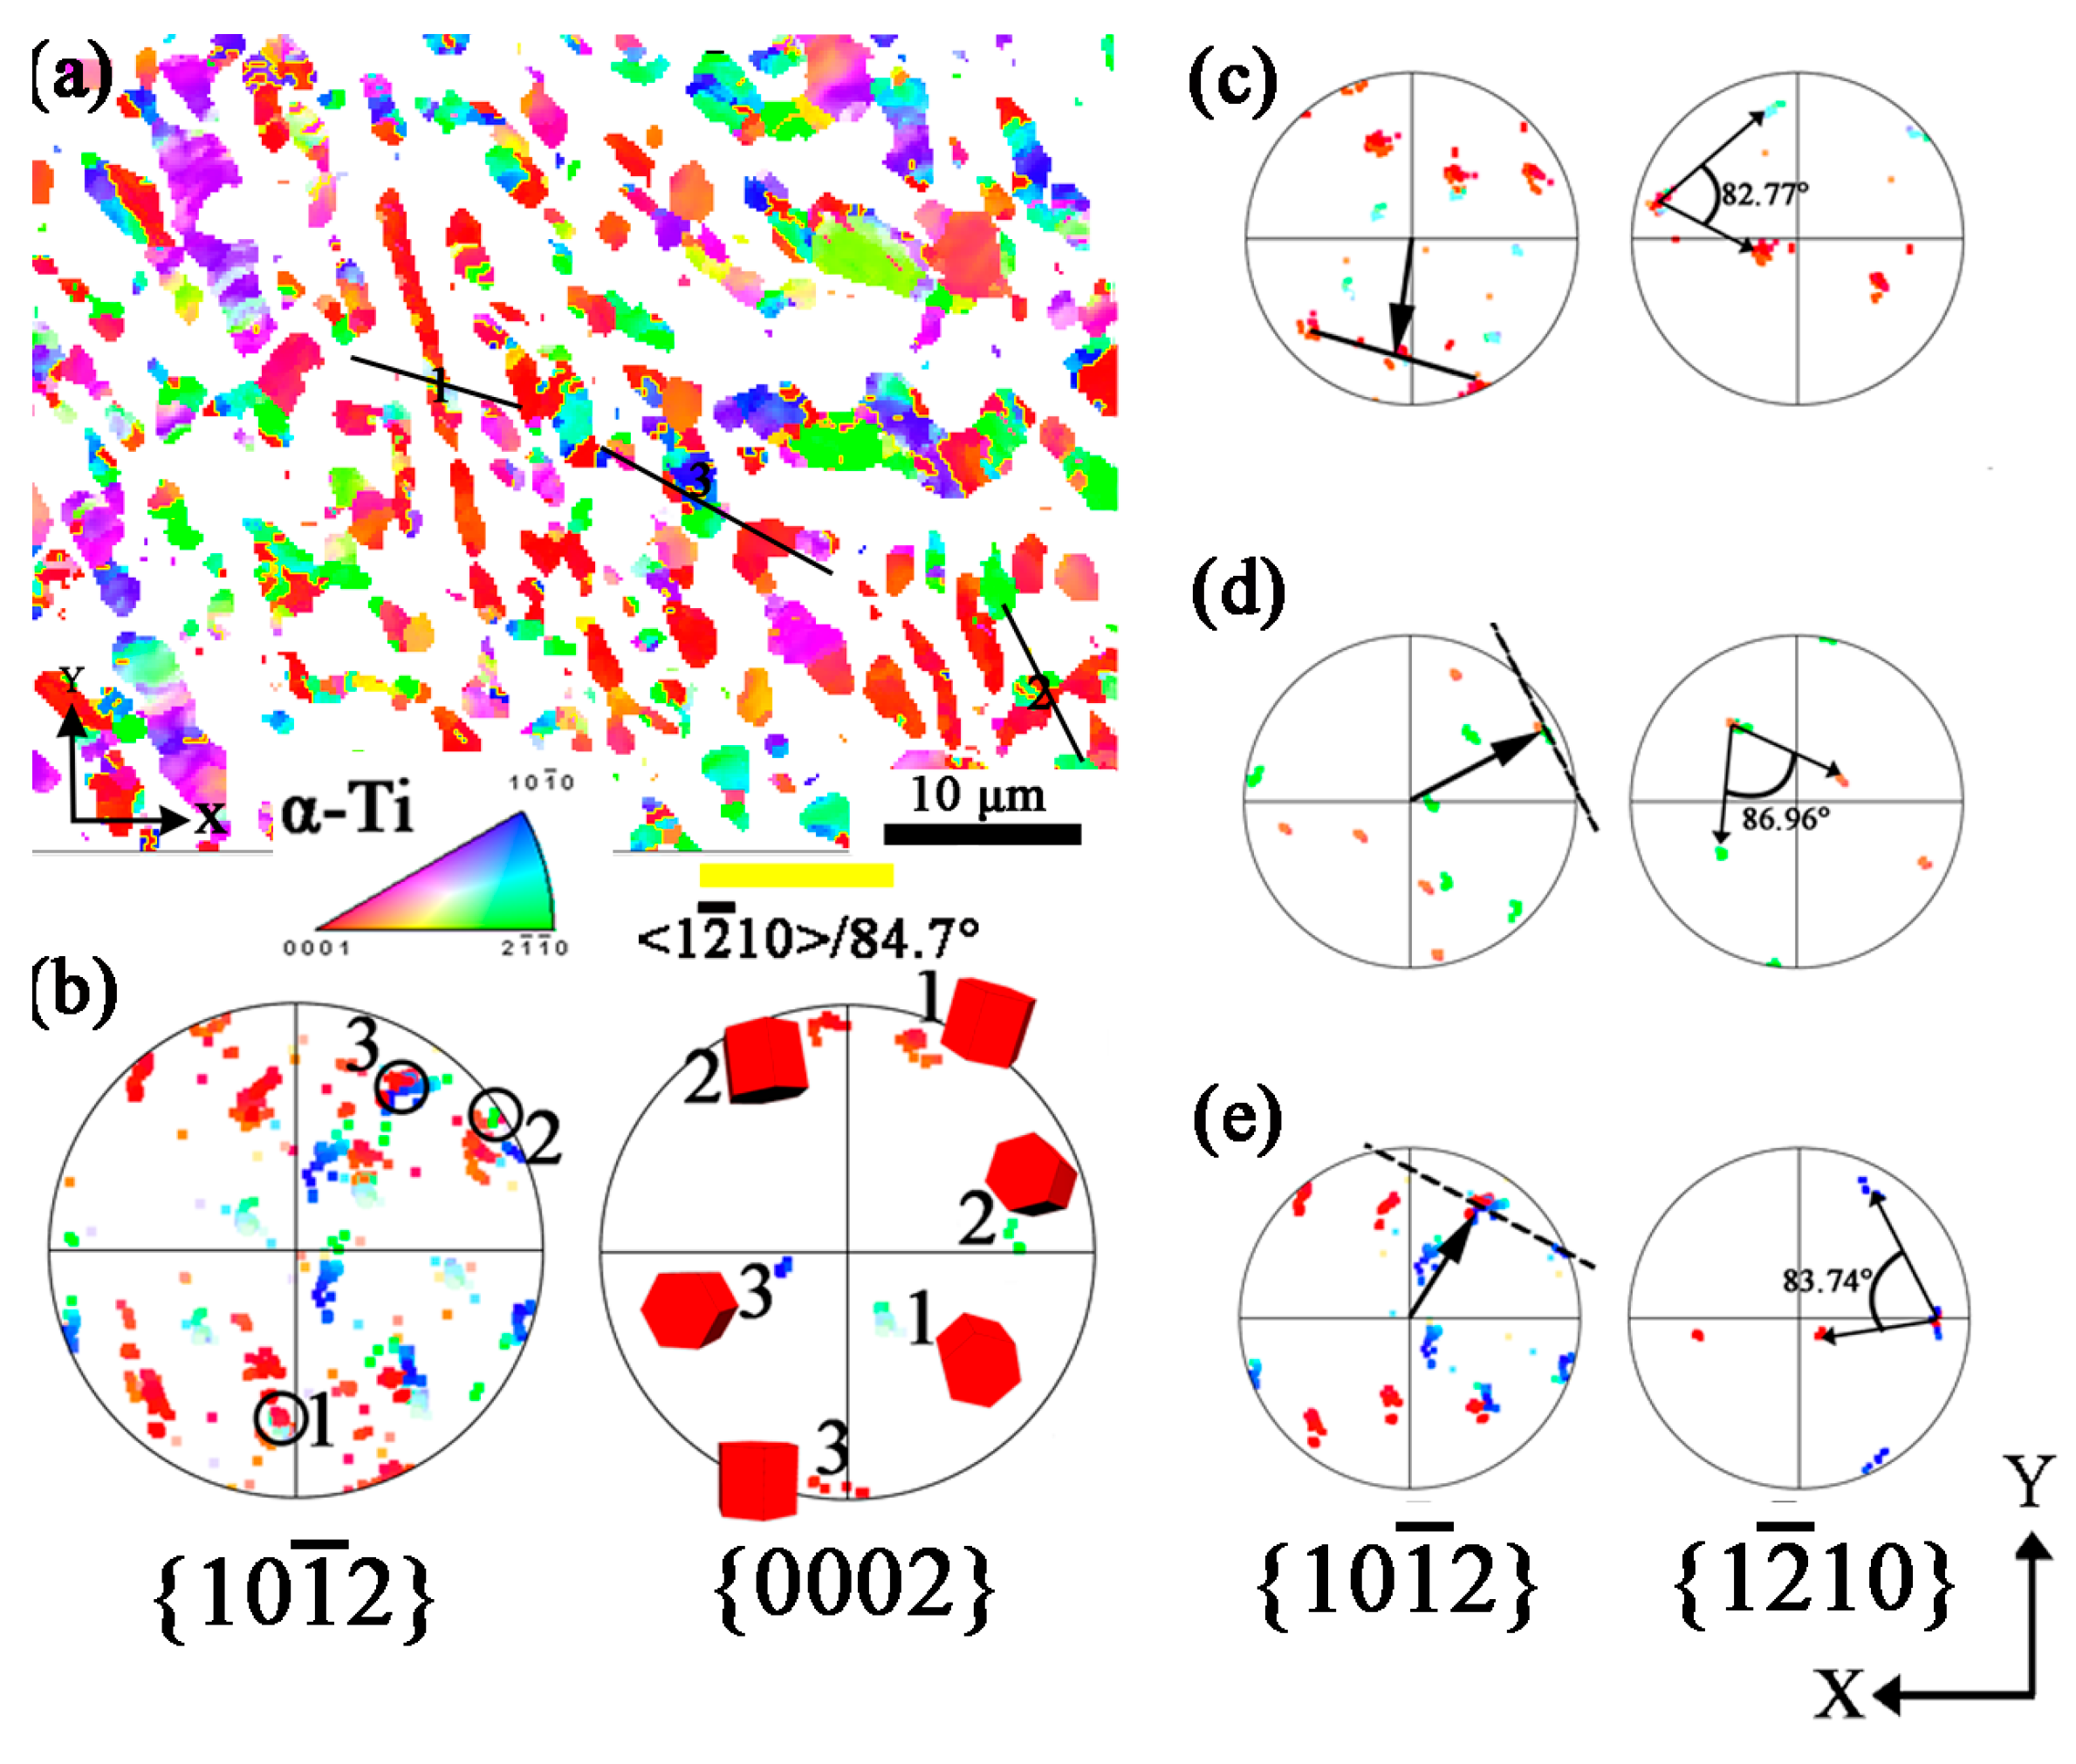
- After the planar wave denotation, type twins are observed in α grains, mainly in grains.
- (2)
- The orientation of α changes from to and the maximum intensity of the poles decrease due to the twinning process.
- (3)
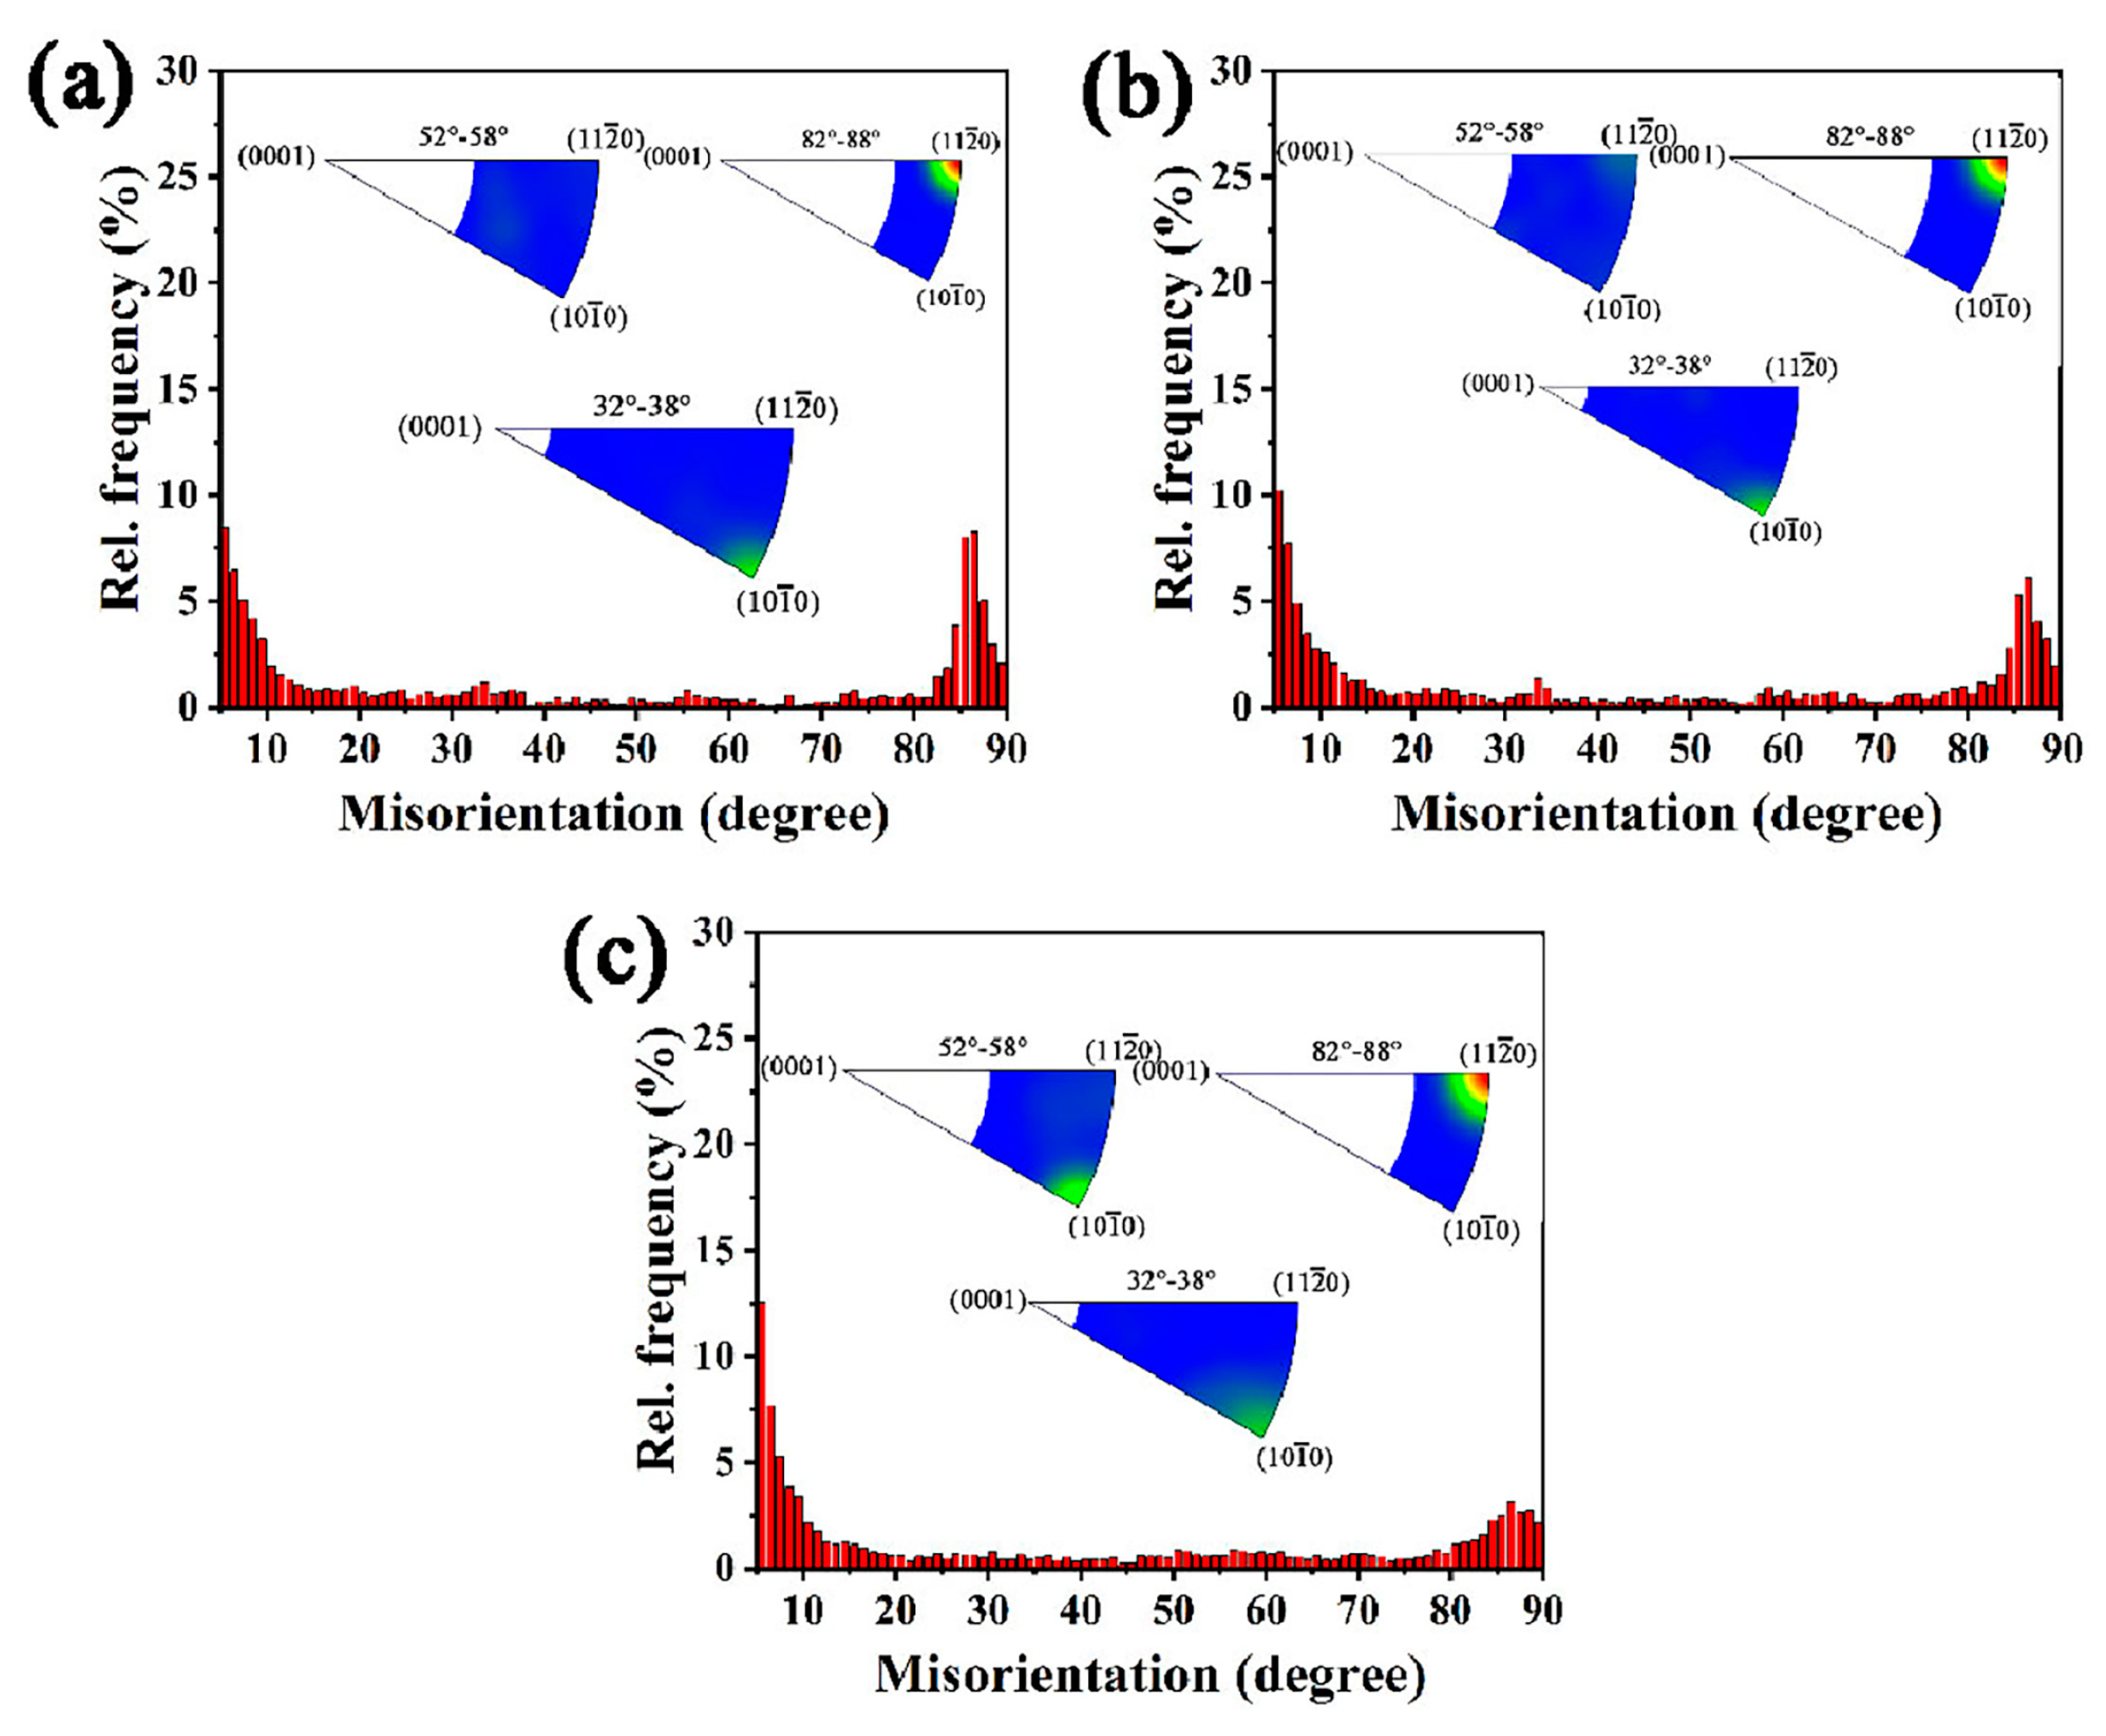
- As the deformation increases, the deviation from ideal twin misorientation becomes large and causes a wider distribution of the twin misorientation. The twin from other-oriented grains will begin to operate.
- (4)
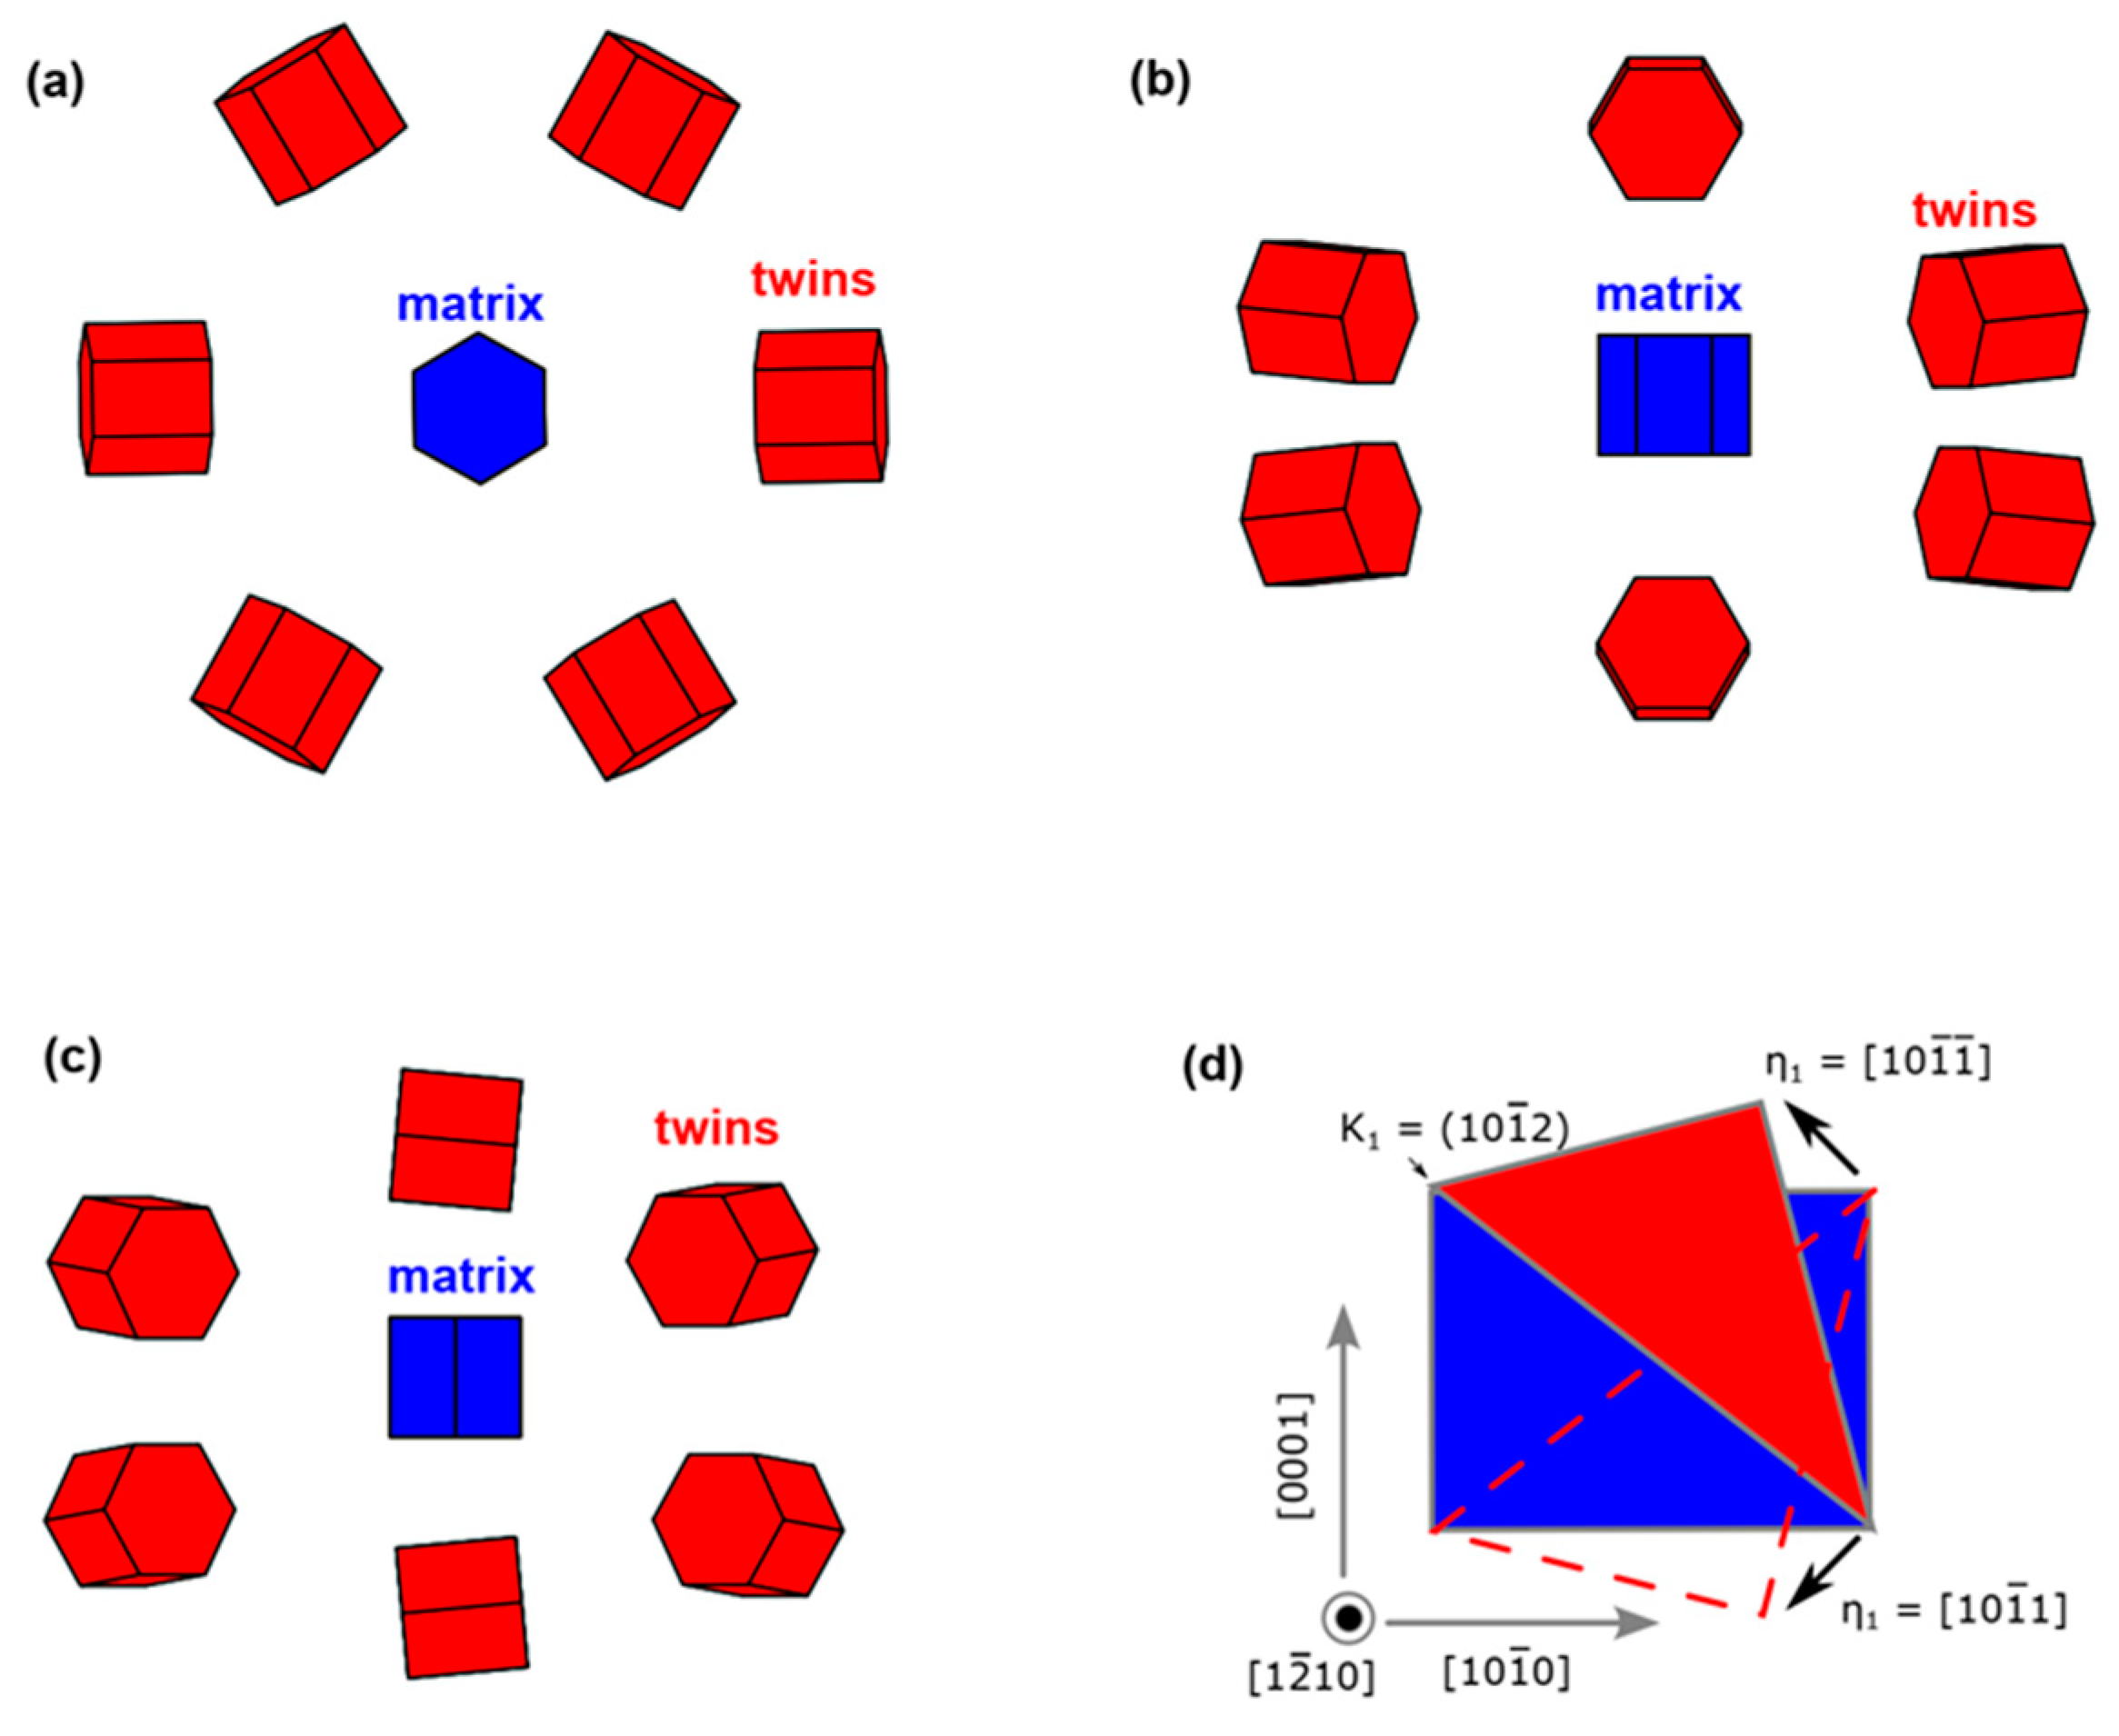
- The twin variant selection during the detonation is rationalized by considering the twinning shear process, and the twin variants with high Schmid factors should be studied in future.
Author Contributions
Funding
Institutional Review Board Statement
Informed Consent Statement
Data Availability Statement
Conflicts of Interest
References
- Manda, P.; Chakkingal, U. Effect of Alloying Elements in Hot-Rolled Metastable beta-Titanium Alloys. Part II: Mechanical Properties. Metall Mater Trans A 2016, 47, 3447–3463. [Google Scholar] [CrossRef]
- Robertson, I.M.; Kacher, J. In situ TEM characterization of dislocation interactions in α-titanium. Philos. Mag. 2016, 96, 1437–1447. [Google Scholar]
- Li, B.L.; Wang, T.B. High-speed deformation response of dislocation boundaries in commercially pure titanium. Rare Metal Mat. Eng. 2017, 46, 1380–1386. [Google Scholar]
- Sun, H.; Su, J.H. Dislocation evolution analysis of hot compressively deformed TA10 titanium alloy based on XRD. J. Harbin Eng. Univ. 2019, 40, 406–411. [Google Scholar]
- Castany, P.; Besse, M. Dislocation mobility in gum metal β-titanium alloy studied via in situ transmission electron microscopy. Phys. Rev. B 2011, 84, 020201. [Google Scholar] [CrossRef]
- Burgers, W.G. On the process of transition of the cubic-body-centered modification into the hexagonal-close-packed modification of zirconium. Physica 1934, 1, 561–586. [Google Scholar] [CrossRef]
- Rosi, F.D.; Perkins, F.C. Mechanism of plastic flow in titanium at low and high temperatures. J. Morphol. 1956, 8, 115–122. [Google Scholar] [CrossRef]
- Smith, D.; Joris, O.P.J. On the high-pressure phase stability and elastic properties of β-titanium alloys. J. Phys. Condens Mat. 2017, 29, 155401. [Google Scholar] [CrossRef]
- Macleod, S.G.; Errandonea, D. The phase diagram of Ti-6Al-4V at high-pressures and high-temperatures. J. Phys. Condens Mat. 2021, 33, 154001. [Google Scholar] [CrossRef]
- Sokolova, T.A.; Sokolova, B.K. Hydrogen effect on the texture and mechanism of deformation upon cold rolling of a beta-titanium alloy. Phys. Met. Metallogra 1999, 88, 301–307. [Google Scholar]
- Premkumar, M.; Himabindu, V.S. Effect of mode of deformation by rolling on texture evolution and yield locus anisotropy in a multifunctional beta titanium alloy. Mat. Sci. Eng. A 2012, 52, 15–23. [Google Scholar] [CrossRef]
- Mine, Y.; Ando, S.; Tonda, H.; Higo, Y. Crystallographic Dependence of Fatigue Crack Growth in Titanium Single Crystals. J. Jpn. I Met. Mater. 1998, 54, 976–984. [Google Scholar]
- Sun, L.J.; Trimby, P.W. Nano twins in ultrafine-grained Ti processed by dynamic plastic deformation. Scr. Mater. 2013, 68, 475–478. [Google Scholar] [CrossRef]
- Chun, Y.B.; Yu, S.H. Effect of deformation twinning on microstructure and texture evolution during cold rolling of CP-titanium. Mater. Sci. Eng. A 2005, 398, 209–219. [Google Scholar] [CrossRef]
- Liu, N.; Wang, Y. Microstructure and textural evolution during cold rolling and annealing of commercially pure titanium sheet. Trans. Nonferr. Metal. Soc. 2018, 28, 1123–1131. [Google Scholar] [CrossRef]
- Li, X.; Duan, L.Y. EBSD characterization of twinning in cold-rolled CP-Ti. Mater. Charact. 2013, 84, 41–47. [Google Scholar] [CrossRef]
- Luo, J.R.; Song, X. Twinning Behavior of a Basal Textured Commercially Pure Titanium Alloy TA2 at Ambient and Cryogenic Temperatures. J. Iron Steel Res. Int. 2016, 23, 74–77. [Google Scholar] [CrossRef]
- Xu, S.; Gong, M. Sequential {10–12} twinning stimulated by other twins in titanium. Acta Mater. 2017, 132, 57–68. [Google Scholar] [CrossRef]
- Sun, L.J.; Trimby, W.P. Grain size effect on deformation twinning propensity in ultrafine-grained hexagonal close-packed titanium. Scr. Mater. 2013, 69, 428–431. [Google Scholar] [CrossRef]
- Ye, P.; Yao, J.Y. A comparative study between {11–22} twinning and {10–12} twinning variant selection mechanisms during uniaxial compression in pure titanium. Mater. Charact. 2020, 162, 110188. [Google Scholar] [CrossRef]
- Zeng, Z.; Johsson, S. The effects of deformation conditions on microstructure and texture of commercially pure Ti. Acta Mater. 2009, 57, 5822–5833. [Google Scholar] [CrossRef]
- Wu, J.; Ma, Z.D.D. Microstructure and twin behavior of Ti-2Al-2.5Zr during cold pilgering. Mater. Res. Express 2021, 8, 096515. [Google Scholar] [CrossRef]
- Qi, M.; Ma, Y.J. Microtexture evolution effected by Mo content in alpha plus beta titanium alloys. Mater. Charact. 2022, 188, 111884. [Google Scholar] [CrossRef]
- Zhu, X.; Fan, Q. Influence of twins found in adiabatic shear bands on dynamic recrystallization of a near β Ti-5.5Mo-7.2Al-4.5Zr-2.6Sn-2.1Cr alloy. Mater. Sci. Eng. A 2022, 842, 143084. [Google Scholar] [CrossRef]
- Chen, Z.; Zhong, D. Effect of α phase fraction on the dynamic mechanical behavior of a dual-phase metastable β titanium alloy Ti–10V–2Fe–3Al. Mater. Sci. Eng. A 2021, 816, 141322. [Google Scholar] [CrossRef]
- Xiao, J.F.; Nie, Z.H. The dynamic response of the metastable β titanium alloy Ti-2Al-9.2Mo-2Fe at ambient temperature. Mater. Sci. Eng. A 2019, 751, 191–200. [Google Scholar] [CrossRef]
- Yan, Z.; Wang, L. Response of Ti6321 titanium alloy at different strain rates under tensile loading. Mater. Sci. Technol. 2022, 38, 1037–1045. [Google Scholar] [CrossRef]
- Duan, Y.; Huang, Z. Flow Stress Behavior and Constitutive Model of As-Cast TB6 Titanium Alloy Based on Friction Correction. Chin. J. Rare Met. 2014, 38, 202–209. [Google Scholar]
- Samiee, A.; Casillas, G. Formation of Deformation-Induced Products in a Metastable-beta Titanium Alloy during High Temperature Compression. Metals 2018, 8, 100. [Google Scholar] [CrossRef]
- Wang, X.; Li, F. Mechanical behavior and microstructural evolution during cyclic tensile loading-unloading deformation in metastable Ti-10V-2Fe-3Al alloy. Mat. Sci. Eng. A 2022, 835, 142663. [Google Scholar] [CrossRef]
- Qiu, W.; Lu, S. Investigation on hot deformation behavior of as-casted TB6 titanium alloy in beta phase field. Forg. Stamp. Technol. 2010, 35, 119–123. [Google Scholar]
- Shu, D.; Wang, L. Understanding the Role of beta Recrystallization on beta Microtexture Evolution in Hot Processing of a Near-beta Titanium Alloy (Ti-10V-2Fe-3Al). Metals 2021, 11, 1397. [Google Scholar] [CrossRef]
- Ma, X.; Chen, Z. Stress-induced martensitic transformation in a beta-solution treated Ti-10V-2Fe-3Al alloy during compressive deformation. Mat. Sci. Eng. A 2021, 801, 140404. [Google Scholar] [CrossRef]
- Lukaszek-Solek, A.; Bednarek, S. Modelling Hot Die Forging Process of the Ti-10V-2Fe-3Al Alloy. In Proceedings of the 23rd International Conference on Metallurgy and Materials, Brno, Czech Republic, 21–23 May 2014; Volume 57, pp. 364–369. [Google Scholar]
- Balasubrahmanyam, V.V.; Prasad, Y. Hot deformation mechanisms in metastable beta titanium alloy Ti-10V-2Fe-3Al. Mater. Sci. Technol. 2001, 17, 1222–1228. [Google Scholar] [CrossRef]
- Jackson, M.; Jones, N.G. Effect of initial microstructure on plastic flow behaviour during isothermal forging of Ti-10V-2Fe-3Al. Mater. Sci. Eng. A 2009, 501, 248–254. [Google Scholar] [CrossRef]
- Zhang, R.; Zhang, J. Adiabatic Shear Behavior of TB6 Titanium Alloy Microstructure Under Detonation Load. Rare Metal Mat. Eng. 2023, 52, 1352–1360. [Google Scholar]
- Zou, X.; Zhang, X. Dynamic Behavior of TB6 Titanium Alloy under Shear-Compression Loading. Chin. J. High Press. Phys. 2019, 33, 458–462. [Google Scholar]
- Chen, R.; Tan, C.W. Effect of alpha phase on high-strain rate deformation behavior of laser melting deposited Ti-6.5Al-1Mo-1V-2Zr titanium alloy. Mat. Sci. Eng. A 2019, 750, 81–90. [Google Scholar] [CrossRef]
- Yi, X.B.; Zhang, J.X. Dynamic Compressive Mechanical Properties of TB6 Titanium Alloy Under High Temperature and High Strain Rate. Rare Metal Mat. Eng. 2019, 48, 1220–1224. [Google Scholar]
- Zhang, Z.; Guo, B. Effect of Solution Temperature on Dynamic Mechanical Properties and Microstructure of TB6 Titanium Alloy. Chin. J. High Press. Phys. 2021, 35, 71–75. [Google Scholar]
- Beyerlein, I.J.; Capolungo, L. Statistical analyses of deformation twinning in magnesium. Philos. Mag. A 2010, 90, 2161–2190. [Google Scholar] [CrossRef]
- Wang, L.; Yang, Y. Twin Nucleation by Slip Transfer across Grain Boundaries in Commercial Purity Titanium. Metall. Mater. Trans. A 2010, 41, 421–430. [Google Scholar] [CrossRef]
- Arul Kumar, M.; Beyerlein, I.J. Grain size constraints on twin expansion in hexagonal close packed crystals. J. Appl. Phys. 2016, 120, 155105. [Google Scholar] [CrossRef]
- Arul Kumar, M.; Wroński, M. Role of microstructure on twin nucleation and growth in HCP titanium: A statistical study. Acta Mater. 2018, 148, 123–132. [Google Scholar] [CrossRef]
- Wang, S.; Schuman, C. Variant selection criterion for twin variants in titanium alloys deformed by rolling. Acta Mater. 2012, 60, 3912–3919. [Google Scholar] [CrossRef]
- Zhang, Y.; Li, G. A novel method for predicting variant selection of {1012} twins in pure hafnium. Mater. Lett. 2021, 304, 130738. [Google Scholar] [CrossRef]
- Guan, D.; Wynne, B. Basal slip mediated tension twin variant selection in magnesium WE43 alloy. Acta Mater. 2019, 170, 1–14. [Google Scholar] [CrossRef]


Disclaimer/Publisher’s Note: The statements, opinions and data contained in all publications are solely those of the individual author(s) and contributor(s) and not of MDPI and/or the editor(s). MDPI and/or the editor(s) disclaim responsibility for any injury to people or property resulting from any ideas, methods, instructions or products referred to in the content. |
© 2023 by the authors. Licensee MDPI, Basel, Switzerland. This article is an open access article distributed under the terms and conditions of the Creative Commons Attribution (CC BY) license (https://creativecommons.org/licenses/by/4.0/).
Share and Cite
Wang, T.; Yang, P.; Zhang, J.; Gu, X.-F.
The Characteristic of
Wang T, Yang P, Zhang J, Gu X-F.
The Characteristic of
Wang, Tong, Ping Yang, Jin Zhang, and Xin-Fu Gu.
2023. "The Characteristic of