Article

Research on the Measurement Method of the Prompt Neutron Decay Constant Based on LHS-DMD-Rossi-Alpha

1
School of Nuclear Science and Technology, University of South China, Hengyang 421001, China
2
Key Lab of Advanced Nuclear Energy Design and Safety, Ministry of Education, Hengyang 421001, China
*
Authors to whom correspondence should be addressed.
Energies 2024, 17(9), 2034; https://doi.org/10.3390/en17092034
Submission received: 8 April 2024 / Revised: 22 April 2024 / Accepted: 22 April 2024 / Published: 25 April 2024
(This article belongs to the Special Issue New Advances and Novel Technologies in the Nuclear Industry)

Abstract

:
In response to the significant dependency on empirical judgment in measuring the prompt neutron decay constant with the traditional Rossi-alpha method and the issue of requiring an excessive number of detectors with the DMD-Rossi-alpha method, this paper introduces a calculation method for the prompt neutron decay constant based on a combination of Latin Hypercube Sampling (LHS), Dynamic Mode Decomposition (DMD), and the Rossi-alpha method. Initially, the method uses LHS to expand the sample dataset of neutron noise data to reduce the number of detectors required. It then employs the Rossi-alpha method to construct a Rossi-alpha distribution model from neutron noise data. Finally, it utilizes DMD for feature extraction from the Rossi-alpha distribution model, thereby determining the prompt neutron decay constant. Research findings demonstrate that, by simulating the KUCA facility using RMC3.5 in a near-critical state, the relative error of the α value calculated by the LHS-DMD-Rossi-alpha method model is 9% less than that calculated by the Rossi-alpha method. This approach, capable of enhancing the precision of measuring the prompt neutron decay constant with just a single detector, holds significant theoretical value and engineering significance for the advancement of reactor physics and experimental techniques.

1. Introduction

The prompt neutron decay constant is a quantified parameter representing the dynamic characteristics of nuclear systems, determined primarily by factors such as the neutron lifetime, reactivity state, geometrical dimensions, and material composition of the nuclear system. It comprehensively reflects the kinetics of prompt neutrons within the system. Among various methods for measuring the prompt neutron decay constant, the micro-noise method represented by the Rossi-alpha method is non-destructive and allows for the measurement of the prompt neutron decay constant without disrupting the operational state of reactors. This is of significant importance for verifying neutron physics calculation methods in reactor physical design.
To enhance the precision of the Rossi-alpha method in extracting the prompt neutron decay constant [1,2], Michael et al. [3] employed the dual-zone Rossi-alpha model to study the spatial distribution characteristics of the prompt neutron decay constant in highly enriched plutonium metal spheres with copper as the reflector layer and highly enriched uranium metal spheres with polyethylene as the reflector layer. Chidong et al. [4], focusing on Godiva, conducted a sensitivity analysis on the source strength and channel width in the Rossi-alpha parameter settings through numerical simulation to determine the optimal source strength and channel width for measurements using this model. Yamamoto et al. [5], aiming to reduce the uncertainties associated with the traditional Rossi-alpha method, applied the data-driven DMD method to Rossi-alpha measurement data based on a one-dimensional plate, constructing a data feature extraction model for an array of 44 detectors. This verified the feasibility of using this method to extract the prompt neutron decay constant, although the requirement for a large number of detectors does not meet practical engineering needs.
To address the issue of excessive detector requirements in the traditional DMD-Rossi-alpha method, this study optimizes the DMD-Rossi-alpha method using the efficient and precise LHS method. This research focuses on the Kyoto University Critical Assembly (KUCA), utilizing RMC3.5 simulations to validate the accuracy and applicability of the proposed LHS-DMD-Rossi-alpha method across different subcritical states [6,7,8,9].

2. Theory of the LHS-DMD-Rossi-Alpha Method

2.1. The Rossi-Alpha Method

The Rossi-alpha method [10,11] is a quintessential technique in the analysis of micro-noise in nuclear reactors, particularly suited for measuring in delayed critical and subcritical states. Originating from Rossi’s foundational work on the statistical laws of chain reactions in point reactor models, this method explores the signal output from neutron detectors within the reactor. Examining this correlation permits acquiring the prompt neutron decay constant in the nuclear system. The Rossi-alpha technique investigates the reactor’s output signal from the neutron detector. After a neutron detection event, the correlation probability PC refers to the likelihood that the neighboring neutrons arise from the same fission chain reaction. The uncorrelation probability PU reflects the probability that they arise from diverse fission chain reactions or neutron sources (external source neutrons and delayed fission neutrons). The formula used to calculate the joint probability P(t1,t2) of the two neutron signals detected at moments t1 and t2 is as follows:
P ( t 1 , t 2 ) d t 1 d t 2 = P U ( t 1 , t 2 ) d t 1 d t 2 + P C ( t 1 , t 2 ) d t 1 d t 2
For characterizing the correlated neutron counting probability PC(t1,t2)dt1dt2 and the uncorrelated neutron counting probability PU(t1,t2)dt1dt2, the expansion can be obtained:
P C ( t 1 , t 2 ) d t 1 d t 2 = ε f , 1 ε f , 2 ν ( ν 1 ) ¯ λ f 2 2 α e α ( t 2 t 1 ) d t 1 d t 2
P U ( t 1 , t 2 ) d t 1 d t 2 = ε f , 1 F ˙ d t 1 ε f , 2 F ˙ d t 2
In the equation, εf,1 and εf,2 represent the probability of detection by detector I and detector II respectively, when a fission event occurs in the current nuclear system; λf = υΣf represents the probability of nuclear fission per unit time caused by a neutron moving in the medium at a rate υ; Ḟ is the fission neutron emissivity in the nuclear system; ν is the number of prompt neutrons produced by each fission.
In the experimental study, the neutron field exhibits a non-Poisson distribution and decays with multiple exponential states. Expand the Green’s function using the characteristic function of α. The resulting expression is a linear combination of multiple exponentials.
P ( τ ) = n = 0 B n e α n τ + G
In the equation, αn indicates the nth-order mode prompt neutron decay constant, while α0 is indicative of the fundamental mode component of the prompt neutron decay constant. τ = t2 − t1. Bn is the expansion coefficient of the nth mode, whereas G denotes the probability of uncorrelated neutron count.
In the conventional analysis method, following the initial detection, the overall likelihood of detecting a neutron event within the measurement time is expressed in the general format demonstrated in Equation (5). The impact of high modal components can be mitigated by selecting suitable fitting intervals.
P ( τ ) = B e α τ + G

2.2. Dynamic Mode Decomposition Method

The essence of the DMD method is to regard the flow evolution as a linear dynamic process [12,13,14,15]. By analyzing the characteristics of the flow field snapshot of the whole process, the low-order modes and their corresponding eigenvalues representing the flow field information are obtained. The biggest feature of the DMD method is that the decomposed modes have a single frequency and growth rate, so it has great advantages in analyzing dynamic linear and periodic flows. In addition, DMD can directly characterize the flow evolution process through the eigenvalues of each mode, so there is no need to establish additional control equations. Thus, DMD offers substantial advantages in analyzing linear and periodic dynamics in fluid flows, providing theoretical support for robustly extracting the prompt neutron decay constant from neutron noise data.
From an experiment or numerical simulation, a Rossi-alpha histogram M × N matrix X is obtained, where M represents the total number of neutron detectors, and N corresponds to the total number of time bins in the histogram, with a bin width of T. By extracting the first to the N − 1th columns from the original matrix X to form one submatrix, and the second to the Nth columns to form another, two submatrices X1:N−1 and X2:N are constructed. The relationship between matrix X1:N−1 and X2:N satisfies the temporal evolution matrix A within DMD:
A X 1 : N 1 = X 2 : N
Based on Equation (6), the temporal evolution matrix A transforms data from each time step into data for the next time step. Once the initial state X1:N−1 and the system’s transformation matrix A are determined, the state of the system at any future time t, X1+t:N+t−1, can be calculated using this formula.
The steps to calculate the temporal evolution matrix A are briefly described as follows. First, perform an M-order Singular Value Decomposition (SVD) on the initial state X1:N−1:
X 1 : N 1 = U Σ V *
In the equation: U and V are unitary matrices made up of left and right singular vectors; U matrix: the feature vector of the sample, the dimension is M × M; V* matrix: conjugate transpose of a weight vector representing a feature with dimension N × N; Σ is the diagonal matrix consisting of singular values, indicating the importance of the feature. The pseudo-inverse matrix X 1 : N 1 + is obtained from Equation (7) as follows:
X 1 : N 1 + = V Σ 1 U *
By utilizing Equations (6) and (8), the temporal evolution matrix A can be solved for. The expression for A is as follows:
A = X 2 : N V Σ 1 U *
By projecting matrix A onto U, the DMD matrix à is obtained as follows:
A ˜ = U * A U = U * X 2 : N V Σ 1
The calculation process for matrix à can be viewed as a minimization problem of the Frobenius norm. As matrix à is a similar transformation of A, it contains the main eigenvalues of matrix A. The ith eigenvalue of matrix à is denoted as λi and the corresponding eigenvector as ψi(r) [16]. The time series function f(r,t) can be obtained by expanding ψi(r) in r:
f ( r , t ) = i = 1 m c i Ψ i ( r ) exp ( e i t )
The equation uses ci to denote the amplitude of the i-th mode and ei to denote the time constant of the i-th mode. The first-order mode e1 in Equation (11) represents the constant component G in Equation (5). Therefore, the second largest eigenvalue α can be used to obtain the fundamental mode component of e2.
α = e 2 = ln ( λ 2 ) T
Since the prompt neutron decay constant is a negative state quantity, the sign of α is opposite to that of e.

2.3. Latin Hypercube Sampling

As a stratified sampling method, the LHS method can ensure that the sample points are evenly distributed throughout the entire parameter space based on the multi-dimensional characteristics of individuals and the number of samples [17]. Moreover, there is only one sample point in each interval, ensuring the spatial filling and representativeness of the samples. The LHS method is particularly effective in dealing with multidimensional parameter spaces, as it provides comprehensive coverage of the parameter space with a relatively small number of samples. This approach has found widespread applications in simulation and optimization problems, especially in situations where computational costs are high or experimental data are difficult to obtain. Compared to simple random sampling, LHS can more effectively explore the parameter space, improving the accuracy and efficiency of simulations. The flowchart of the LHS method is shown in Figure 1.
The measurement of the prompt neutron decay constant using the DMD-Rossi-alpha method relies on a series of measurement data obtained from multiple locations to construct a snapshot matrix for DMD analysis. To ensure the reliability of experimental results, numerous repeated measurements are typically required. However, in practical measurements, the 3He neutron detectors used for experimental measurements are neutron absorbers themselves. An excessive number of these detectors can increase deviations between measurement results and theoretical calculations. Additionally, during extended measurement periods, key parameters such as reactor power level, temperature, and pressure may undergo changes. These variations can directly affect the distribution and intensity of neutrons, potentially leading to discrepancies between measurement results and theoretical predictions. Therefore, it is imperative to limit both the number of measurement points and measurement duration. By employing the LHS method, it is possible to effectively sample measurement data from a single detector, constructing a representative and broadly covering sample set. This approach not only enhances data utilization efficiency but also helps reduce potential deviations arising from extended measurement durations or limited detector availability. Furthermore, it provides theoretical support for robustly extracting the prompt neutron decay constant from neutron noise data. The specific process for generating samples is as follows.
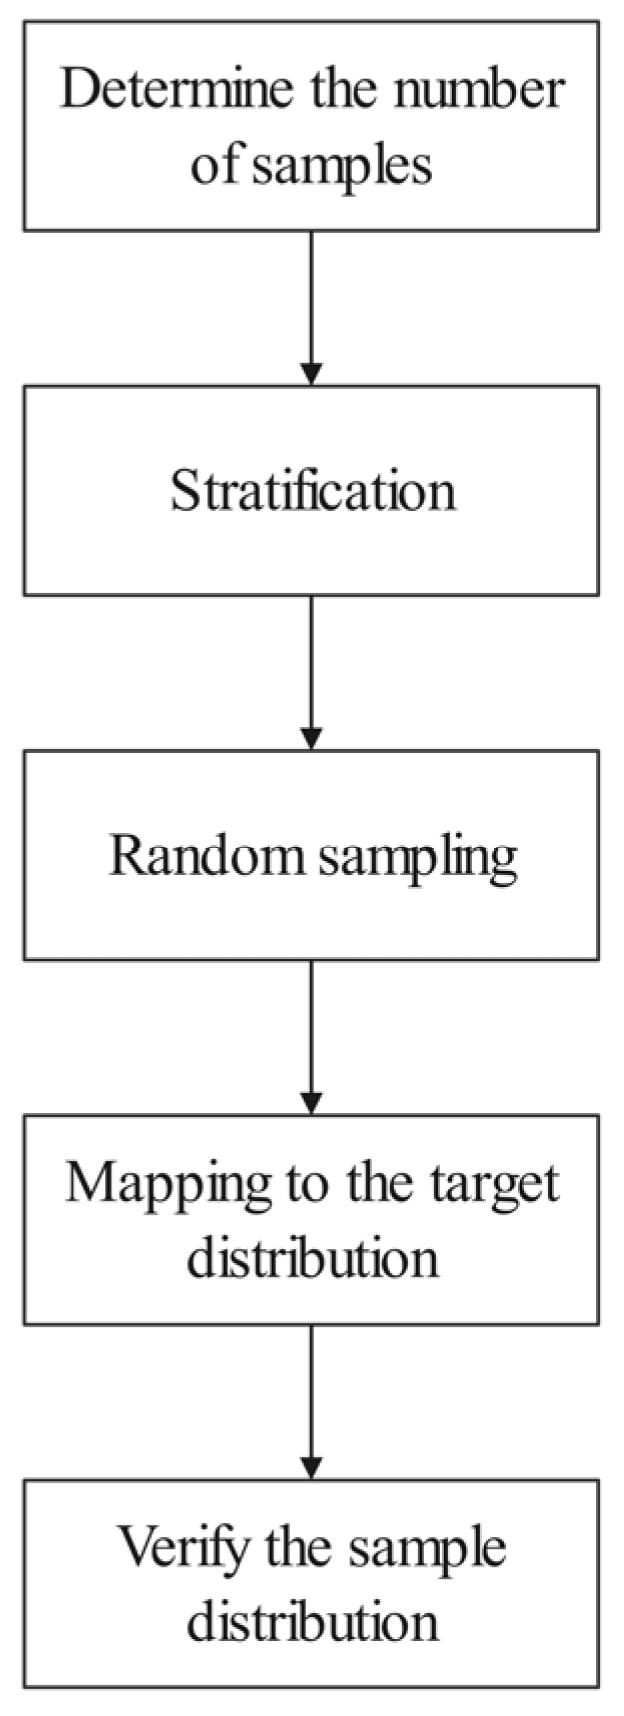
  • Determine the number of samples: First, determine the number of samplings D and the characteristic dimensions M, where D represents the number of pulse signal intervals detected by a detector within the measurement time. Then, establish an M-dimensional space based on M random variables X1, X2, …, XM.
  • Stratification: Divide each dimensional datum into D equal subintervals based on a uniform distribution.
  • Random sampling: Randomly select one sampling point from each dimensional subinterval, repeating this process D times to generate M × D sample points.
  • Mapping to the target distribution: Each element in the M × D sampling matrix represents an index of a sampling point, indicating the coordinates of the sampling point in the original sample set.
  • Validation of sample distribution: The Rossi-alpha method was used to compare the original data samples with the sampling data after using the LHS method to ensure the applicability of the LHS method.

2.4. Construction of the LHS-DMD-Rossi-Alpha Method

The LHS-DMD-Rossi-alpha method integrates the functionalities of the Rossi-alpha method for measuring the prompt neutron decay constant, the DMD method for decomposing high-dimensional data and extracting feature modes, and the LHS method for uniform stratified sampling. The LHS-DMD-Rossi-alpha method enables rapid and efficient extraction of the unique eigenvalue representing the prompt neutron decay constant by utilizing measurement data from a single neutron detector. The flowchart of the LHS-DMD-Rossi-alpha method is illustrated in Figure 2.
The calculation process of the LHS-DMD-Rossi-alpha method can be divided into the following five stages.
  • Set the channel width T and the number of channels N in the Rossi-alpha method parameters.
  • Capture neutron pulse interval data with a single 3He neutron detector using the Rossi-alpha measurement method as the original data sample.
  • Employ the LHS to reconstruct the original data sample, generating an expanded sample set of M × D, thus optimizing the DMD-Rossi-alpha method, which originally required M detectors for measurement, to be measured with a single detector.
  • Use the Rossi-alpha method to extract the neutron correlation distribution from the expanded sample set of M × D, generating an M × N histogram matrix.
  • Extract characteristic values representing the prompt neutron decay constant from the Rossi-alpha histogram distribution matrix using the DMD method.

3. Research on the LHS-DMD-Rossi-Alpha Method

3.1. Numerical Simulation of the KUCA Facility Based on RMC3.5

An essential step in the simulation and analysis work of the Rossi-alpha method is obtaining the neutron pulse time series chain. By employing RMC3.5, simulation models for the 3He proportional counter and the KUCA facility [18] are established, as shown in Figure 3. The sequence data of neutron pulses generated from nuclear reactions between neutrons and 3He gas 3He(n, p)T within the detector are recorded and saved in ASCII format for subsequent processing [19,20,21].
The KUCA facility is equipped with six absorber rods, capable of performing compensation and adjustment. Three of these serve as emergency safety rods for the reactor, named and located as follows: S4 (L, 9), S5 (I, 15), and S6 (N, 15). The other three act as control rods for reactivity adjustment, named and positioned as: C1 (L, 15), C2 (N, 9), and C3 (I, 9).
In the KUCA facility, a 1200-mm separation exists between the bottom and the top sections. The control rods and safety rods are designed to be inserted from the top. Experimental measurements involve adjusting the positions of these rods to manipulate the operational state of KUCA. Table 1 displays the distances between the bottoms of the control rods and safety rods and the bottom of the KUCA facility when in a critical state. The KUCA facility reserves three channels with a diameter of 3 cm to insert the detector. When required, three 3He detectors (# 1~# 3) are placed in the axial center of the outer reflector assembly. Through these detectors, the time series data of neutrons can be continuously collected to realize the measurement of the prompt neutron decay constant.

3.2. Performance Analysis of the LHS-DMD-Rossi-Alpha Method

This study positions the 3He detectors two assembly units away from the active fuel region, as illustrated in Figure 4. Based on the structural characteristics of the KUCA facility, 23 positions are selected at equidistant horizontal intervals for the arrangement of 3He detectors for traditional DMD analysis [22]. These positions serve as sampling points for collecting neutron time series data, used to construct matrix X. According to the DMD theoretical analysis discussed in Section 2.2, the size of matrix X is 23 × 300, indicating that 23 3He proportional counters measured data for 300 time bins.
In the data analysis of the single exponential model of the Rossi-alpha method, the accuracy of calculating the prompt neutron decay constant heavily depends on the selection of the initial fitting point. In traditional analysis methods, the fitting domain is typically chosen in the interval after the higher-order modes have sufficiently decayed, that is, by taking the logarithm of the neutron time interval counts and starting the Rossi-alpha method analysis where the curve becomes smooth. Alternatively, omitting the first 2b + 1 points (where b is the index of the time bin with the highest count) in the fitting process, these two correction methods rely on empirical judgment and have low generalizability. This study selects the zero point of the Rossi-alpha statistical histogram as the initial fitting point and conducts a data group control experiment without introducing masking time, to avoid the decrease in data credibility and contrast due to different selections of the initial fitting point, which would bring significant uncertainty to the measurement of the prompt neutron decay constant.
Due to the reproducible simulation feature of the RMC3.5, this research ensures that simulations will not affect subcriticality due to an excess of detectors; thus, data from only one detector are simulated at a time. By selecting 23 detection points for the DMD-Rossi-alpha analysis model, comparisons are made with the LHS-DMD-Rossi-alpha analysis model based on the C detector at position F-12, and the Rossi-alpha method based on the C detector at the same position. The relative errors of the alpha values calculated by these three computational models, compared to the calculated values, are illustrated in Figure 5.
Analysis using the Rossi-alpha method begins from the data origin with the C detector. As shown in the C-Rossi-alpha curve in Figure 5, the relative error of measuring the prompt neutron decay constant using Rossi-alpha gradually decreases in fluctuation as the number of channels increases. Compared to the relative error curve of measuring the prompt neutron decay constant based on the 23-DMD-Rossi-alpha, the distribution trend of the C-Rossi-alpha curve is more gradual, whereas the 23-DMD-Rossi-alpha curve shows smaller calculation deviations than the Rossi-alpha method in the channel range of 160 < n ≤ 300. With the increase in channel numbers, the average relative error between the measured values of the prompt neutron decay constant using the DMD-Rossi-alpha method and the benchmark values is 4.4%.
The data for the DMD-Rossi-alpha method are sourced from simulated data collected by detectors at 23 different locations, as illustrated in Figure 4. The measurement accuracy of the 3He neutron detectors placed within the reactor is influenced by a combination of factors, including external sources, fission and absorption of nuclear materials, leakage, moderation, and more. Due to the uneven distribution of control rods and safety rods, there is significant variability in the data measured by detectors on both sides. However, as the DMD method is data-driven, substantial data variability might indicate the presence of diverse dynamic behaviors or interference from factors like noise and outliers. These factors could potentially introduce deviations when DMD extracts characteristic modes, ultimately increasing the measurement error of the DMD-Rossi-alpha method. In contrast, the data for the LHS-DMD-Rossi-alpha method originate exclusively from the C detector. This approach mitigates neutron noise interference and enables more effective capture of characteristic information representing the prompt neutron decay constant.
Comparing the distribution curve of 23-DMD-Rossi-alpha with that of C-LHS-DMD-Rossi-alpha, it is observed that the calculation errors of both analysis methods are larger within the 50 < n ≤ 160 channel range; however, within the 160 < n ≤ 300 channel range, the fluctuation degree of the C-LHS-DMD-Rossi-alpha distribution curve with an increase in channel numbers is smaller than that of the 23-DMD-Rossi-alpha distribution curve. The average relative error between the value of prompt neutron decay constant measured by LHS-DMD-Rossi-alpha and the reference value is 3.5%, which is a 0.9% decrease in the average relative error compared to using the DMD-Rossi-alpha method. This indicates that the LHS-DMD-Rossi-alpha method can reduce the number of detectors while minimizing measurement bias.
To validate the accuracy and applicability of the LHS-DMD-Rossi-alpha method in comparison with the Rossi-alpha method for measuring the characteristic signals of the prompt neutron decay constant, this section, based on the KUCA facility, uses the C detector at position F-12 as a fixed detection point. By adjusting the positions of the control rods to change the subcriticality level of the core, measurement data from the C detector under three different levels of subcriticality are obtained to study the distribution trends of the LHS-DMD-Rossi-alpha method compared to the Rossi-alpha method in measuring the prompt neutron decay constant at different subcriticalities.
As depicted in Figure 6, the results of measuring the prompt neutron decay constant using the traditional Rossi-alpha method, when compared to calculated values, show an increasing deviation as the subcriticality deepens. Moreover, the relative error of the Rossi-alpha method calculation results under different subcriticalities is not significantly affected by the number of channels.
As shown in Figure 7, under different subcriticalities, the relative error between the measurement results obtained using the LHS-DMD-Rossi-alpha method and the benchmark values gradually stabilizes with decreasing fluctuations as the number of channels increases. Compared to the Rossi-alpha method, the deviation in the prompt neutron decay constant measured by the LHS-DMD-Rossi-alpha method from the calculated values decreases as the number of channels increases.
As illustrated in Figure 8, without introducing masking time, this study compares the average relative errors of two methods within the range of 160 < n ≤ 300 under corresponding subcriticality levels. The results indicate that the Rossi-alpha method and the LHS-DMD-Rossi-alpha method exhibit similar distribution characteristics: as the distance from criticality increases, the error in the calculation results becomes larger. This is because the accuracy of extracting the prompt neutron decay constant with the LHS-DMD-Rossi-alpha method is based on the accuracy of the Rossi-alpha method. However, as subcriticality increases, the number of correlated neutrons detected on the same fission chain gradually decreases, and the count of uncorrelated neutrons relatively increases, leading to an increase in systematic error and thus affecting the computational reliability of the LHS-DMD-Rossi-alpha method. Nonetheless, compared to the traditional Rossi-alpha method, the computational accuracy of the LHS-DMD-Rossi-alpha method is significantly improved.
To further optimize the computational performance of the LHS-DMD-Rossi-alpha method, the LHS method was employed to reconstruct measurement data from various detectors using the data from the C detector. In this investigation, eight distinct detector configurations were tested, with the number of detectors (M) in each configuration varying from 10, 15, 20, 25, 30, 35, 40, to 45. The LHS-DMD-Rossi-alpha method was then utilized to conduct measurements. By comparing the experimental results across different values of M, we aim to ascertain the optimal number of detectors for effective utilization of the LHS-DMD-Rossi-alpha method.
As shown in Figure 9, the relative error of the LHS-DMD-Rossi-alpha method measurements decreases with an increase in the number of detectors (M), and the fluctuation of its curve gradually stabilizes. The reason for this phenomenon is that when the number of detectors (M) is small, the method has difficulty accurately extracting the prompt neutron decay constant from neutron noise signals in the data. However, as the number of detectors (M) gradually increases, more sample data provide rich information for modal decomposition, thereby improving the accuracy of decomposition and effectively reducing computational errors. Nonetheless, as the sample data continue to increase, the margin of error reduction gradually diminishes. This is because after the sample data reach a certain level, the main modes of the system have already been fully captured, and at this point, adding more sample data has a relatively limited contribution to further improving measurement accuracy.

4. Conclusions

This study utilizes the RMC3.5 to simulate detector responses in the KUCA facility. Building upon the implementation of the DMD-Rossi-alpha method, the LHS-DMD-Rossi-alpha method is proposed and validated using the KUCA facility across various subcritical states. The research findings are as follows.
  • In the critical state, compared with the DMD-Rossi-alpha method and the Rossi-alpha method, the results of the LHS-DMD-Rossi-alpha method for measuring the prompt neutron decay constant are less deviated from the calculation of the benchmark experimental values. The research shows that the LHS-DMD-Rossi-alpha method reduces the 23 detector data required by the DMD-Rossi-alpha method to one, and reduces the relative error of the calculation of the prompt neutron decay constant by 0.75%.
  • As the subcriticality deepens, both the Rossi-alpha method and the LHS-DMD-Rossi-alpha method show an increase in the relative error in calculating the prompt neutron decay constant. However, the relative error of the prompt neutron decay constant calculated by the LHS-DMD-Rossi-alpha method is still smaller than that calculated by the Rossi-alpha method, and the relative error is reduced by 9%.
  • By investigating the relative error of measuring the prompt neutron decay constant using datasets generated by varying the number of detectors (M) in the LHS-DMD-Rossi-alpha method through sampling, it was found that increasing the number of detectors can reduce the error of the LHS-DMD-Rossi-alpha method. However, the margin of error reduction gradually diminishes when the number of detectors increases to 35.
The current study focuses on validating the effectiveness of the LHS-DMD-Rossi-alpha method in measuring the prompt neutron decay constant. In future research, this method will be applied to the analysis of critical accidents [23,24], enabling further investigation into the variation patterns of the prompt neutron decay constant during critical accidents in reactor systems. This will provide solutions for safe operation and accident prevention in nuclear reactors.

Author Contributions

J.L.: methodology, software, validation, investigation, visualization, formal analysis, writing—original draft, writing—review and editing. J.X.: supervision, writing—review and editing, funding acquisition. N.D.: methodology, investigation, visualization, writing—review and editing. E.Z.: methodology, investigation, visualization, writing—review and editing. Z.W.: methodology, investigation, visualization, writing—review and editing. J.T.: methodology, investigation, visualization, writing—review and editing. T.Y.: conceptualization, methodology, validation, supervision, funding acquisition, writing—review and editing. All authors have read and agreed to the published version of the manuscript.

Funding

This work is supported by the National Natural Science Foundation of China (No. U2267207), Science and Technology on Reactor System Design Technology Laboratory.

Data Availability Statement

The original contributions presented in the study are included in the article, further inquiries can be directed to the corresponding author.

Conflicts of Interest

The authors declare no conflict of interest.

References

  1. Talamo, A.; Gohar, Y.; Gabrielli, F.; Rineiski, A.; Pyeon, C. Advances in the computation of the Sjöstrand, Rossi, and Feynman distributions. Prog. Nucl. Energy 2017, 101, 299–311. [Google Scholar] [CrossRef]
  2. Muñoz-Cobo, J.-L.; Berglöf, C.; Peña, J.; Villamarín, D.; Bournos, V. Feynman-α and Rossi-α formulas with spatial and modal effects. Ann. Nucl. Energy 2011, 38, 590–600. [Google Scholar] [CrossRef]
  3. Hua, M.Y.; Darby, F.B.; Hutchinson, J.D.; McKenzie, G.E.; Clarke, S.D.; Pozzi, S.A. Validation of the two-region Rossi-alpha model for reflected assemblies. Nucl. Instrum. Methods Phys. Res. Sect. A Accel. Spectrometers Detect. Assoc. Equip. 2020, 981, 164535. [Google Scholar] [CrossRef]
  4. Kong, C.; Lee, D. Sensitivity analysis of source intensity and time bin size for the Rossi-alpha method in a numerical reactor model. Ann. Nucl. Energy 2019, 130, 157–163. [Google Scholar] [CrossRef]
  5. Yamamoto, T.; Sakamoto, H. Higher harmonic analyses of the Rossi-α method and application of dynamic mode decomposition for time decay constant determination in a 1D subcritical system. Ann. Nucl. Energy 2022, 168, 108886. [Google Scholar] [CrossRef]
  6. Albugami, A.O.; Alomari, A.S.; Almarshad, A.I. Modeling and simulation of VERA core physics benchmark using OpenMC code. Nucl. Eng. Technol. 2023, 55, 3388–3400. [Google Scholar] [CrossRef]
  7. Wang, K.; Li, Z.; She, D.; Liang, J.; Xu, Q.; Qiu, Y.; Yu, J.; Sun, J.; Fan, X.; Yu, G. RMC–A Monte Carlo code for reactor core analysis. Ann. Nucl. Energy 2014, 82, 121–129. [Google Scholar] [CrossRef]
  8. Pyeon, C.H.; Yamanaka, M.; Endo, T.; Chiba, G.; Van Rooijen, W.F.G.; Watanabe, K. Neutron Generation Time in Highly-Enriched Uranium Core at Kyoto University Critical Assembly. Nucl. Sci. Eng. 2020, 194, 1116–1127. [Google Scholar] [CrossRef]
  9. Talamo, A.; Gohar, Y.; Yamanaka, M.; Pyeon, C.H. Paralyzable and non-paralyzable dead-time corrections for the neutron detectors of the KUCA facility driven by external neutron sources. J. Nucl. Sci. Technol. 2020, 57, 157–168. [Google Scholar] [CrossRef]
  10. Szieberth, M.; Klujber, G.; Kloosterman, J.L.; de Haas, D. Measurement of multiple α -modes at the Delphi subcritical assembly by neutron noise techniques. Ann. Nucl. Energy 2015, 75, 146–157. [Google Scholar] [CrossRef]
  11. Yamanaka, M.; Pyeon, C.H.; Kim, S.H.; Shiga, H.; Kitamura, Y.; Misawa, T. Effective delayed neutron fraction by Rossi-α method in accelerator-driven system experiments with 100 MeV protons at kyoto university critical assembly. J. Nucl. Sci. Technol. 2017, 54, 293–300. [Google Scholar] [CrossRef]
  12. Jiang, H.; Dong, W.; Li, P.; Zhang, H. Based on Wavelet and Windowed Multi-Resolution Dynamic Mode Decomposition, Transient Axial Force Analysis of a Centrifugal Pump under Variable Operating Conditions. Energies 2023, 16, 7176. [Google Scholar] [CrossRef]
  13. Yang, Y.; Liu, X.; Zhang, Z. Analysis of V-Gutter Reacting Flow Dynamics Using Proper Orthogonal and Dynamic Mode Decompositions. Energies 2020, 13, 4886. [Google Scholar] [CrossRef]
  14. Guan, W.; Dong, L.; Zhang, A.; Cai, Y. Output-only modal identification with recursive dynamic mode decomposition for time-varying systems. Measurement 2023, 224, 113852. [Google Scholar] [CrossRef]
  15. Hardy, Z.K.; Morel, J.E.; Ahrens, C. Dynamic Mode Decomposition for Subcritical Metal Systems. Nucl. Sci. Eng. 2019, 193, 1173–1185. [Google Scholar] [CrossRef]
  16. Schmid, P.J. Application of the dynamic mode decomposition to experimental data. Exp. Fluids 2011, 50, 1123–1130. [Google Scholar] [CrossRef]
  17. Yang, W.; Zhang, Y.; Wang, Y.; Liang, K.; Zhao, H.; Yang, A. Multi-Angle Reliability Evaluation of Grid-Connected Wind Farms with Energy Storage Based on Latin Hypercube Important Sampling. Energies 2023, 16, 6427. [Google Scholar] [CrossRef]
  18. Pyeon, C.H.; Talamo, A.; Fukushima, M. Special issue on accelerator-driven system benchmarks at Kyoto University Critical Assembly. J. Nucl. Sci. Technol. 2020, 57, 133–135. [Google Scholar] [CrossRef]
  19. Peplowski, P.N.; Yokley, Z.W.; Liebel, M.; Cheng, S.; Elphic, R.C.; Hoogerheide, S.F.; Lawrence, D.J.; Nico, J.S. Position-dependent neutron detection efficiency loss in 3He gas proportional counters. Nucl. Instrum. Methods Phys. Res. Sect. A Accel. Spectrometers Detect. Assoc. Equip. 2020, 982, 164574. [Google Scholar] [CrossRef]
  20. Talamo, A.; Gohar, Y.; Yamanaka, M.; Pyeon, C.H. Calculation of the prompt neutron decay constant for the KUCA facility driven by a stationary or pulsed external neutron source. J. Nucl. Sci. Technol. 2020, 57, 145–156. [Google Scholar] [CrossRef]
  21. Hursin, M.; Zoia, A.; Rouchon, A.; Brighenti, A.; Zmijarevic, I.; Santandrea, S.; Vinai, P.; Mylonakis, A.; Yi, H.; Demazière, C.; et al. Modeling noise experiments performed at AKR-2 and CROCUS zero-power reactors. Ann. Nucl. Energy 2023, 194, 110066. [Google Scholar] [CrossRef]
  22. Yamamoto, T.; Sakamoto, H. Application of dynamic mode decomposition to exponential experiment for spatial decay constant determination. Ann. Nucl. Energy 2021, 162, 108506. [Google Scholar] [CrossRef]
  23. Oettingen, M. Criticality analysis of the Louis Slotin accident. Nucl. Eng. Des. 2018, 338, 92–101. [Google Scholar] [CrossRef]
  24. Oettingen, M. A criticality study on the LA-1 accident using Monte Carlo methods. Nucl. Eng. Des. 2020, 359, 110467. [Google Scholar] [CrossRef]
Figure 1. Block diagram of the flow of the Latin Hypercube sampling method.
Energies 17 02034 g001
Figure 2. Block diagram of the flow of the LHS-DMD-Rossi-alpha method.
Energies 17 02034 g002
Figure 3. Cross-sectional view of the KUCA core layout.
Energies 17 02034 g003
Figure 4. Layout of 23 detector positions for traditional DMD-Rossi-alpha analysis in the KUCA facility.
Energies 17 02034 g004
Figure 5. Relative error comparison of the multi-position DMD-Rossi-alpha Method, LHS-DMD-Rossi-alpha, and Rossi-alpha Method.
Energies 17 02034 g005
Figure 6. The relative error diagrams of the calculation results of Rossi-alpha method under different subcriticalities.
Energies 17 02034 g006
Figure 7. The relative error diagrams of the calculation results of LHS-DMD-Rossi-alpha method under different subcriticalities.
Energies 17 02034 g007
Figure 8. The relative error diagrams of the calculation results of Rossi-alpha method and LHS-DMD-Rossi-alpha method under different subcriticalities.
Energies 17 02034 g008
Figure 9. The relative error plots of the calculation results of the LHS-DMD-Rossi-alpha method under different detector numbers.
Energies 17 02034 g009
Table 1. Positions of control rods and safety rods in critical state.
Control RodsSafety Rods
C1C2C3S4S5S6
1200.00 mm1200.00 mm630.01 mm1200.00 mm1200.00 mm1200.00 mm
Disclaimer/Publisher’s Note: The statements, opinions and data contained in all publications are solely those of the individual author(s) and contributor(s) and not of MDPI and/or the editor(s). MDPI and/or the editor(s) disclaim responsibility for any injury to people or property resulting from any ideas, methods, instructions or products referred to in the content.

