
Optimal Power Scheduling and Techno-Economic Analysis of a Residential Microgrid for a Remotely Located Area: A Case Study for the Sahara Desert of Niger
 ,
,  , ,
, ,  and
and 
Abstract
:1. Introduction
1.1. Motivations
1.2. Related Works
1.3. Contributions and Paper Organization
- A realistic power-scheduling approach is developed using highly dynamic meteorological and annual electric load data and the ability to operate the PV system in both off-grid and on-grid systems is proposed.
- A comprehensive analysis of the technical and economic performance of the three proposed cases is presented to illustrate the feasibility and productivity of the proposed techniques.
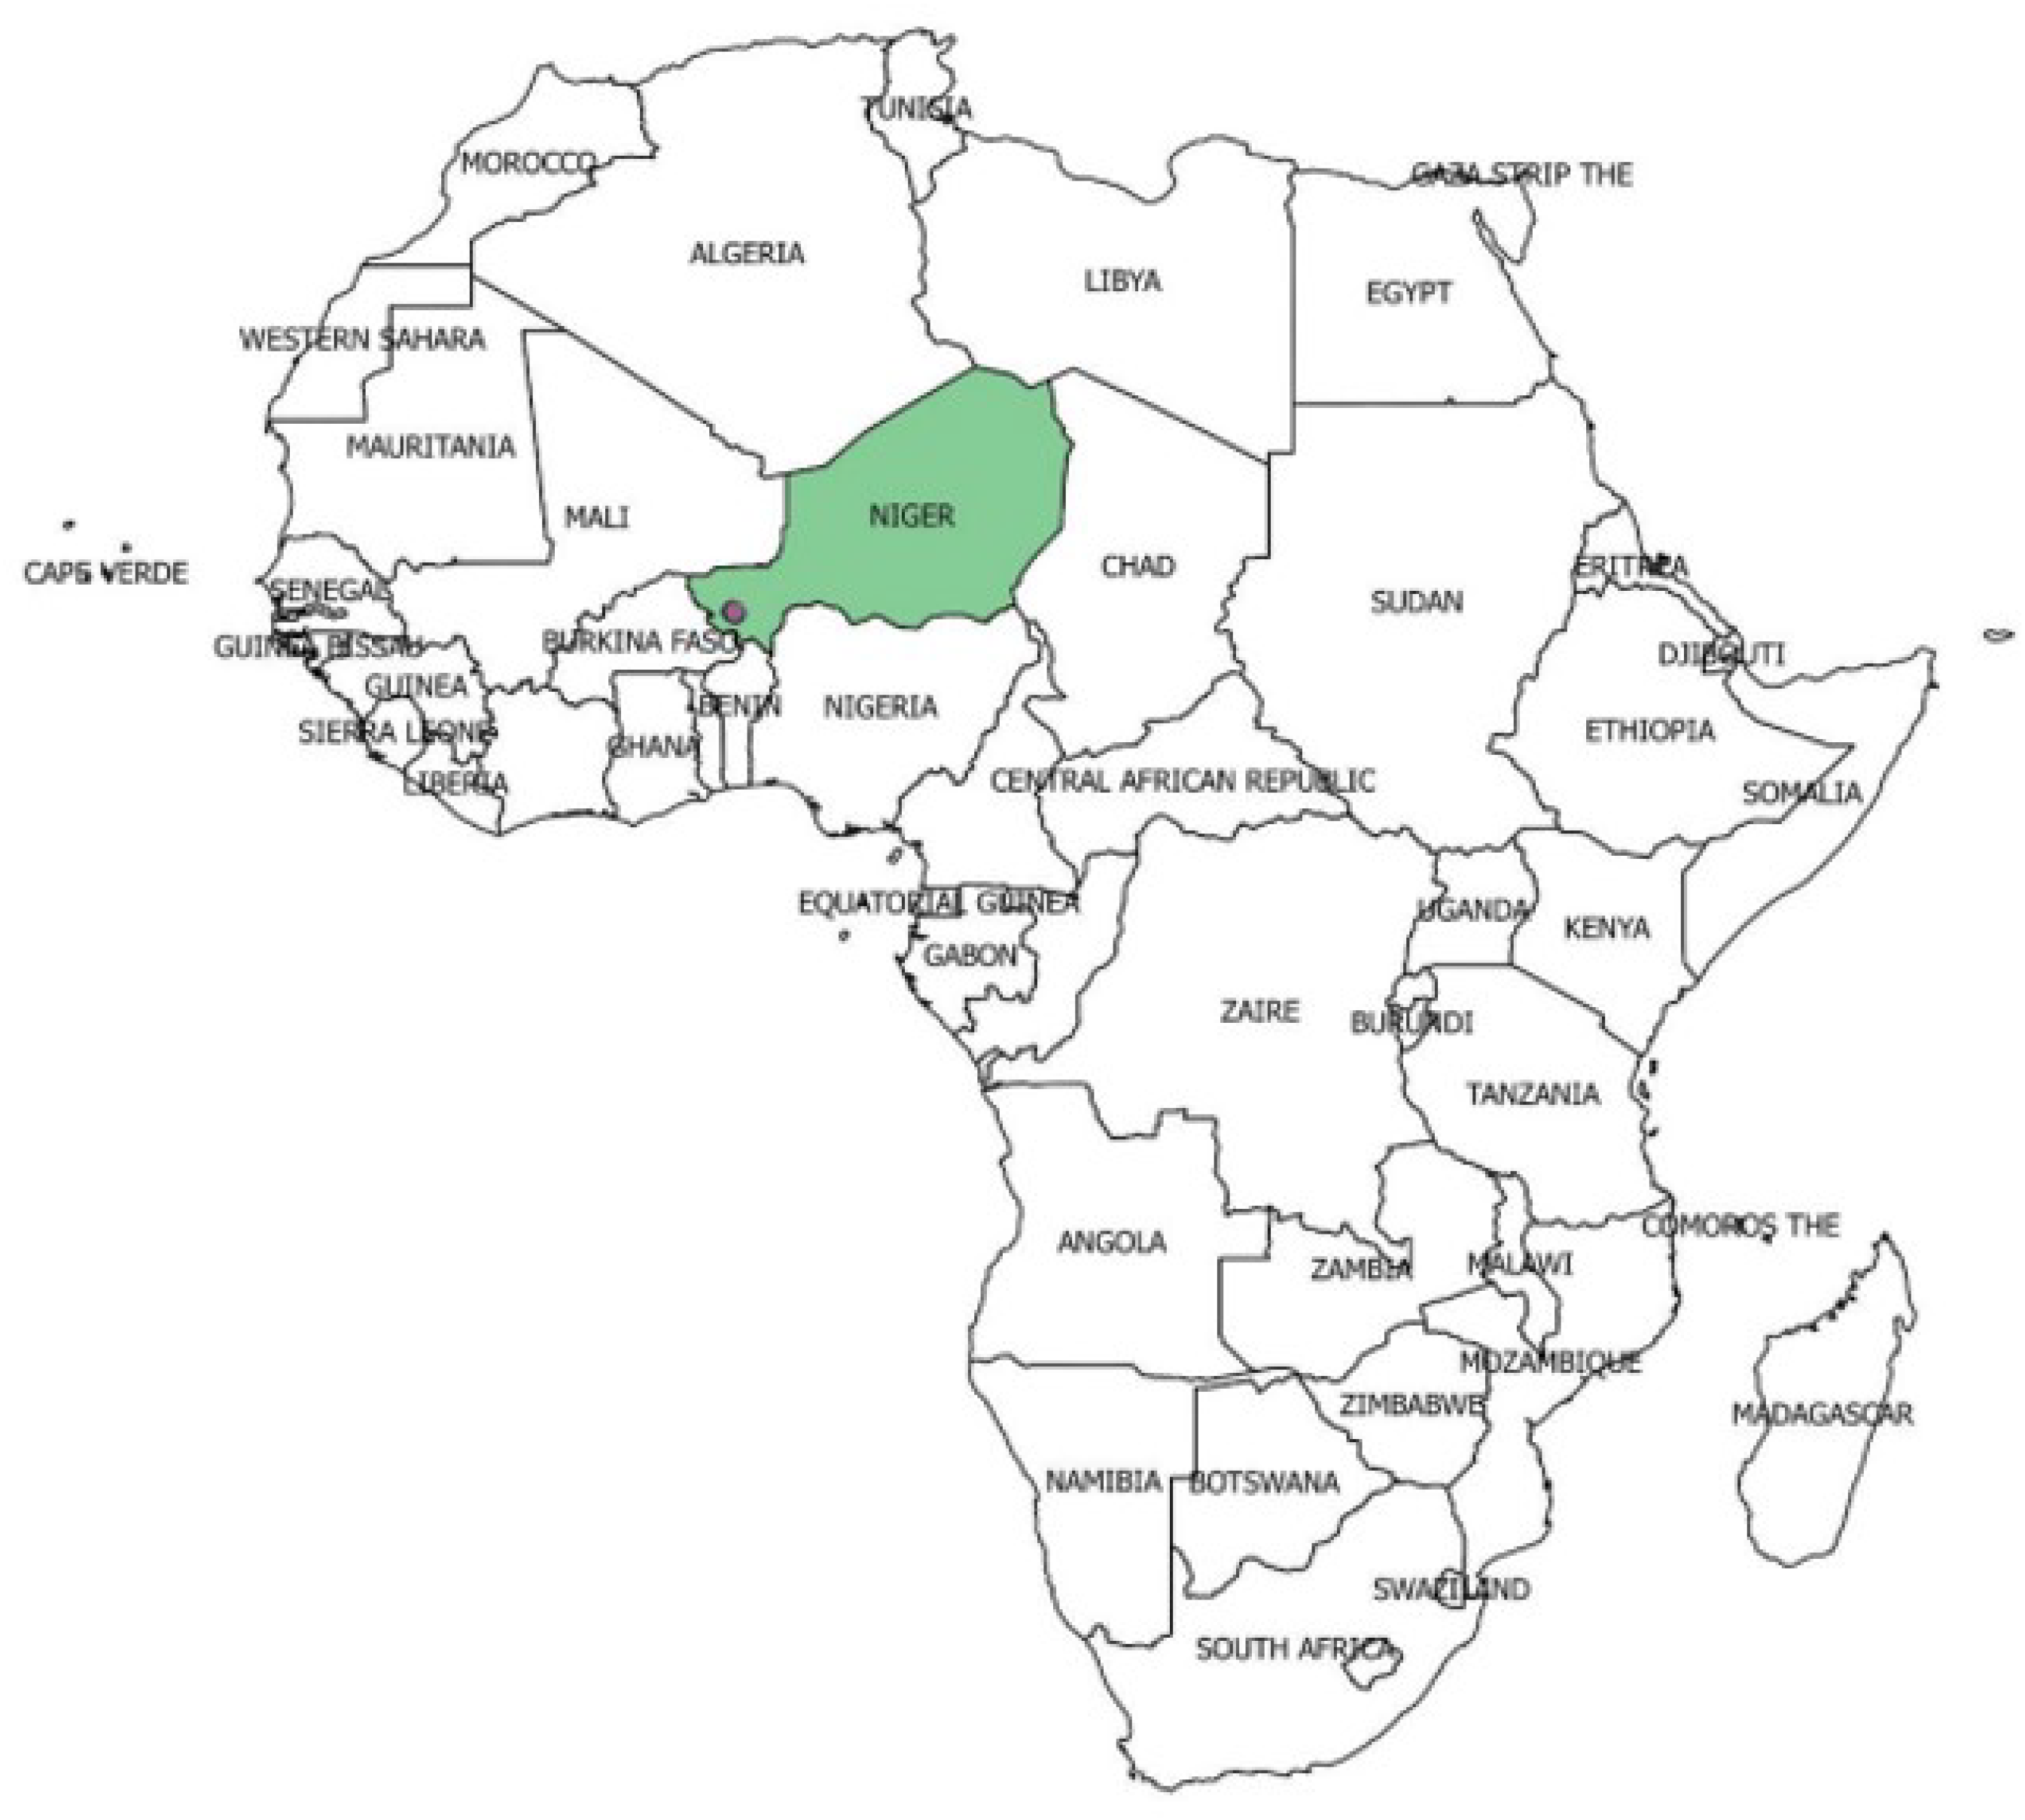
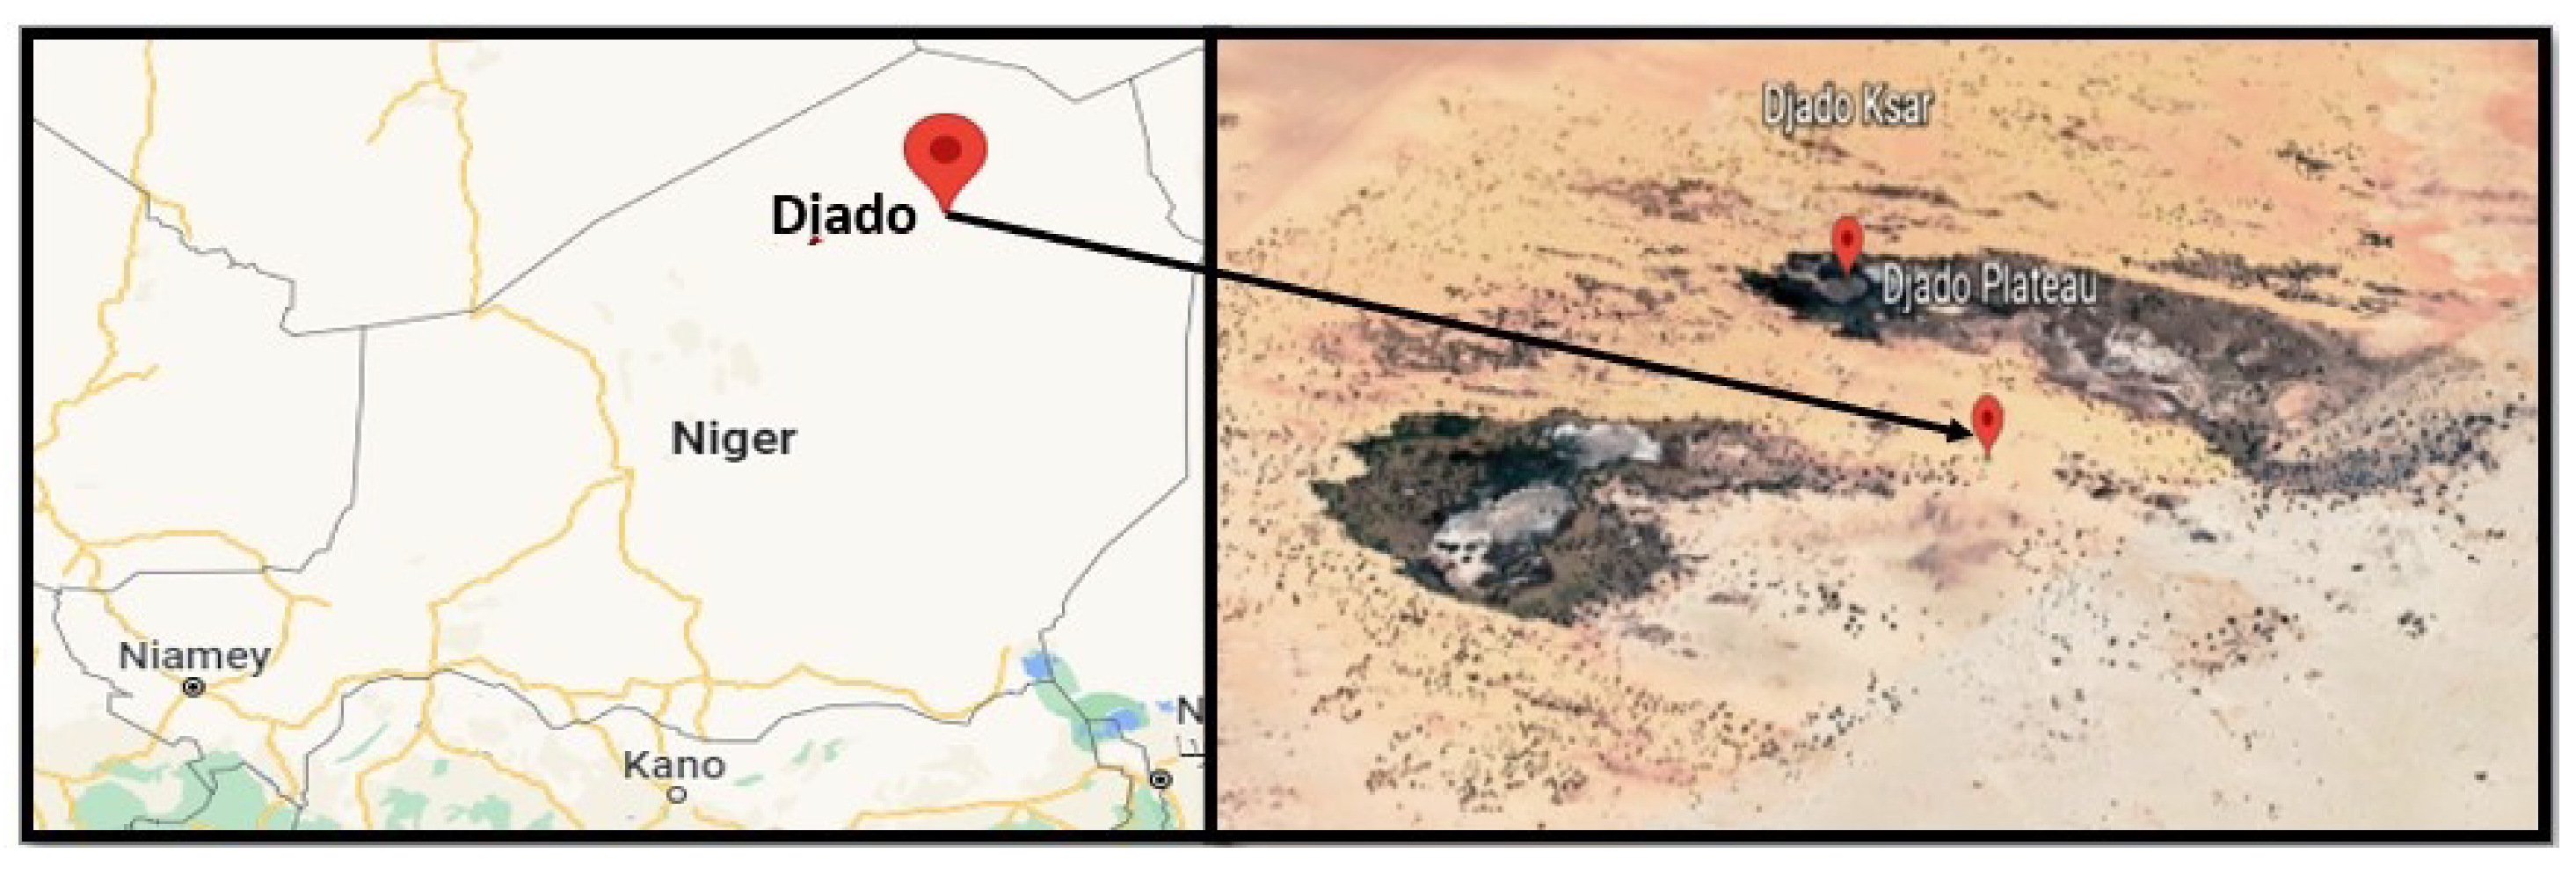
- Three cases of a microgrid configuration supplying a remote area in the Sahara Ténéré desert in northeastern Niger are presented and compared to choose the most cost-effective method, whether through an off-grid or on-grid system.
- An MILP-based framework is presented for optimal techno-economic power scheduling and sizing of the microgrid, considering stochasticity in the load demand.
2. Methodology
2.1. Problem Description and Proposed Solutions
2.2. Site Description
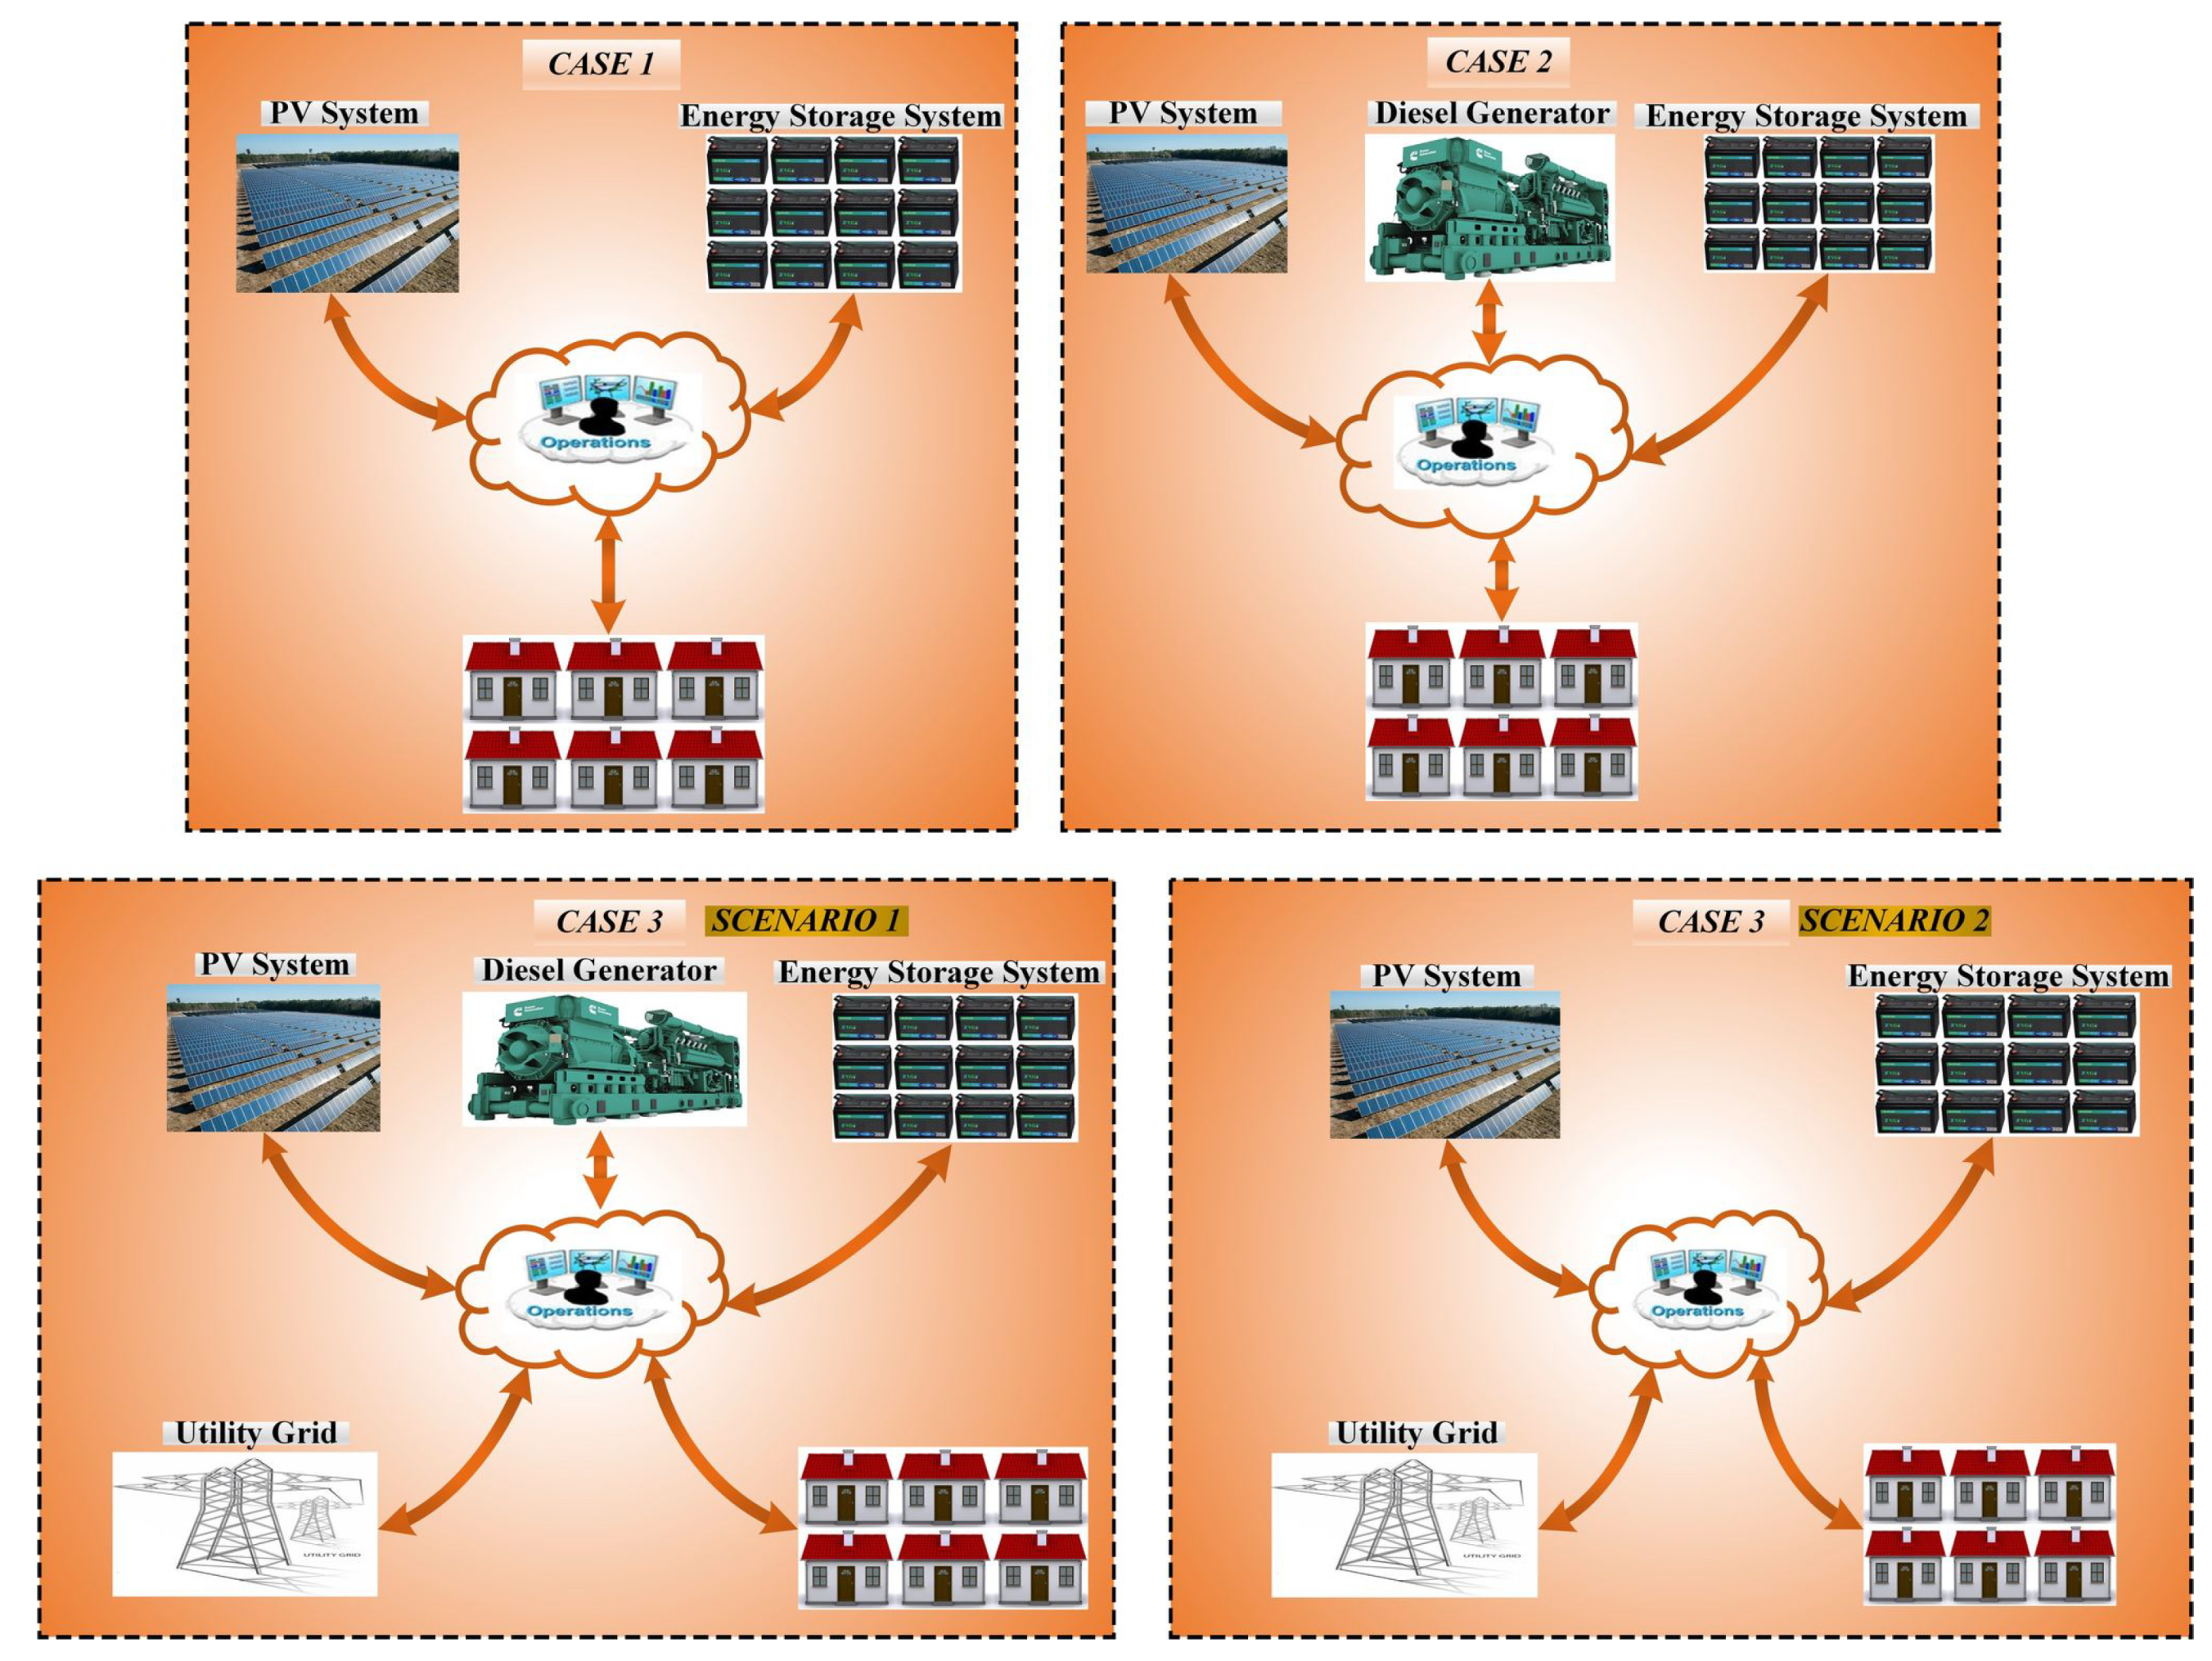
2.3. Proposed Microgrid System Block Diagram Configurations and Mathematical Model
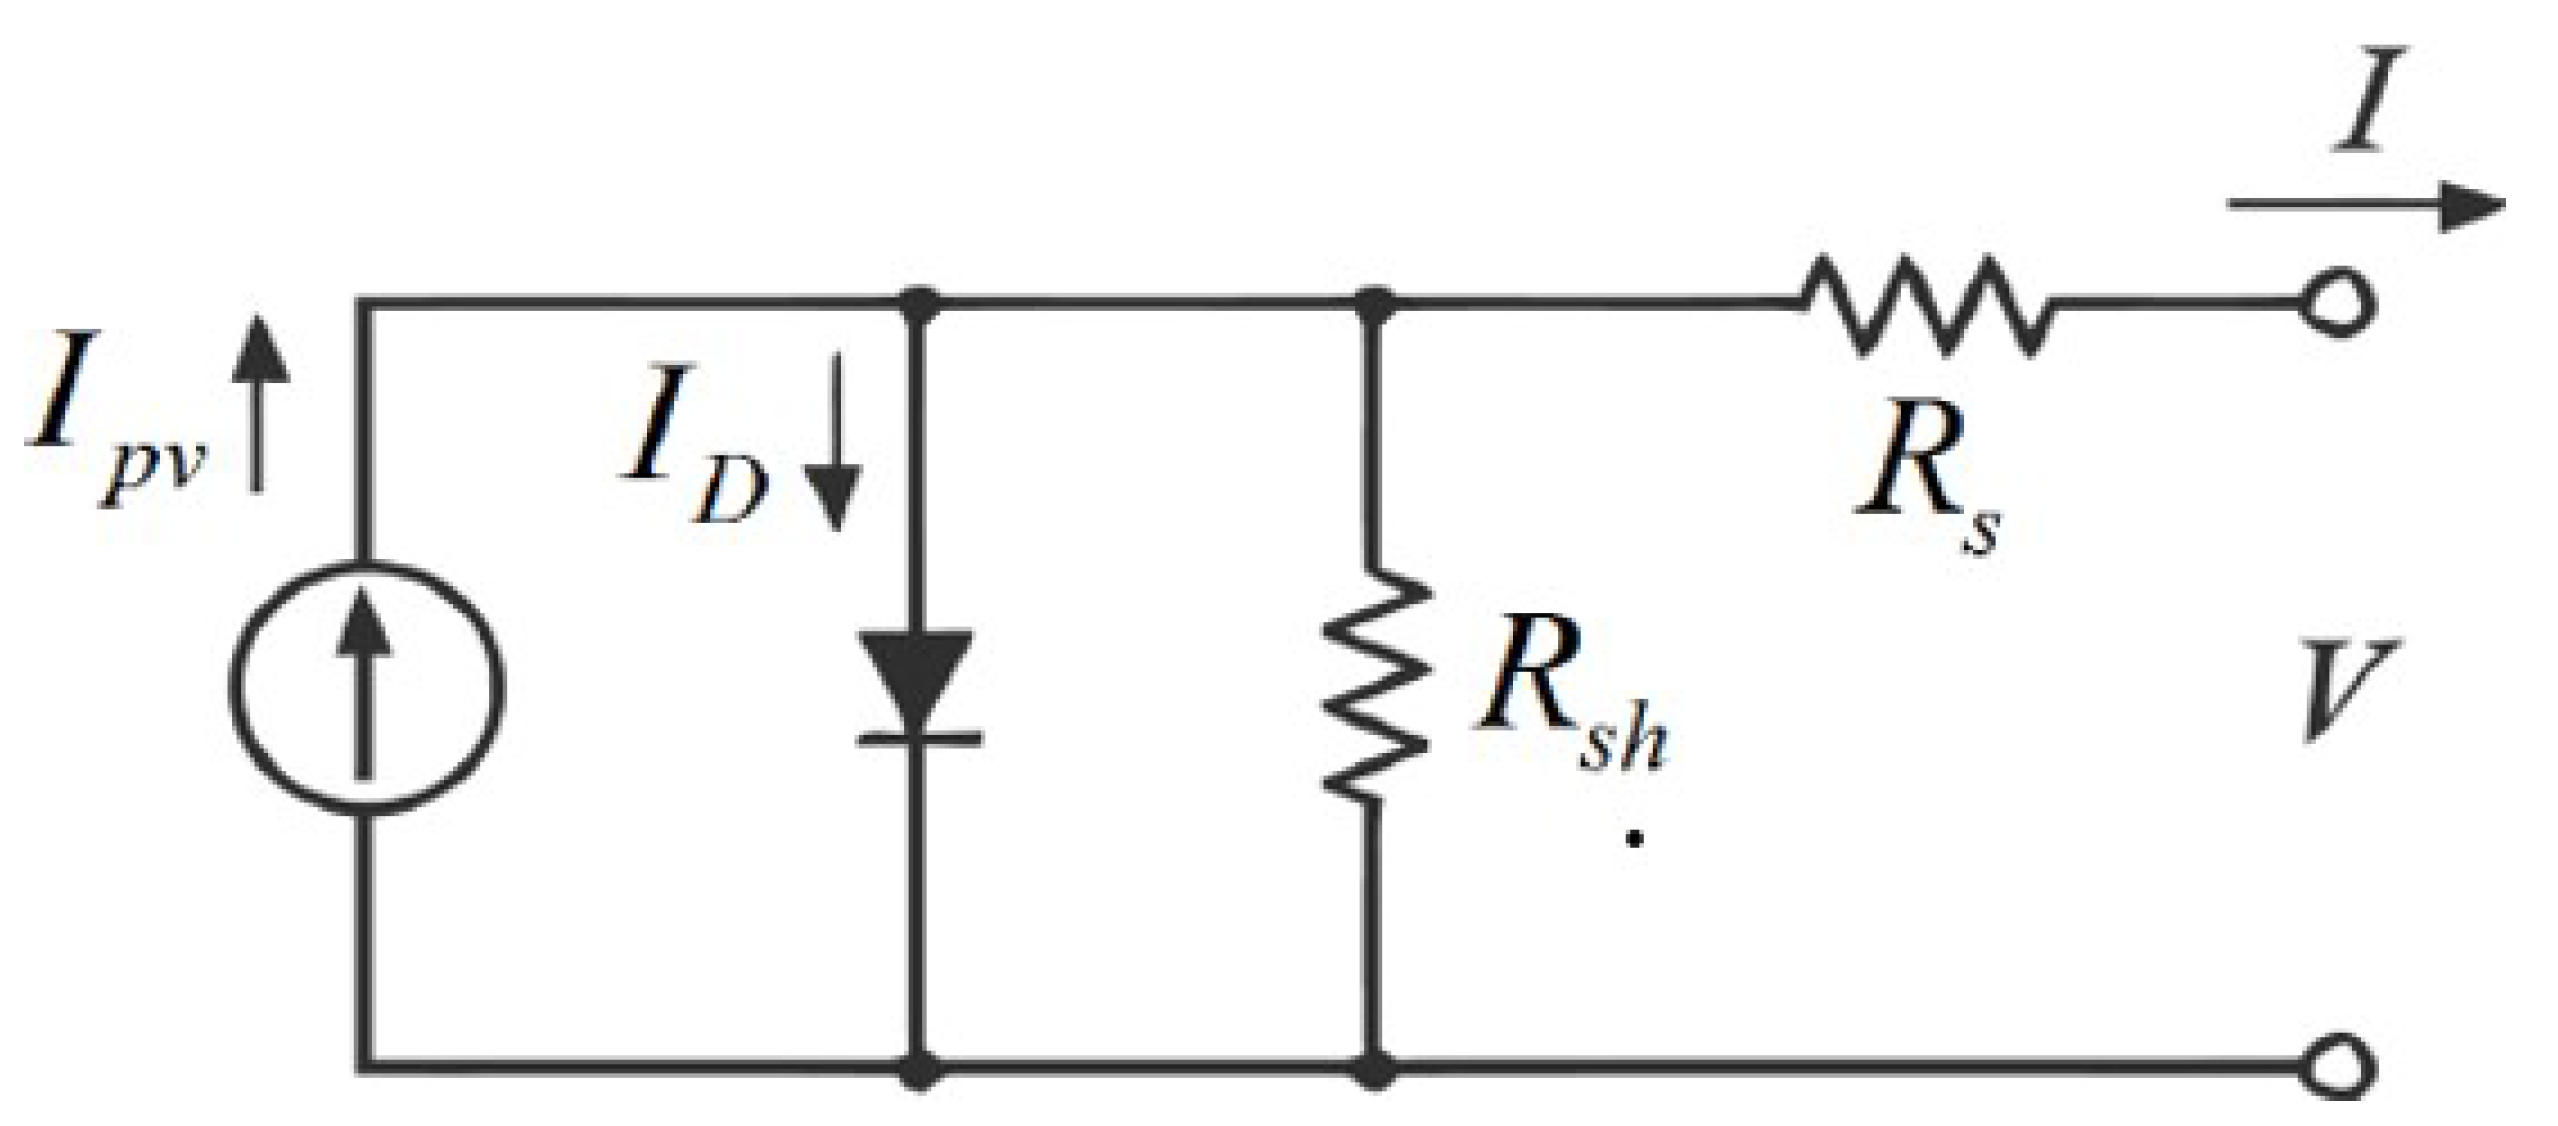
2.3.1. Modeling of Solar PV System
2.3.2. Modeling of Battery Energy Storage System
- Charging process:
- Discharging process:
2.3.3. Modeling of Diesel Generator (DG)
2.3.4. Grid Model
3. Formulation of the Optimization Problem
3.1. Objective Function
3.2. Design Constraints
3.3. Mixed-Integer Linear Programming for the Microgrid Optimal Sizing
- Reduce the problem size using linear program preprocessing;
- Solve an initial relaxed (non-integer) problem using linear programming;
- Perform mixed-integer program preprocessing to tighten the linear problem (LP) relaxation of the mixed-integer problem;
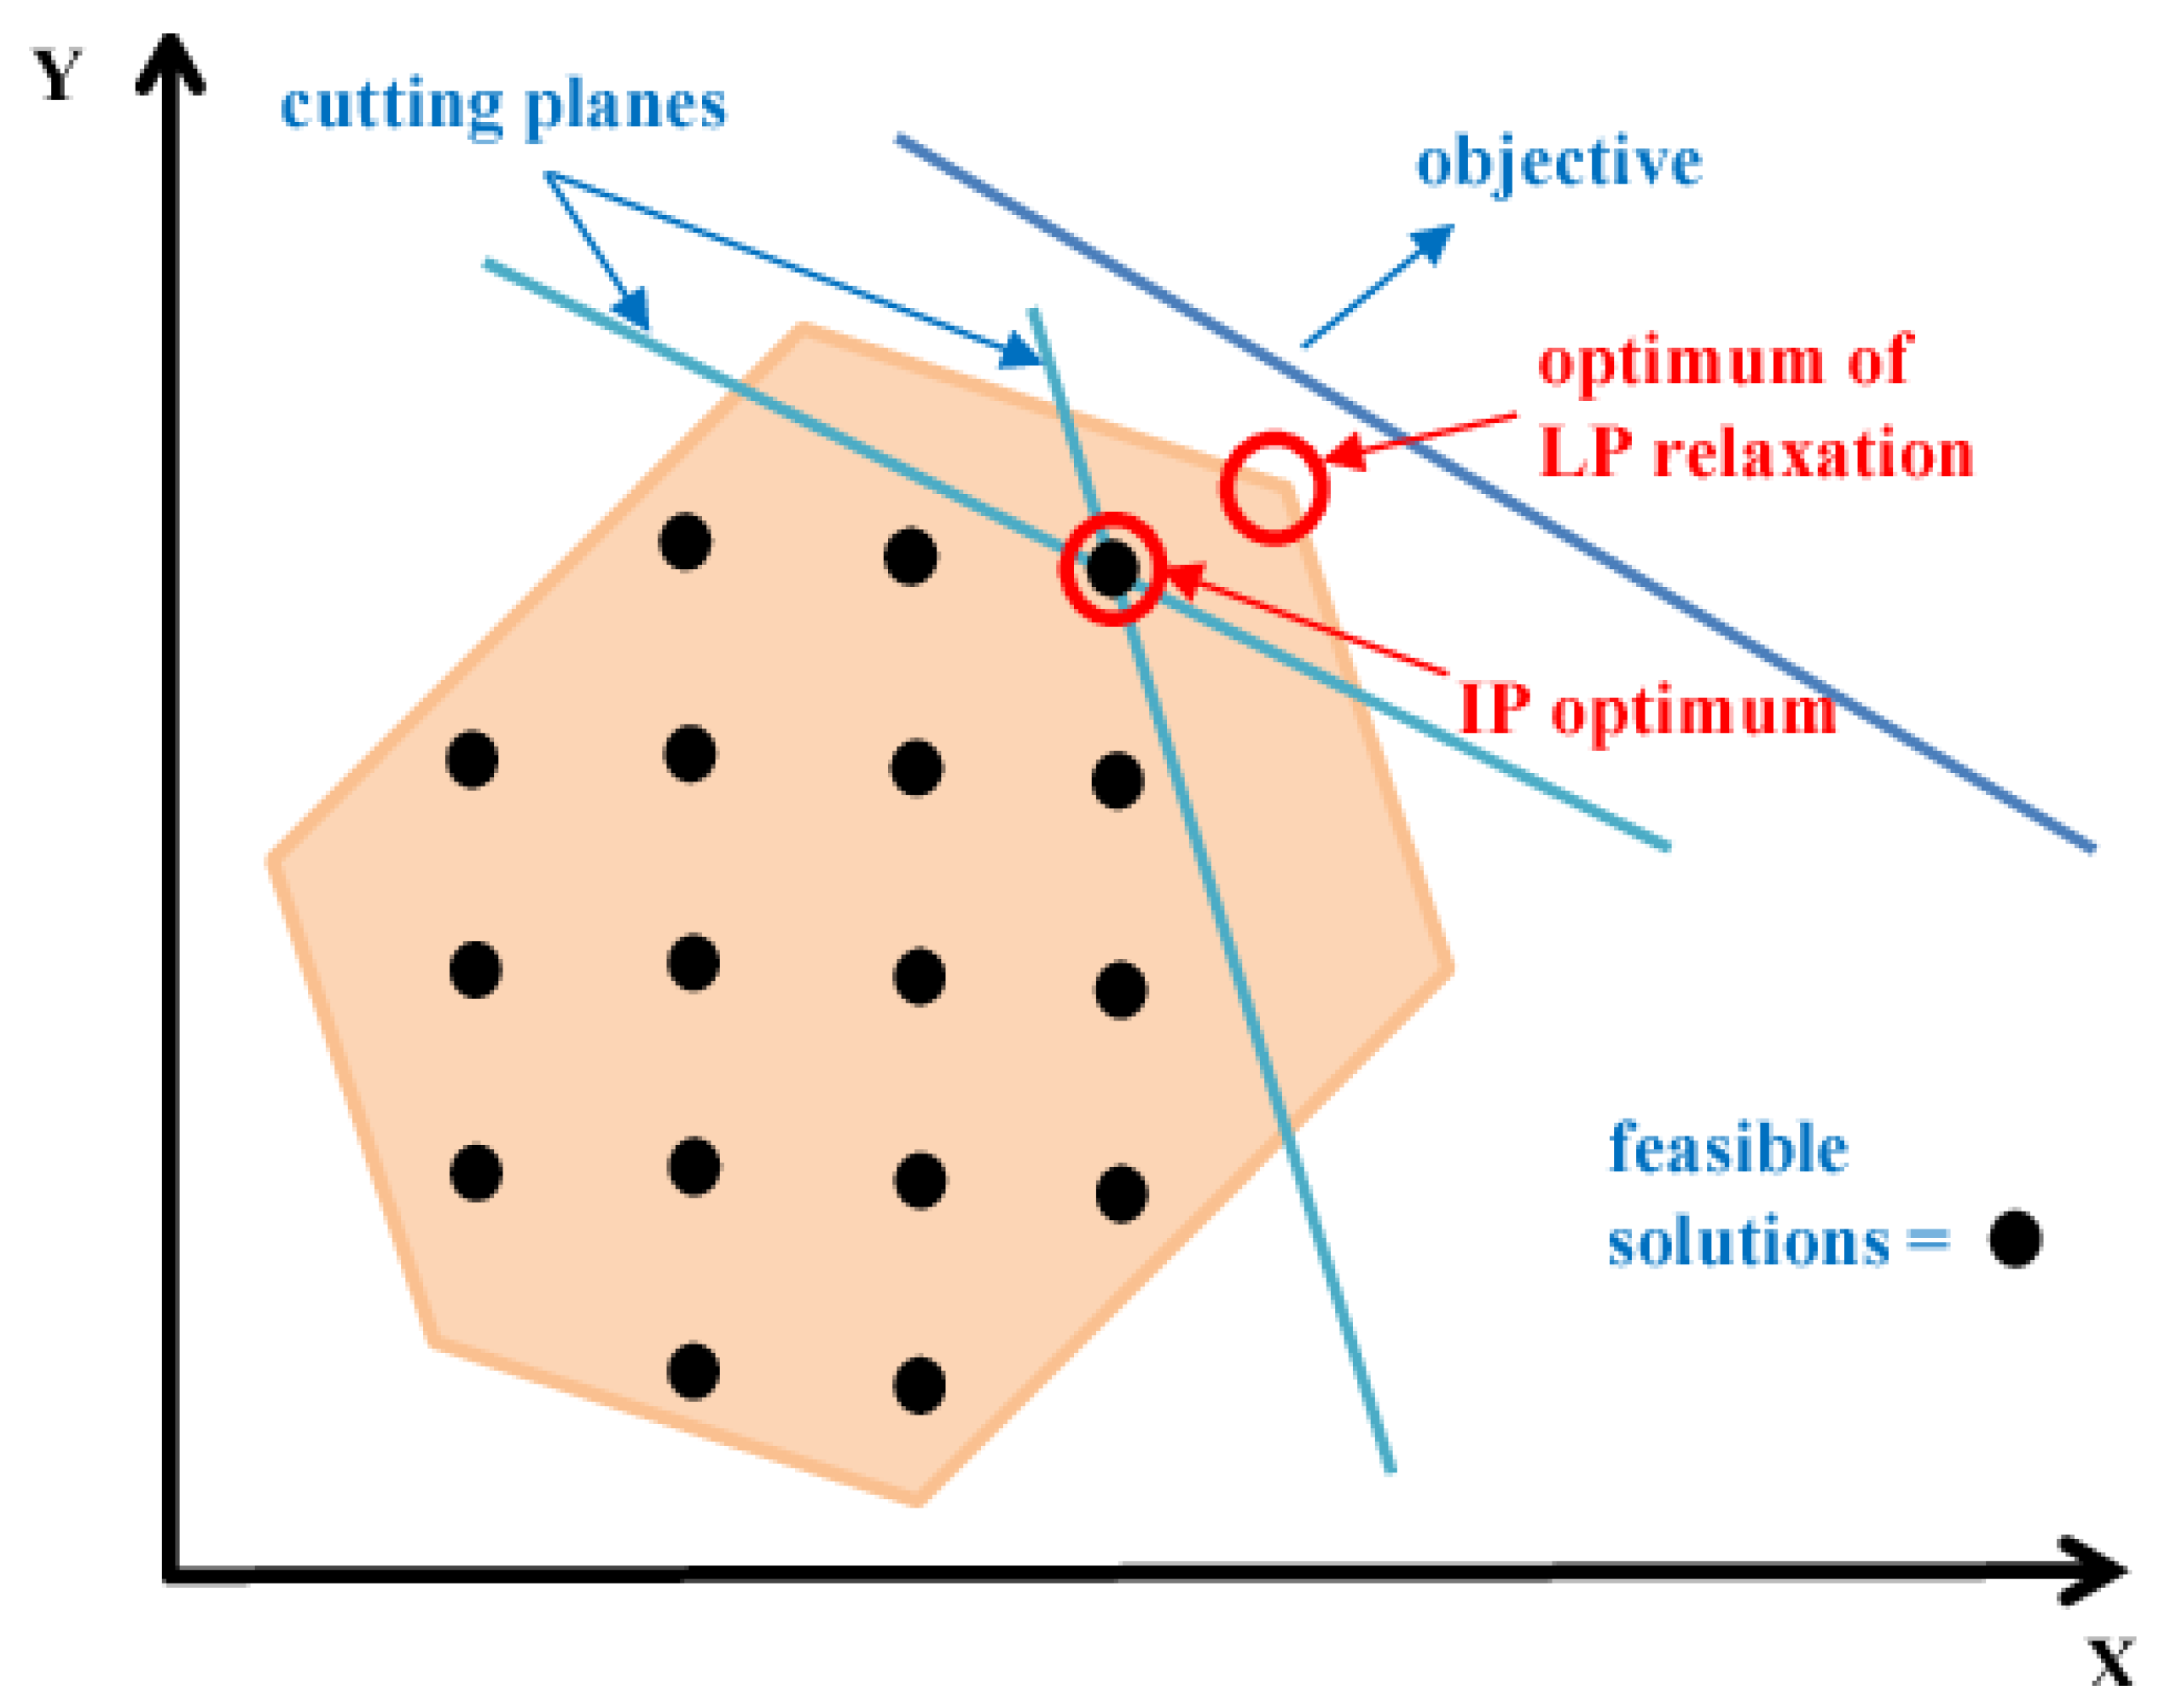
- Try to use the cutting-plane method to further tighten the LP relaxation of the mixed-integer problem as shown in Figure 6;
- Try to find integer-feasible solutions using heuristics;
- Use a branch and bound algorithm to search systematically for the optimum solution.
4. Case Study
5. Optimization Results and Discussion
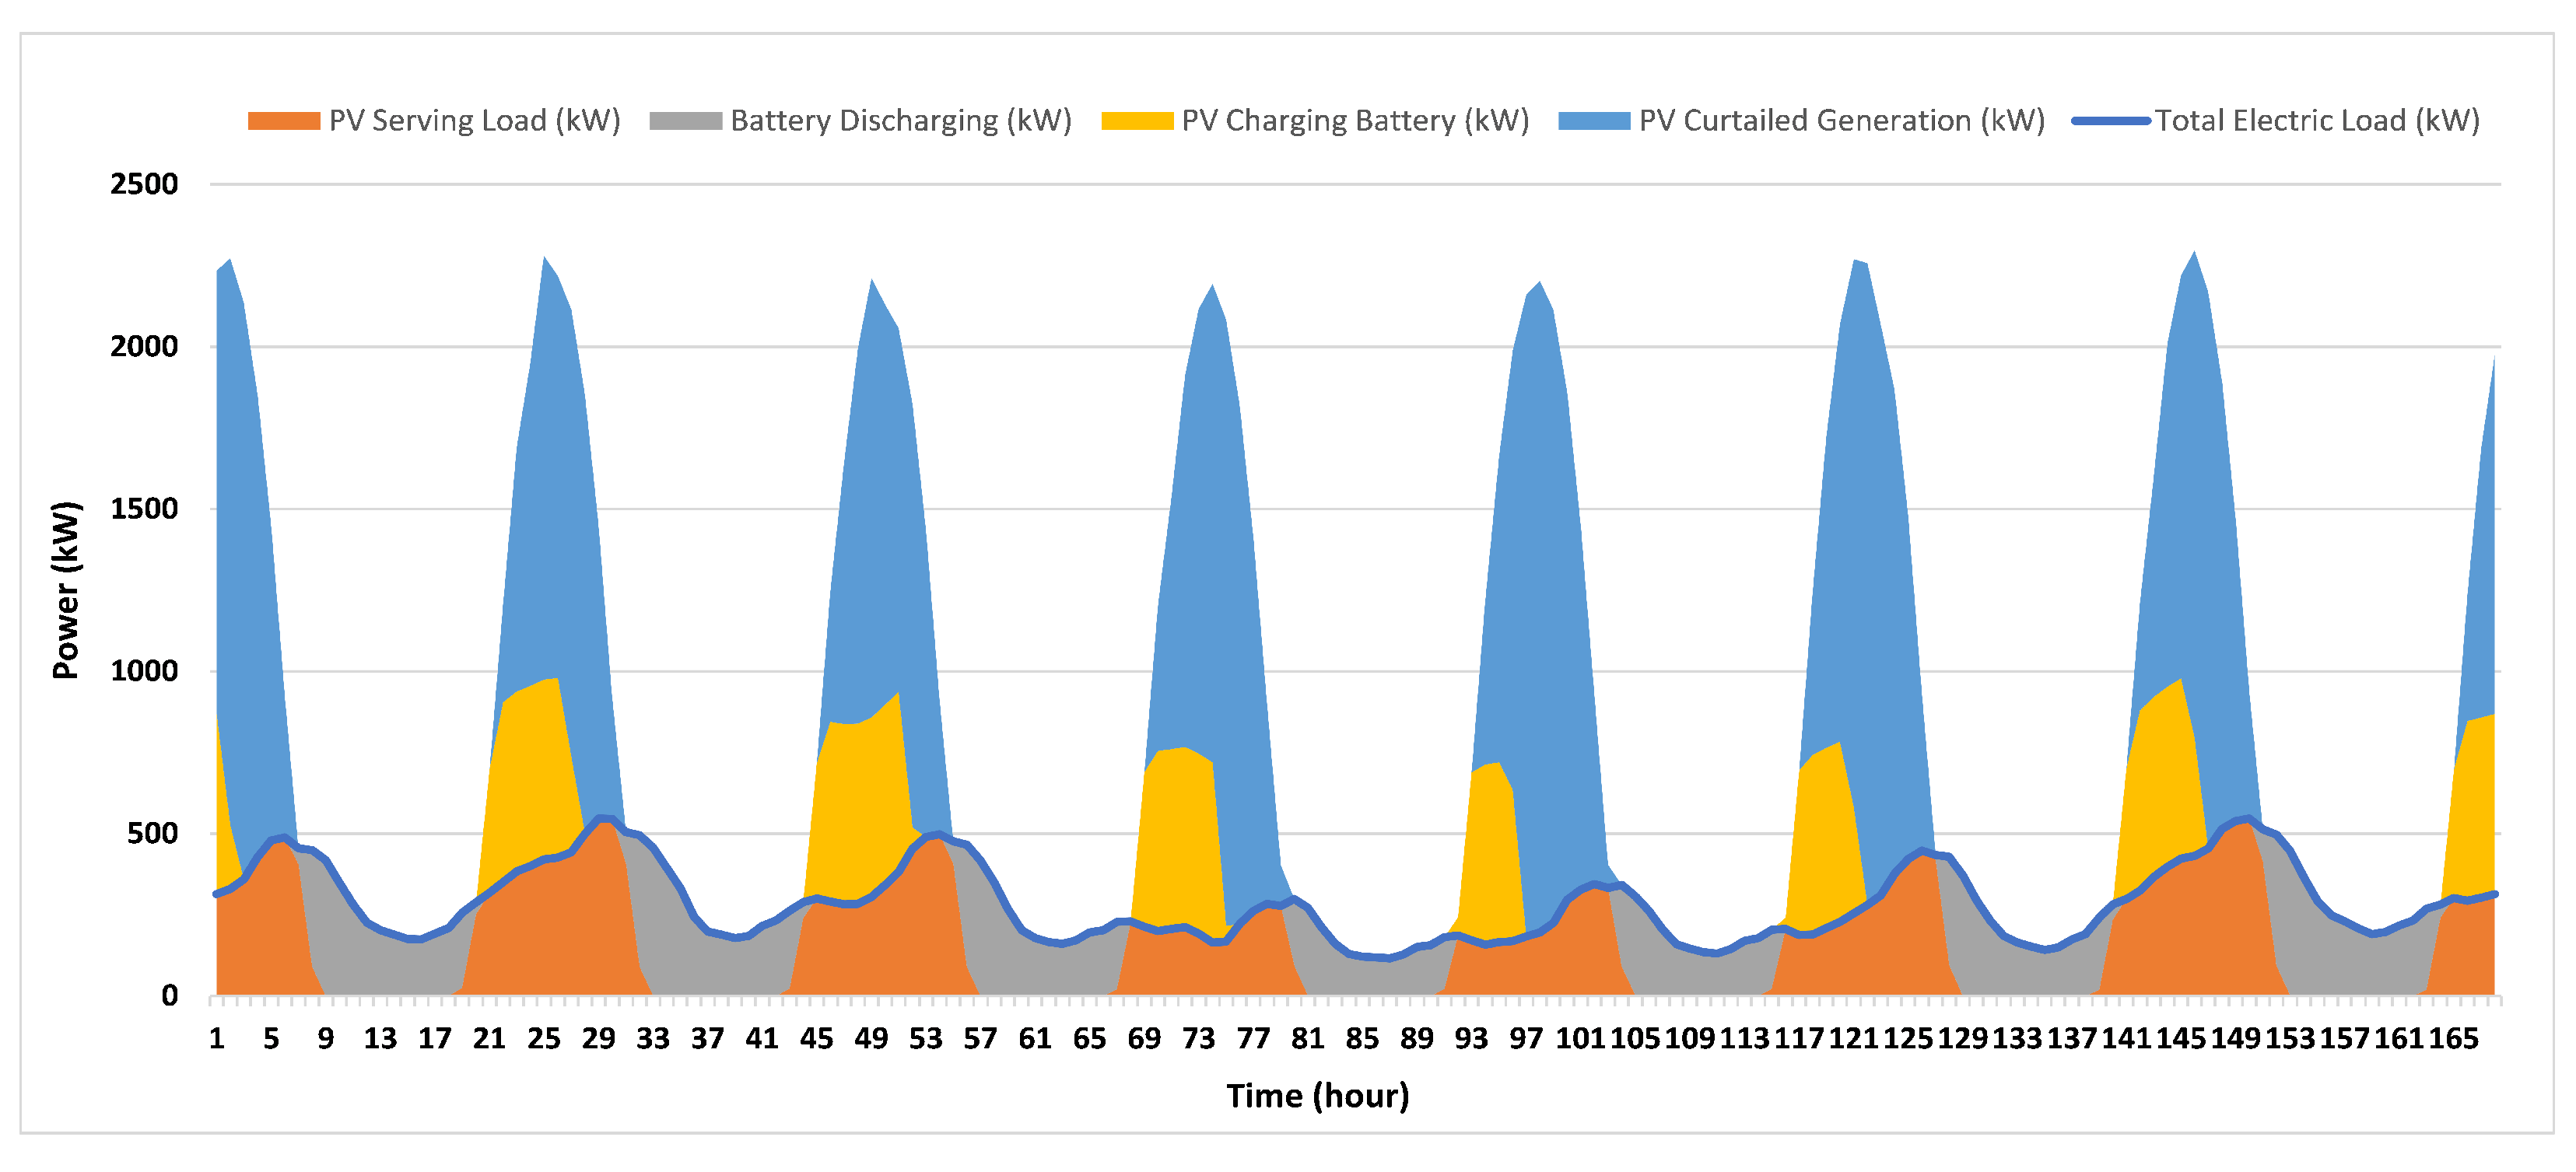
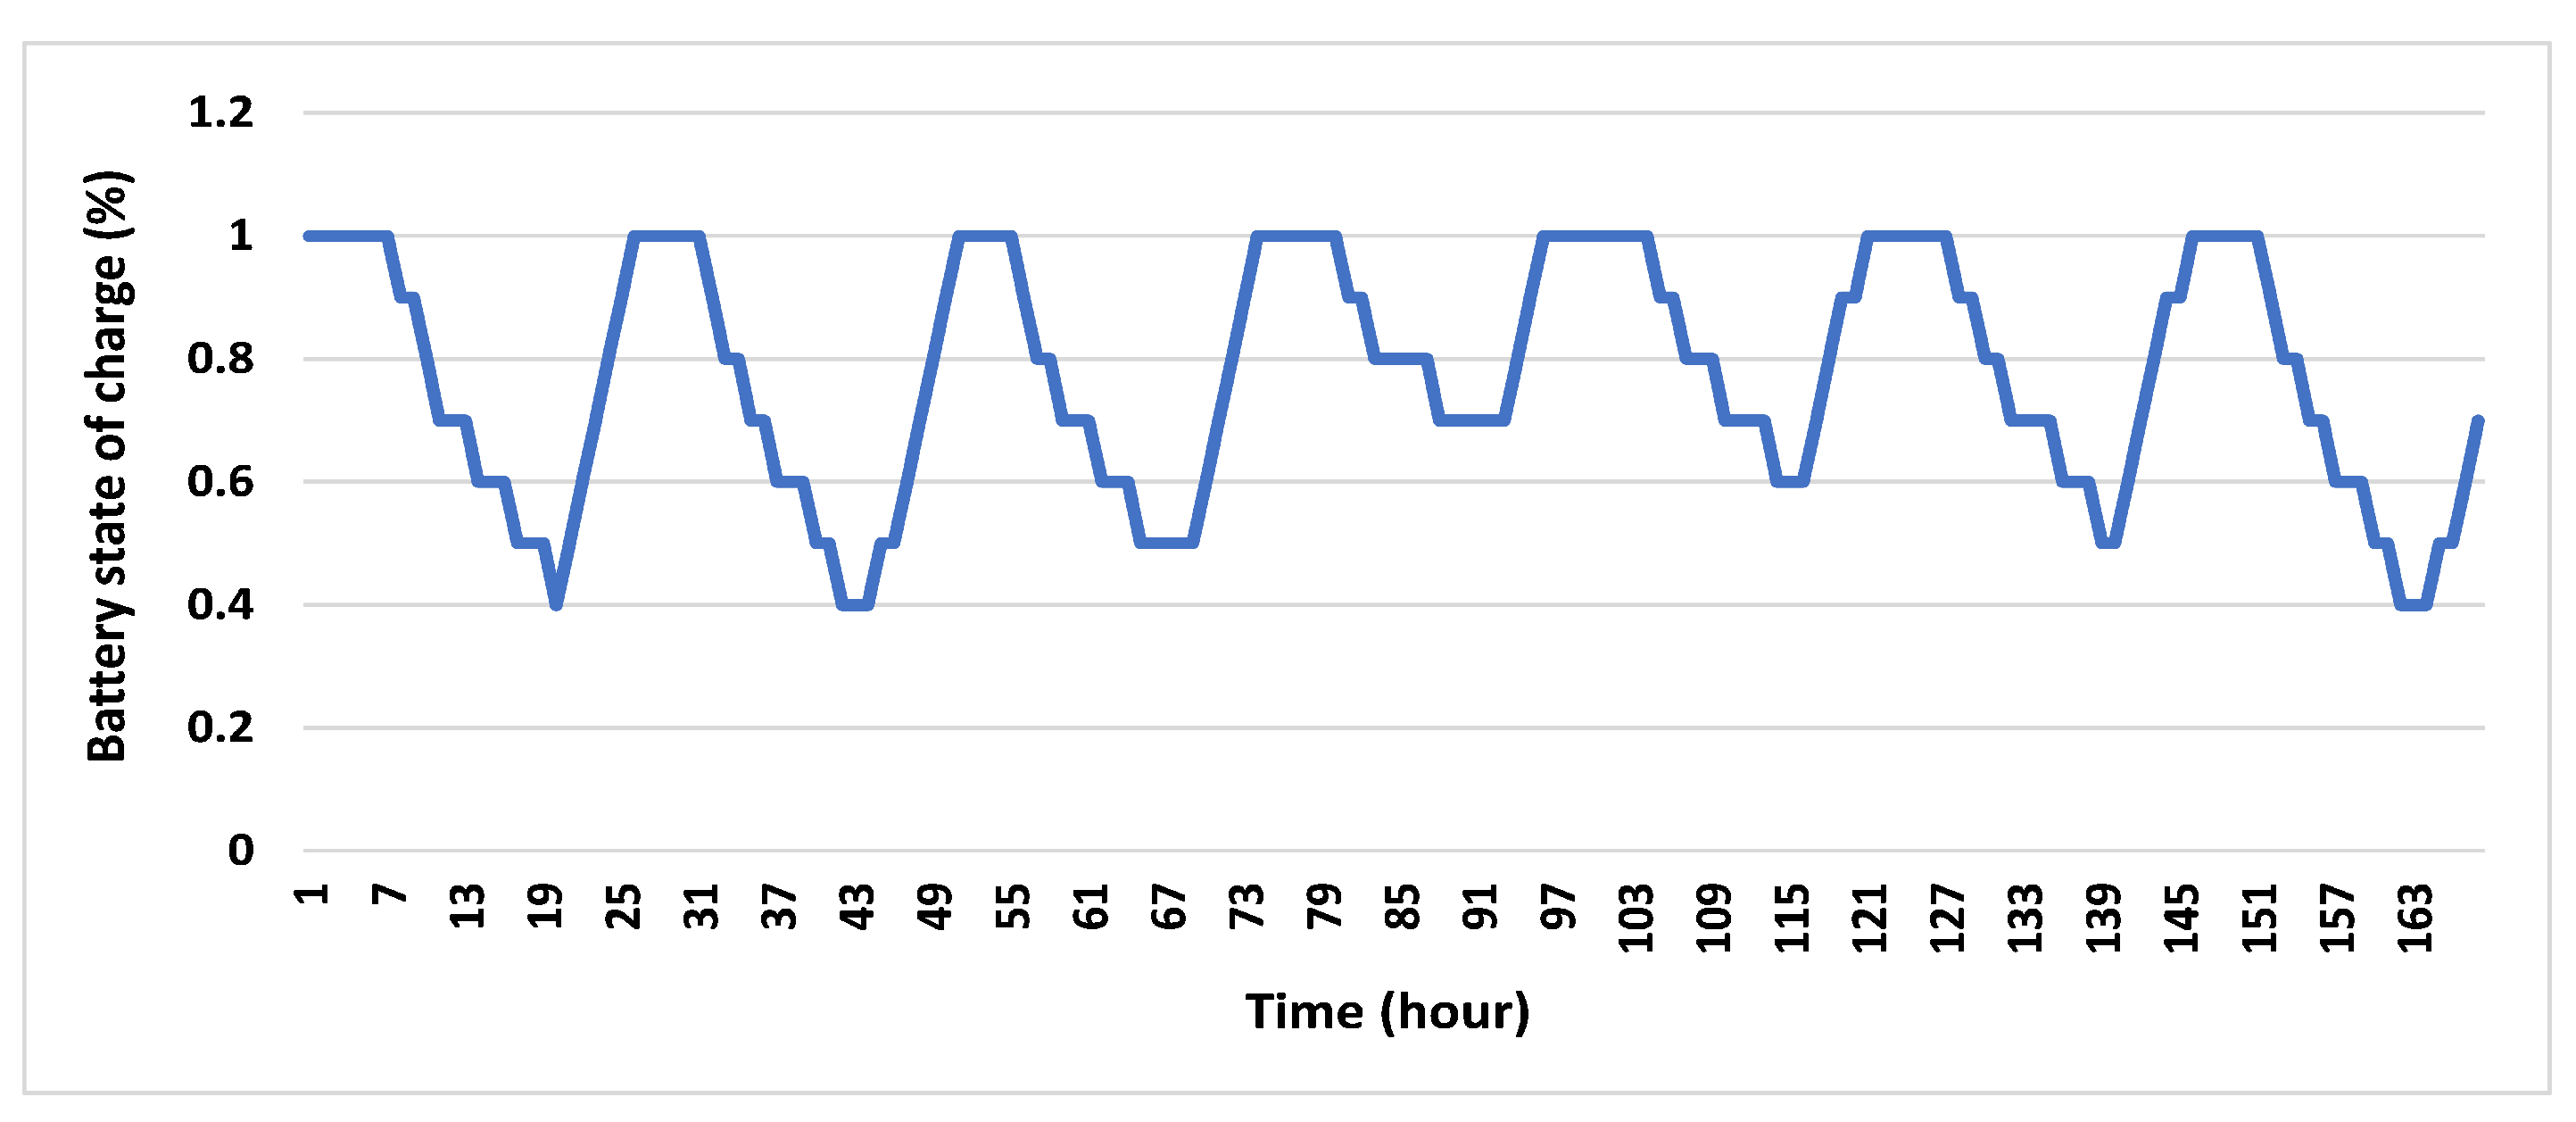
5.1. Case 1
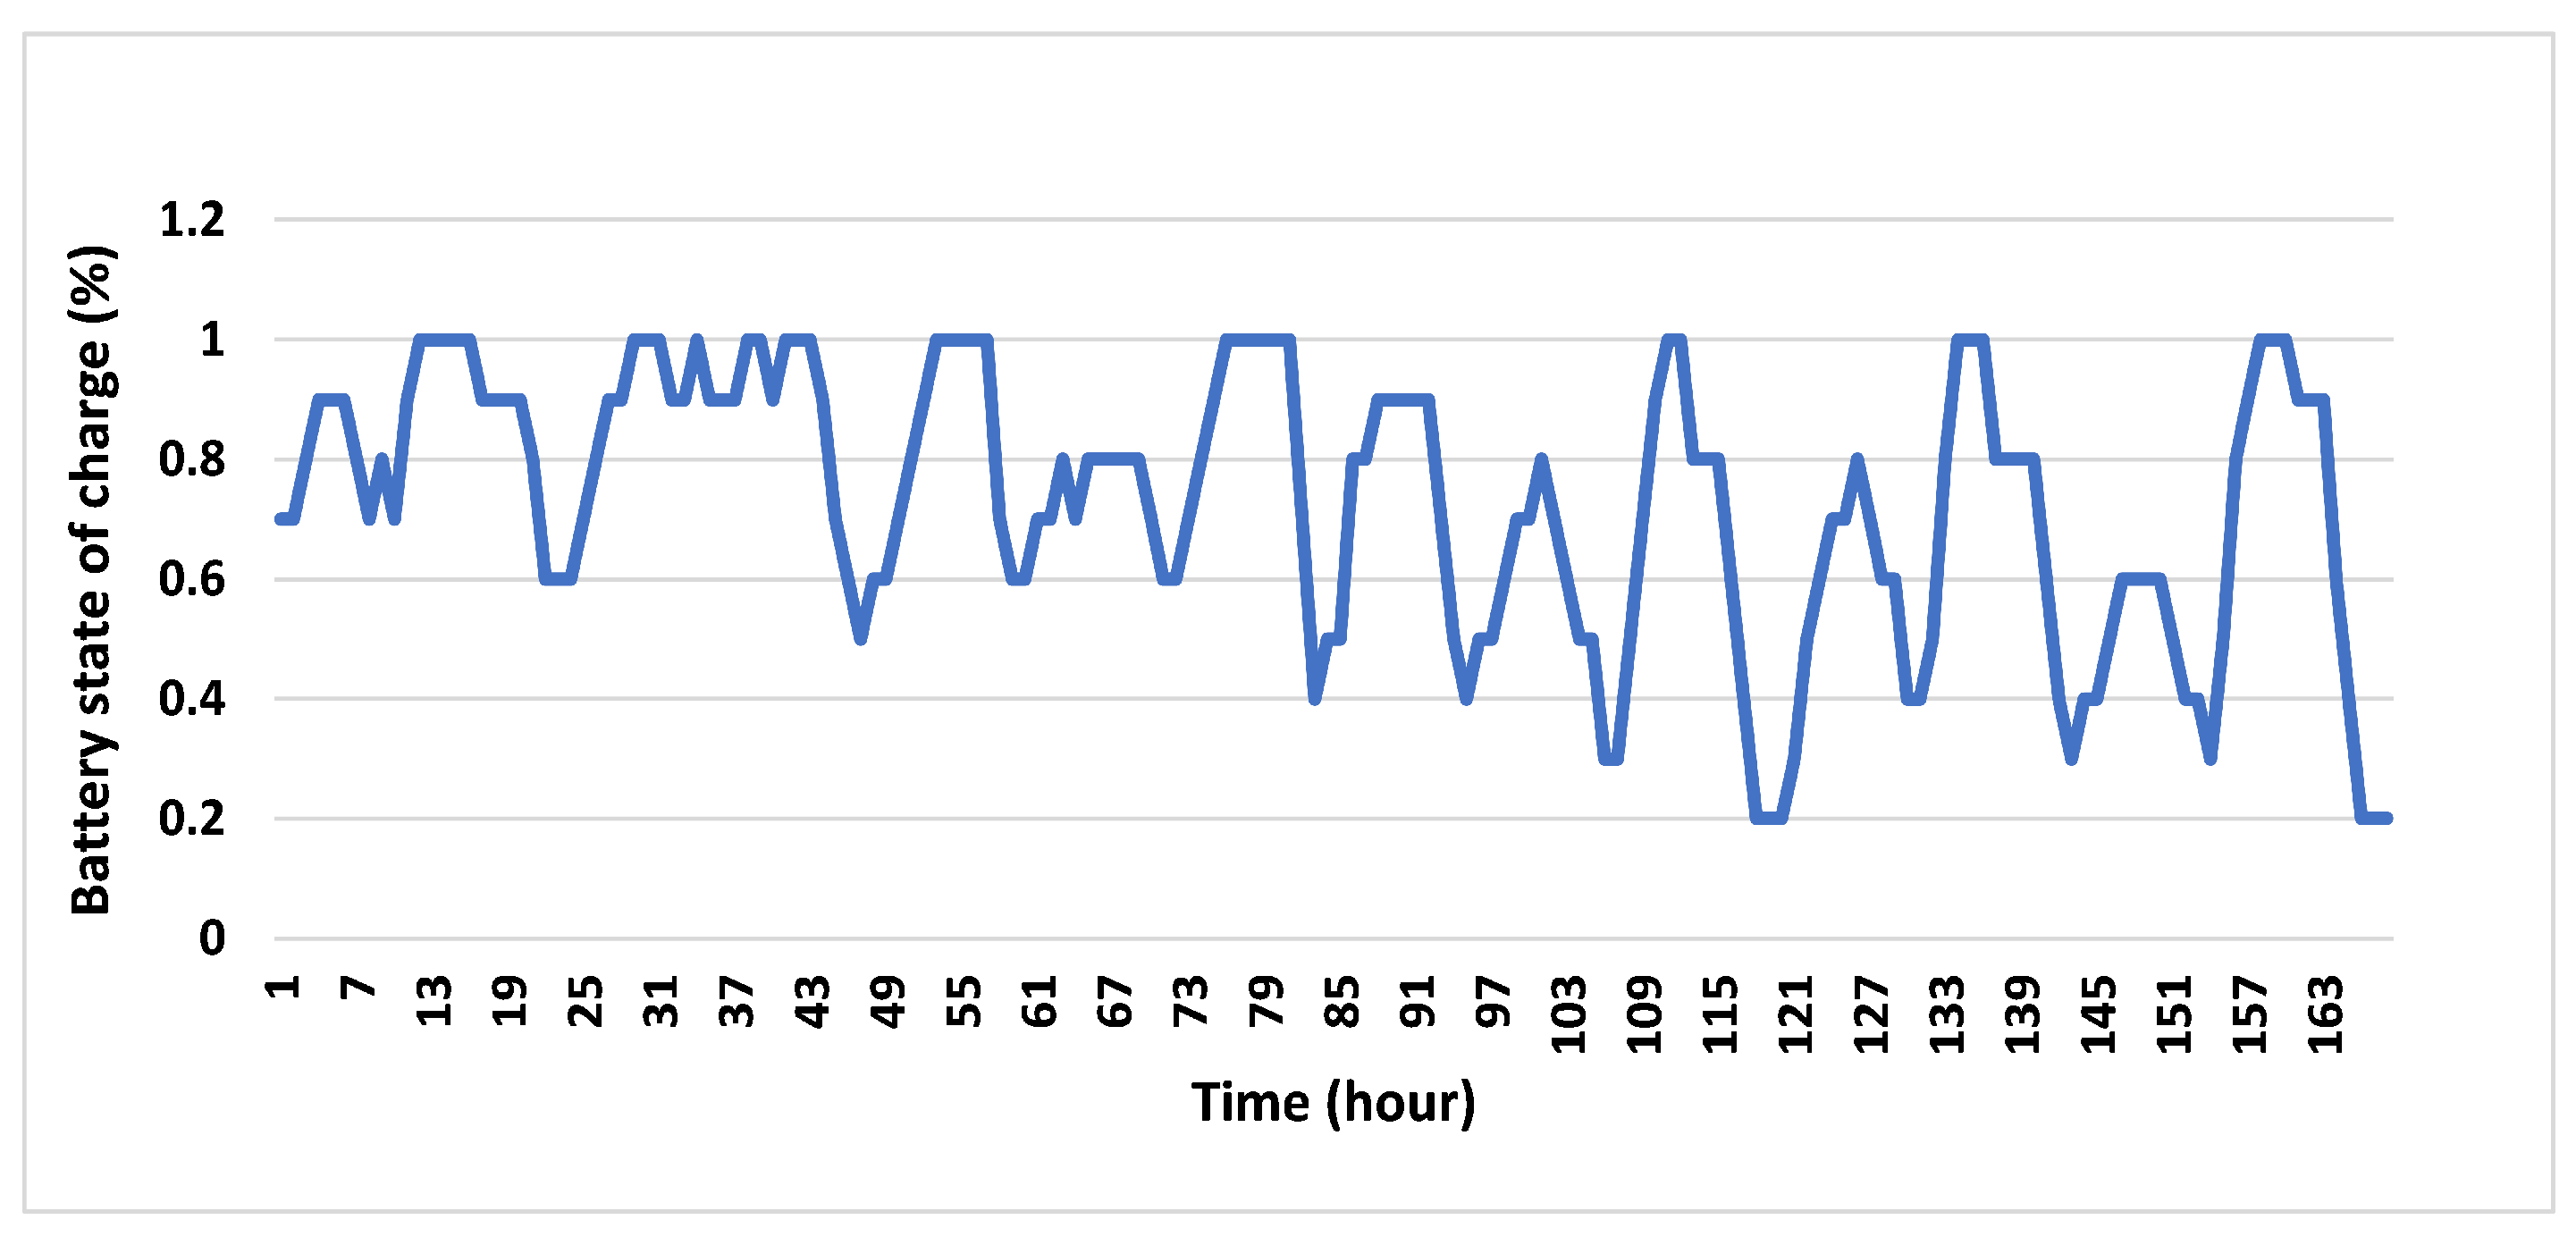
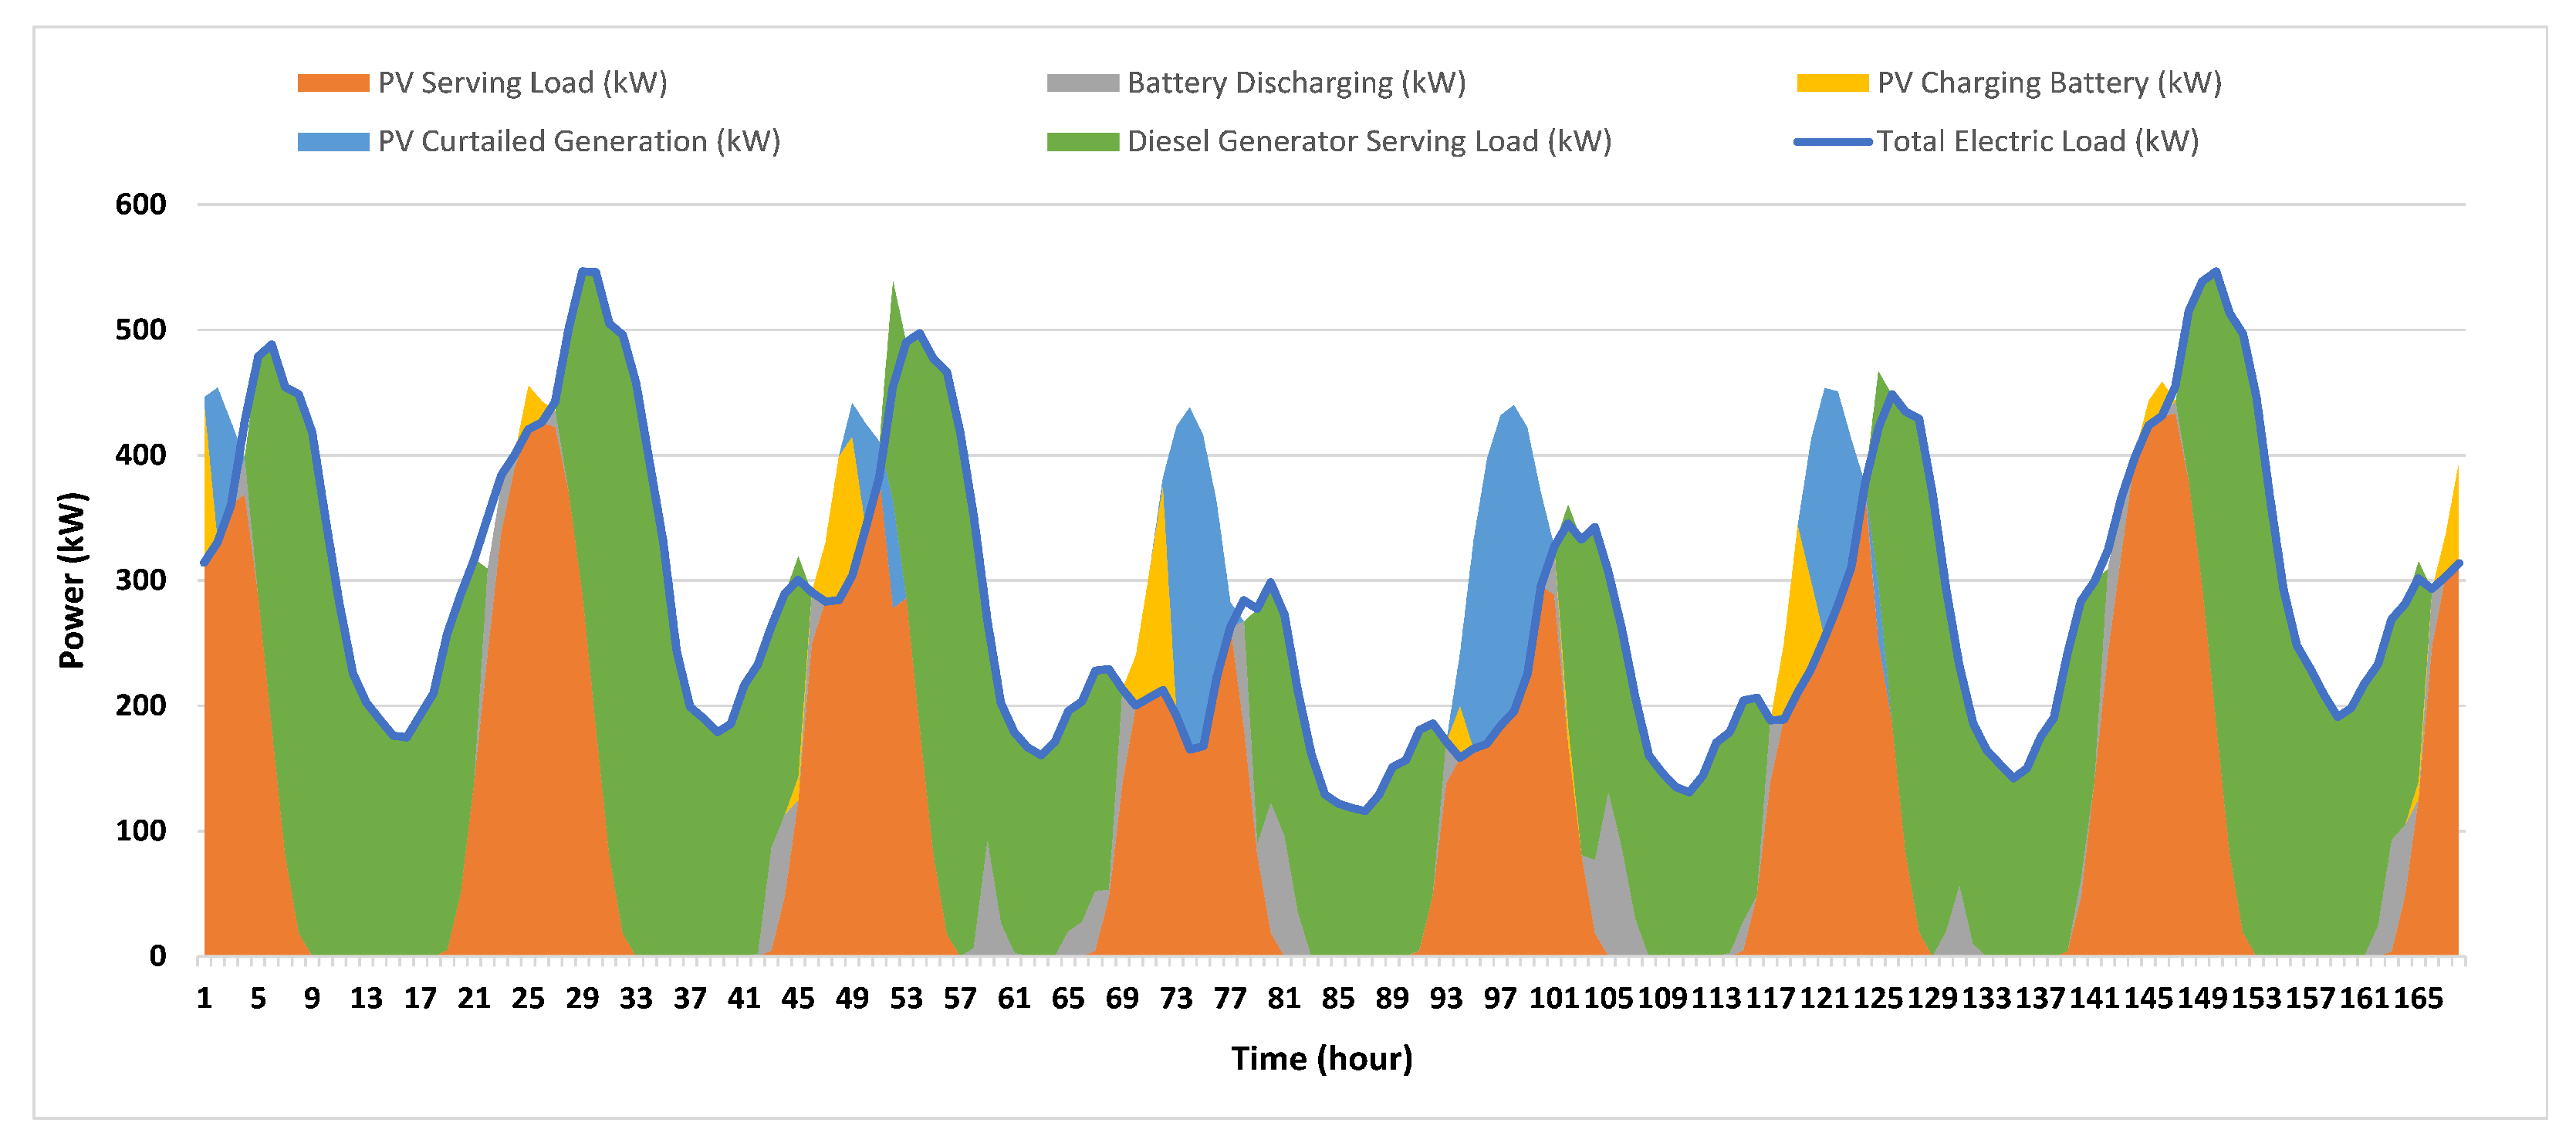
5.2. Case 2
5.3. Case 3
5.3.1. Scenario 1 (with Power Outage)
5.3.2. Scenario 2 (without Power Outage)
5.4. Economic Results Analysis and Discussion
6. Conclusions
Author Contributions
Funding
Conflicts of Interest
Nomenclature
| PV | Photovoltaic |
| BESS | Battery energy storage system |
| DG | Diesel generator |
| LCC | Life cycle cost |
| MILP | Mixed integer linear programming |
| WT | Wind turbine |
| WECS | Wind energy conversion system |
| HRES | Hybrid renewable energy system |
| HOMER | Hybrid optimization of multiple energy resources |
| GA | Genetic algorithm |
| TAC | Total annual cost |
| GOA | Grasshopper optimization algorithm |
| PSO | Particle swarm optimization |
| CS | Cuckoo search |
| DPSP | Deficiency of power supply probability |
| COE | Cost of energy |
| ABSO | Artificial bee swarm optimization |
| TS | Tabu search |
| SA | Simulated annealing |
| IPSO | Improved particle swarm optimization |
| IHS | Improved harmony search |
| IHSBSA | Improved-harmony-search-based simulated annealing |
| LPSP | Maximum loss of power supply probability |
| WOA | Whale optimization algorithm |
| WCA | Water cycle algorithm |
| MFO | Moth-flame optimizer |
| PSOGSA | Hybrid particle swarm-gravitational search algorithm |
| LPSP | Loss of power supply probability |
| NPC | Net present cost |
| NSGA | Non-dominated sorting genetic algorithm |
| RESs | Renewable energy sources |
| N | North |
| E | East |
| I | Supplied current to the load |
| PV cell current | |
| Reverse saturation current | |
| V | Voltage across the diode |
| Ideality factor | |
| Thermal voltage | |
| R | Resistor connected in series |
| R | Resistor connected in parallel |
| Light generated current | |
| Short circuit current temperature coefficient of the cell | |
| Temperature difference between the actual and nominal | |
| G | Solar irradiation |
| Nominal solar irradiation | |
| Nominal saturation current | |
| Temperature at standard test condition | |
| T | Actual temperature |
| q | Charge of electrons |
| Energy band gap of semiconductor | |
| Number of cells in series | |
| Number of cells in parallel | |
| PV panel rated power | |
| r | Solar irradiation factor |
| Solar irradiation in standard environmental condition | |
| Certain radiation point set | |
| Battery capacity | |
| Days of autonomy | |
| Load demand at time t | |
| Inverter efficiency | |
| Battery efficiency | |
| Battery depth of discharge | |
| State of charge at time t | |
| Minimum state of charge | |
| Maximum state of charge | |
| Hourly self-discharging rate | |
| Total energy generated at hour t | |
| Energy demand at hour t | |
| Charging efficiency | |
| Discharging efficiency | |
| Rectifier efficiency | |
| Inverter efficiency | |
| or | Diesel generator rated power |
| Diesel generator output power at time t | |
| Fuel consumption hourly cost | |
| Fuel price | |
| DG performance | |
| Fuel consumption heating value | |
| Power supplied by the grid at time t | |
| PV output power at time t | |
| BESS output power at time t | |
| Initial investment cost | |
| Operating and maintenance cost | |
| Replacement cost | |
| Salvage cost | |
| O & M | Operating and maintenance |
| f | Inflation rate |
| i | Interest rate |
| n | Project lifespan |
| b | Number of components to be purchased related to the project |
References
- Lloyd, P.J. The role of energy in development. J. Energy S. Afr. 2017, 28, 54–62. [Google Scholar] [CrossRef] [Green Version]
- Olatomiwa, L.; Mekhilef, S.; Ismail, M.S.; Moghavvemi, M. Energy management strategies in hybrid renewable energy systems: A review. Renew. Sustain. Energy Rev. 2016, 62, 821–835. [Google Scholar] [CrossRef]
- Nguyen, K.H.; Kakinaka, M. Renewable energy consumption, carbon emissions, and development stages: Some evidence from panel cointegration analysis. Renew. Energy 2019, 132, 1049–1057. [Google Scholar] [CrossRef]
- Ghorbani, B.; Mehrpooya, M.; Mousavi, S.A. Hybrid molten carbonate fuel cell power plant and multiple-effect desalination system. J. Clean. Prod. 2019, 220, 1039–1051. [Google Scholar] [CrossRef]
- Hosseinalizadeh, R.; Shakouri, H.; Amalnick, M.S.; Taghipour, P. Economic sizing of a hybrid (PV–WT–FC) renewable energy system (HRES) for stand-alone usages by an optimization-simulation model: Case study of Iran. Renew. Sustain. Energy Rev. 2016, 54, 139–150. [Google Scholar] [CrossRef] [Green Version]
- Zia, M.F.; Elbouchikhi, E.; Benbouzid, M. Microgrids energy management systems: A critical review on methods, solutions, and prospects. Appl. Energy 2018, 222, 1033–1055. [Google Scholar] [CrossRef]
- Kumar, K.P.; Saravanan, B. Recent techniques to model uncertainties in power generation from renewable energy sources and loads in microgrids—A review. Renew. Sustain. Energy Rev. 2017, 71, 348–358. [Google Scholar] [CrossRef]
- Elkadeem, M.; Wang, S.; Azmy, A.M.; Atiya, E.G.; Ullah, Z.; Sharshir, S.W. A systematic decision-making approach for planning and assessment of hybrid renewable energy-based microgrid with techno-economic optimization: A case study on an urban community in Egypt. Sustain. Cities Soc. 2020, 54, 102013. [Google Scholar] [CrossRef]
- United Nations. Climate Action. Available online: https://www.un.org/en/climatechange/raising-ambition/renewable-energy (accessed on 28 June 2022).
- Gao, K.; Wang, T.; Han, C.; Xie, J.; Ma, Y.; Peng, R. A review of optimization of microgrid operation. Energies 2021, 14, 2842. [Google Scholar] [CrossRef]
- Elkholy, M.; Metwally, H.; Farahat, M.; Senjyu, T.; Lotfy, M.E. Smart centralized energy management system for autonomous microgrid using FPGA. Appl. Energy 2022, 317, 119164. [Google Scholar] [CrossRef]
- Masrur, H.; Islam, M.R.; Muttaqi, K.M.; Gamil, M.M.; Huang, Y.; Senjyu, T. Resilience-aware optimal design and energy management scheme of multi-energy microgrids. In Proceedings of the 2021 IEEE Industry Applications Society Annual Meeting (IAS), Vancouver, BC, Canada, 10–14 October 2021; pp. 1–5. [Google Scholar]
- Lian, J.; Zhang, Y.; Ma, C.; Yang, Y.; Chaima, E. A review on recent sizing methodologies of hybrid renewable energy systems. Energy Convers. Manag. 2019, 199, 112027. [Google Scholar] [CrossRef]
- Dong, M.; Li, Y.; Song, D.; Yang, J.; Su, M.; Deng, X.; Huang, L.; Elkholy, M.; Joo, Y.H. Uncertainty and global sensitivity analysis of levelized cost of energy in wind power generation. Energy Convers. Manag. 2021, 229, 113781. [Google Scholar] [CrossRef]
- Talaat, M.; Farahat, M.; Elkholy, M. Renewable power integration: Experimental and simulation study to investigate the ability of integrating wave, solar and wind energies. Energy 2019, 170, 668–682. [Google Scholar] [CrossRef]
- Talaat, M.; Elkholy, M.; Farahat, M. Operating reserve investigation for the integration of wave, solar and wind energies. Energy 2020, 197, 117207. [Google Scholar] [CrossRef]
- Talaat, M.; Elgarhy, A.; Elkholy, M.; Farahat, M. Integration of fuel cells into an off-grid hybrid system using wave and solar energy. Int. J. Electr. Power Energy Syst. 2021, 130, 106939. [Google Scholar] [CrossRef]
- Alblawi, A.; Elkholy, M.; Talaat, M. ANN for assessment of energy consumption of 4 kW PV modules over a year considering the impacts of temperature and irradiance. Sustainability 2019, 11, 6802. [Google Scholar] [CrossRef] [Green Version]
- Alblawi, A.; Said, T.; Talaat, M.; Elkholy, M. PV solar power forecasting based on hybrid MFFNN-ALO. In Proceedings of the 2022 13th International Conference on Electrical Engineering (ICEENG), Cairo, Egypt, 29–31 March 2022; pp. 52–56. [Google Scholar]
- Talaat, M.; Elkholy, M.; Alblawi, A.; Said, T. Artificial intelligence applications for microgrids integration and management of hybrid renewable energy sources. Artif. Intell. Rev. 2023, 1–55. [Google Scholar] [CrossRef]
- Chambon, C.L.; Karia, T.; Sandwell, P.; Hallett, J.P. Techno-economic assessment of biomass gasification-based mini-grids for productive energy applications: The case of rural India. Renew. Energy 2020, 154, 432–444. [Google Scholar] [CrossRef]
- Priyadharshini, B.; Ganapathy, V.; Sudhakara, P. An optimal model to meet the hourly peak demands of a specific region with solar, wind, and grid supplies. IEEE Access 2020, 8, 13179–13194. [Google Scholar] [CrossRef]
- Gebrehiwot, K.; Mondal, M.A.H.; Ringler, C.; Gebremeskel, A.G. Optimization and cost-benefit assessment of hybrid power systems for off-grid rural electrification in Ethiopia. Energy 2019, 177, 234–246. [Google Scholar] [CrossRef]
- Alturki, F.A.; Awwad, E.M. Sizing and cost minimization of standalone hybrid wt/pv/biomass/pump-hydro storage-based energy systems. Energies 2021, 14, 489. [Google Scholar] [CrossRef]
- Veilleux, G.; Potisat, T.; Pezim, D.; Ribback, C.; Ling, J.; Krysztofiński, A.; Ahmed, A.; Papenheim, J.; Pineda, A.M.; Sembian, S.; et al. Techno-economic analysis of microgrid projects for rural electrification: A systematic approach to the redesign of Koh Jik off-grid case study. Energy Sustain. Dev. 2020, 54, 1–13. [Google Scholar] [CrossRef]
- Odou, O.D.T.; Bhandari, R.; Adamou, R. Hybrid off-grid renewable power system for sustainable rural electrification in Benin. Renew. Energy 2020, 145, 1266–1279. [Google Scholar] [CrossRef]
- Rullo, P.; Braccia, L.; Luppi, P.; Zumoffen, D.; Feroldi, D. Integration of sizing and energy management based on economic predictive control for standalone hybrid renewable energy systems. Renew. Energy 2019, 140, 436–451. [Google Scholar] [CrossRef]
- Talaat, M.; Alblawi, A.; Tayseer, M.; Elkholy, M. FPGA control system technology for integrating the PV/wave/FC hybrid system using ANN optimized by MFO techniques. Sustain. Cities Soc. 2022, 80, 103825. [Google Scholar] [CrossRef]
- Zhao, J.; Yuan, X. Multi-objective optimization of stand-alone hybrid PV-wind-diesel-battery system using improved fruit fly optimization algorithm. Soft Comput. 2016, 20, 2841–2853. [Google Scholar] [CrossRef]
- Ma, T.; Yang, H.; Lu, L. A feasibility study of a stand-alone hybrid solar–wind–battery system for a remote island. Appl. Energy 2014, 121, 149–158. [Google Scholar] [CrossRef]
- Belmili, H.; Haddadi, M.; Bacha, S.; Almi, M.F.; Bendib, B. Sizing stand-alone photovoltaic–wind hybrid system: Techno-economic analysis and optimization. Renew. Sustain. Energy Rev. 2014, 30, 821–832. [Google Scholar] [CrossRef]
- Rehman, S.; Alam, M.M.; Meyer, J.P.; Al-Hadhrami, L.M. Feasibility study of a wind–pv–diesel hybrid power system for a village. Renew. Energy 2012, 38, 258–268. [Google Scholar] [CrossRef] [Green Version]
- Rezzouk, H.; Mellit, A. Feasibility study and sensitivity analysis of a stand-alone photovoltaic–diesel–battery hybrid energy system in the north of Algeria. Renew. Sustain. Energy Rev. 2015, 43, 1134–1150. [Google Scholar] [CrossRef]
- Rashid, F.; Hoque, M.E.; Aziz, M.; Sakib, T.N.; Islam, M.T.; Robin, R.M. Investigation of optimal hybrid energy systems using available energy sources in a rural area of Bangladesh. Energies 2021, 14, 5794. [Google Scholar] [CrossRef]
- Hossain, M.S.; Jahid, A.; Islam, K.Z.; Rahman, M.F. Solar PV and biomass resources-based sustainable energy supply for off-grid cellular base stations. IEEE Access 2020, 8, 53817–53840. [Google Scholar] [CrossRef]
- Bukar, A.L.; Tan, C.W.; Lau, K.Y. Optimal sizing of an autonomous photovoltaic/wind/battery/diesel generator microgrid using grasshopper optimization algorithm. Sol. Energy 2019, 188, 685–696. [Google Scholar] [CrossRef]
- Maleki, A.; Pourfayaz, F. Optimal sizing of autonomous hybrid photovoltaic/wind/battery power system with LPSP technology by using evolutionary algorithms. Sol. Energy 2015, 115, 471–483. [Google Scholar] [CrossRef]
- Zhao, B.; Zhang, X.; Li, P.; Wang, K.; Xue, M.; Wang, C. Optimal sizing, operating strategy and operational experience of a stand-alone microgrid on Dongfushan Island. Appl. Energy 2014, 113, 1656–1666. [Google Scholar] [CrossRef]
- Diab, A.A.Z.; Sultan, H.M.; Mohamed, I.S.; Kuznetsov, O.N.; Do, T.D. Application of different optimization algorithms for optimal sizing of PV/wind/diesel/battery storage stand-alone hybrid microgrid. IEEE Access 2019, 7, 119223–119245. [Google Scholar] [CrossRef]
- Islam, M.R.; Akter, H.; Howlader, H.O.R.; Senjyu, T. Optimal Sizing and Techno-Economic Analysis of Grid-Independent Hybrid Energy System for Sustained Rural Electrification in Developing Countries: A Case Study in Bangladesh. Energies 2022, 15, 6381. [Google Scholar] [CrossRef]
- Ali, F.; Ahmar, M.; Jiang, Y.; AlAhmad, M. A techno-economic assessment of hybrid energy systems in rural Pakistan. Energy 2021, 215, 119103. [Google Scholar] [CrossRef]
- Thirunavukkarasu, M.; Sawle, Y.; Lala, H. A comprehensive review on optimization of hybrid renewable energy systems using various optimization techniques. Renew. Sustain. Energy Rev. 2023, 176, 113192. [Google Scholar] [CrossRef]
- Amupolo, A.; Nambundunga, S.; Chowdhury, D.S.; Grün, G. Techno-economic feasibility of off-grid renewable energy electrification schemes: A case study of an informal settlement in Namibia. Energies 2022, 15, 4235. [Google Scholar] [CrossRef]
- Khan, F.A.; Pal, N.; Saeed, S.H.; Yadav, A. Techno-economic and feasibility assessment of standalone solar Photovoltaic/Wind hybrid energy system for various storage techniques and different rural locations in India. Energy Convers. Manag. 2022, 270, 116217. [Google Scholar] [CrossRef]
- Elkholy, M.; Elymany, M.; Metwally, H.; Farahat, M.; Senjyu, T.; Lotfy, M.E. Design and implementation of a Real-time energy management system for an isolated Microgrid: Experimental validation. Appl. Energy 2022, 327, 120105. [Google Scholar] [CrossRef]
- Elkholy, M.; Metwally, H.; Farahat, M.; Nasser, M.; Senjyu, T.; Lotfy, M.E. Dynamic centralized control and intelligent load management system of a remote residential building with V2H technology. J. Energy Storage 2022, 52, 104839. [Google Scholar] [CrossRef]
- Elkholy, M.; Elymany, M.; Yona, A.; Senjyu, T.; Takahashi, H.; Lotfy, M.E. Experimental validation of an AI-embedded FPGA-based Real-Time smart energy management system using Multi-Objective Reptile search algorithm and gorilla troops optimizer. Energy Convers. Manag. 2023, 282, 116860. [Google Scholar] [CrossRef]
- Onoufriou, G.; Bickerton, R.; Pearson, S.; Leontidis, G. Nemesyst: A hybrid parallelism deep learning-based framework applied for internet of things enabled food retailing refrigeration systems. Comput. Ind. 2019, 113, 103133. [Google Scholar] [CrossRef] [Green Version]
- Tong, Z.; Zhou, Y.; Xu, K. An intelligent scheduling control method for smart grid based on deep learning. Math. Biosci. Eng. 2023, 20, 7679–7695. [Google Scholar] [CrossRef]
- Elsonbaty, N.A.; Enany, M.A.; Gamil, M.M. Modelling of a directly coupled PV water pumping system using soft computing techniques. In Proceedings of the Michael Faraday IET International Summit 2015, Kolkata, India, 12–13 September 2015. [Google Scholar]
- Fathy, A.; Kaaniche, K.; Alanazi, T.M. Recent approach based social spider optimizer for optimal sizing of hybrid PV/wind/battery/diesel integrated microgrid in Aljouf region. IEEE Access 2020, 8, 57630–57645. [Google Scholar] [CrossRef]
- Yahiaoui, A.; Benmansour, K.; Tadjine, M. Control, analysis and optimization of hybrid PV-Diesel-Battery systems for isolated rural city in Algeria. Sol. Energy 2016, 137, 1–10. [Google Scholar] [CrossRef]
- Ramli, M.A.; Hiendro, A.; Twaha, S. Economic analysis of PV/diesel hybrid system with flywheel energy storage. Renew. Energy 2015, 78, 398–405. [Google Scholar] [CrossRef]
- Sari, A.; Majdi, A.; Opulencia, M.J.C.; Timoshin, A.; Huy, D.T.N.; Trung, N.D.; Alsaikhan, F.; Hammid, A.T.; Akhmedov, A. New optimized configuration for a hybrid PV/diesel/battery system based on coyote optimization algorithm: A case study for Hotan county. Energy Rep. 2022, 8, 15480–15492. [Google Scholar] [CrossRef]
- Abbes, D.; Martinez, A.; Champenois, G. Life cycle cost, embodied energy and loss of power supply probability for the optimal design of hybrid power systems. Math. Comput. Simul. 2014, 98, 46–62. [Google Scholar] [CrossRef]
- Kazem, H.A.; Albadi, M.; Al-Waeli, A.H.; Al-Busaidi, A.H.; Chaichan, M.T. Techno-economic feasibility analysis of 1 MW photovoltaic grid connected system in Oman. Case Stud. Therm. Eng. 2017, 10, 131–141. [Google Scholar] [CrossRef]
- Kamjoo, A.; Maheri, A.; Dizqah, A.M.; Putrus, G.A. Multi-objective design under uncertainties of hybrid renewable energy system using NSGA-II and chance constrained programming. Int. J. Electr. Power Energy Syst. 2016, 74, 187–194. [Google Scholar] [CrossRef]
- TRADING ECONOMICS. Available online: https://fr.tradingeconomics.com/niger/inflation-cpi (accessed on 28 January 2023).
- TRADING ECONOMICS. Available online: https://tradingeconomics.com/niger/interest-rate (accessed on 28 January 2023).
- Kuendee, P.; Janjarassuk, U. A comparative study of mixed-integer linear programming and genetic algorithms for solving binary problems. In Proceedings of the 2018 5th International Conference on Industrial Engineering and Applications (ICIEA), Singapore, 26–28 April 2018; pp. 284–288. [Google Scholar]


| Component | Parameters | Value |
|---|---|---|
| System capital cost ($/kW-DC) | 500.00 | |
| PV | O&M cost ($/kW-DC per year) | 2.0 |
| Array type | Ground mount, fixed | |
| Federal percentage-based incentive (%) | 26 | |
| Energy capacity cost ($/kWh) | 200.00 | |
| Power capacity cost ($/kW) | 400.00 | |
| Energy capacity replacement cost ($/kWh) | 180.00 | |
| BESS | Inverter efficiency (%) | 96 |
| Inverter replacement year | 10 | |
| Battery replacement year | 10 | |
| Minimum state of charge (%) | 20 | |
| Power capacity replacement cost ($/kW) | 350.00 | |
| Install cost ($/kW AC) | 350.00 | |
| Fixed O&M cost ($/kW per year) | 5.00 | |
| Diesel generator | Diesel cost ($/gal) | 1.00 |
| Generator replacement year | 10 | |
| Generator fuel cost escalation rate, nominal (%) | 2.7 |
| Parameter | Case 1 | Case 2 | Case 3 | |
|---|---|---|---|---|
| Scenario 1 | Scenario 2 | |||
| Annual Site Load (kWh) | 1,739,590 | 1,739,590 | 1,739,590 | 1,739,590 |
| PV size (kW) | 3180 | 635 | 952 | 954 |
| Average Annual PV Energy Production (kWh) | 4,690,854 | 937,356 | 1,403,952 | 1,407,990 |
| Battery Bank Power (kW) | 554 | 163 | 140 | 141 |
| Battery Bank Capacity (kWh) | 5884 | 436 | 1045 | 1052 |
| Diesel Generator size (kW) | 0 | 1174 | 1174 | 0 |
| Total Life Cycle Cost ($) | 2,660,793 | 2,362,997 | 2,504,862 | 2,020,446 |
| Levelized Cost of Electricity ($/kWh) | 0.115 | 0.102 | 0.13 | 0.13 |
| Year 1 O&M costs ($) Before Tax | 6359 | 7140 | 7773 | 1909 |
| Annual Renewable Electricity (electricity consumption) (%) | 100 | 38 | 54 | 54 |
| Average Annual Energy Supplied from Grid (kWh) | 0 | 0 | 794,598 | 794,628 |
| Total Utility Electricity Cost ($) | 0 | 0 | 1,253,311 | 1,251,771 |
Disclaimer/Publisher’s Note: The statements, opinions and data contained in all publications are solely those of the individual author(s) and contributor(s) and not of MDPI and/or the editor(s). MDPI and/or the editor(s) disclaim responsibility for any injury to people or property resulting from any ideas, methods, instructions or products referred to in the content. |
© 2023 by the authors. Licensee MDPI, Basel, Switzerland. This article is an open access article distributed under the terms and conditions of the Creative Commons Attribution (CC BY) license (https://creativecommons.org/licenses/by/4.0/).
Share and Cite
Tahirou Halidou, I.; Or Rashid Howlader, H.; Gamil, M.M.; Elkholy, M.H.; Senjyu, T. Optimal Power Scheduling and Techno-Economic Analysis of a Residential Microgrid for a Remotely Located Area: A Case Study for the Sahara Desert of Niger. Energies 2023, 16, 3471. https://doi.org/10.3390/en16083471
Tahirou Halidou I, Or Rashid Howlader H, Gamil MM, Elkholy MH, Senjyu T. Optimal Power Scheduling and Techno-Economic Analysis of a Residential Microgrid for a Remotely Located Area: A Case Study for the Sahara Desert of Niger. Energies. 2023; 16(8):3471. https://doi.org/10.3390/en16083471
Chicago/Turabian StyleTahirou Halidou, Issoufou, Harun Or Rashid Howlader, Mahmoud M. Gamil, M. H. Elkholy, and Tomonobu Senjyu. 2023. "Optimal Power Scheduling and Techno-Economic Analysis of a Residential Microgrid for a Remotely Located Area: A Case Study for the Sahara Desert of Niger" Energies 16, no. 8: 3471. https://doi.org/10.3390/en16083471