1. Introduction
In Europe, industrial energy and roundwood harvesting from forests totaled over 700 million m
3. Most wood resources were harvested in the Russian Federation (231 million m
3), Sweden (81 million m
3), Germany (71 million m
3), and Finland (59 million m
3) [
1]. It seems that the need for wood resources will increase in the future because the global market of forest industry products will grow from EUR 540 billion in 2019 to EUR 715 billion in 2035 [
2]. Market growth is driven by changes in digitalization, online retail, population growth, urbanization, the growing middle class, environmental awareness, greenhouse gas emissions, renewable energy, and carbon neutrality targets.
Climate warming concerns the forest industry, both in the EU and globally. European Union (EU) produced approximately 2.6 billion tons of CO
2 emissions in 2020 [
3], while Finland produced 48 million tons of CO
2 eq. [
4]. To respond to this problem, the EU aims to reduce emissions by 80% from the level of 1990 by 2050, which will be achieved cost-efficiently in two stages reducing emissions, first 40% by 2030 and then 60% by 2040 [
5]. In addition, two additional targets have been set by the EU’s climate and energy framework for the implementation of regulations by 2030. Accordingly, energy efficiency should be improved by at least 27%, and the share of renewable energy sources should be increased by the same percentage [
6].
More than 25% of the total energy consumption in Finland has been produced with wood fuels [
7]. Fortunately, Finnish forests provide renewable wood resources which enable environmentally sustainable carbon-neutral forestry. Therefore, CO
2 emissions of wood procurement of the forest industry may be reduced by tens of percentages regarding generated energy and produced materials, compared to a 2010 baseline. The ultimate policy of the Finnish government is to meet its renewable energy targets by using forest fuels and products for environmentally friendly businesses and society [
8,
9]. In practice, new investments in carbon-neutral production processes may positively affect the demand and supply of renewable wood [
10,
11]. Furthermore, wood procurement in the forest industry may also increase the viability of carbon sinks, both in Finnish forests and globally [
12,
13,
14].
Although total wood sources are renewable, available amounts vary in local regions of Finland [
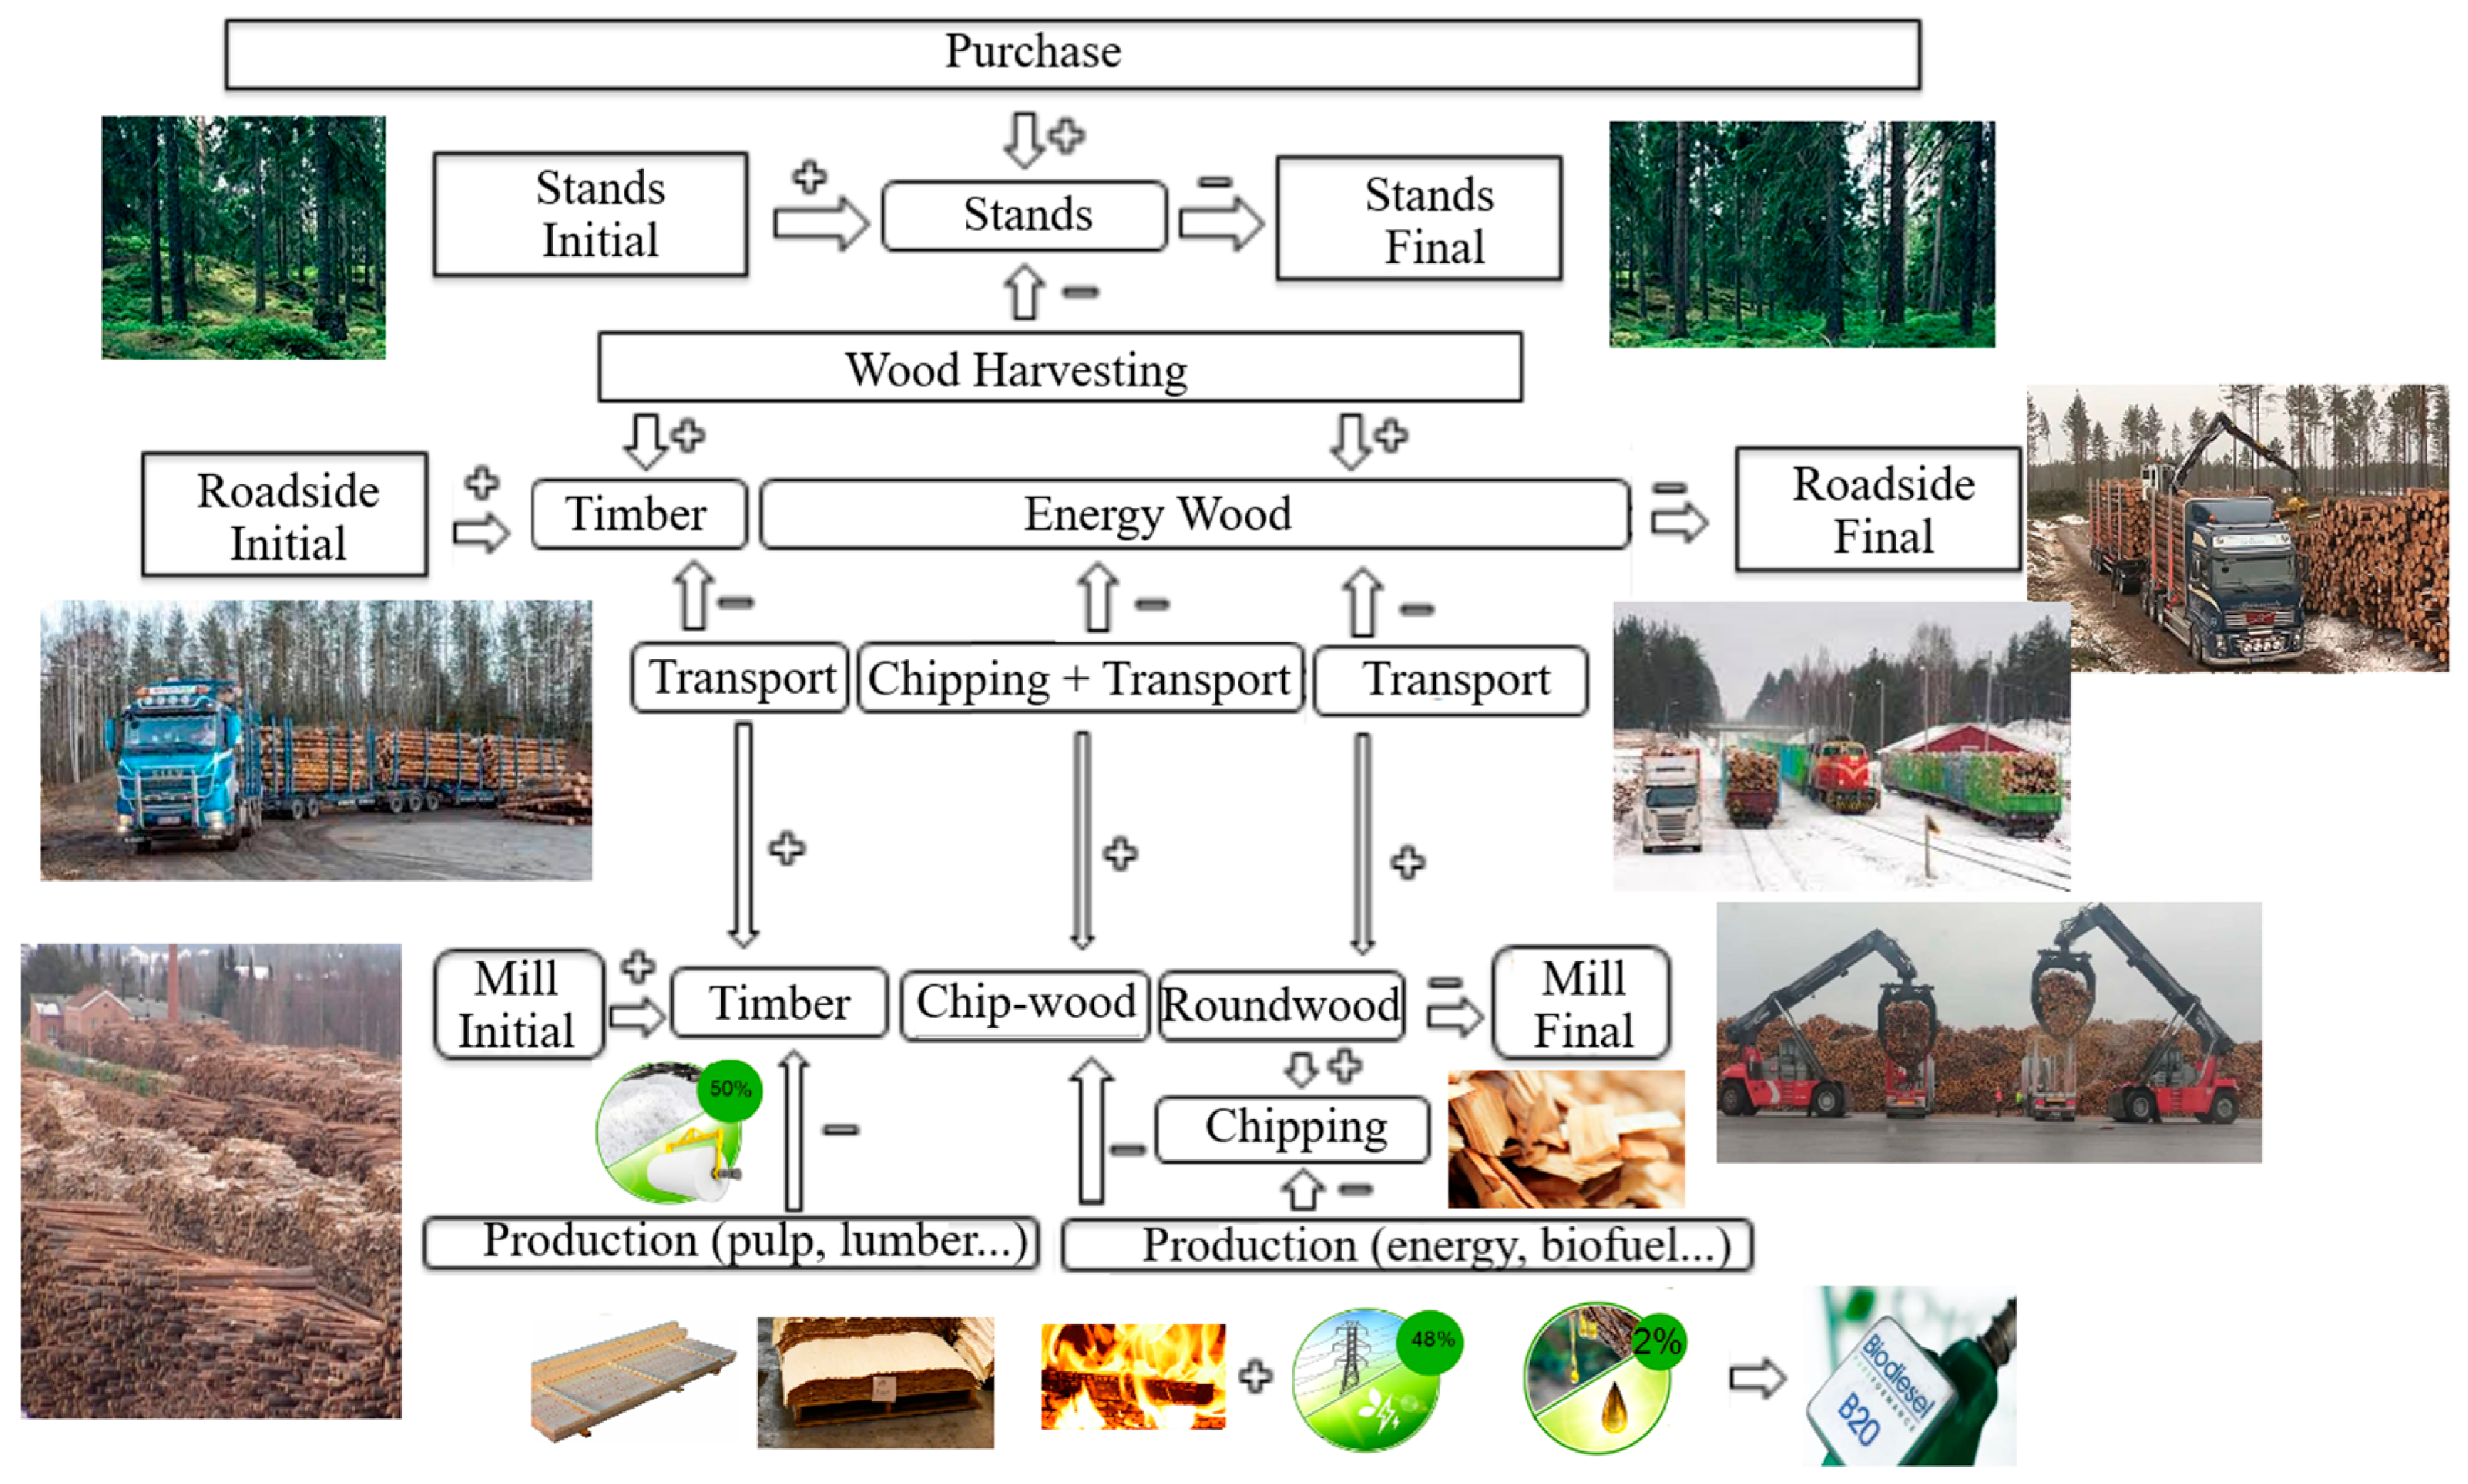
15]. Therefore, wood procurement management is focused on this issue in large procurement organizations and companies in forest industries. Management of the wood procurement chain (WPC) is important, particularly in the integrated energy and material industry (IEMI), where increasing use of renewable wood resources combines energy production with chemical production and mechanical production (
Figure 1). Actually, the WPC is described as forest stands, inventorying and storing, purchasing, wood harvesting, and transport. The first subprocess is mainly owned (70%) by private forest owners. Wood harvesting and transport have been outsourced to contractors as suppliers [
16].
Wood procurement is managed by strategic criteria. Traditionally, the WPCs should be profitable and socially acceptable. On the other hand, it is also necessary to satisfy environmentally and ecologically sustainable criteria [
17]. The criteria are used when the strategic management problem is formulated into the optimization model. However, the complexity of management situations of the IEMI makes existing decision support systems (DSSs) insufficient for solving wood procurement alternatives simultaneously with respect to all criteria [
14,
17,
18]. For example, fluctuations in energy prices and the EU’s emission allowance prices (EEAP) complicate the utilization of the DSS [
19,
20]. In addition, a variation in available renewable wood resources (carbon sink) constraints the model. Generally, more understanding of viable growth-based carbon sinks (GBCS) of renewable forests is required to improve carbon neutrality in the WPCs. In these situations of the IEMI, data-driven modeling and optimization as a part of the DSS is an efficient technique to offer useful support to WPC management [
15]. However, without an internal carbon pricing mechanism (ICPM), it is difficult to manage the criteria and the constraints synchronously. Generally, the ICPM is a tool that an organization may use internally to guide its decision-making process in relation to climate change impacts, risks, and opportunities [
21].
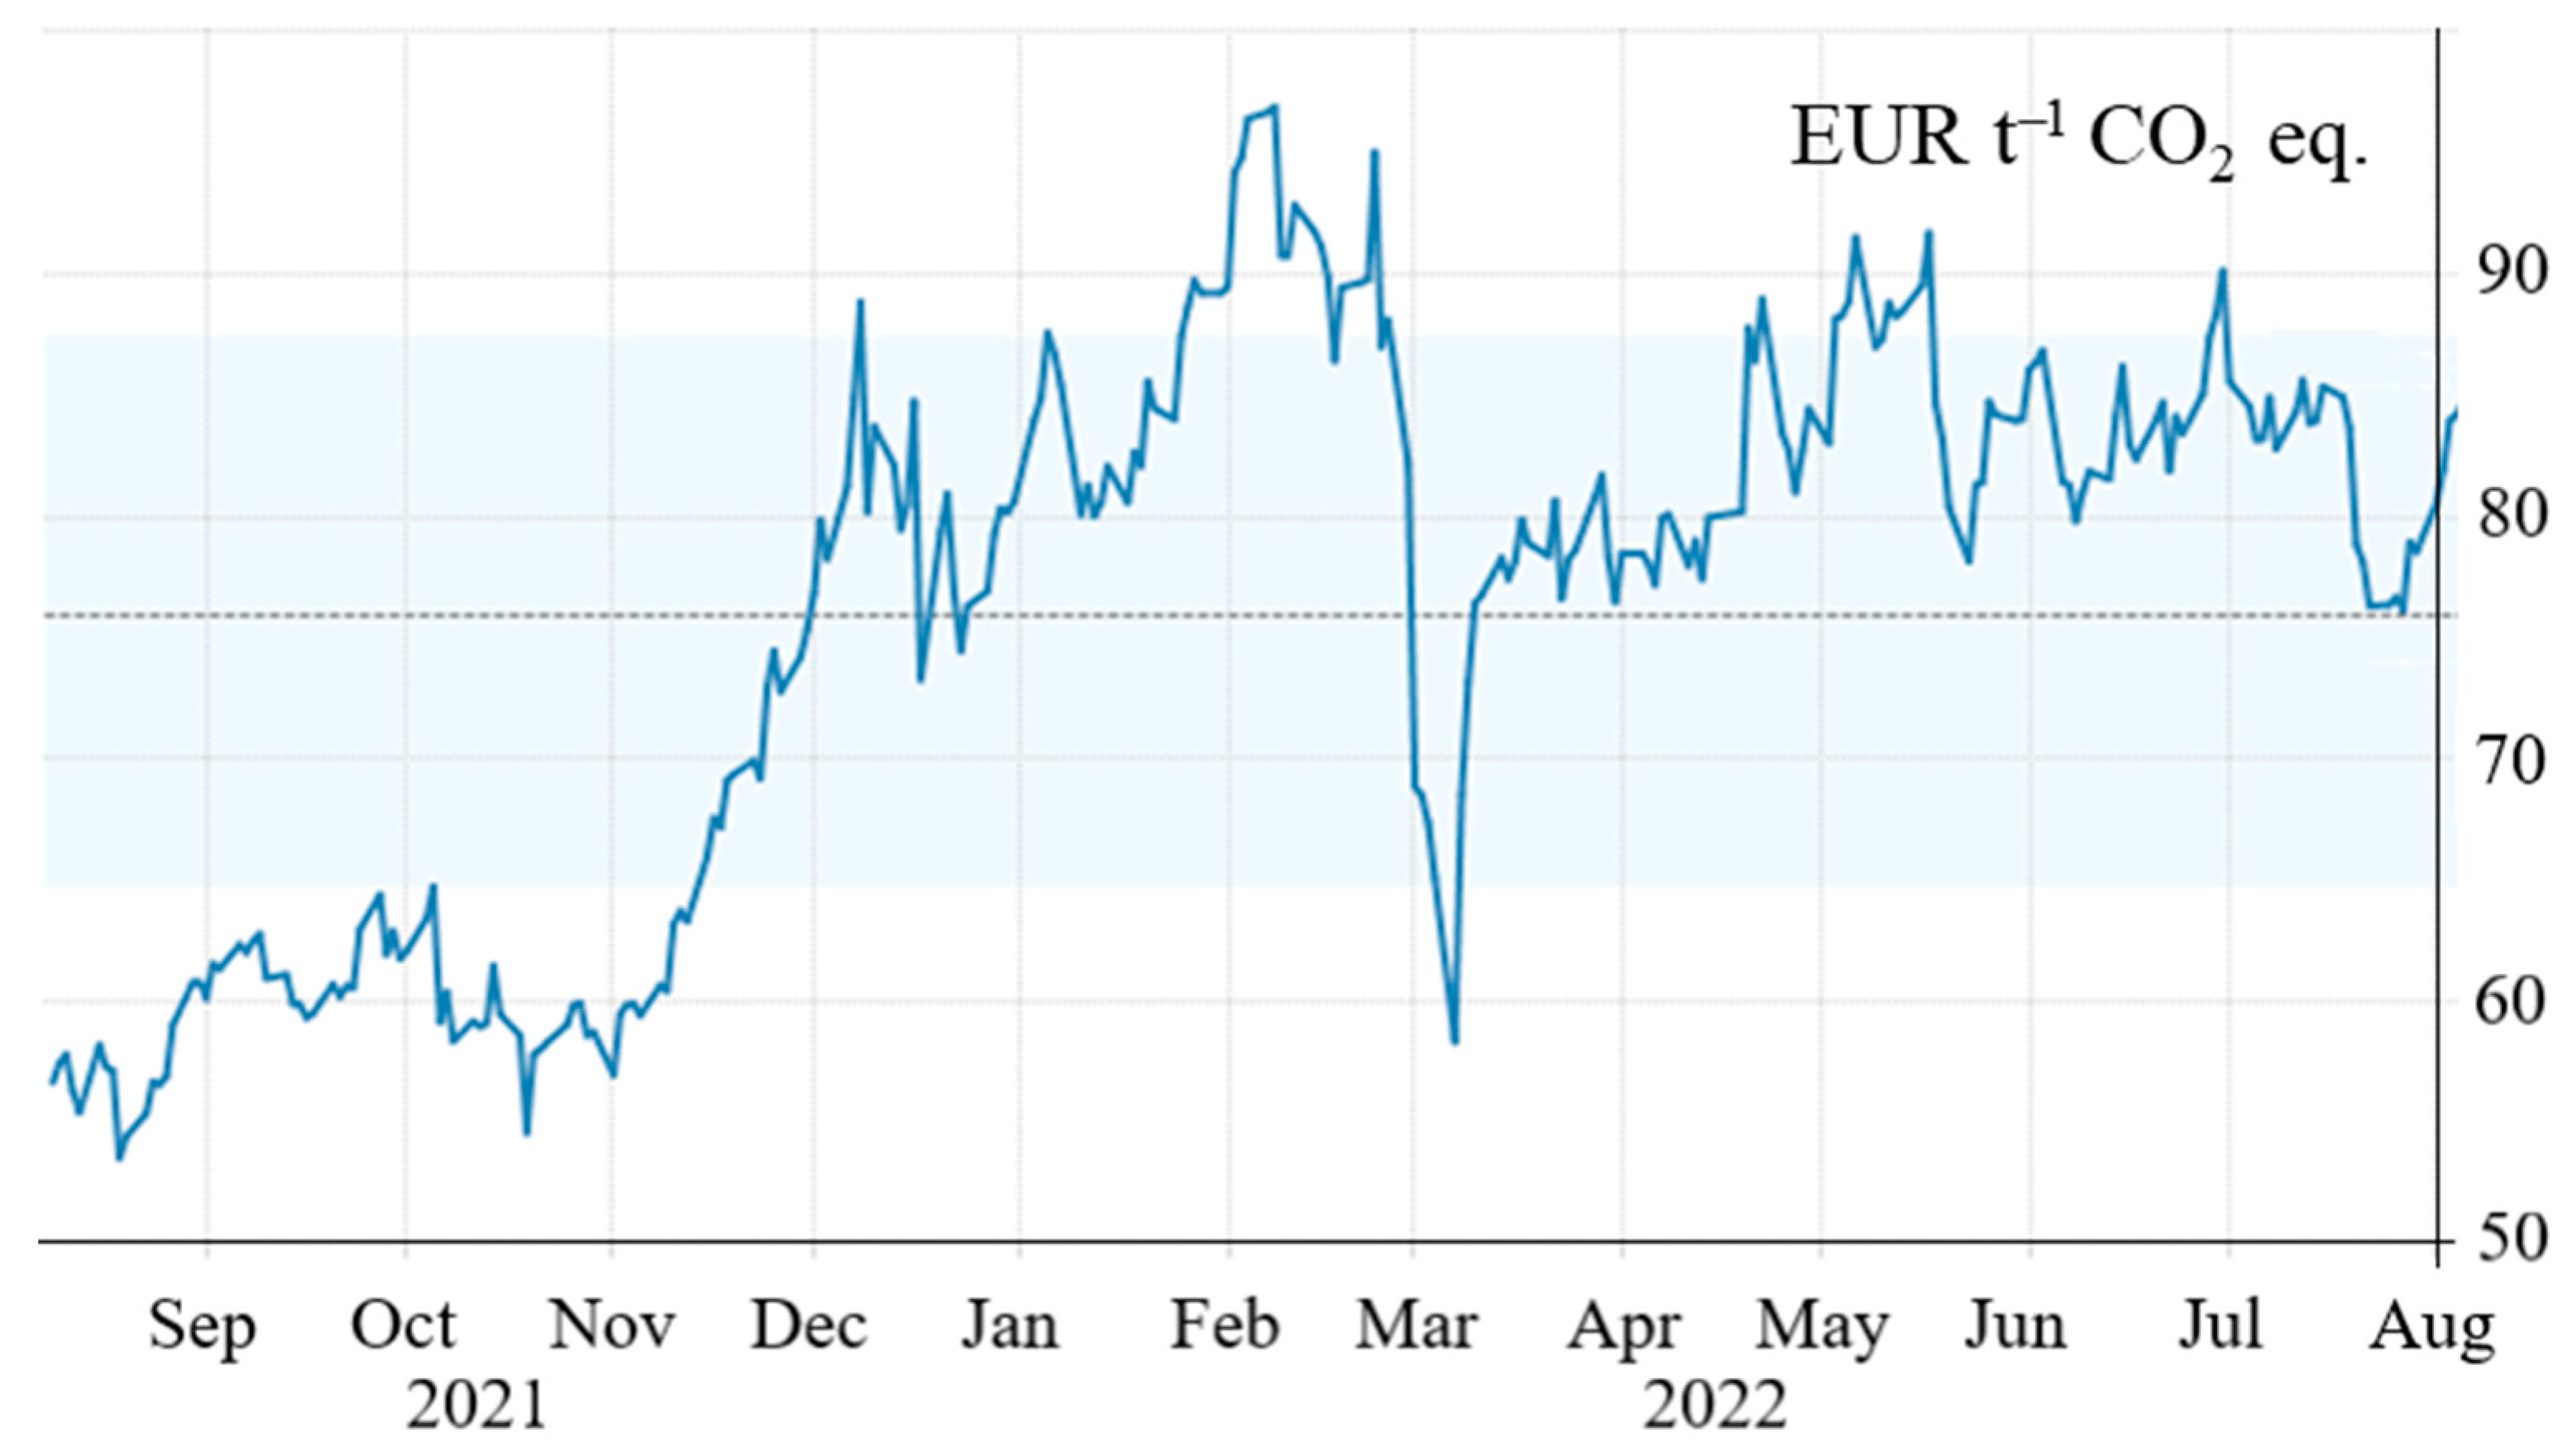
Recent consequences from changes in the EU’s announced plans to sell more carbon emission permits (EUR€210 billion) to fund the EU’s exit from Russian energy by 2027 have been recognized as important issues in the WPC management, which should be addressed to support the development toward carbon neutrality. European carbon prices have been close to 80 € t
−1, well below their rise peak of nearly 100 € t
−1 hit in February of 2022 (
Figure 2). Recently, it has risen again to over 100 € t
−1. It is already known that an increase in the EEAP increases the operating costs of the WSC if fossil fuels are consumed in timber trucks and forest machines [
22]. The EEAPs also have an impact on the wood purchase costs of the WPC if the carbon sink of forests decreases [
15]. In this respect, new risks relate to Russian wood import, which ended in February of 2022, which was 10% of Finnish wood procurement. The scenario analysis of this study answers the need to synchronize all these elements by also using data-driven ICPM (DDICPM) during minimizing total wood procurement costs.
Figure 1.
WSCs of IEMI (Modified from [
22]).
Figure 1.
WSCs of IEMI (Modified from [
22]).
Total wood procurement costs are calculated as a sum of operation costs and CO
2 emission costs. The emission costs are based on CO
2 calculations of consumed fossil fuels. In Finland, the total CO
2 emissions caused by work machinery in 2020 were 2.4 Mt CO
2 eq. [
23]. The emissions from forest machines (harvesters and forwarders) were approximately 13% of the total CO
2 emissions [
23]. Therefore, forest machines consume about 121 million liters of fossil fuel. In addition, the relocations of machines from one harvesting site to another [
24,
25], car transportation by machine operators from their homes to harvesting sites and back, and car transportation by managers, service, and maintenance staff to harvesting sites consume fossil fuels, which are added to the emission costs of wood harvesting. Similarly, other costs of the WSC operations (purchase costs and transport costs) are added to the total costs of the wood procurement.
Since importing wood from Russia ended, the challenges for the strategic wood procurement management of the IEMI have increased. In addition, fluctuations in the EEAP complicate the situation. Furthermore, available wood-resource amounts and growth in renewable carbon sinks are different in EU countries and possibly also vary inside individual countries. Therefore, the DDICPM were developed for synchronizing these elements of the WPC management. The DDICPM uses the GBCS, and the study describes the current management situation using a scenario in Finland. The improvements in wood procurement of the IEMI are analyzed by comparing the changes with practical WPCs (2020 reference scenario) before February 2022. The results obtained by comparisons are used to evaluate the usefulness of the DDICPM of wood procurement. Specific aims are:
To develop the DDICPM for retaining the carbon sink of renewable forests.
To use the DDICPM in the DSS for solving WPC’s amounts, costs, and profitability for wood procurement of the IEMI.
2. Materials
The IEMI operates in southern Finland, where the ICPM is applied for the management of the WPCs. Quite often, changes happen in local wood procurement. The ICPM can be used to provide information about the effects of the changes for improving wood-procurement management. The WPCs of the local wood procurement region were used in study experiments for developing the ICPM to manage the need for local changes. Actually, the theoretical model of the ICPM was adjusted for the solution of the local procurement situation of IEMI. Before the use of novel DDICPM in the optimization process, materials of the WPCs were collected from the ERP of the company and from public data. This municipal-specific historical WPC data formed the wood supply data for optimization. In addition to wood supply data, production plant data were collected for the implementation of the sucking principle of the optimization model. The material was collected from 21 plants that demanded fourteen wood assortments from the WSCs to production. Five of the plants used pulpwood in production, ten plants used saw logs, and six plants used energy wood.
Timber transport costs of optimization models were calculated automatically by using the cost calculation module of the DSS. Costs were based on transport rates agreed by the forest industry and transport union. Cost parameters were also based on the CO
2 emission calculations of trucks, which were determined by using the EEAP [
17,
25]. The most important explaining variable of the transport costs is the distance between the wood harvesting sites and the production plant of the IEMI. The distances were found by using Google’s map service. The cost module of the DSS also included cost models for wood harvesting and roadside chipping of wood. The total wood resource removal from forests was calculated by summing up wood harvesting volume and natural removal of four districts. The total volume was approximately 96, 97, 90, and 97% of the growth in recent years, which means that approximately 5% of the growth of the districts each year was left to increase the number of trees and the carbon sink in the forests. In the cumulative GBCS method, this additional growth is simply added to the forest sink from the previous year.
Before the formulation of the optimization model, the main databases of the DSS were updated by data mining from the ERP data into Access software tables on Windows. A novel table consisted of wood resources that were collected from open public forest balance statistics of municipalities. The optimization system of the DSS also used basic WPC tables. Wood purchase by municipalities was updated for months of the planning period by using measurement certificates of the company. Then the table of felling and forwarding of trees was updated from the agreed wood harvesting proof with the forest owner. The table of transportation was important in this study, which was updated by transport index statistics. In addition to the transport table, transportation cost calculation utilized the distance matrix that was saved in the table as kilometers and updated for distances driven in practice. For the implementation of experimental scenario analysis, a new scenario table was prepared for optimization, which included parameters from the EEAP and political ICP regulations. The DSS also included basic WPC tables for delivery purchases and sales. The former table consisted of mill wood orders from other companies, which decreased own wood procurement; the latter table consisted of timber delivery quantities to other companies.
3. The Data-Driven Internal Carbon Pricing Mechanism
Two recent studies by Palander and Takkinen [
15,
22] examined the basics of the ICPM. The following cost factors of WPC are considered in the objective function of their optimization model [
22]: annual interest rate for storage time, EEAP of fossil fuel consumption, operating costs, and purchase prices. Furthermore, the model offered an energy-efficient solution for optimization. In the former model, the EEAP calculation was based on the fossil and biofuel consumption of trucks and forest machines. In the latter model, WSC companies’ wood purchasing activities were optimized to take into account sustainable and unsustainable wood harvesting with renewable (100%) and non-renewable (<100%) forest carbon sinks [
15]. Optimization solved the effects of the environmental costs when the EEAPs 30, 50, and 70 € t
−1 CO
2 were added to purchase costs. However, the synchronization issues of both cost elements have not yet been modeled for the minimization of total wood procurement costs (
Figure 3). Actually, the EEAP rose in February 2022 to a level of 98.49 € t
−1 CO
2. Therefore, a price level of 98 € t
−1 CO
2 is used in the optimization model and analyses of this study.
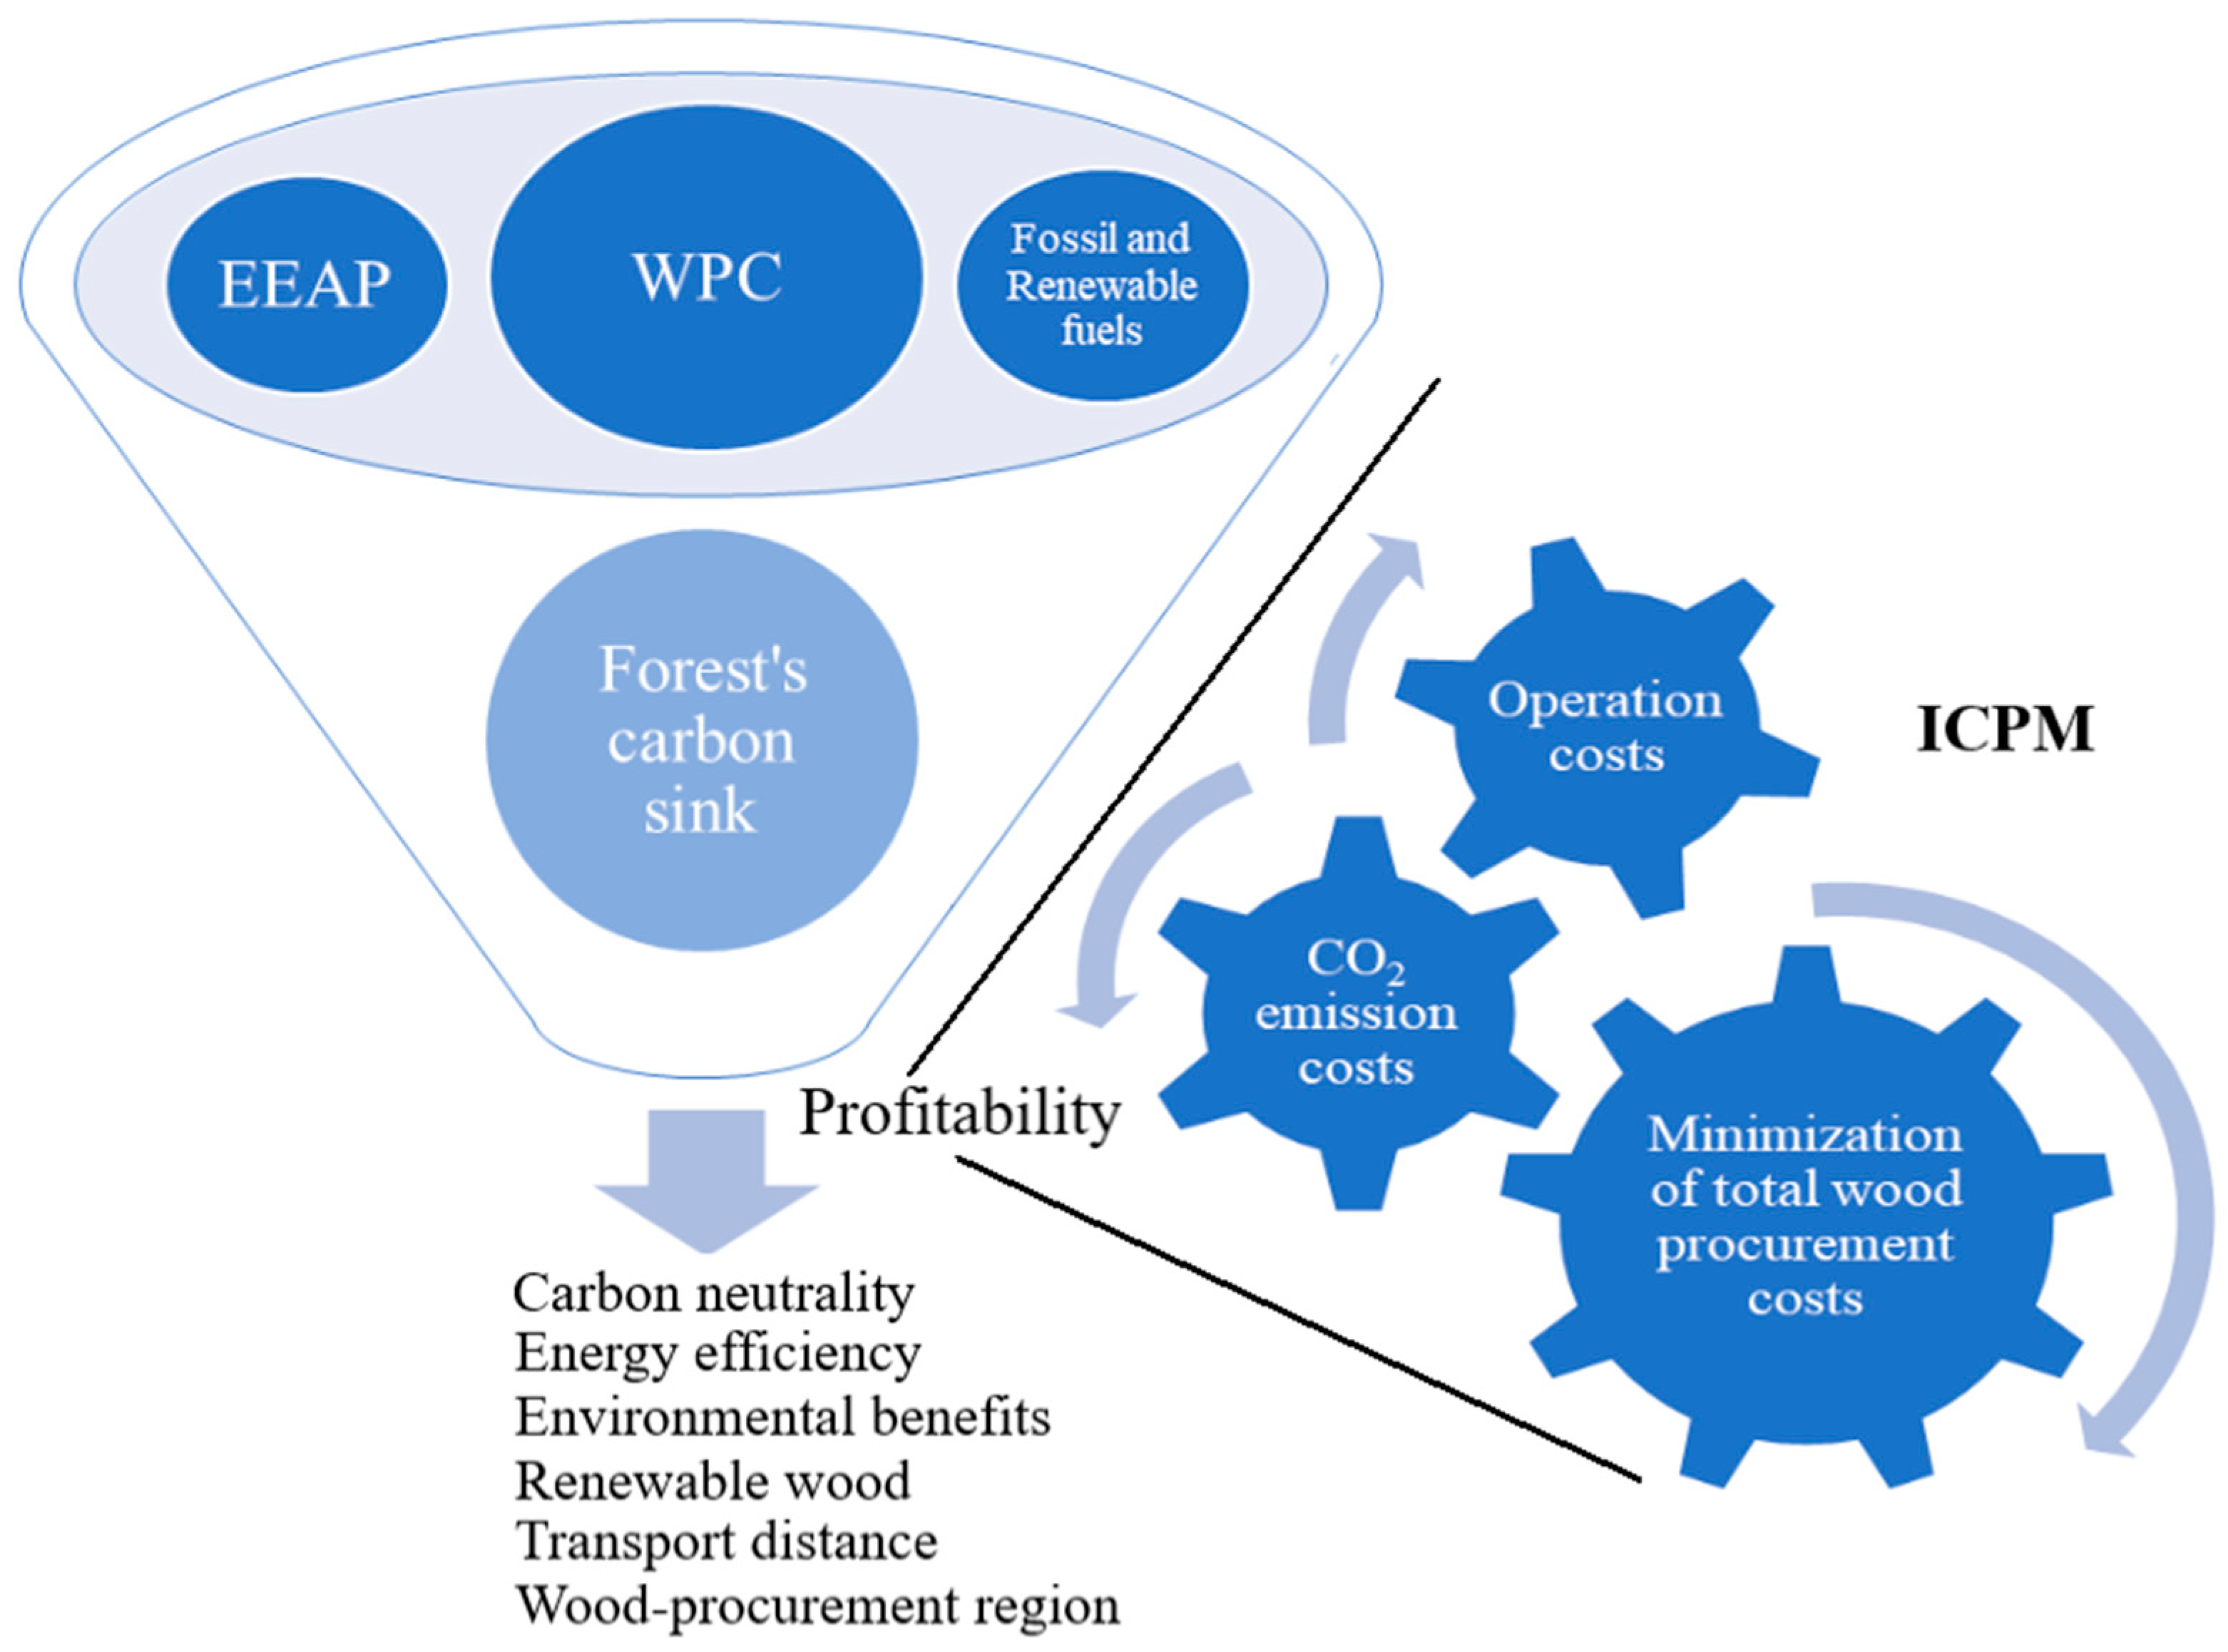
The optimization of wood procurement, which is also subjected to cost synchronizing, where performed iteratively by solving a general linear programming model (
Supplementary Materials). The number of solutions depended on efficiency requirements. The purpose of wood procurement optimization is to find out the most cost-efficient wood procurement alternative by considering operation costs, CO
2 emission costs, and the minimum total costs of the WPCs (
Figure 3). Results depend on EEAP, WPC, and Forest’s carbon sink, which is calculated using the GBCS. By synchronizing the cost elements by the DDICPM with the optimization model, users find out environmentally efficient and cost-efficient wood procurement alternatives. This is possible because, after optimization, the DDICPM produces CO
2 emission costs and operation costs by saving them in database tables. The procurement area can be determined on the basis of the timber payment capacity model. The plant’s gate price of energy and the costs of the WSC are entered into the model, which calculates the payment capacity for wood with the given values. The model includes CO
2 emission costs as one of the parameters, so the size of the profitable wood procurement area can be examined in relation to CO
2 emission costs when other costs are fixed. In the study, the following model was used to determine the payment capacity (Model 1):
where: P
€/MWh = the ability to pay for wood at the given costs and the price of sold energy; E
€/MWh = the market value of the energy content of the sold wood energy in euros; GHG emission costs = the EU’s emission allowance price (EEAP) in euros; WSC costs = the operating costs of wood harvesting and transportation in euros.
The DDICPM can also be used for analyzing the effects of reducing CO
2 emission costs (
Figure 3), which changes the constraints of the optimization model. The effects on transport costs can be examined in relation to CO
2 emission costs when other costs and minimum total wood procurement costs are fixed. In addition, the transport cost model includes distance as the parameter used for preparing maps in this study. Technically in LP’s data-driven modeling, the dynamic steps of WPCs and model parameters are automatically formulated with customer-oriented programming code. With this technique, the LP model can be adapted to the solution of the local situation of forest industry companies. Data-driven optimization was done with in-house written C programming code. The program is called PH-Opti, which uses SQL for data-based modeling and calculating results. The simplex optimization method [
26,
27,
28] is used to solve the optimization models of the Lindo API subroutine [
29,
30].
5. Results and Discussion
In scenario (i), wood procurement increased by 65% from the 2020 levels. The total supply of wood to IEMI’s factories was then 677,089 m
3. The amount of wood harvested was 338,554 m
3 lower because IEMI also buys and sells wood on the direct delivery market. After February 2022 and new calculations for constraints of the optimization model, the wood harvesting amount was 358,753 m
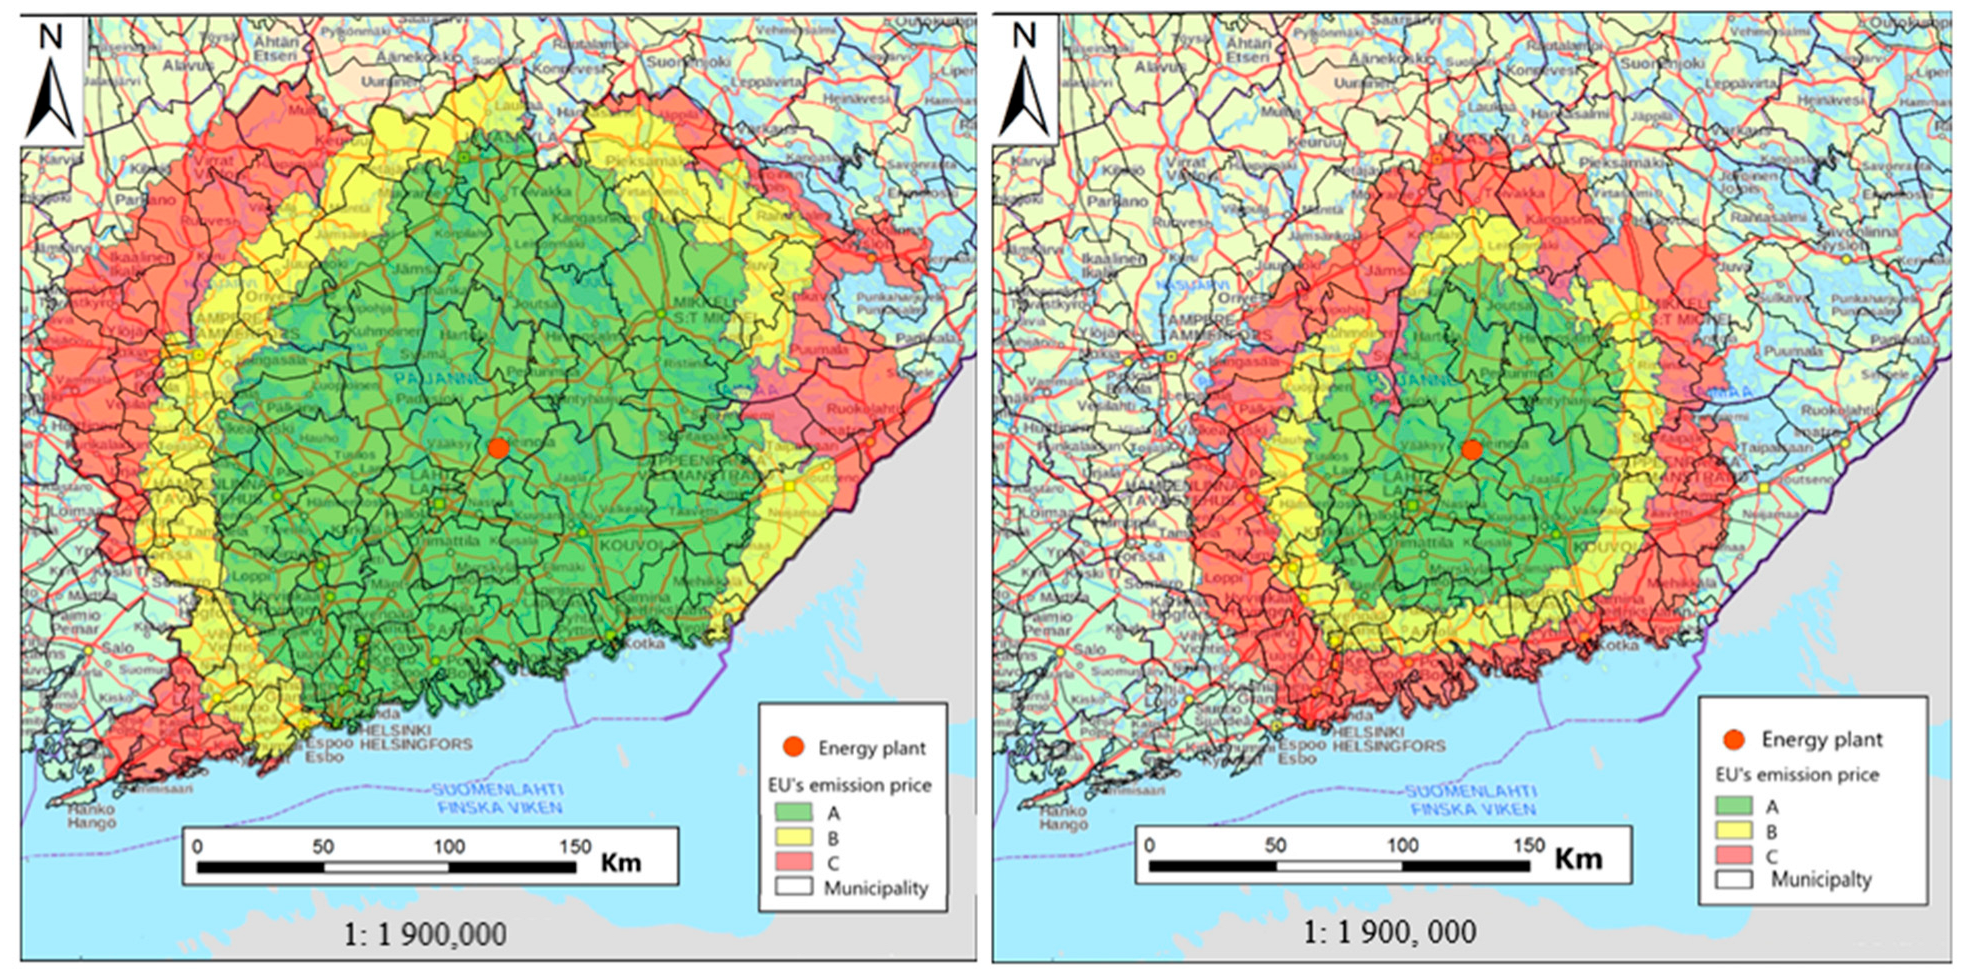
3 in scenario (ii). For evaluation of the DDICPM,
Figure 4 depict a case of a single energy plant of the IEMI. Its wood harvesting amounts were 41,372 m
3 and 43,840 m
3, respectively.
In
Figure 4 (left), the wood procurement area is wider than in
Figure 4 (right). This is due to the fact that the wood procurement of scenario (i) can be done profitably with minimum total costs from the wider area. In this operating environment, the CO
2 emission costs are related to the CO
2 emissions of fossil fuels consumed by timber transport vehicles and wood harvesting machines. At priory, optimization allocates an amount of wood procurement as close as possible to the energy plant only by limiting the amount of wood purchased by the company’s market share. Further, the amount of wood harvested from forests is lower than their sustainable felling plan. The felling plan amounts are municipality-specific and are calculated regularly following the development of the growth situation based on the terrain measurements of the national forest inventory [
31]. Overcutting is thus impossible. Therefore, parts of the increased amount of wood procurement are purchased from municipalities that are far from the energy plant. In
Figure 4 (right), the profitable wood procurement area is smaller for two reasons: wood procurement quantities increase in scenario (ii) in addition to transportation and wood harvesting; the EEAP is used for purchasing the declining carbon sinks, which causes an increase in CO
2 emission costs. Consequently, wood procurement spreads over a smaller area in optimization.
Figure 4 (right) demonstrates the usefulness of synchronizing procedure of the DDICPM. When all cost elements of wood procurement are synchronized and considered in LP-model formulation, the energy production of the IEMI is profitable. This depends on the energy prices that producers sell to consumers. Production may continue if rising energy prices secure production. Different subvention mechanisms may be provided by authorities to energy plants that compensate for losses in profitability. However, the forest’s carbon sink is declining if energy plants continue wood procurement operations that are needed for production.
Figure 4 (right) also shows how decreasing the EEAP affects the wood procurement area. When the EEAP changes from 98 € t
−1 CO
2 to 65 € t
−1 CO
2 and to 30 € t
−1 CO
2, the wood procurement area is extended. Actually, minimum total procurement costs were fixed, and therefore, transport costs increased, causing longer transportation distances from the forest sites to the energy plant.
As described above, the framework was validated and evaluated considering a real scenario from an energy plant located in Heinola, Finland. The experiments’ results revealed that the DDICPM combined with optimization could consistently and significantly outperform the conventional solution adopted by the IEMI that based on the minimum economic costs. In addition to carbon pricing, the mechanism provides necessary information on raw material logistics, which may be used to support decision-making on the profitability of future business environments.
Table 1 reports the changes in the total costs of a large procurement area when the carbon sinks of forests were below the sustainable amount for harvesting wood in relation to the growth of forest wood stock of trees. The analysis of the total costs showed that, based on the current situation in 2022, the average costs increased to a small extent (0.4–1.4%), while the national wood procurement increased by 10% after the end of wood imports from Russia to Finland. The calculations were based on a period of one year. In fact, the growing cycle time of forests is much longer, 60–80 years; thus, additional short-term felling can improve the growth potential of forests over a longer perspective of time. Therefore, extensive wood harvesting may be justified over a year [
15]. As a result, these operations may also provide more viable forest carbon sinks [
14], which may be destroyed if the objectives are either the maximization of the cumulative wood stock or forest area as they are imagined in a compensation mechanism of LULUCF [
32].
The results above justify that when the situation of the emission price and the forest carbon sink is known, their effects on the total costs can be established in a data-based operation analysis with ICPM. Subsequently, more attention should be paid to the meaningful factors affecting operating costs, which actually mitigate the profitability risks for carbon-neutral wood procurement. In this regard, the results are consistent with the previous data-driven analyses made using optimization models [
15]. In addition, costs are reduced the most if the transport distance of the wood is shortened, i.e., the size of the procurement area is reduced. In this work, a sensitivity analysis was performed by removing distant municipalities from the analysis.
Table 1 shows that the cost reduction would be 15.8, 15.4, and 14.9, respectively, at the EEAP prices of 30, 65, and 98 EUR/t CO
2 if the wood procurement is implemented inside three provinces instead of four provinces. Otherwise, the results were based on the situation in 2022–2023 (i.e., scenario B). Profitability increases were 16.2, 16.1, and 16.0% between wood procurement areas of four and three districts in the EEAPs of scenario B. Of course, even greater savings could be achieved if the review were focused on individual municipalities in peripheral areas of each province, but the analysis would have been technically more laborious to implement using the DDICPM procedure and report in the paper. The results are logical and justify the positive assumption regarding the usefulness of the DDICPM in WPC management. In the future, additional excessive wood harvesting experiments should be conducted in regard to carbon sinks to investigate the sensitivity of wood-procurement costs.


