Article

Optimum Conditions for Enhanced Biohydrogen Production from a Mixture of Food Waste and Sewage Sludge with Alkali Pretreatment

Marine Energy Convergence and Integration Research Team, Jeju Global Research Center, Korea Institute of Energy Research, 200 Haemajihaean-ro, Gujwa-eup, Jeju-si 63357, Republic of Korea
Energies 2023, 16(7), 3281; https://doi.org/10.3390/en16073281
Submission received: 11 February 2023 / Revised: 10 March 2023 / Accepted: 29 March 2023 / Published: 6 April 2023
(This article belongs to the Special Issue CO2 Reduction and H2 Promotion Techniques in Energies)

Abstract

:
Given the increasing demand for hydrogen, owing to its environmentally friendly nature, it is important to explore efficient methods for hydrogen production. This study investigates dark-fermentative hydrogen production by the co-digestion of food waste and sewage sludge. Both wastes were subjected to alkali pretreatment (at pH 13) to enhance biodegradability. Batch tests were conducted to enhance hydrogen production from food waste and sewage sludge under various volatile solid (VS) concentrations of 1.5–5% and food waste to sewage sludge mixing ratios of 0:100–100:0. We found that alkali pretreatment was effective in increasing hydrogen yields. The maximum specific hydrogen production rate of 163.8 mL H2/g volatile suspended solid/h was obtained at a VS concentration of 5.0% and food waste composition of 62.5%. Additionally, VS concentration of 2.8% and food waste composition of 100% yielded a maximum hydrogen production potential of 152.1 mL H2/g VS. Our findings indicate that food waste and sewage sludge with alkali pretreatment are potential substrates to produce biohydrogen.

1. Introduction

Net-zero emissions are one of the goals that countries around the world have set for 2050. Hydrogen is one of the keys to achieving this, and its demand has increased substantially because of the development of national hydrogen strategies [1]. Hydrogen is an important fuel as it is a clean environmentally friendly, and sustainable energy source that emits only water. Moreover, it contributes significantly to the reduction in carbon emissions [2,3]. Hydrogen is generally produced using physicochemical and biological methods and is currently almost exclusively produced through physicochemical methods using fossil fuels [3]. The physicochemical methods mainly include coal gasification, hydrocarbon reforming, and hydrocarbon pyrolysis. These methods, however, are unsustainable, as the sources utilized are non-renewable, polluting sources, emitting significant amounts of greenhouse gases, including CO2 [4]. Furthermore, these methods are unsustainable, as the sources utilized are non-renewable, polluting sources, emitting significant amounts of greenhouse gases. Clean hydrogen needs to be produced through more sustainable methods [5].
Hydrogen can be generated from renewable, sustainable sources using environmentally friendly methods [6,7]. Biological methods are less energy-consuming than physicochemical processes and environmentally friendly. The biological processes include biophotolysis, as well as photo fermentation (PF) and dark fermentation (DF) [8]. Among them, hydrogen production employing DF is regarded as the most practically applicable method because it is not energy intensive, and hydrogen is produced at a much faster rate than when implementing any other biological process. Additionally, it allows the treatment of organic solid wastes such as sewage sludge (SS), food waste (FW), and livestock waste [9,10,11].
DF is a process of producing biohydrogen as a byproduct during the acidogenesis of carbohydrates, and inoculum is known to greatly affect hydrogen yields [12]. Because homoacetogens and methanogens consume hydrogen to produce acetate and methane, respectively, the activity of hydrogen-producing bacteria needs to be enhanced while that of hydrogen consuming bacteria needs to be suppressed [12]. Clostridia, one of the most favorable bacteria for hydrogen production are known to form endospores that are resistant to unfavorable factors such as chemicals, radiation, and heat. Therefore, Clostridia can be a favorable choice for hydrogen production via heat treatment [13], as they recorded higher hydrogen yields than Enterobacter and Bacillus [14,15]. However, they are sensitive to unfavorable environmental conditions because of the metabolic complexity of spore formation.
For DF, organic wastes can be a favorable carbon source because they are nutrient-rich and hydrogen production occurs concurrently with waste reduction. FW is problematic organic solid waste that constitute 15–63% of total municipal solid waste worldwide [3]. Due to the prohibition of direct FW landfill, more competent technologies, in addition to existing recycling technologies, are required to fully explore the potential of high-energy-content FW. In particular, FW is an appropriate substrate for hydrogen production owing to its high carbohydrate content. However, it has relatively low nitrogen content, an essential nutrient for hydrogen-producing microorganisms.
To overcome this limitation, additives and protein-rich waste can be mixed with FW to increase nitrogen content. Among various organic wastes, SS is an optimum choice as a co-substrate to fulfill the nitrogen requirements of the bacteria [11,13,16]. Therefore, the co-digestion of SS and FW will result in inclined hydrogen production due to a more balanced carbon-to-nitrogen ratio in the substrate.
Although SS is a suitable co-substrate for hydrogen generation, it exhibits poor biodegradability due to the low hydrolysis reaction rate of cell-bound organic matter [17]. Hydrolysis is a rate-limiting step in FW degradation [18]; therefore, efficient waste pretreatment, using methods such as thermal, chemical, thermal/chemical, ultrasound, and enzyme treatments, is necessary to enhance biodegradability. As bioconversion generally needs pH adjustment by increasing alkalinity and is highly adequate for enriching basophilic bacteria capable of producing hydrogen, alkaline pretreatment could be used as an efficient pretreatment method [19]. Moreover, alkali addition could be a suitable alternative to counter temporary inhibitory conditions related to the accumulation of volatile fatty acids or free ammonia in bioprocesses [20]. Optimum substrate conditions for an alkali-treated FW and SS mixture for continuous hydrogen production need further investigation.
Therefore, this study investigates the effects of alkali pretreatment on FW and SS to enhance biodegradability, the hydrogen production potential from alkali-treated FW and SS in batch tests, and the optimum substrate conditions by testing various volatile solid (VS) concentrations (1.5–5%) and FW to SS mixing ratios (0:100–100:0) for increased hydrogen generation.

2. Material and Methods

2.1. Preparation of Alkali-Treated Feedstocks

FW and SS were feedstocks for DF. FW was ground using an electrical blender, and SS was obtained from a thickener in a publicly owned treatment work. The substrate was kept in a refrigerator until use and the characteristics are shown in Table 1. Batch kinetic tests were conducted for the two waste streams to establish the optimum pH and reaction time for the alkaline pretreatment. NaOH is known to enhance the solubility of the components of a mixture [21,22]; however, to eliminate the inhibition effect of sodium on DF, KOH (Daejung, Korea) was used instead in this study.
Prior to the hydrogen fermentation batch test, FW and SS were treated with a KOH solution of 6 N at various pH (11.5, 12.0, 13.0, and 13.5) and a constant room temperature (35 °C) for better solubilization and disinfection.
The following batch tests using an alkali-treated mixture of FW and SS were performed under various VS (1.5–5%) and FW to SS mixing ratios (0:100–100:0) conditions. WHEATON® Media 415 mL lab bottles (Wheaton, IL, USA) were used for the batch test of DF hydrogen production. Seed sludge was prepared from an anaerobic digester in the publicly owned treatment work and it was heated at 90 °C for 30 min to select spore-forming bacteria [23]. Subsequently, the seed sludge (40 mL) was added to a serum bottle containing the substrates, and each bottle contained 200 mg KH2PO4, 14 mg MgCl2·4H2O, 2.5 mg MnCl2·6H2O, 2 mg CaCl2·2H2O, 2 mg Na2MoO4·4H2O, and 10 mg FeCl2·4H2O. The total carbohydrate to alkalinity ratio was set at 1.0 ± 0.1 by adding NaHCO3. After adding the substrate solution and the seed sludge, the bottles were filled with 200 mL of distilled water. pH was controlled to 6.0 using 1 M HCl (Daejung, Korea) and 1 M KOH. N2 gas was flushed to the headspaces of the serum bottles, and then we sealed the bottles using screw caps with rubber septa. We incubated the bottles after placing them in a shaker at 35 °C and 100 rpm. Using a glass syringe, we measured the amount of biogas production, and biogas composition was simultaneously determined by a gas chromatograph. The supernatant samples were analyzed for pH and organic concentrations. Throughout the cultivation period, pH was controlled to be in the range of 5.0–6.0 by injecting either 1 M HCl or 1 M KOH. All the experiments were conducted in duplicate. Unless otherwise specified, all the chemicals were purchased from Sigma Aldrich (St. Louis, MO, USA).

2.2. Batch Assay

Alkali-based solubilization of FW and SS was calculated in terms of soluble chemical oxygen demand (COD) using Equation (1).
C O D   s o l u b i l i z a t i o n , % = S C O D t S C O D i T C O D i S C O D i × 100
where TCODi is the initial total COD and SCODt and SCODi are the final and initial soluble CODs, respectively.
The disinfection effect was evaluated using the spread plate technique. After dilution, samples were individually obtained and spread over an agar surface. For this purpose, anaerobic agar of Wilkins–Chalgren (Oxoid company, Basingstoke, UK), with the gelatin peptone of 10 g/L, the tryptone of 10.0 g/L, the yeast extract of 5.0 g/L, the sodium pyruvate of 1.0 g/L, the hemin of 0.005 g/L, the menadione of 0.0005 g/L, and the agar of 10.0 g/L, was used. We incubated the prepared agar plates at 37 °C. After inoculation, the number of colony-forming units was monitored directly from the agar plates.
To describe the hydrogen production process, hydrogen production trends were regressed based on the modified Gompertz equation (Equation (2)) [24].
H ( t ) = P exp exp R m e P ( λ t ) + 1
where P (mL) means the ultimate hydrogen production, Rm (mL/day) means the hydrogen production rate, λ (days) means the lag-phase time, H (mL) means the cumulative hydrogen production, and e stands for exponential 1.
The produced hydrogen volume was quantified based on the analyzed gas composition and the total biogas volume produced using the below mass balance equation, at each time interval (Equation (3)).
V H , i = V H , i 1 + C H , i ( V G , i V G , i 1 ) + V H ( C H , i C H , i 1 )
where V H , i represent the total cumulative volume of hydrogen gas at the current ( i ) and V H , i 1 represent total cumulative volume of hydrogen gas at the previous ( i 1 ) time intervals, respectively; V G , i represent the total gas volume generated at the current and V G , i 1 is the total gas volume generated at the previous time intervals, respectively; C H , i indicates hydrogen fractions in the bottle headspace at the current interval and C H , i 1 indicates that of previous intervals, respectively; and V H is the total volume of the bottle’s headspace.
To provide better process design and control, this study adapted response surface methodology which can build a mathematical model. Hydrogen production according to the effects of VS concentrations and FW to SS mixing ratios could be estimated using the below quadratic model (Equation (4)):
Y = β 0 + β 1 x + β 2 y + β 11 x 2 + β 22 y 2 + β 12 x y
where x and y are the independent variables, Y is the dependent variable (the predicted response), β 0 , β 1 , β 2 , β 11 , β 22 , and β 12 are the coefficient of each term explaining the overall contribution.

2.3. Analytical Methods

Gas volumes generated were measured using the water displacement method and hydrogen composition was determined by using GOW-MAC Series 580 gas chromatograph (GC) equipped with a thermal conductivity detector. We used a 1.8 m × 3.2 mm stainless-steel column packed with molecular sieve 5A. The used carrier gas was N2. The contents of CO2, CH4, and N2 were determined by using the same GC equipped with a 1.8 m × 3.2 mm stainless-steel column packed with porapak Q (80/100 mesh). The used carrier gas was helium.
Volatile fatty acids were determined by using a high-performance liquid chromatograph (HPLC) (SpectraSYSTEM P2000, Thermo Fisher Scientific, Waltham, MA, USA) equipped with an ultraviolet (210 nm) detector. The used column was a 300 m × 7.8 mm Aminex HPX-97H. All the samples were pre-treatment with a 0.45 µm membrane filter. The applied mobile phase was a 0.005 M sulfuric acid at a flow rate of 0.6 mL/min. We determined the contents of alcohols by using an IC (DX-600 Ion Chromatography System, Dionex, CA, USA). It was equipped with an ED 50A electrochemical detector and used a 250 mm × 4 mm Dionex CarboPac PA10 column after pretreatment with a 0.45 µm membrane filter.
The contents of VS, volatile suspended solid (VSS), COD, total Kjeldahl nitrogen (TKN), and ammonia were analyzed following standard methods [25]. Using the Dubois method [26], we determined the contents of total/soluble carbohydrates. Based on the prescribed relationship, total protein content was calculated (9.375 g COD/g protein) [27], and soluble protein content was analyzed by using a Lowry method [28].

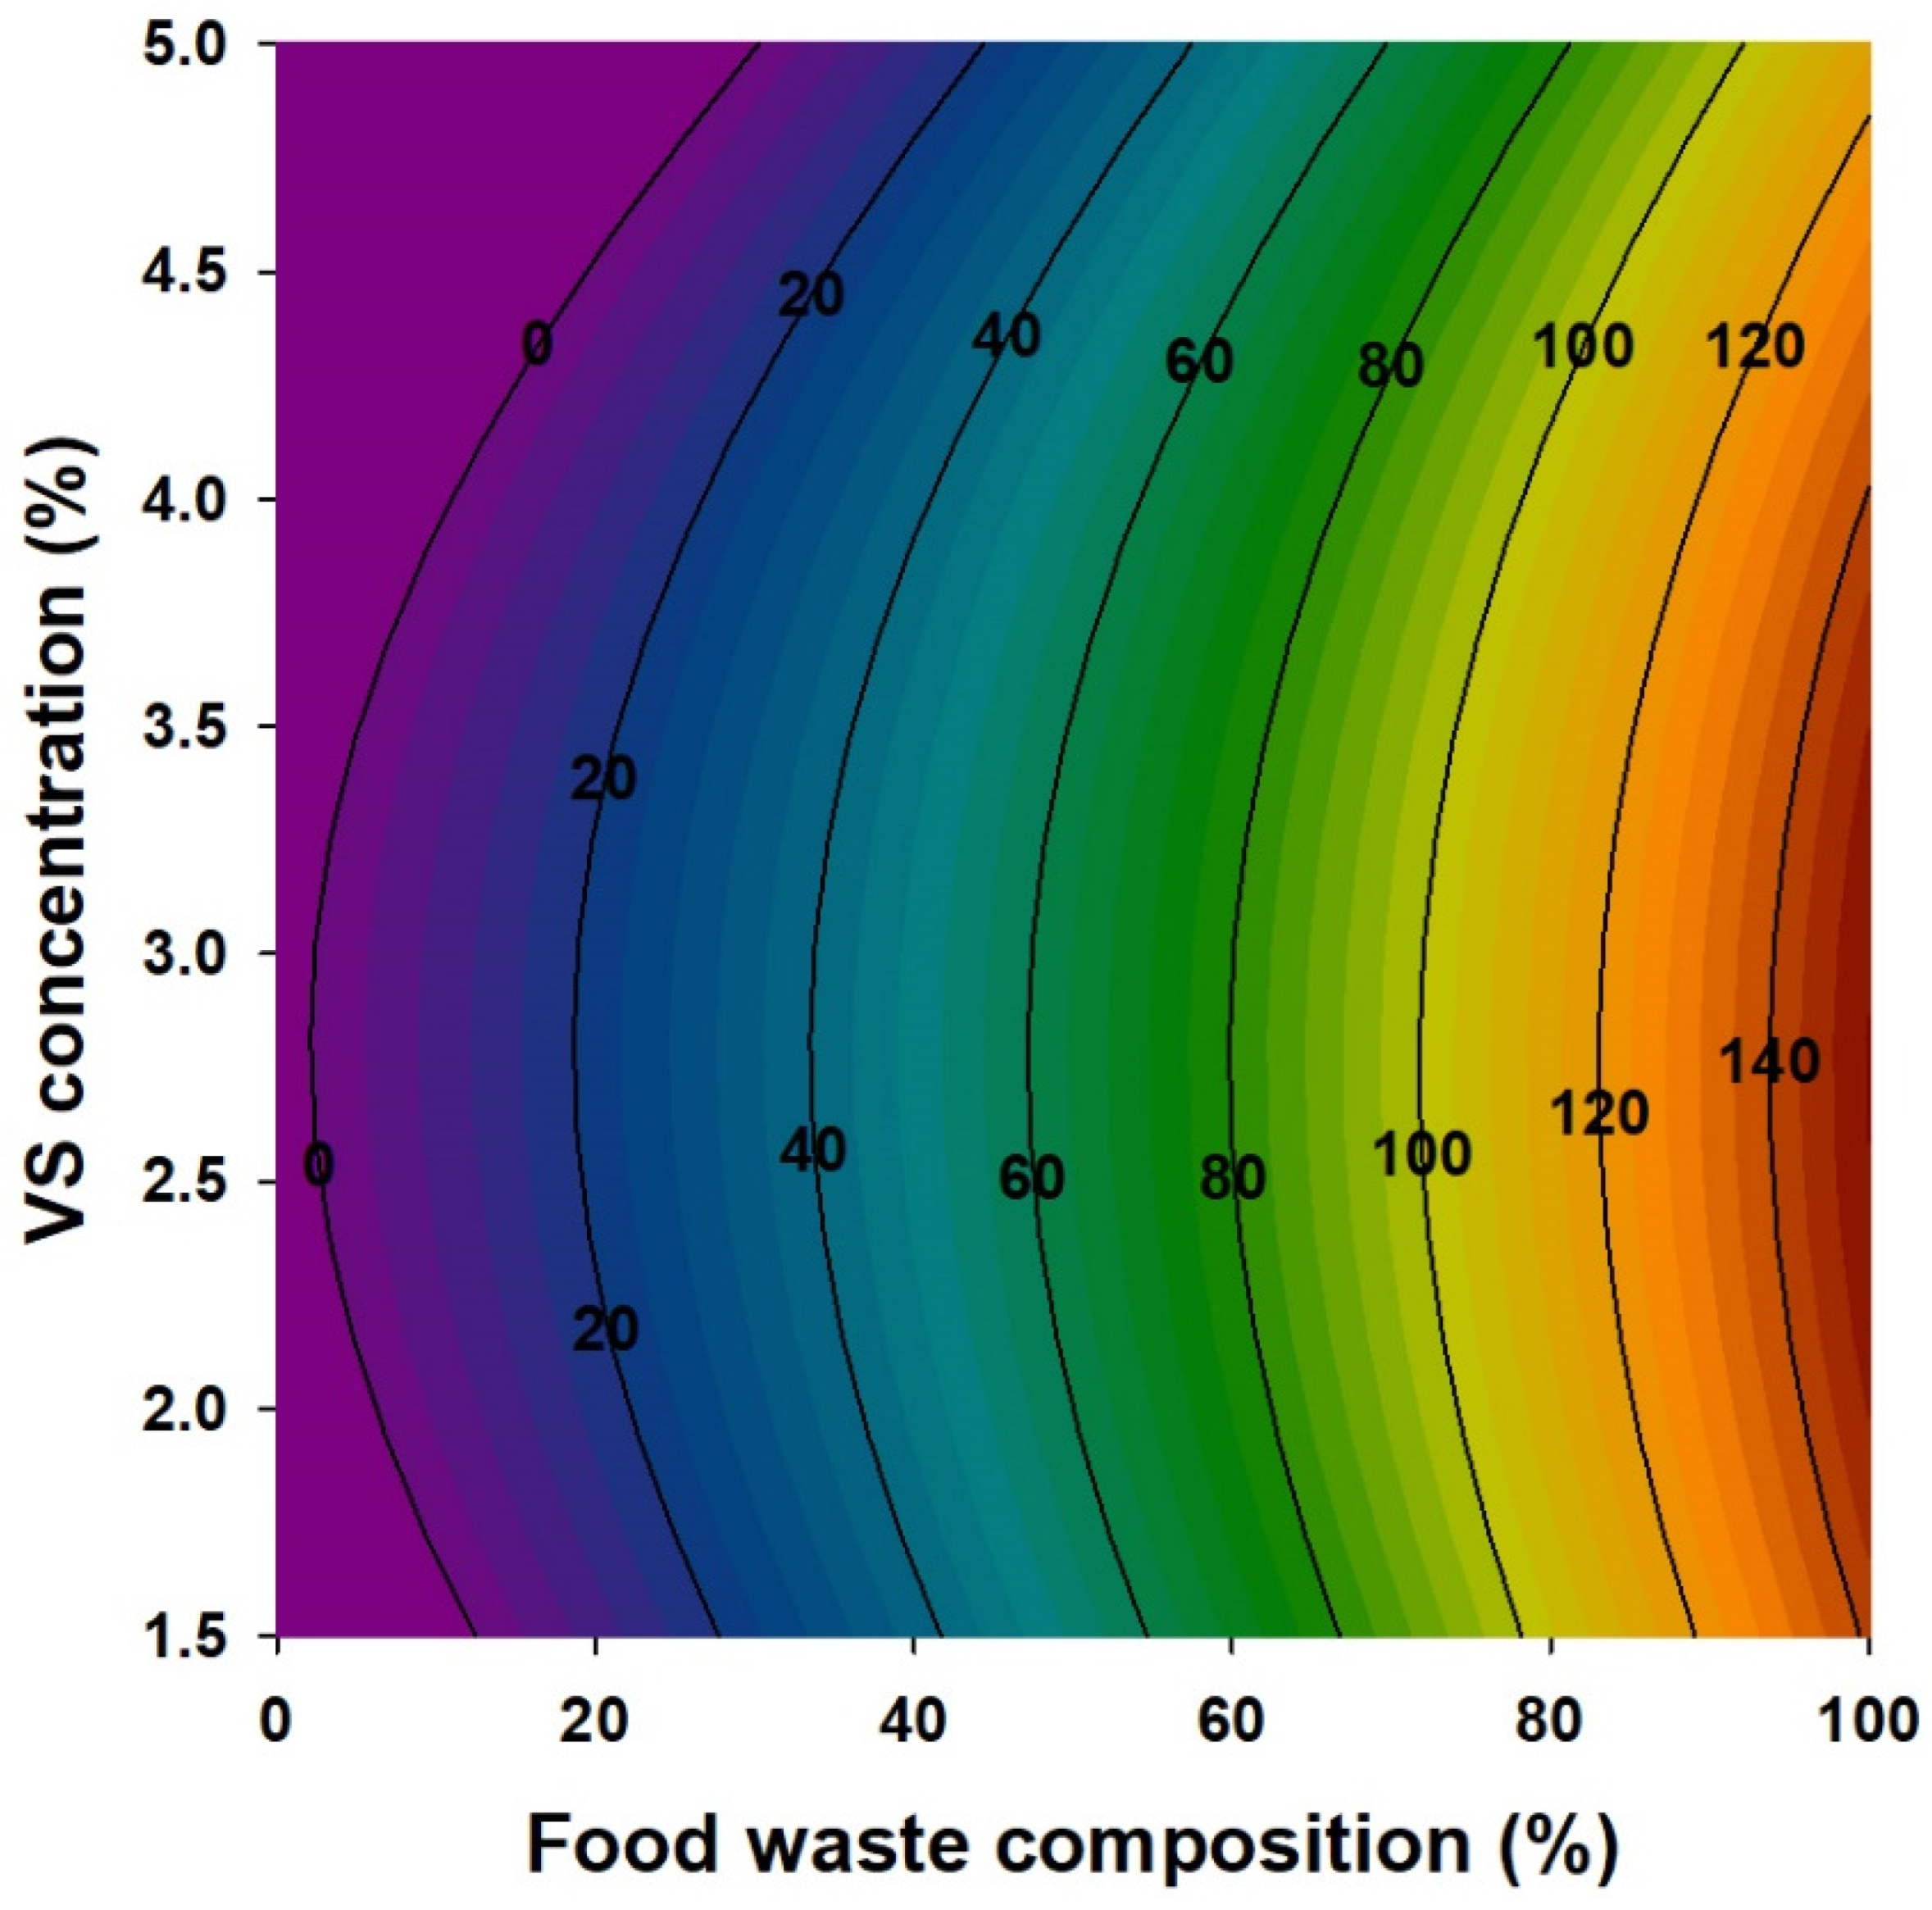
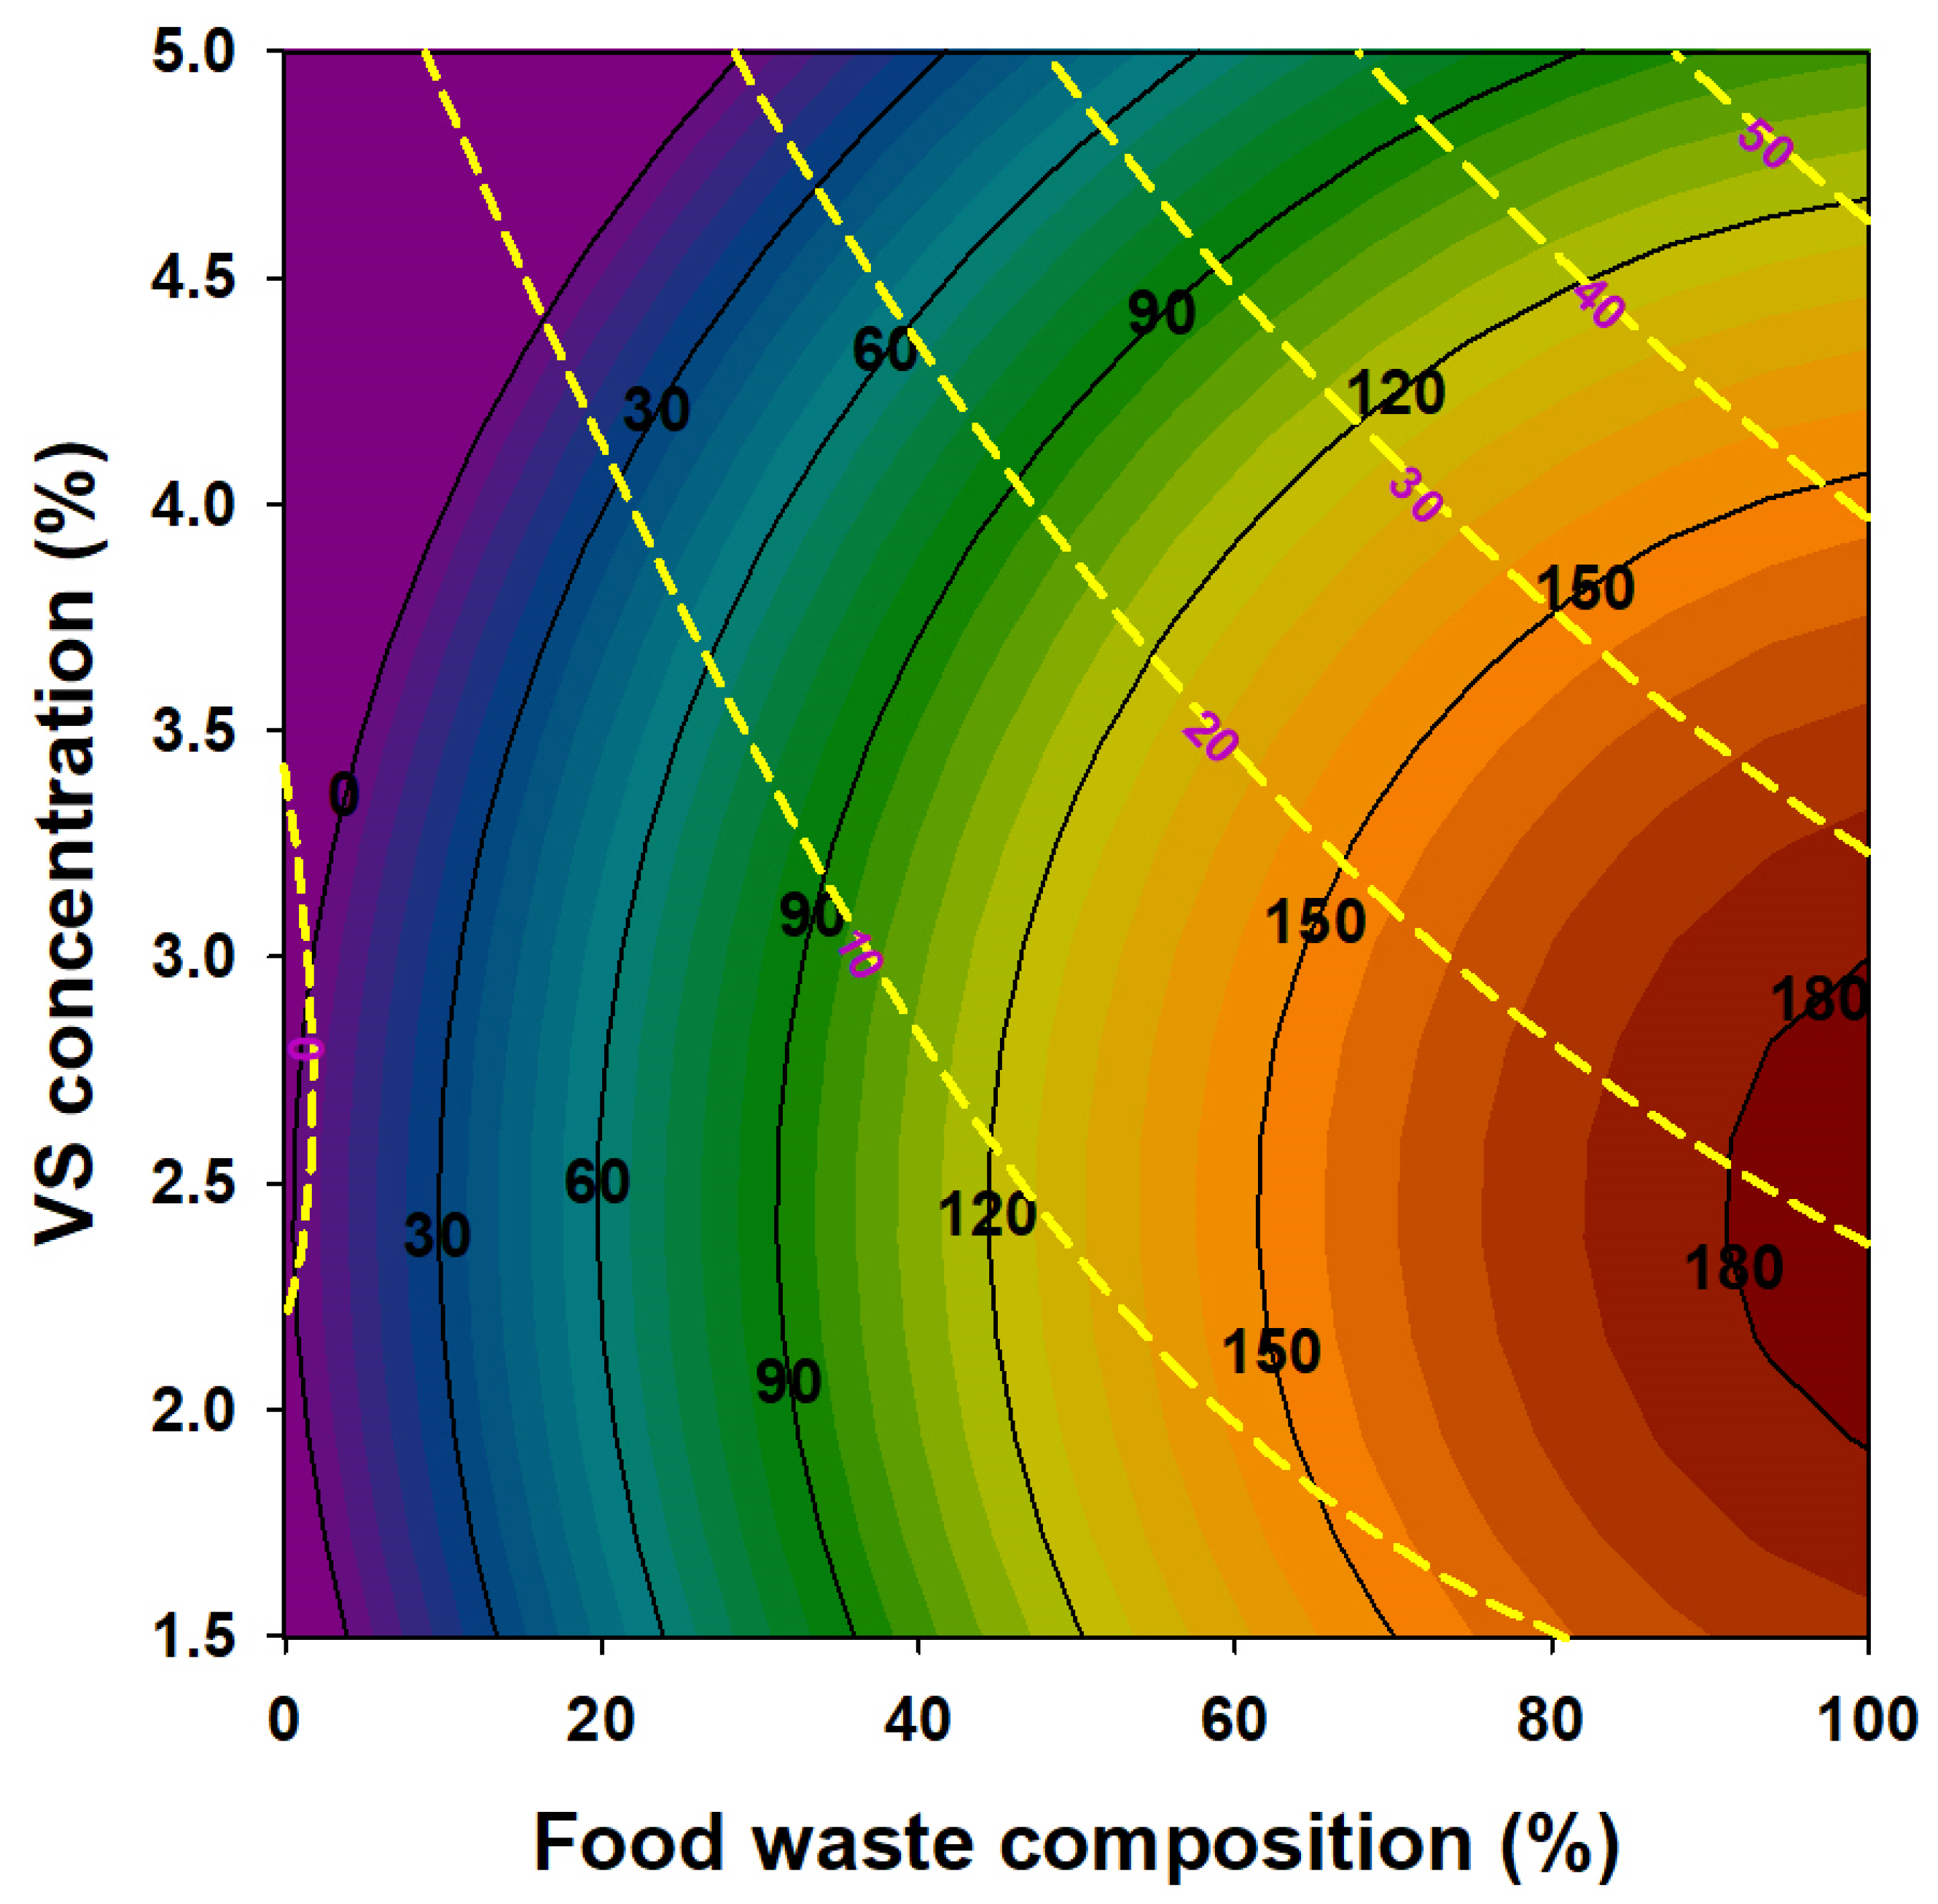
3. Results and Discussion

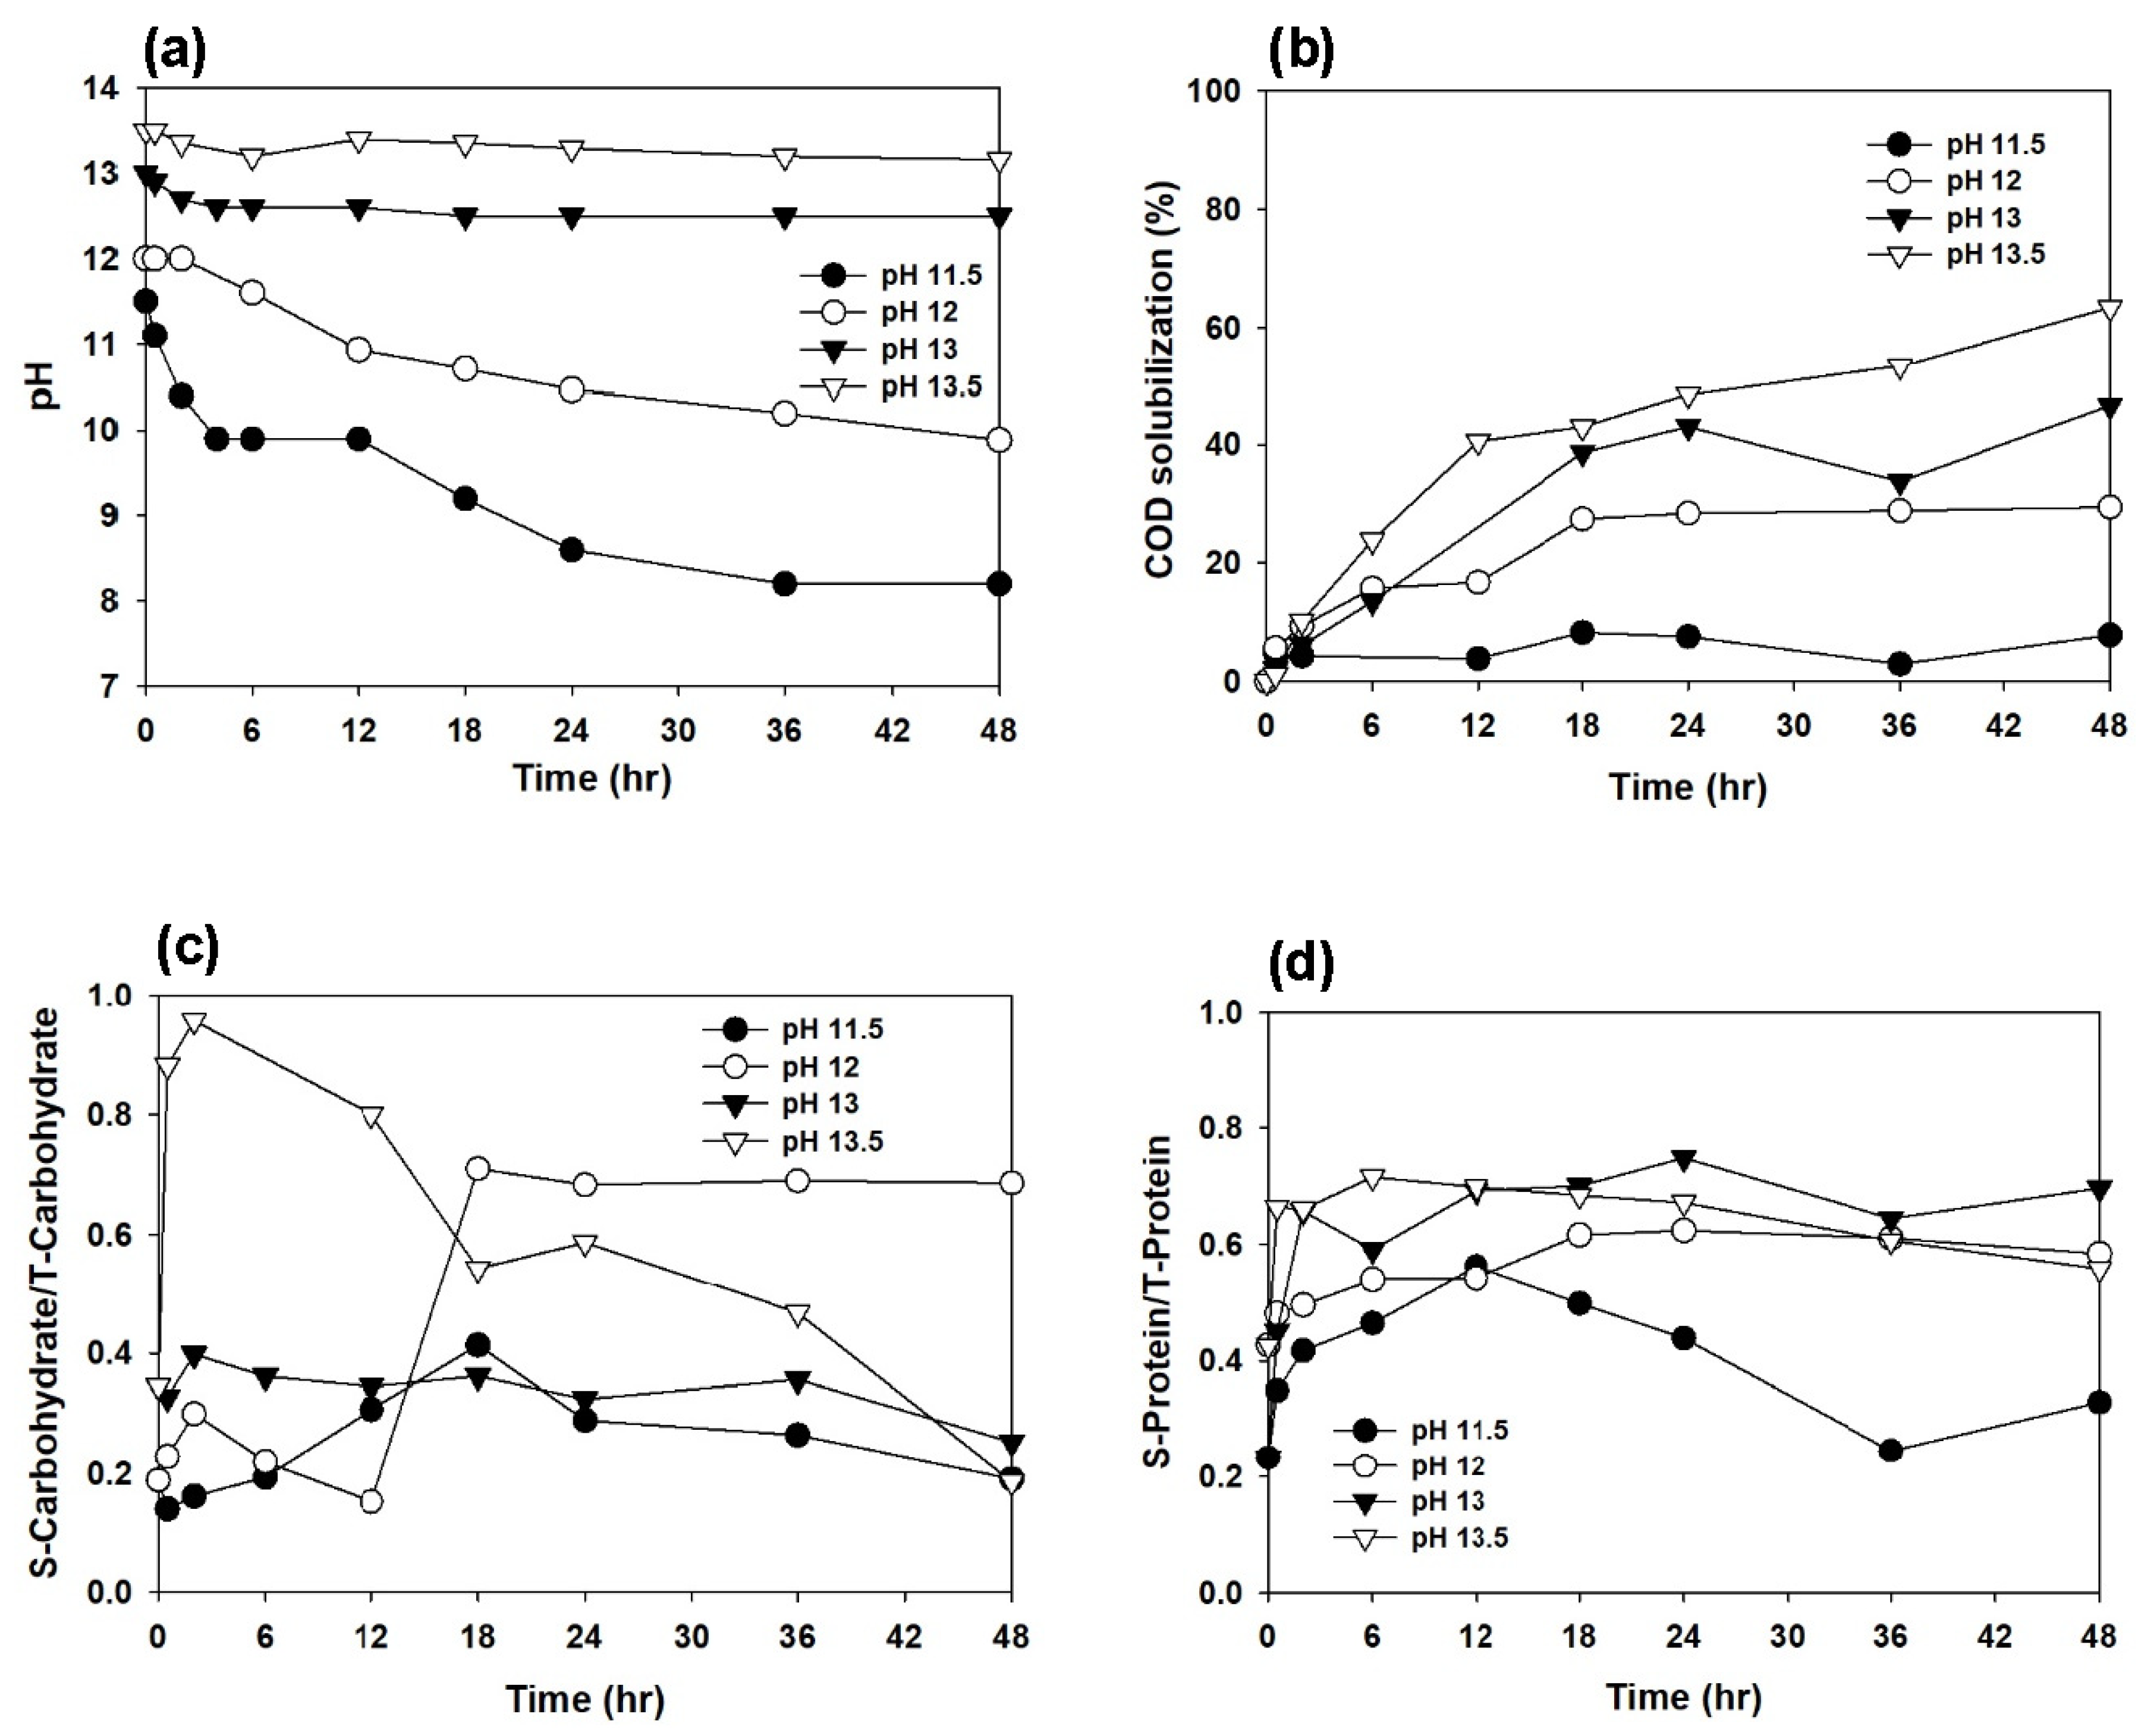
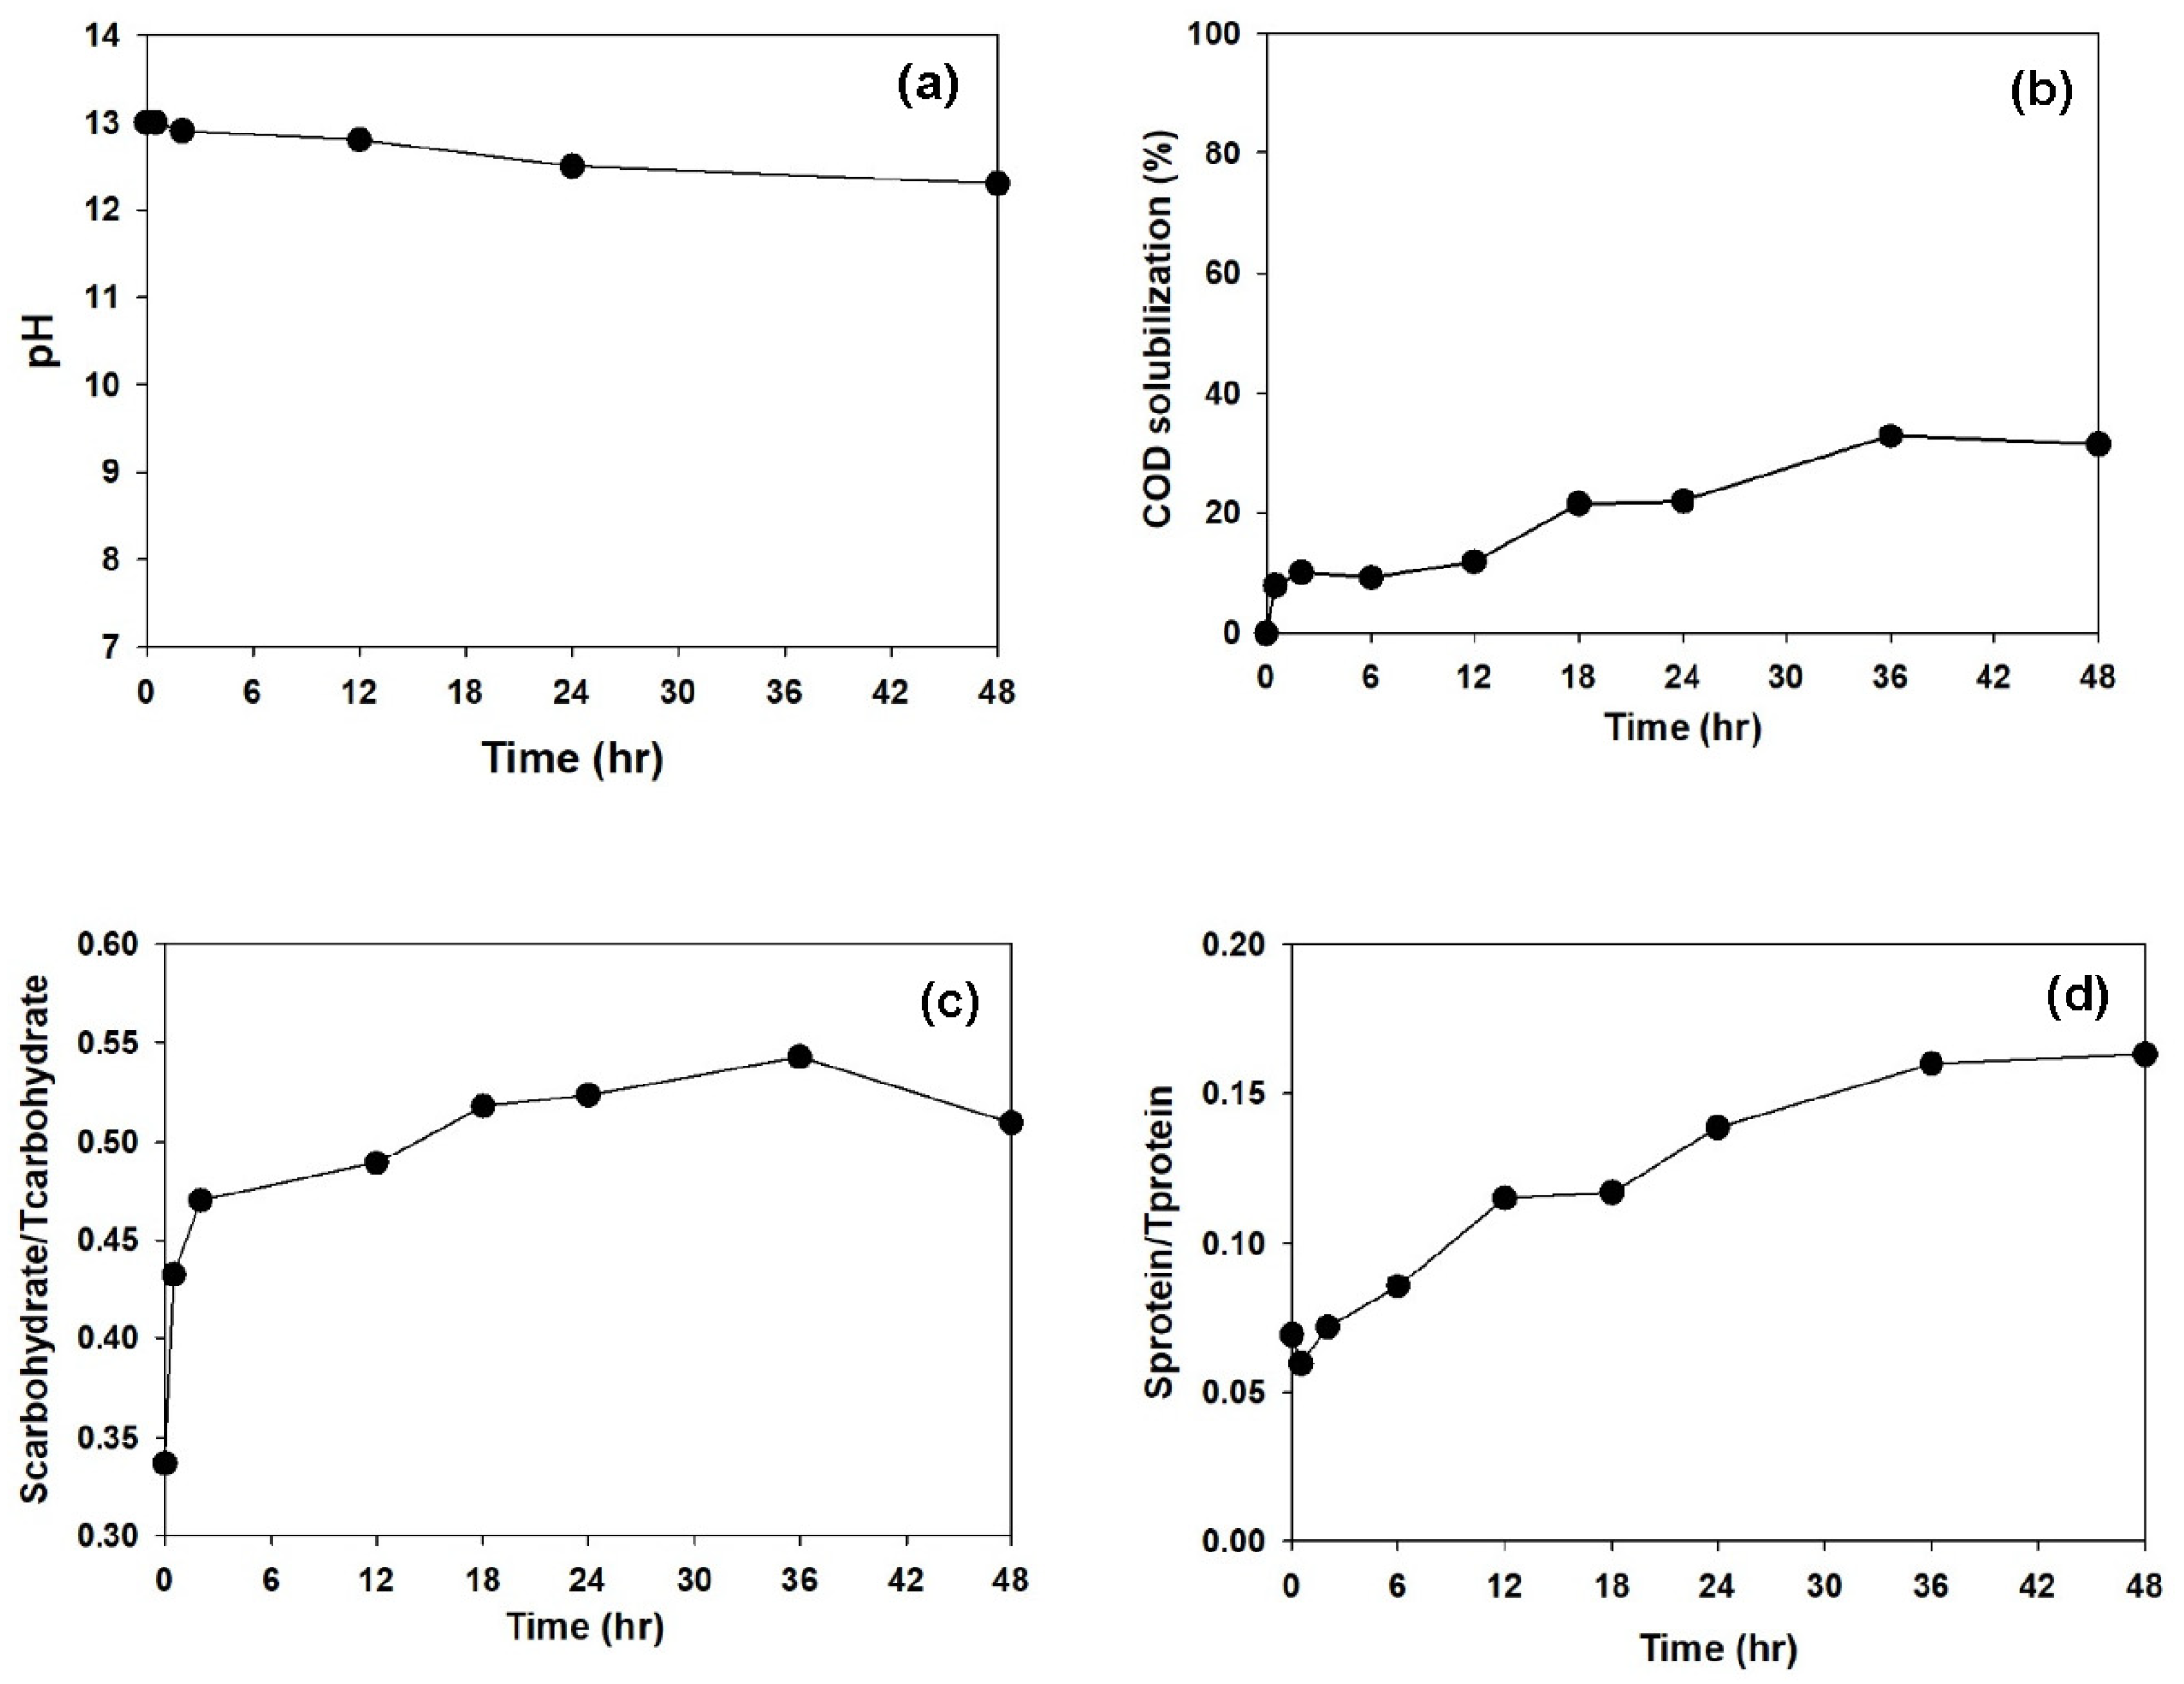
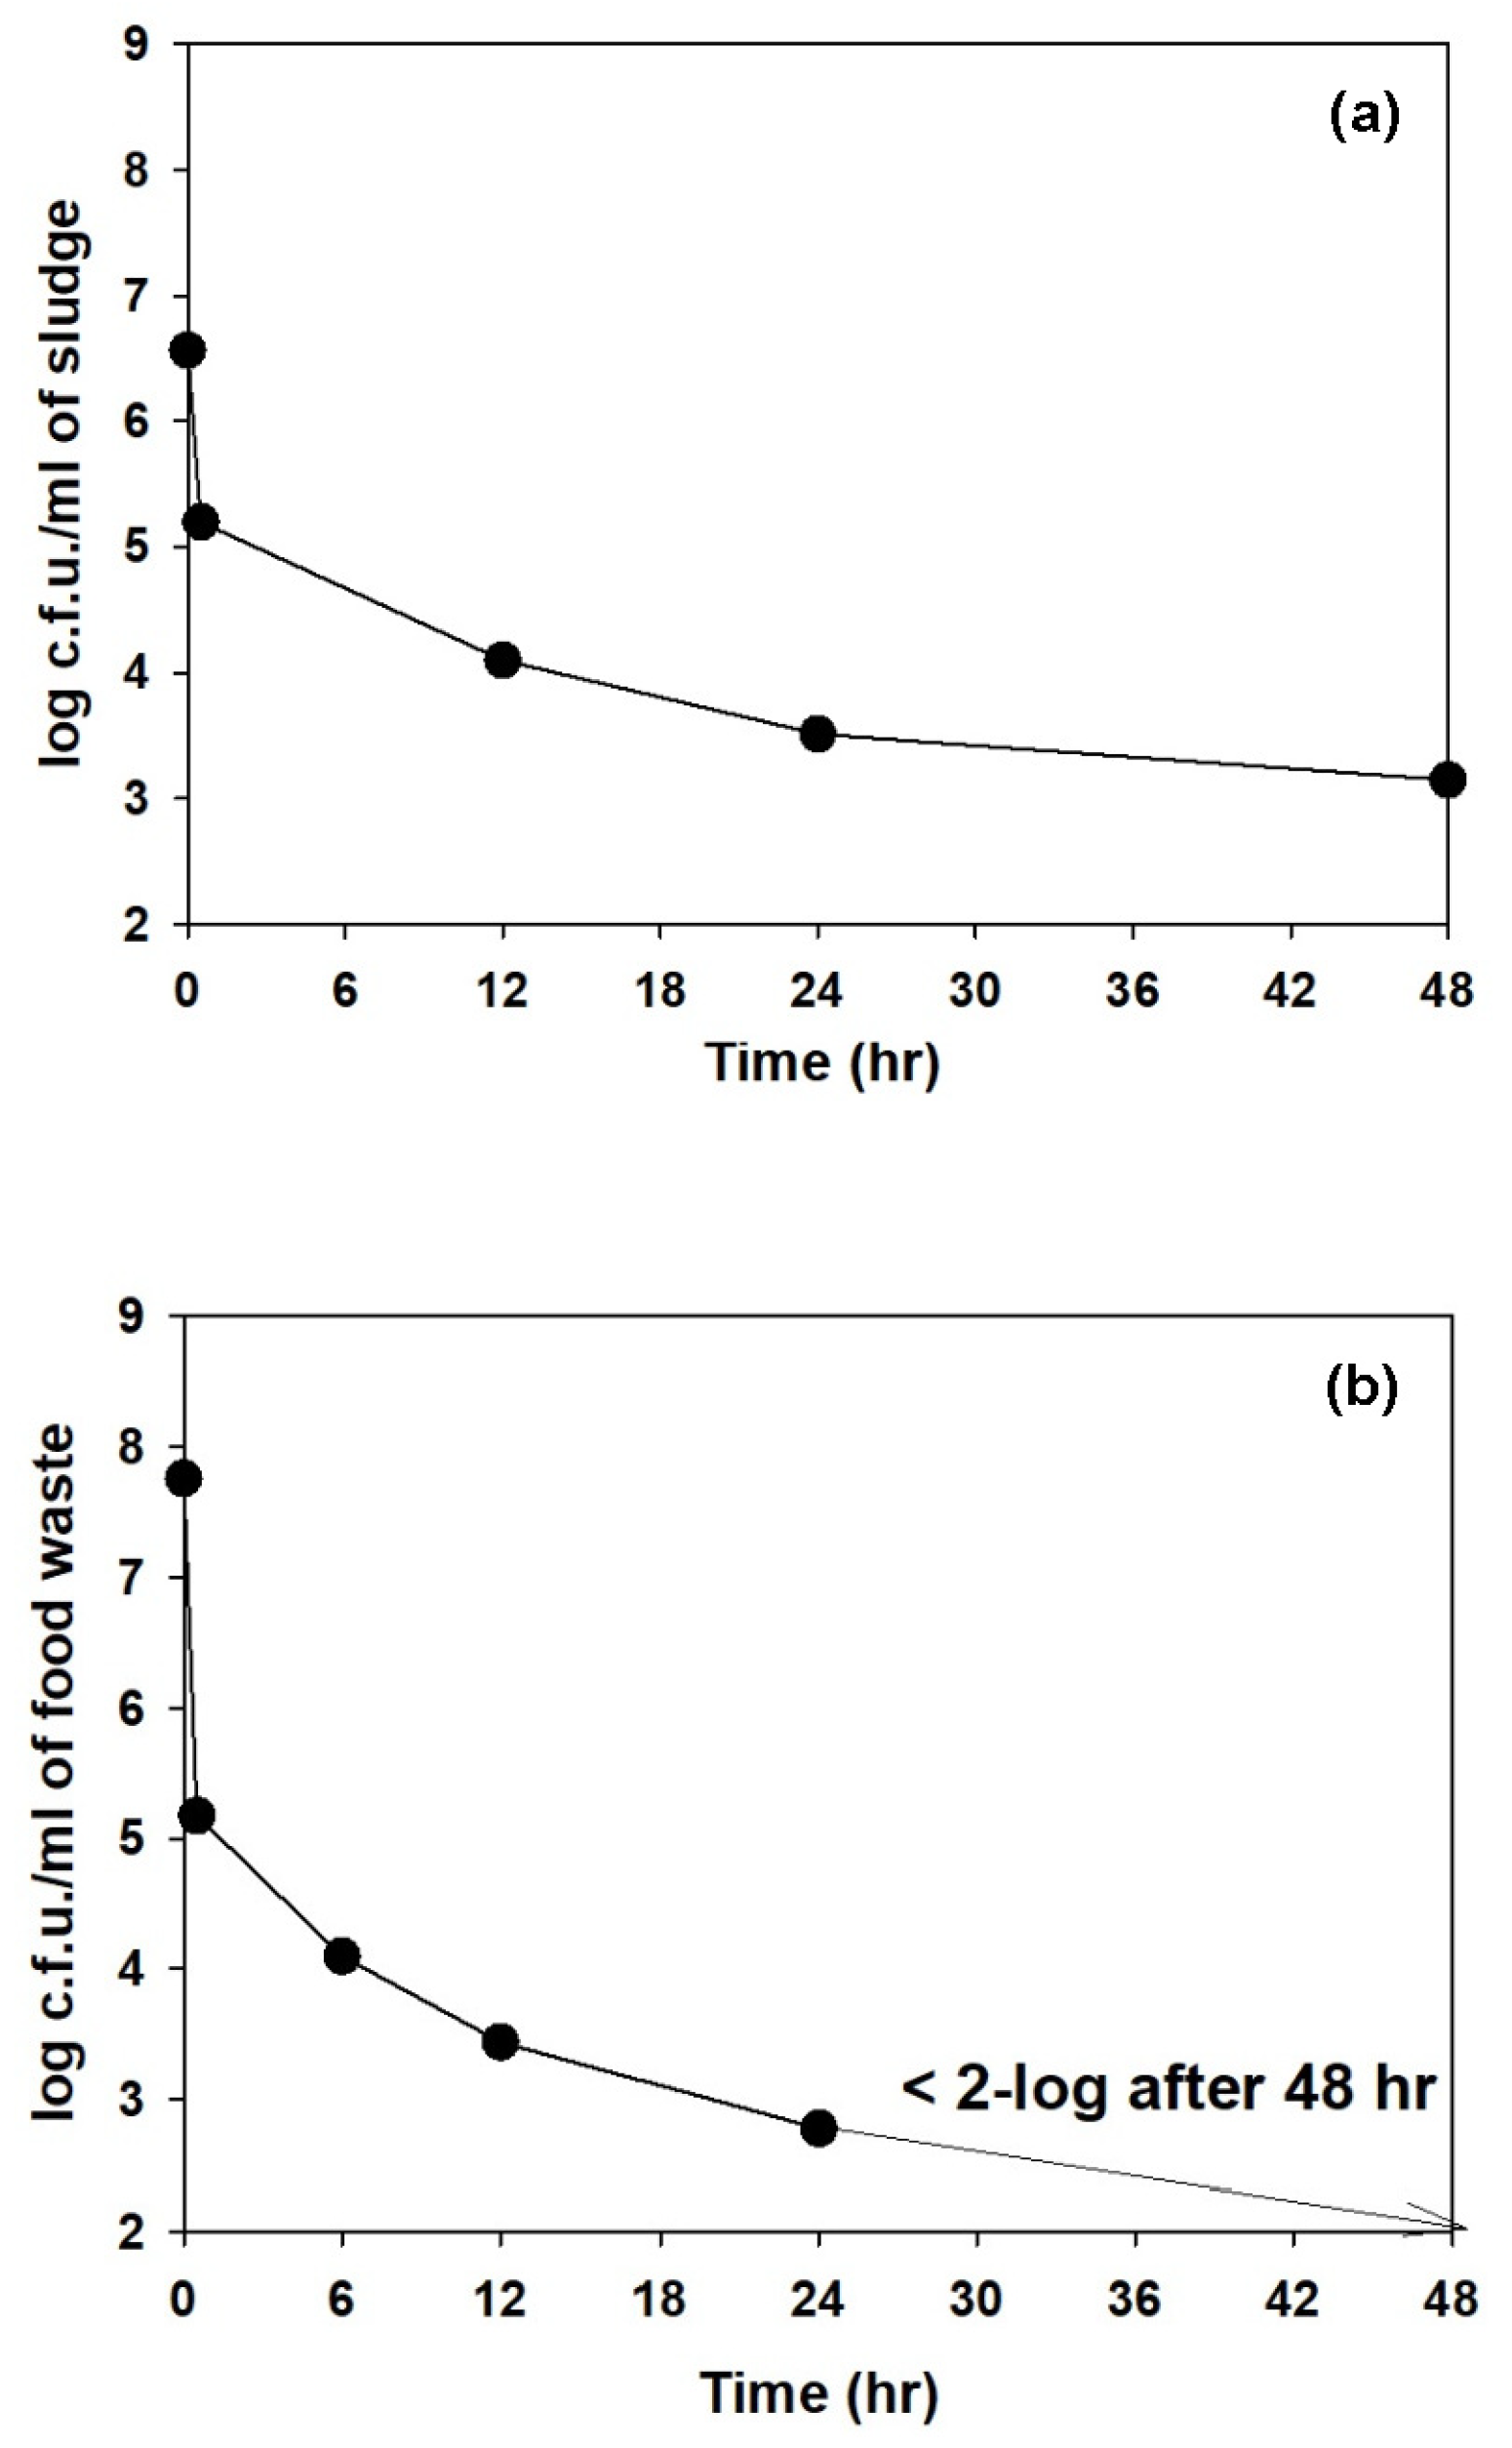
3.1. Effect of Alkaline Treatment on Solubilization and Disinfection

Four initial pH values, 11.5, 12.0, 13.0, and 13.5, were assessed to establish an optimum alkaline treatment condition for the solubilization of sludge. KOH amounts of 60.1 meq/L (pH 11.5), 74.5 meq/L (pH 12.0), 120 meq/L (pH 13.0), and 312.3 meq/L (pH 13.5) were added to adjust the initial pH values. As shown in Figure 1, a higher initial pH value resulted in higher COD solubilization and less pH drop. The COD solubilization increased to 7.8, 29.4, 46.6, and 63.4% at the initial pH values of 11.5, 12.0, 13.0, and 13.5, respectively. However, the soluble to total carbohydrate ratio decreased remarkably at the initial pH of 13.5. As carbohydrate is one of the preferred carbon sources for fermentative hydrogen production [18], pH 13.0 was regarded as the optimum alkaline treatment condition of SS for hydrogen production. This was also validated by the higher soluble to total protein ratio at the initial pH of 13.0 than that at 13.5, given that protein is one of the important sources for a balanced carbohydrate to protein ratio, which increases hydrogen production [1,2]. Moreover, in the case of FW (Figure 2), the experiment was performed only at the initial pH of 13.0 with the addition of 264.3 meq KOH/L. The pH was maintained above 12.5 during the experiment. Results showed that the COD solubilization increased to 31.4%, which was less than that for SS.
As shown in Figure 3, alkaline treatment was also effective in disinfecting SS and FW. The bacterial counts of SS and FW dropped rapidly at the beginning of the reactions with KOH. Subsequently, the bacterial counts of alkaline-treated SS and FW decreased at approximately 3.5-log and beyond 7.8-log (CFU, colony-forming unit), respectively, after 48 h. As Clostridia species are known to produce spores to survive in extreme environmental conditions [23], alkaline conditions successfully inactivate non-spore-forming bacteria thus the selection of spore-forming bacteria (such as H2-producing Clostridia species) is possible.

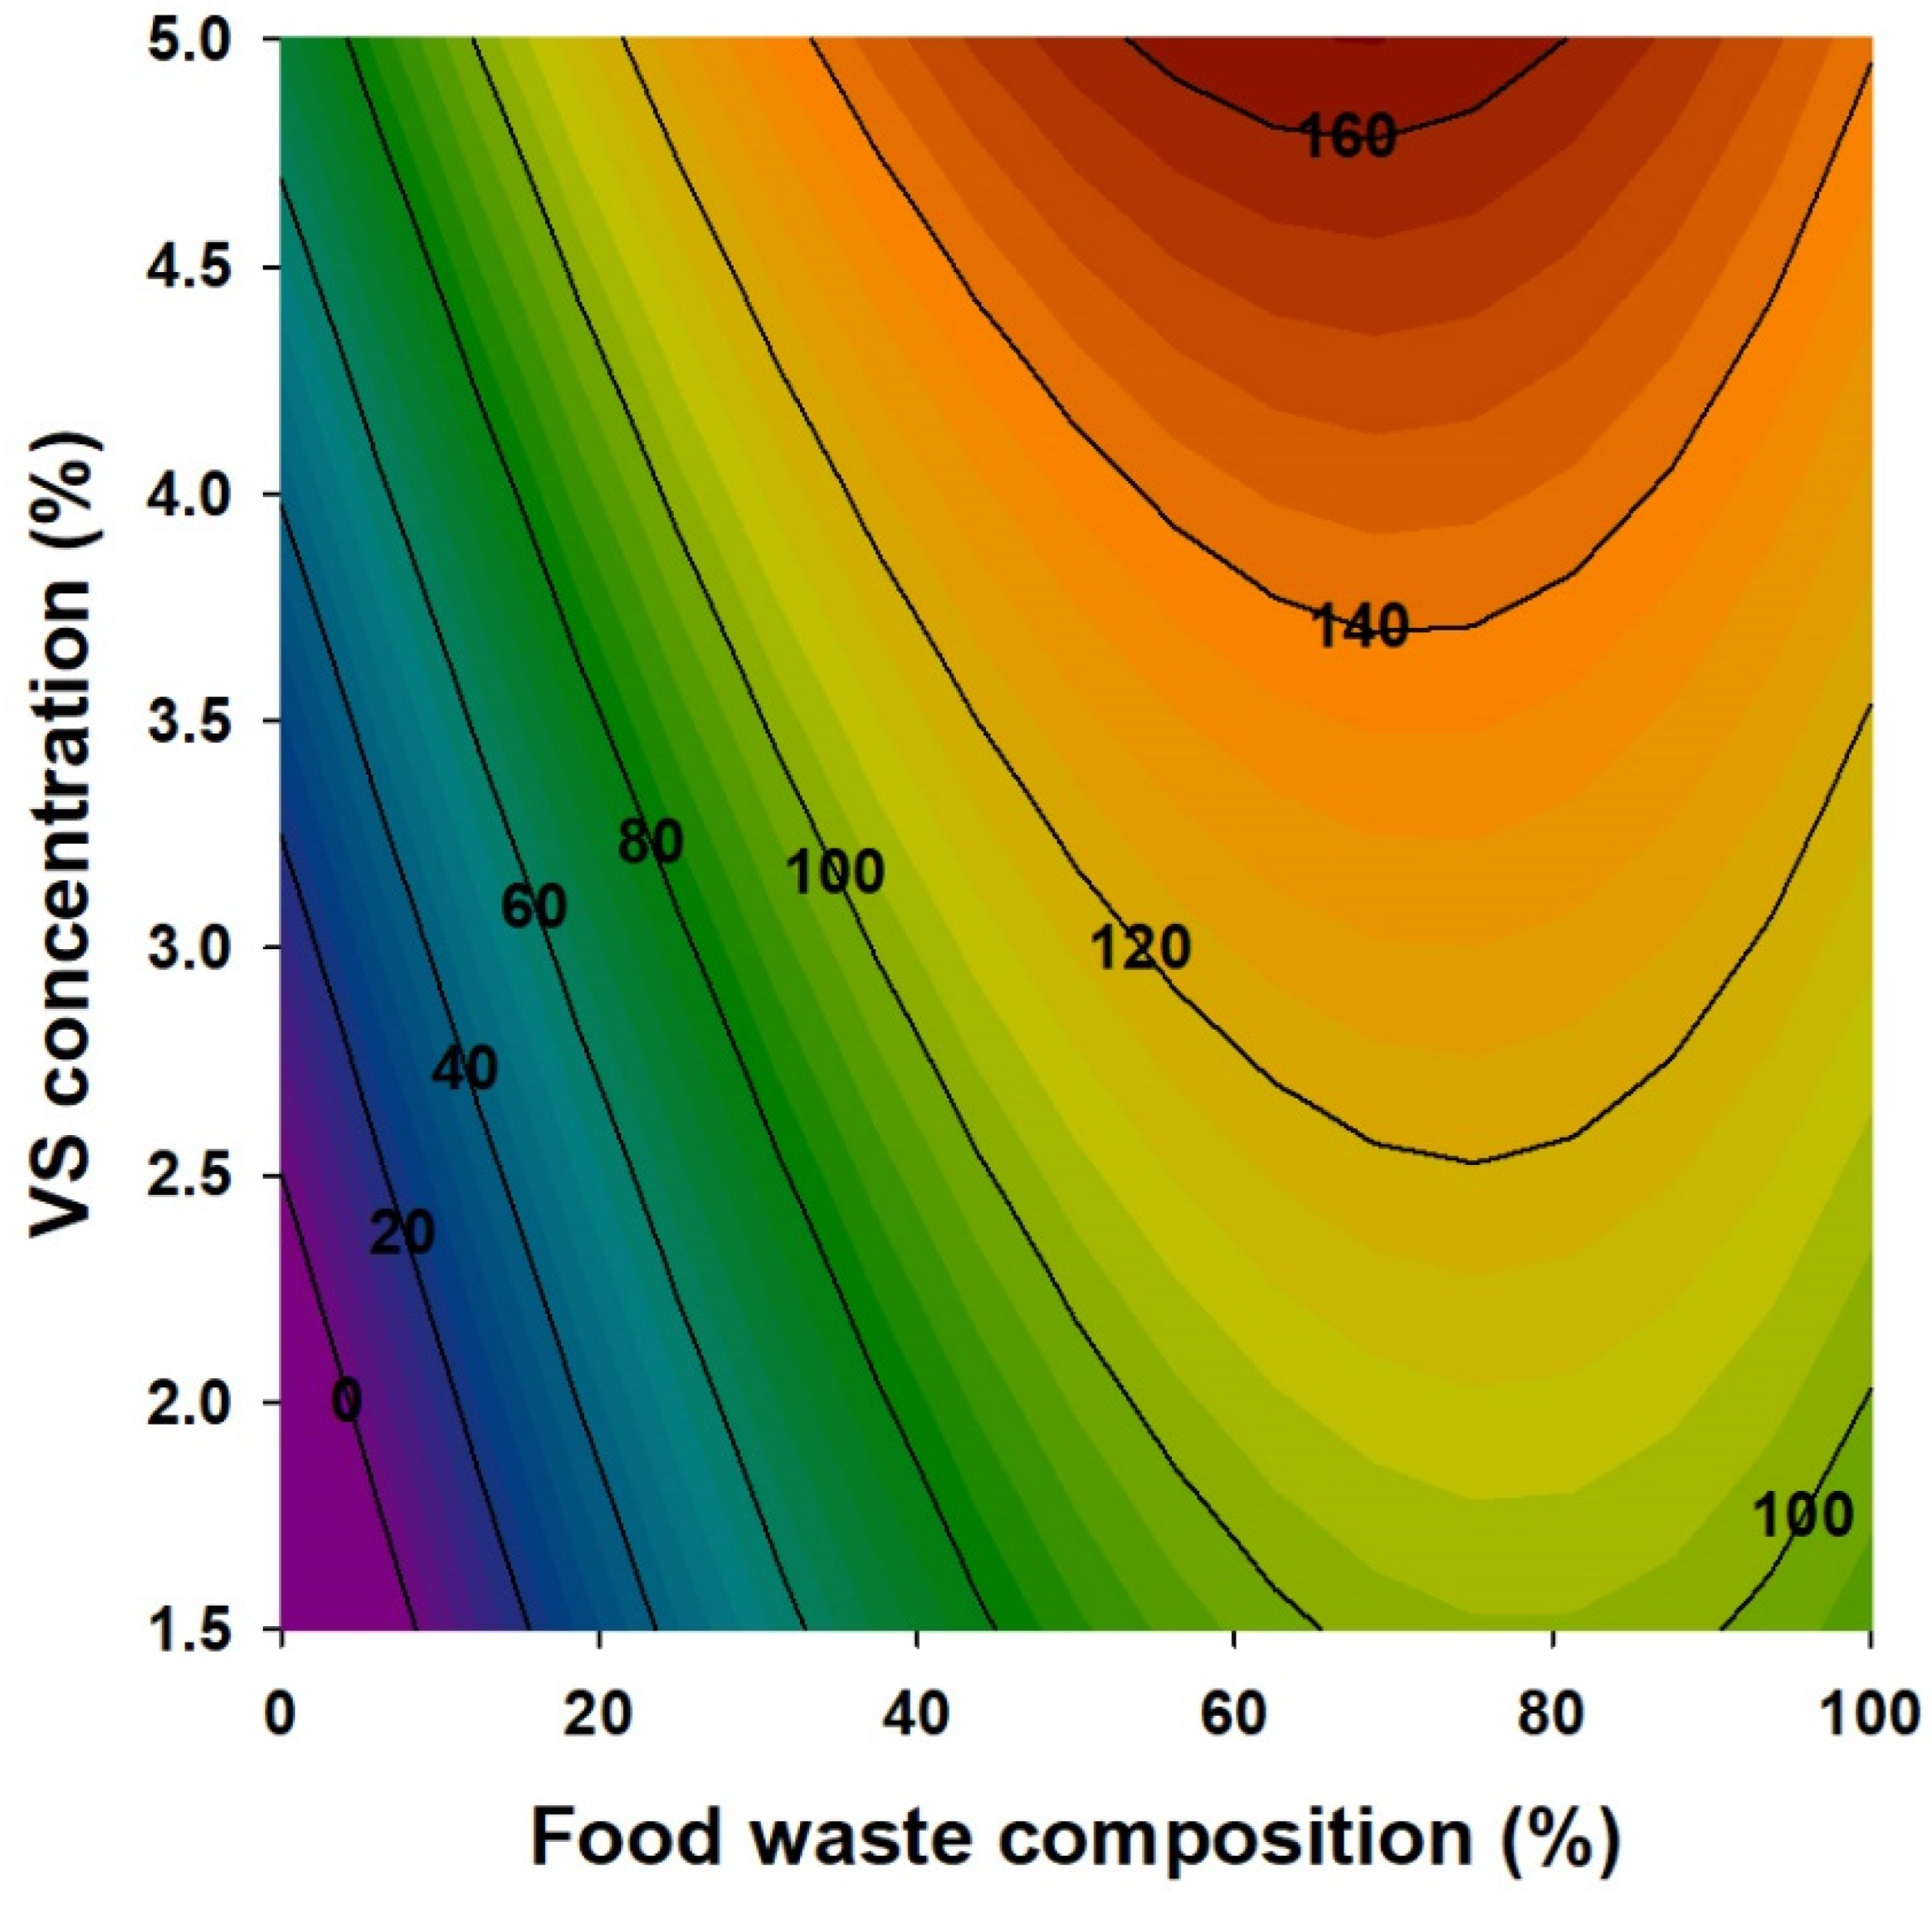
3.2. Enhanced Fermentation of Alkaline-Treated FW and SS for Hydrogen Production

Batch tests of 17 different conditions were performed to determine the optimum VS concentration and FW to SS mixing ratio (Table 2). The trends of cumulative hydrogen production curves were regressed by applying the modified Gompertz equation [24]. Table 2 summarizes the obtained kinetic parameters of the overall hydrogen production potential (Ps) and the specific hydrogen production rate (Rs). For all the experiments, we found that the correlation coefficient R2 was greater than 0.99 (Table 2). Possibly due to the high percentage of energy-carrying molecules such as polysaccharides, proteins, and lipids, SS must be an abundant source for sustainable energy production. Compared to carbohydrate-rich substrates, however, SS exhibits a lower potential for hydrogen production [29,30]. Our results conform to these observations. When SS (FW:MSW = 0:100) was the sole substrate, hydrogen production was not observed (Table 2).
Rs (H2 mL/g VSS/h) obtained from the regression can systematically evaluate the relationship between FW composition ( x ) and VS concentration ( y ), and the following equation (Equation (5)) was generated by using Equation (4):
R s = 64.9237 + 3.5378 x + 25.1458 y 0.014 x 2 + 0.3149 y 2 0.1363 x y ( R 2 = 0.89 , p < 0.0001 )
Analysis of the variance (ANOVA) is tabulated in Table 3. The calculated Fisher value (F =18.22) and a probability value (p) of <0.0001 in ANOVA demonstrate that the regression model was significant. Generally, if the p value < 0.05, it indicates that the obtained parameter is statistically significant, which means the suggested equation may accurately predict the hydrogen production rate. It was observed from Equation (5) that FW composition (p = 0.0002) was the most significant parameter of the model. FW composition must have a complicated effect on the hydrogen production rate since the square term of FW composition also shows statistical significance (p = 0.0006). However, VS concentration presents relatively low significance (p > 0.05) implying little impact on the hydrogen production rate [13].
The maximum Rs was 163.8 mL H2/g VSS/h at a VS concentration of 5.0% and FW composition of 62.5% (Figure 4). We found that the addition of alkaline-treated SS increased the Rs. In some cases, a high Rs of 147.4 mL H2/g VSS/h (i.e., 90% of the maximum Rs) was achieved when a higher composition of SS than that of FW was used. The maximum rate in this study was 1.47 times higher than that in previous research using similar SS and FW without any pretreatment [13]. These results indicate that alkali pretreatment is a suitable option to increase biodegradability and supply temporary inhibitory conditions for hydrogen-producing bacteria against other types of bacteria [20]. Additionally, the SS, a protein-rich waste, was beneficial in increasing the performance of DF. Optimum nitrogen sources and some inorganic materials from alkaline-treated SS could result in a higher metabolic rate, resulting in higher Rs [16,31]. In this study, the optimum C/N ratio was 1.8 g carbohydrate-COD/g protein-COD, and the C/N ratios of FW and SS were 2.25 and 0.23 g carbohydrate-COD/g protein-COD, respectively.
Unlike Rs, Ps (mL H2/g VS) increased as FW composition increased. The obtained Ps were subjected to response surface analysis, and the following equation (Equation (6)) was generated:
P S = 59.6055 + 40.6782 x + 1.1555 y 7.2369 x 2 + 0.0042 y 2 0.0108 x y R 2 = 0.87 , p = 0.0002 < 0.05
Figure 5 illustrates Ps contour lines and the ANOVA analysis is shown in Table 4. In particular, SS exhibited relatively low hydrogen production potential due to low carbohydrate content. When SS content was higher than FW content, hydrogen production potential was 0–35.9 mL H2/g VS (Table 2).
Ps increased as FW composition increased owing to the high carbohydrate content and the easily hydrolyzable nature of this waste [3]. Maximum Ps was 152.1 mL H2/g VS at VS concentration of 2.8% and FW composition of 100%, which was higher than those reported in most previous studies that employed serum bottle tests and organic wastes (40.0–122.9 mL H2/g VS) [13,31,32,33].
As previously reported, hydrogen production from alkaline-treated SS as a sole substrate is challenging [10,19]. By contrast, in this study, alkaline-treated FW as the sole substrate proved efficient for hydrogen production. Carbohydrate from FW was considered as the main carbon source for hydrogen production. Figure 6 shows the contour lines of hydrogen production per carbohydrate concentration (COD basis) of FW; a decrease in hydrogen production (solid line) occurred at high carbohydrate concentration (dashed line). The following expression for the hydrogen production per carbohydrate concentration of FW was derived and the model equation presents sufficient statistical significance based on ANOVA (Table 5):
( Hydrogen   production   based   on   FW   carbohydrat e added ) = 78.3981 + 3.4399 x + 62.9690 y 0.0160 x 2 12.9229 y 2 0.0047 x y ( R 2 = 0.78 , p = 0.0021 < 0.05 )
The decrease in hydrogen production (solid line) at high carbohydrate concentration (dashed line) shows that an extremely high carbohydrate concentration inhibited hydrogen production. Hydrogen production at high feedstock concentration would be economical. However, problems may exist with product and/or substrate inhibition at these high concentrations. Substrate concentrations higher than the optimum concentration may result in inhibitory effects through a drop in pH, production of acids, or increase in hydrogen partial pressures [34]. Additionally, high substrate concentrations may cause substrate inhibition of microbial activity [35].

4. Conclusions

In this study, experiments were performed to evaluate the optimum substrate condition for DF and potential hydrogen production from alkali-pretreated FW and SS at various VS concentrations and FW to SS mixing ratios. The biodegradability of FW and SS was enhanced after pretreatment with KOH.
Among various initial pH conditions, the initial pH of 13.0 exhibited the maximum soluble carbohydrate and protein concentrations of 69 and 70%, respectively. Therefore, the initial pH of 13.0 was selected as the optimum alkali pretreatment condition for hydrogen production. Furthermore, the bacterial counts of FW and SS decreased at approximately 3.50-log and beyond 7.80-log (CFU), respectively, indicating that alkaline pretreatment was effective for disinfection and solubilization of organic wastes.
Empirical equations for hydrogen production were obtained through response surface methodology. The maximum Rs of 163.8 mL H2/g VSS/h was obtained at a VS concentration of 5.0% and FW composition of 62.5% (37.5% of SS). We established that the addition of SS to FW could enhance Rs due to a balanced carbohydrate to protein ratio, resulting in a higher hydrogen production rate, with maximum Ps of 152.1 mL H2/g VS at a VS concentration of 2.8% and FW composition of 100%.

Funding

This work was supported by the program of Future Hydrogen Original Technology Development (No. 2022M3I3A1081850), through the National Research Foundation of Korea (NRF), funded by the Korean government (Ministry of Science and ICT (MSIT)).

Data Availability Statement

The data presented in this study are available on request from the corresponding author.

Conflicts of Interest

The authors declare no conflict of interest.

References

  1. van der Spek, M.; Banet, C.; Bauer, C.; Gabrielli, P.; Goldthorpe, W.; Mazzotti, M.; Munkejord, S.T.; Røkke, N.A.; Shah, N.; Sunny, N. Perspective on the hydrogen economy as a pathway to reach net-zero CO2 emissions in Europe. Energy Environ. Sci. 2022, 15, 1034–1077. [Google Scholar] [CrossRef]
  2. Moreno-Andrade, I.; Berrocal-Bravo, M.J.; Valdez-Vazquez, I. Biohydrogen production from food waste and waste activated sludge in codigestion: Influence of organic loading rate and changes in microbial community. J. Chem. Technol. Biotechnol. 2023, 98, 230–237. [Google Scholar] [CrossRef]
  3. Yun, Y.-M.; Lee, M.-K.; Im, S.-W.; Marone, A.; Trably, E.; Shin, S.-R.; Kim, M.-G.; Cho, S.-K.; Kim, D.-H. Biohydrogen production from food waste: Current status, limitations, and future perspectives. Bioresour. Technol. 2018, 248, 79–87. [Google Scholar] [CrossRef] [PubMed] [Green Version]
  4. Megía, P.J.; Vizcaíno, A.J.; Calles, J.A.; Carrero, A. Hydrogen Production Technologies: From Fossil Fuels toward Renewable Sources. A Mini Review. Energy Fuels 2021, 35, 16403–16415. [Google Scholar] [CrossRef]
  5. Ewan, B.C.R.; Allen, R.W.K. A figure of merit assessment of the routes to hydrogen. Int. J. Hydrogen Energy 2005, 30, 809–819. [Google Scholar] [CrossRef]
  6. Qyyum, M.A.; Ismail, S.; Ni, S.-Q.; Ihsanullah, I.; Ahmad, R.; Khan, A.; Tawfik, A.; Nizami, A.-S.; Lee, M. Harvesting biohydrogen from industrial wastewater: Production potential, pilot-scale bioreactors, commercialization status, techno-economics, and policy analysis. J. Clean. Prod. 2022, 340, 130809. [Google Scholar] [CrossRef]
  7. Yaashikaa, P.R.; Keerthana Devi, M.; Senthil Kumar, P. Biohydrogen production: An outlook on methods, constraints, economic analysis and future prospect. Int. J. Hydrogen Energy 2022, 47, 41488–41506. [Google Scholar] [CrossRef]
  8. Akhlaghi, N.; Najafpour-Darzi, G. A comprehensive review on biological hydrogen production. Int. J. Hydrogen Energy 2020, 45, 22492–22512. [Google Scholar] [CrossRef]
  9. Balachandar, G.; Khanna, N.; Das, D. Chapter 6—Biohydrogen Production from Organic Wastes by Dark Fermentation. In Biohydrogen; Pandey, A., Chang, J.-S., Hallenbecka, P.C., Larroche, C., Eds.; Elsevier: Amsterdam, The Netherlands, 2013; pp. 103–144. [Google Scholar]
  10. El-Qelish, M.; Chatterjee, P.; Dessì, P.; Kokko, M.; El-Gohary, F.; Abo-Aly, M.; Rintala, J. Bio-hydrogen Production from Sewage Sludge: Screening for Pretreatments and Semi-continuous Reactor Operation. Waste Biomass Valorization 2020, 11, 4225–4234. [Google Scholar] [CrossRef]
  11. Kim, M.; Yang, Y.; Morikawa-Sakura, M.S.; Wang, Q.; Lee, M.V.; Lee, D.-Y.; Feng, C.; Zhou, Y.; Zhang, Z. Hydrogen production by anaerobic co-digestion of rice straw and sewage sludge. Int. J. Hydrogen Energy 2012, 37, 3142–3149. [Google Scholar] [CrossRef]
  12. Bundhoo, M.A.Z.; Mohee, R. Inhibition of dark fermentative bio-hydrogen production: A review. Int. J. Hydrogen Energy 2016, 41, 6713–6733. [Google Scholar] [CrossRef]
  13. Kim, S.-H.; Han, S.-K.; Shin, H.-S. Feasibility of biohydrogen production by anaerobic co-digestion of food waste and sewage sludge. Int. J. Hydrogen Energy 2004, 29, 1607–1616. [Google Scholar] [CrossRef]
  14. Lertsriwong, S.; Glinwong, C. Newly-isolated hydrogen-producing bacteria and biohydrogen production by Bacillus coagulans MO11 and Clostridium beijerinckii CN on molasses and agricultural wastewater. Int. J. Hydrogen Energy 2020, 45, 26812–26821. [Google Scholar] [CrossRef]
  15. Tian, H.; Li, J.; Yan, M.; Tong, Y.W.; Wang, C.-H.; Wang, X. Organic waste to biohydrogen: A critical review from technological development and environmental impact analysis perspective. Appl. Energy 2019, 256, 113961. [Google Scholar] [CrossRef]
  16. Yang, G.; Wang, J. Biohydrogen production by co-fermentation of sewage sludge and grass residue: Effect of various substrate concentrations. Fuel 2019, 237, 1203–1208. [Google Scholar] [CrossRef]
  17. Barber, W.P.F. Thermal hydrolysis for sewage treatment: A critical review. Water Res. 2016, 104, 53–71. [Google Scholar] [CrossRef]
  18. Han, W.; Yan, Y.; Shi, Y.; Gu, J.; Tang, J.; Zhao, H. Biohydrogen production from enzymatic hydrolysis of food waste in batch and continuous systems. Sci. Rep. 2016, 6, 38395. [Google Scholar] [CrossRef] [Green Version]
  19. Yao, Z.; Su, W.; Wu, D.; Tang, J.; Wu, W.; Liu, J.; Han, W. A state-of-the-art review of biohydrogen producing from sewage sludge. Int. J. Energy Res. 2018, 42, 4301–4312. [Google Scholar] [CrossRef]
  20. Cesaro, A.; Belgiorno, V. Pretreatment methods to improve anaerobic biodegradability of organic municipal solid waste fractions. Chem. Eng. J. 2014, 240, 24–37. [Google Scholar] [CrossRef]
  21. Ahmed, B.; Kumar Tyagi, V.; Kazmi, A.A.; Khursheed, A. New insights into thermal-chemical pretreatment of organic fraction of municipal solid waste: Solubilization effects, recalcitrant formation, biogas yield and energy efficiency. Fuel 2022, 319, 123725. [Google Scholar] [CrossRef]
  22. Mozhiarasi, V. Overview of pretreatment technologies on vegetable, fruit and flower market wastes disintegration and bioenergy potential: Indian scenario. Chemosphere 2022, 288, 132604. [Google Scholar] [CrossRef] [PubMed]
  23. Sinbuathong, N.; Charnnok, B.; Sillapacharoenkul, B.; Sakdaronnarong, C. Preparation of active hydrogen-producing cultures from palm oil mill sludge for biohydrogen production system. Int. J. Hydrogen Energy 2021, 46, 29100–29107. [Google Scholar] [CrossRef]
  24. Mahata, C.; Dhar, S.; Ray, S.; Das, D. Effect of thermal pretreated organic wastes on the dark fermentative hydrogen production using mixed microbial consortia. Fuel 2021, 284, 119062. [Google Scholar] [CrossRef]
  25. Rice, E.W.; Baird, R.B.; Eaton, A.D.; Clesceri, L.S. Standard Methods for the Examination of Water and Wastewater; American Public Health Association: Washington, DC, USA, 2012. [Google Scholar]
  26. Dubois, M.; Gilles, K.; Hamilton, J.; Rebers, P.; Smith, F. A colorimetric method for the determination of sugars. Nature 1951, 168, 4265. [Google Scholar] [CrossRef] [PubMed]
  27. Miron, Y.; Zeeman, G.; van Lier, J.B.; Lettinga, G. The role of sludge retention time in the hydrolysis and acidification of lipids, carbohydrates and proteins during digestion of primary sludge in CSTR systems. Water Res. 2000, 34, 1705–1713. [Google Scholar] [CrossRef]
  28. Brown, M.J.; Lester, J.N. Comparison of bacterial extracellular polymer extraction methods. Appl. Environ. Microbiol. 1980, 40, 179–185. [Google Scholar] [CrossRef] [Green Version]
  29. Guo, L.; Lu, M.; Li, Q.; Zhang, J.; She, Z. A comparison of different pretreatments on hydrogen fermentation from waste sludge by fluorescence excitation-emission matrix with regional integration analysis. Int. J. Hydrogen Energy 2015, 40, 197–208. [Google Scholar] [CrossRef]
  30. Xiao, B.; Liu, J. Biological hydrogen production from sterilized sewage sludge by anaerobic self-fermentation. J. Hazard. Mater. 2009, 168, 163–167. [Google Scholar] [CrossRef]
  31. Shen, M.-Y.; Torre, M.; Chu, C.-Y.; Tratzi, P.; Carnevale, M.; Gallucci, F.; Paolini, V.; Petracchini, F. Green biohydrogen production in a Co-digestion process from mixture of high carbohydrate food waste and cattle/chicken manure digestate. Int. J. Hydrogen Energy 2022, 47, 40696–40703. [Google Scholar] [CrossRef]
  32. Wang, W.; Xie, L.; Chen, J.; Luo, G.; Zhou, Q. Biohydrogen and methane production by co-digestion of cassava stillage and excess sludge under thermophilic condition. Bioresour. Technol. 2011, 102, 3833–3839. [Google Scholar] [CrossRef]
  33. Zhao, M.; Liu, Z.; Xu, J.; Liu, H.; Dai, X.; Gu, S.; Ruan, W. Dosing effect of nano zero valent iron (NZVI) on the dark hydrogen fermentation performance via lake algae and food waste co-digestion. Energy Rep. 2020, 6, 3192–3199. [Google Scholar] [CrossRef]
  34. Eker, S.; Sarp, M. Hydrogen gas production from waste paper by dark fermentation: Effects of initial substrate and biomass concentrations. Int. J. Hydrogen Energy 2017, 42, 2562–2568. [Google Scholar] [CrossRef]
  35. Bundhoo, M.A.Z.; Mohee, R.; Hassan, M.A. Effects of pre-treatment technologies on dark fermentative biohydrogen production: A review. J. Environ. Manag. 2015, 157, 20–48. [Google Scholar] [CrossRef] [PubMed]
Figure 1. Solubilization of sewage sludge: (a) pH variation, (b) COD solubilization, (c) soluble carbohydrate/total carbohydrate, and (d) soluble protein/total protein.
Energies 16 03281 g001
Figure 2. Solubilization of food waste: (a) pH variation, (b) COD solubilization, (c) soluble carbohydrate/total carbohydrate, and (d) soluble protein/total protein.
Energies 16 03281 g002
Figure 3. Effect of disinfection at pH 13: (a) Sewage sludge, (b) food waste.
Energies 16 03281 g003
Figure 4. Contour lines of specific hydrogen production rate (Rs, mL H2/g VSS/h) against volatile solid (VS) concentration and food waste composition.
Energies 16 03281 g004
Figure 5. Contour lines of hydrogen production potential (Ps, mL H2/g VS) against food waste composition and volatile solid (VS) concentration.
Energies 16 03281 g005
Figure 6. Contour lines of hydrogen production based on food waste carbohydrateadded (mL H2/g food waste carbohydrateadded) against food waste composition and volatile solid (VS) concentration (solid line); contour lines of carbohydrateadded concentration (COD basis) against food waste composition and VS concentration (g carbohydrate-COD/L) (dashed line).
Energies 16 03281 g006
Table 1. Characteristics of food waste and sewage sludge.
ParameterUnitFood WasteSewage Sludge
Total solids%15.91.5
Volatile solids%15.21.2
Total CODg/L158.419.5
Total carbohydrateg COD/L84.92.0
Total proteing COD/L37.78.7
Total Kjeldahl nitrogeng N/L4.41.0
pH 4.67.5
Table 2. Kinetic parameters of hydrogen production.
VS (%)FW:MSW
(VS Basis)
Carbohydrate
(g/L)
Protein
(g/L)
Rm
(mL/Day)
P
(mL H2)
λ
(Days)
Rs
(mL/g VSS/h)
Ps
(mL/g VS)
R2
1.5100:012.93.4844.7296.00.43113.898.70.999
1.580:2010.95.1590.4 396.8 0.23 79.5132.30.994
1.560:408.86.5715.3 172.2 0.29 96.357.40.999
1.540:606.78.1453.9 92.4 0.29 61.130.80.999
2100:016.54.9805.9 634.8 0.40 108.6158.70.997
280:2014.56.8807.1 552.9 0.28 108.7138.20.997
260:4012.48.7871.2 390.2 0.27 117.497.60.999
240:609.010.8582.8 130.5 0.29 78.532.60.999
20:1003.513.7-- ----
3100:024.87.4717.6 1004.6 0.20 96.7167.30.996
380:20 21.710.2804.0 629.3 0.20 108.3104.90.997
360:4022.812.71075.2 337.8 0.34 150.056.30.998
340:6013.516.1840.4 215.2 0.29 113.235.90.999
30:1005.320.5-- ----
5100:057.512.3964.8 1039.8 0.42 134.6104.00.999
580:2047.816.71320.0 827.7 0.43 184.282.80.997
560:4038.121.11058.4 542.2 0.35 147.754.20.998
Table 3. Analysis of variance for hydrogen production rates.
DF (1)SS (2)MS (3)Fp
Regression532,435.616487.12318.2253<0.0001
Residual113915.343355.9402
Total1636,350.962271.935
(1) the degrees of freedom; (2) the sum of squares; (3) the mean sum of squares.
Table 4. Analysis of variance for hydrogen production potential.
DFSSMSFp
Regression537,269.967453.99314.43920.0002
Residual115678.557516.2325
Total1642,948.522684.283
Table 5. Analysis of variance for hydrogen production based on food waste carbohydrateadded.
DFSSMSFp
Regression554,520.210,904.047.98810.0021
Residual1115,015.391365.035
Total1669,535.594345.974
Disclaimer/Publisher’s Note: The statements, opinions and data contained in all publications are solely those of the individual author(s) and contributor(s) and not of MDPI and/or the editor(s). MDPI and/or the editor(s) disclaim responsibility for any injury to people or property resulting from any ideas, methods, instructions or products referred to in the content.

